400 years of summer hydroclimate from stable isotopes in Iberian trees 1
2
Laia Andreu‐Hayles1,2, Caroline C. Ummenhofer3,*, Mariano Barriendos4,2, Gerhard H. 3
Schleser5,6, Gerhard Helle5, Markus Leuenberger7, Emilia Gutiérrez8 and Edward R. Cook1 4 5 1. Tree‐Ring Laboratory, Lamont‐Doherty Earth Observatory of Columbia University, 6 Palisades, NY, USA. 7 2. Institut Català de Ciències del Clima (IC3), Barcelona, Catalonia, Spain. 8 3. Department of Physical Oceanography, Woods Hole Oceanographic Institution, 9 Woods Hole, MA, USA. 10 4. Department of Modern History, University of Barcelona, Spain. 11 5. Climate Dynamics and Landscape Evolution, German Centre for Geosciences, 12 Potsdam, Germany. 13 6. Research Center Juelich, Institute of Bio‐and Geosciences, Agrosphere (IBG‐3); 14 Juelich, Germany. 15 7. Climate and Environmental Physics, University of Bern, Switzerland. 16 8. Department of Ecology, University of Barcelona, Spain. 17 18 *Corresponding authors: Laia Andreu‐Hayles <[email protected]>, Tree‐Ring 19 Laboratory, Lamont‐Doherty Earth Observatory of Columbia University, 61 Route 9W, 20 Palisades, NY 10964, USA; Caroline C. Ummenhofer <[email protected]>, 21 Department of Physical Oceanography, Woods Hole Oceanographic Institution, Woods 22 Hole, MA, USA; 23
Abstract 24
Tree rings are natural archives that annually record distinct types of past climate variability 25
depending on the parameters measured. Here, we use ring-width and stable isotopes in cellulose 26
of trees from the northwestern Iberian Peninsula (IP) to understand regional summer 27
hydroclimate over the last 400 years and the associated atmospheric patterns. Spatial correlations 28
between tree rings and gridded climate products demonstrate that isotope signatures in the 29
targeted Iberian pine forests are very sensitive to water availability during the summer period, 30
and are mainly controlled by stomatal conductance. Non-linear methods based on extreme events 31
analysis allow for capturing distinct seasonal climatic variability recorded by tree-ring 32
parameters and asymmetric signals of the associated atmospheric features. Moreover, years with 33
extreme high (low) values in the tree-ring records were characterised by coherent large-scale 34
atmospheric circulation patterns with reduced (enhanced) moisture transport onto the 35
northwestern IP. These analyses of extremes revealed that high/low proxy values do not 36
necessarily correspond to mirror images in the atmospheric anomaly patterns, suggesting 37
different drivers of these patterns and the corresponding signature recorded in the proxies. 38
Regional hydroclimate features across the broader IP and western Europe during extreme 39
wet/dry summers detected by the northwestern IP trees compare favourably to an independent 40
multicentury sea level pressure and drought reconstruction for Europe. These independent 41
sources of past climate validate our findings that attribute non-linear moisture signals recorded 42
by extreme tree-ring values to distinct large-scale atmospheric patterns and allow for 400-yr 43
reconstructions of the frequency of occurrence of extreme conditions in summer hydroclimate. 44
Keywords: tree rings, extreme analyses, atmospheric circulation, hydroclimate, Sea Level 46
Pressure (SLP), Old World Drought Atlas (OWDA), Iberian Peninsula 47
48
1 Introduction 49
Located at the westernmost edge of the Mediterranean, the Iberian Peninsula (IP) is exposed to 50
atmospheric phenomena of Mediterranean and North Atlantic origin. Iberian hydroclimate is 51
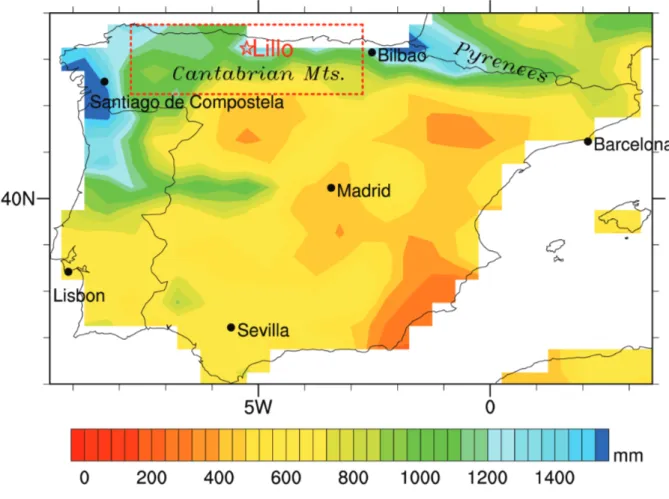
characterised by strong spatiotemporal variability (Fig. 1). While some eastern and southern 52
Iberian regions are semi-arid, precipitation along the northern coast exceeds 1500 mm/yr with 53
dry summers and wet cool seasons. Despite this, drought is a familiar occurrence in the IP: 54
analysing drought evolution during 1910-2000, Vicente-Serrano (2006) found intense and 55
widespread drought episodes in the 1940s, 1950s, 1980s, and 1990s, with higher intensity in 56
the central and western IP than in the northeastern region. Developing technical solutions to 57
recurring and extended water scarcity through infrastructure building, advanced water 58
management, and legislation has a rich and successful history over past centuries in Spain, 59
which is still reflected today in more dams per capita than in any other country in the world 60
(Llamas 2003). This is even more crucial considering the projected subtropical drying in a 61
warming world due to increased subsidence across the region driven by an expansion of the 62
Hadley cell (Lu et al. 2007; Previdi and Liepert 2007; Lu et al. 2009; Cai et al. 2012; 63
Karnauskas and Ummenhofer 2014; Lau and Kim 2015), which is likely to put further strain 64
on limited water resources in the future. The Mediterranean region has been identified as one 65
of the top climate change hot-spots worldwide (Giorgi 2006). Recent changes in IP 66
precipitation and temperature suggest that some of these trends towards increasing aridity are 67
already under way (Giorgi and Lionello 2008; De Luis et al. 2009; Hoerling et al. 2012). 68
More frequent extremes in hydroclimate, such as floods and droughts, are likely in a warming 69
world (Wentz et al. 2007; Trenberth 2011; Hartmann et al. 2013). Records of past hydroclimate 70
variability thus provide an important long-term context for devising management strategies for 71
water resources. Tree rings are natural archives that can provide information about the Earth's 72
past environmental conditions with precise annual resolution. By applying dendrochronological 73
techniques, it is possible to assess the relationships between trees and environmental factors and 74
use this information to estimate climatic conditions before the existence of instrumental records: 75
i.e., generate palaeoclimatic reconstructions. The traditional tree-ring parameters are annual ring-76
width (TRW) and maximum density (Fritts 1976), but annually resolved isotopic chronologies 77
based on tree-rings have increased in number during the last few decades (e.g., McCarroll and 78
Loader 2004; Seftigen et al. 2011; Gagen et al. 2012; Loader et al. 2013; Konter et al. 2014; 79
Labuhn et al. 2014; Naulier et al. 2015; and references therein). European multi-proxy 80
precipitation reconstructions over the last 500 years show distinct spatial, seasonal and temporal 81
patterns, especially between central Europe and the IP, including unstable relationships between 82
regional precipitation and large-scale atmospheric patterns (Cook et al. 2002; Pauling et al. 2006; 83
Vicente-Serrano and López-Moreno 2008). Although drought reconstructions covering Europe 84
(Cook et al. 2015) and specifically focused on the Mediterranean (Nicault et al. 2008) are also 85
available, the quality of the reconstructions is not spatially homogenous across the studied region, 86
in some case having issues over the IP. At a smaller scale, there are several temperature and 87
precipitation reconstructions in Spain based on TRW (Fernández et al. 1996; Manrique and 88
Fernandez-Cancio 2000; Dorado Liñán et al. 2015; Esper et al. 2015; Tejedor et al. 2015) or tree-89
ring density chronologies (Buntgen et al. 2008; Dorado Liñán et al. 2012). Some studies used the 90
stable isotopic signatures of IP tree-rings for climate related studies (Andreu Hayles 2007; 91
Andreu et al. 2008; Planells et al. 2009; Andreu-Hayles et al. 2011; Dorado Liñan et al. 2012; 92
Konter et al. 2014; Dorado Liñán et al. 2015). 93
Climate variability in the northwestern IP is associated with the North Atlantic Oscillation (NAO) 94
(Rodó et al. 1997; Rodriguez-Puebla et al. 1998). The NAO, defined by the pressure difference 95
between the Azores High and the Icelandic Low, determines the strength and position of the 96
westerly flow and thus, the main precipitation patterns across Europe, and to a lesser extent in 97
eastern North America, and Africa (Hurrell 1995). It also impacts fish inventories, agriculture, 98
and hydroelectric production through available water resources (Trigo et al. 2004; López-99
Moreno et al. 2007; Vicente-Serrano and López-Moreno 2008). Although the NAO is considered 100
the dominant mode of interannual variability for European climate, its effect is dominant in 101
winter, as the associated pressure changes during summer are weaker and thus exert less 102
influence on hydroclimate variability (Trigo et al. 2008; Hernández et al. 2015). During summer, 103
storm track activity is reduced and European hydroclimate and in particular heat extremes are 104
often associated with atmospheric blocking situations (Lehmann and Coumou 2015). Links to 105
the Summer North Atlantic Oscillation (SNAO) have been made (Linderholm et al. 2009; Buwen 106
et al. 2013). During a positive SNAO, based on an index of July–August sea level pressure (SLP) 107
variability in the North Atlantic sector, anticyclonic conditions occur over the UK, whereas the 108
Mediterranean area is wet and cloudier (Bladé et al. 2011). 109
Here, we use tree-ring samples from a Pinus sylvestris relict forest (García Antón et al. 1997) 110
located at 1600 m.a.s.l in the Cantabrian range near to the village ‘La Puebla de Lillo’ (herein 111
Lillo) to infer hydroclimate variability for the last 400 years in northwestern Iberia (Fig. 1). 112
Using three different tree-ring parameters from the same chronology: TRW, carbon (δ13C) and 113
oxygen (δ18O) stable isotopes, we applied linear and non-linear methods to determine the 114
climatic signal recorded by these trees. Our findings include significant linkages between distinct 115
tree-ring proxies and regional late spring and summer precipitation associated with specific 116
atmospheric patterns. 117
118
2 Data and methods 119
2.1 The tree-ring chronologies 120
The TRW, δ13C and δ18O data presented here have been previously used in studies with 121
different goals (e.g., Treydte et al. 2007; Andreu et al. 2008; Andreu-Hayles et al. 2011; 122
Saurer et al. 2014; Frank et al. 2015). The TRW series were standardised using the residual 123
method with a 250-yr spline (Cook and Kairiukstis 1990) on power transformation (Cook and 124
Peters 1997). Other standardisation, such as the Signal Free method (Melvin and Briffa 2008) 125
or the Friedman super smooth (Friedman 1984), were explored without leading to large 126
differences among the resulting chronologies. In relation to the isotopic analyses, wood from 127
four trees was pooled year by year (Leavitt and Long 1984; Dorado Liñán et al. 2011). The -128
cellulose was extracted using sodium hydroxide, sodium chlorite and acetic acid. (Loader et al. 129
1997) and was homogenised using an ultrasonic device (Laumer et al. 2009). Stable isotopes 130
ratios are expressed in the delta (δ) notation in per mil (‰) relative to the standards of the 131
Vienna Pee Dee Belemnite (VPDB) for δ13C and the Vienna Standard Mean Ocean Water (V-132
SMOW) for δ18O. δ13C ratios were measured by combusting the cellulose in an elemental 133
analyser (Fisons NA 1500 NC, Fisons Instruments, Milan, Italy) interfaced with an IRMS 134
(Micromass Optima isotope ratio mass-spectrometer, VG Instruments, Manchester, UK) 135
operating in continuous flow mode. Cellulose from spruce (“Fluka1”, Fluka Chemika, Ord.# 136
22181, Lot. # 380099/1 20200; 13C
VPDB= -23.03‰) and graphite powder (“G5”, 20-40µm, 137
purity 99.99%; 13C
VPDB= -21.16‰) were used as laboratory standards for δ13C after 138
calibration against IAEA CH-3 (-24.7‰), IAEA-CH7 (-32.15‰) and USGS24 (-16.04‰). 139
The δ18O values were measured using high-temperature pyrolysis (1350ºC) of cellulose to 140
carbon monoxide in a Thermo Chemical Elemental Analyser (TC/EA) coupled via a ConFlow 141
II open split to the IRMS (Thermo Finnigan Delta Plus XL IRMS). The measurements’ 142
reproducibility was better than 0.1‰ and 0.3‰ for δ13C and δ18O ratios, respectively. The 143
laboratory standards used for 18O were IAEA-C3 cellulose (32.6±0.2‰), IAEA-CH6 sucrose 144
(36.4 ±0.2‰) and Merk cellulose (28.67±0.2‰) after calibration against V-PDB and 145
converted then to V-SMOW by using VSMOW = 1.0415 PDB + 41.5‰ IAEA standards (Borella 146
et al. 1999). In order to remove non-climatic trends from the raw δ13C tree-ring data: we 147
applied (1) the atmospheric correction to avoid disturbances due to the Suess effect (increase 148
in 13C-depleted atmospheric CO2 due to fossil-fuel burning and deforestation since the 149
industrialisation) using the values listed by McCarroll and Loader (2004); (2) the pin 150
correction (McCarroll et al. 2009) to account for the tree ecophysiological response due to 151
higher CO2. There are constant fractionation processes affecting the δ13C signatures due to 152
CO2 diffusion through stomata and carboxylation (by Rubisco during photosynthesis), but 153
other fractionations can also occur due to changes in the environmental conditions. These are 154
the signals sought in this paper. 155
156
2.2 Observational/reanalysis and gridded reconstruction products 157
A series of monthly global gridded observational and reanalysis products were used to assess 158
regional hydroclimate and the associated large-scale atmospheric conditions that give rise to 159
extremes in the tree-ring proxies. The primary variables that we compare directly with the tree 160
directly affect tree growth and physiological processes. However, an important goal of the 162
paper was to assess the large-scale circulation features that give rise to these two variables 163
representing hydroclimate. It is not implied that trees directly record or are sensitive to SLP 164
anomalies; rather the study aims to advance understanding of tree ring proxy reconstructions 165
by gaining indirect information about large-atmospheric patterns in the past by knowing how 166
the trees respond to hydroclimatic variations. 167
At 2.5º horizontal resolution, these include zonal and meridional winds, and specific humidity 168
from the National Centers for Environmental Prediction (NCEP)/National Center for 169
Atmospheric Research (NCAR) reanalysis (NNR; 1948-present; Kalnay et al. 1996; Kistler et 170
al. 2001) and the 2º horizontal resolution 20th Century reanalysis (20CR; 1871-2011; Compo 171
et al. 2011); precipitation at 0.5º horizontal resolution from the Global Precipitation 172
Climatology Centre (GPCC; version 6; 1901-2010; Schneider et al. 2014) and temperature at 173
0.5º resolution from the Climate Research Unit (CRU TS 2.1; 1901-2002; Mitchell and Jones 174
2005). The common analysis period was taken as 1925-2002 (see section below), though 175
results were repeated for the more recent period post-1957 with improved data coverage. 176
Given the robustness of the results, we only show analyses for the longer period 1925-2002. 177
Prior to the instrumental period, we used two 0.5º resolution gridded products: reconstructions 178
of SLP fields from 1500-1999 (Luterbacher et al. 2002) and the Old World Drought Atlas 179
(OWDA), a set of yearly maps of the reconstructed self-calibrating Palmer Drought Severity 180
Index (scPDSI) for the summer season during the Common Era based on tree rings (Cook et al. 181 2015). 182 183 2.3 Analysis approach 184
The calibration period overlapping between the proxies and instrumental data was from 1925 to 185
2002, after excluding the beginning of the 20th century due to continuous extreme low values 186
observed in the TRW chronology. The persistence and magnitude of this disturbance pattern over 187
more than two decade suggest a non-climatic origin. Most of the sampled trees had scars 188
produced by the extraction of torches, an activity that is documented to have occurred in the 189
studied forest from the end of the 19th century to the 1st quarter of the 20th century (Orden 190
Martín 2013). The same analyses performed over the entire possible calibration period (1901-191
2002) show consistent results with the ones presented here, although some lower climatic 192
sensitivity in some of the proxies was observed (results not shown). The time span used for the 193
pre-instrumental or historical period from 1665 to 1900 was determined by the reliable time-span 194
of the TRW chronology starting in 1663 that was assessed by an Expressed Population Signal 195
statistic higher than 0.85 (Wigley et al. 1984). 196
Time-series of climate data for the Lillo region were created as area-average for the domain 197
delimited by the red box (42.25 to 43.75N; 2.75 to 7.75W) shown in Fig. 1, based on the 198
GPCC precipitation (Schneider et al. 2014) and the CRU temperature (Mitchell and Jones 199
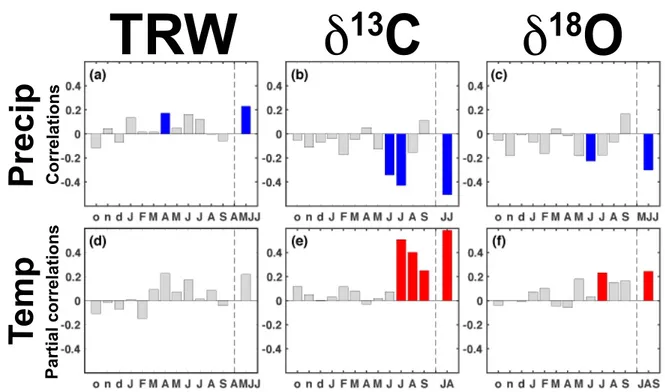
2005) gridded data sets. The initial identification of monthly and seasonal climate signals in 200
the tree-ring data was assessed through correlations (Fig. 2) of the three tree-ring chronologies 201
(Fig. 3) with precipitation, as well as partial correlations with mean temperature data 202
controlling the influence of precipitation using the approach implemented in Seascorr (Meko 203
et al. 2011). 204
An analysis of extremes was used to (1) provide insights on the physiological processes 205
affecting the ring proxies (box plot analyses, Fig. 4); (2) to accommodate non-linear tree-206
ring responses to variations in hydroclimate with regard to the sign of the anomaly and its 207
seasonality (seasonal cycles; Fig. 5); (3) to understand the seasonal large-scale atmospheric 208
mechanisms associated with these years (composite maps; Fig. 6 and 7). As is customary for 209
non-normally distributed variables, such as precipitation, all values in the three tree-ring proxy 210
time-series were ranked and the lowest/highest decile (i.e. extremes) were selected. This led to 211
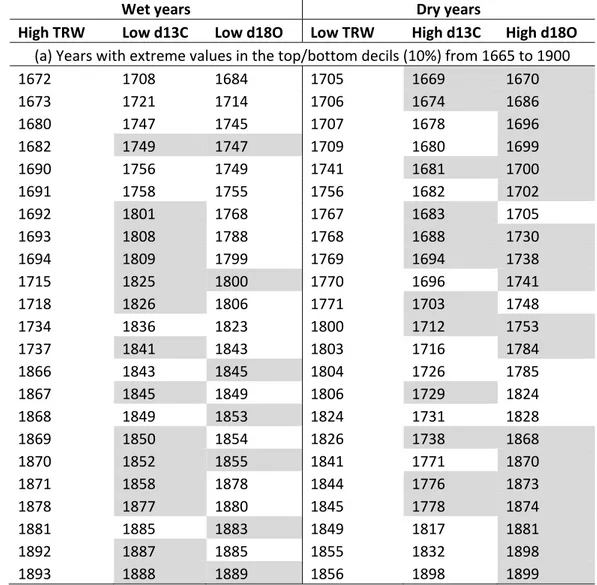
a selection of 8 high and 8 low extreme years for the instrumental period 1925-2002 (Table 1) 212
and a total of 23 high and 23 low extreme years for the historical period 1665-1900 (Table 2) 213
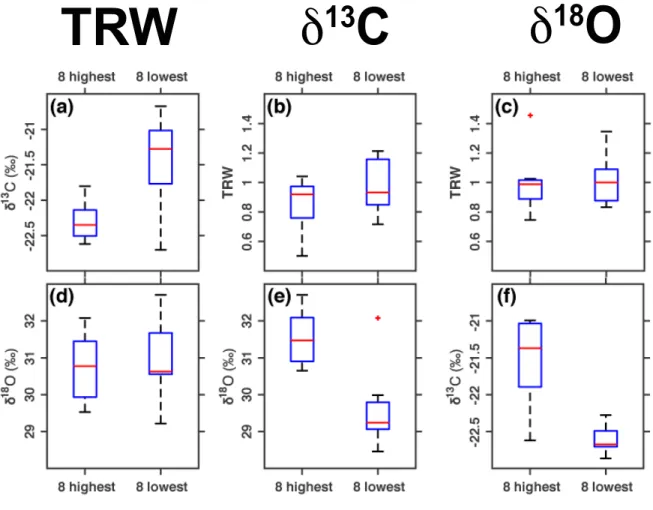
comprising 236 years. All extreme years are shown in Fig. 3 (filled circles) and the associated 214
other proxy values for the extreme years are compared using box-and-whisker plots in Fig. 4. 215
We assessed the characteristics of the seasonal cycle of Lillo precipitation and surface air 216
temperature (SAT) during these 8 years with extreme high/low proxy values for the 217
instrumental period, with the coloured lines indicating the mean seasonal cycle for the three 218
parameters (Fig. 5d-i). To determine whether the mean seasonal cycle during these extreme 219
years differs significantly from average years a boot-strapping method (i.e., Monte Carlo test) 220
was employed: for a particular time-series, 8 random years were selected for the period 1925-221
2002. This was repeated 25,000 times to generate an expected distribution of the seasonal 222
cycle for any given set of 8 years. The grey shading in Fig. 5d-i represents the 90% 223
significance level of this expected distribution for high/low years. Wherever a coloured line 224
lies outside the grey shading, the precipitation or SAT in the extreme years differs 225
significantly from average conditions. 226
Using those same years, composite anomalies (Fig. 6-7) of precipitation, SAT, moisture 227
transport, and SLP were calculated for those months when the seasonal precipitation cycle 228
during extreme years deviates significantly from average rainfall conditions based on all years. 229
A two-tailed t-test was used to determine whether composite anomalies of precipitation, SAT, 230
moisture transport, and SLP were significant at the 90% level from the long-term mean based 231
on all years. 232
The years with extreme values in the palaeo proxy time-series (TRW, δ13C, and δ18O) for the 233
previous centuries were detected by 2 distinct approaches: (a) decile method: 23 high/low 234
extreme proxy years detected as deciles for the period 1665 to 1900 (Fig. 3, filled circles); (b) 235
threshold method: years with proxy values that exceeded a threshold value determined by the 236
lowest of the uppermost decile and the highest of the lowermost decile of the proxy values in the 237
analysis period 1925-2002 (Table 1; horizontal red/blue line in Fig. 3a-c and Fig. 5a-c; empty 238
circles and crosses in Fig. 3). For those high/low extreme proxy years detected by the threshold 239
method throughout the historical period (1665-1900), composite anomalies were calculated for 240
SLP reconstructed fields over the eastern North Atlantic region and Europe (Luterbacher et al. 241
2002) in Fig. 8 and for PDSI based on the Old World Drought Atlas (OWDA; Cook et al. 2015) 242
in Fig. 9. Composites were also calculated for the 8 high/low extreme years for the instrumental 243
period for validating the method for SLP (Fig. 10) and PDSI (Fig. 11). Fig. 12 shows variations 244
in the number of occurrence of years with extreme events per decade obtained in 20-yr sliding 245
windows for the two isotope proxies. The temporal evolution of extreme events is only shown 246
for the sign, for which strong significant deviations in the seasonal cycle of Lillo precipitation 247
were detected (cf. Fig. 5d-f). 248
249
3 Distinct climatic signals in the tree ring proxies 250
The climatic signal recorded by each tree-ring proxy (TRW, δ13C and δ18O) show distinct 251
strength and seasonality (Fig. 2). Tree growth, represented by TRW records, is mildly favoured 252
by wet conditions from April to August (i.e. positive correlation between TRW and 253
precipitation); in contrast the effect of temperature, with the precipitation effect removed, seems 254
to be negligible without a single month with significant correlation. The tree-ring parameter most 255
sensitive to summertime water availability is δ13C. The δ13C records exhibit the highest climate 256
sensitivity with significant negative correlation with June-July precipitation and positive partial 257
correlation with July-August temperatures. The δ18O records exhibit weaker correlations, but 258
similar seasonal sensitivity to δ13C with negative and positive correlations from May to July 259
precipitation and July to September temperatures, respectively (Fig. 2). Therefore, both stable 260
isotopic ratios (δ13C and δ18O) seem to be mainly modulated by changes in moisture during 261
summer time. 262
263
4 Physiological processes related to climate variability 264
The δ13C ratios may be lower (ratios depleted in the heavier isotope 13C) during wet summers 265
because more open stomata lead to more CO2 available in the stomatal chambers. This leads to 266
more discrimination against the heavier isotope, 13C, since the lighter isotope, 12C, is preferred as 267
a substrate for photosynthesis (Farquhar et al. 1982). Dry summers may lead to higher δ13C 268
values (ratios enriched in 13C) since closer stomata allow less CO
2 availability in the stomatal 269
chambers, and thus discrimination against 13C is lower. 270
An enrichment (depletion) of the δ13C isotopic signature due to higher (lower) assimilation rates 271
linked to temperature or light influences on photosynthesis (McCarroll and Pawellek 1998) 272
cannot be initially ruled out. Both physiological processes (i.e. assimilation increase and 273
reduction in stomata conductance) produce the same isotopic signature as a result of 274
reducing/increasing the 12C availability in the stomatal chambers. However, our results show 275
significantly lower and higher δ13C ratios during the years with the 8 highest and 8 lowest 276
growth observed (Fig. 4a), respectively. This suggests a stronger regulation by stomatal 277
variations (e.g. close stomata may lead to higher δ13C and lower TRW) compared to assimilation 278
(e.g. more photosynthesis may lead to higher δ13C and higher TRW). 279
The δ18O values are mainly affected by the original values of the δ18O of the source water and 280
the fractionation processes at the leaf level through stomatal conductance (Barbour 2007), 281
mechanism explained above for δ13C. This leads to lower δ18O ratios (depleted in heavy isotopes, 282
18O) during wet summers and to higher δ18O ratios (enriched in 18O) during dry summers. During 283
cyclonic wet summers, δ18O ratios in cellulose are lower because of low δ18O values in rainfall 284
(source water) and a lowered evaporative enrichment process at the leaf level due to lower 285
vapour pressure due to moist air (Young et al. 2015). In contrast during anticyclonic conditions, 286
the opposite fractionation processes occur. 287
Temperatures may also have an independent effect on precipitation supported by the significant 288
partial correlations with both stable isotopic series after removing the influence of precipitation 289
on the tree-ring proxies. Warm and cold summers may enhance the enrichment (high) and 290
depletion (low) of isotopic ratios, respectively, via changes in vapour pressure at leaf level 291
through stomata conductance. In summary, higher δ13C and δ18O values (~ enriched) document 292
drier and warmer conditions, whereas lower δ13C and δ18O values (~ depleted) are related to 293
wetter and colder conditions. 294
The years detected by the δ13C and δ18O extreme values do not always coincide with 6 out of 8 295
and 3 out of 8 matches for wet years and dry years, respectively (Table 1). Despite this, the box 296
plot analyses (Fig. 4) confirm the coherence between both proxies. During the 8 years with the 297
lowest / highest δ13C ratios (Fig. 4e), the δ18O values were significantly lower and higher, 298
respectively. Likewise during years with the 8 lowest / highest δ18O ratios (Fig. 4f), the δ13C 299
ratios were significantly lower and higher, respectively. A correlation value of 0.58 between the 300
δ13C and δ18O records supports that summer moisture availability is regulating both isotopes at 301
the leaf level. 302
Nevertheless, other environmental factors are also independently modulating each proxy. The 303
lower climatic sensitivity of δ18O compared to δ13C records may be partially due to the 304
contribution of the original values of the source water (Saurer et al. 2002) and fractionation 305
processes occurring in this meteoric water until the fixation of the δ18O in plant tissue (McCarroll 306
and Loader 2004). 307
5 Asymmetric moisture signal in high and low extreme proxy years 308
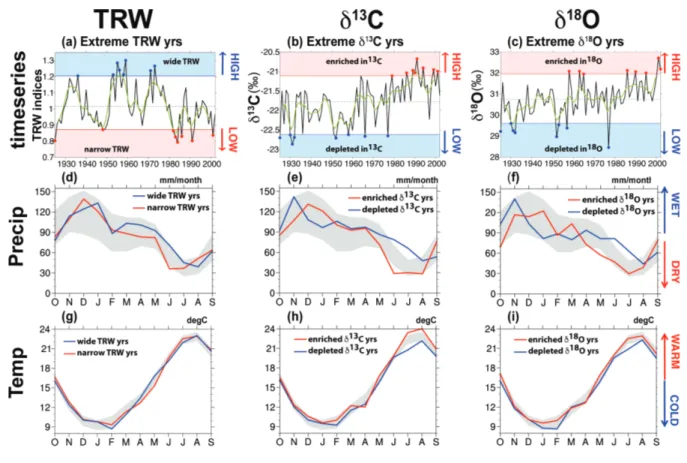
Figure 5 shows the tree-ring series and seasonal cycle for precipitation and temperature for the 309
study site Lillo (red box in Fig. 1) for the instrumental period 1925-2002. Years recording the 310
highest/lowest 10% of the values in each tree-ring record (i.e. deciles) were selected (blue/red 311
filled circles in Fig. 5 for (a) TRW, (b) δ13C, and (c) δ18O), and used to calculate the seasonal 312
cycle in precipitation (d, f) and temperature (g, i). Blue lines illustrate the seasonal cycle for 313
years with high precipitation detected by wide (high) TRW, depleted (low) δ13C and depleted 314
(low) δ18O values. Red lines show the seasonal cycle for years with low precipitation detected 315
by narrow (low) TRW, enriched (high) δ13C and enriched (high) δ18O. Therefore, significantly 316
wetter conditions than average (blue lines outside the grey band) are detected in June by 317
extreme wide TRW values and in June-July by extreme low δ13C and δ18O ratios. In contrast, 318
significantly drier conditions (red lines outside the grey band) are detected in June associated 319
with the narrowest TRW and the highest δ13C, and in May related to extreme high δ18O ratios. 320
For the temperature seasonal cycles (g-i), blue lines indicate that these years exhibit low 321
temperatures in July-August detected by depleted (low) δ13C and in July by depleted (low) 322
δ18O. Red lines indicate warm conditions in July and August for years with enriched (high) 323
δ13C. Extreme wide TRW are significantly related to warm temperatures in April that may 324
favour the onset of the growing season, while narrow TRW seem to be associated, albeit not 325
significantly, with warmer temperatures during June and July. 326
These seasonal cycle analyses indicate that months with significant deviations from average 327
climatic conditions differ between years with extreme high and low proxy values. Thus, timing 328
(years and seasons) of climatic extremes is different for high and low extremes of the same proxy. 329
For instance, in years with extreme high δ13C values (Fig. 5b) significantly drier conditions 330
occurred during June (Fig. 5e), but the wetter conditions detected by the low δ13C value occurred 331
during July-August (Fig. 5e). Overall, climatic sensitivity is seasonally shifted between proxy 332
high/low values: dry conditions are detected to occur earlier in the year in late spring, while wet 333
conditions are found to occur later more focused on the summer months. 334
335
6 Atmospheric patterns associated with dry/wet conditions 336
The months identified by the precipitation seasonal cycle analysis with significant deviations 337
in precipitation from mean conditions are consistent with large-scale atmospheric features 338
described by composite analyses for the same months (Fig. 6-7). Our composite anomaly maps 339
indicate different circulations patterns for high and low extreme years. It should be noted that 340
the composites show anomalies rather than the mean field, so the circulation changes thus 341
relate more to a strengthening or weakening of the westerly onshore moisture transport for 342
example, rather than a complete change in direction and therefore change in source water 343
region. 344
6.1 Wet summer conditions 346
The seasonal temperature and precipitation cycles in years with extreme low δ13C values (Fig. 5b) 347
show significantly colder conditions for July (Fig. 5h) and wetter during June-July (Fig. 5e), 348
respectively. The June-July composites for years with extreme low δ13C show significantly 349
wetter and colder conditions for the Cantabrian range, western Iberia and southwestern France 350
(Fig. 6b,e). This is associated with an enhanced onshore moisture transport from the Atlantic 351
Ocean (Fig. 6h) driven by significant positive SLP anomalies at high latitudes and negative 352
anomalies over Europe (Fig. 6k). Similar patterns are found during years with low δ18O values 353
(Fig. 5c) with significant anomalies in the precipitation and temperature seasonal cycles detected, 354
corresponding to wetter (Fig. 5f) and colder (Fig. 5i) early summer conditions. Composite 355
anomalies for these years during June-July confirm significantly higher precipitation over the 356
northern IP and southern France (Fig. 6c), enhanced moisture transport from the Atlantic (Fig. 6i) 357
and consistent SLP patterns (Fig. 6l), with significantly colder conditions across the IP (Fig. 6f). 358
The composites corresponding to years with wide TRW values associated with anomalous wet 359
conditions for June in the seasonal cycle (Fig. 5d) show higher precipitation along the northern 360
IP (Fig. 6a), associated with coherent moisture transport (Fig. 6g) and SLP patterns (Fig. 6j), as 361
well as colder temperatures over the IP (Fig. 6d). The moisture transport in years with high TRW 362
values shows more local atmospheric features with moisture coming directly from the west (Fig. 363
6g), resulting in local precipitation events at the study site (Fig. 6a). In contrast, moisture 364
transport patterns associated with the low isotopic values (Fig. 6h, i) exhibit more broad-scale 365
anomalous moisture transport features spanning across western Europe and western North Africa 366
that lead to anomalous precipitation over a larger region of the IP and into southern France (Fig. 367
6b, c). These large-scale patterns detected by extreme isotopic values are associated with 368
anomalous high SLP anomalies over Iceland and low SLP anomalies over Europe. 369
370
6.2 Dry late spring-early summer conditions 371
In years with extreme high δ13C values (Fig. 5b) significantly drier conditions occurred during 372
June (Fig. 5e) and warmer conditions during July-August (Fig. 5h). In agreement, composite 373
anomaly maps for June for high δ13C years indicate significant reductions in precipitation over 374
the northwestern IP (Fig. 7b) and positive temperature anomalies over the IP (Fig. 7e), associated 375
with coherent large-scale atmospheric circulation patterns. Anomalously low SLP over Iceland 376
and Greenland and high SLP anomalies over western and southern Europe (Fig. 7k) result in a 377
reduced moisture transport into the IP (Fig. 7h). In years with extreme high δ18O values 378
significantly drier conditions occur in May (Fig. 5f). Accordingly, the associated composite 379
maps for May reveal significant reductions in precipitation over the western IP (Fig. 7c) and 380
positive SAT anomalies across the wider IP and into France (Fig. 7f), associated with coherent 381
large-scale atmospheric circulation patterns. Anomalously low SLP over the North Atlantic and 382
high SLP over Europe (Fig. 7l) result in a reduced moisture transport into the IP (Fig. 7i). While 383
moisture transport composites for high isotopic years (Fig. 7h, i) share again very similar 384
transport patterns, moisture advection detected by low TRW values (Fig. 7g) indicates a 385
particular circulation pattern associated with positive anomalies over Iceland (Fig. 7j), warmer 386
conditions over the central and southern IP (Fig. 7d) and drier conditions over the Pyrenees, but 387
not over Lillo where the trees are located (Fig. 7a). 388
389
7 Hydroclimate in the pre-instrumental period 390
Seasonal composites computed for the period 1665 to 1900 using the SLP gridded product 391
(Luterbacher et al. 2002) and the Old World Drought Atlas (Cook et al. 2015) corroborated the 392
detection of wet/dry years in the pre-instrumental period. Table 2 shows the extreme years 393
detected using the two approaches (decile and threshold method). The composite analyses using 394
years from both approaches led to similar results. Thus, herein we just show results derived from 395
the threshold method. 396
The SLP composites computed using years with high TRW (Fig. 8a), low δ13C (Fig. 8b) and low 397
δ18O (Fig. 8c) represent SLP patterns that are consistent with wet conditions in the IP. In contrast, 398
low TRW (Fig. 8d), high δ13C (Fig. 8e) and high δ18O (Fig. 8f) show SLP patterns mostly 399
associated with dry conditions over the IP. Overall, pre-instrumental SLP composites (Fig. 8) 400
compare well with SLP instrumental observations (Fig. 7, 8 and 10), mainly showing low and 401
high pressure anomalies over Europe during wet and dry events, respectively. More specifically, 402
the anomalies in the pre-instrumental period resemble the SLP patterns seen during extreme wet 403
summer months well (Fig. 8a-c and 10a-c), while there is less agreement for the dry extremes 404
(Fig. 8d-f and 10d-f). For the latter, the SLP anomalies over central and southern Europe are 405
consistent between the instrumental and pre-instrumental period, while it is the sign and location 406
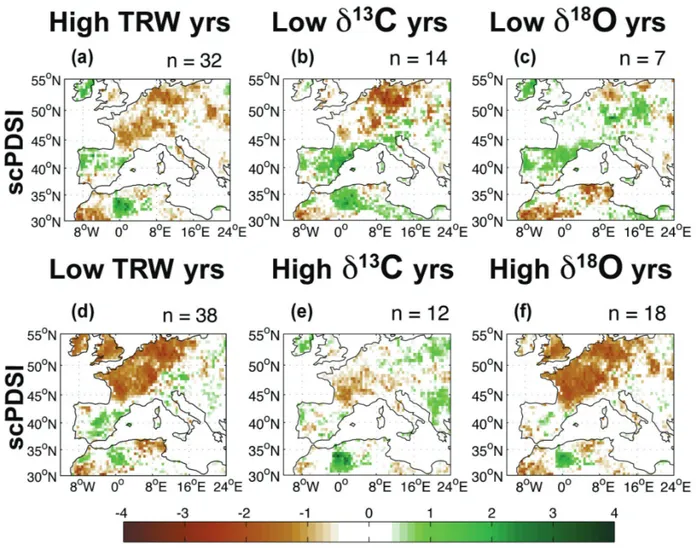
of maximum SLP anomalies over northern Europe that differ. The OWDA composites (Fig. 8) 407
indicate mainly wet conditions (Fig. 8a-c) for years with high TRW and low isotopic ratios, 408
whereas non-significant or slightly dry conditions occur over the Lillo area (Fig. 8d-f) for years 409
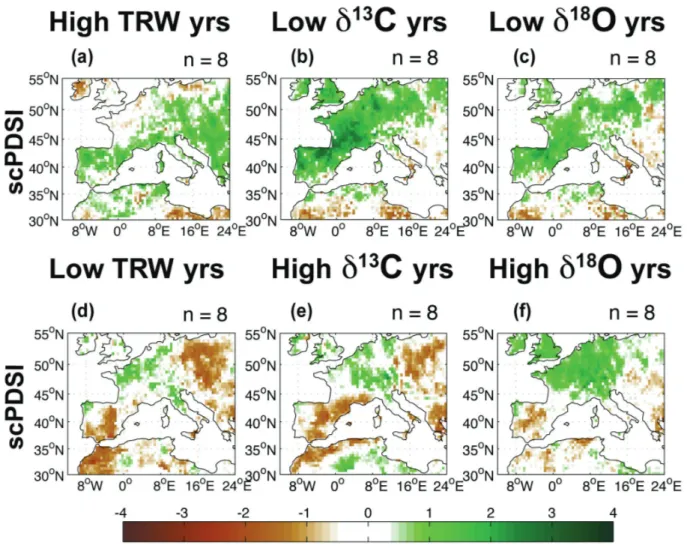
with low TRW and high isotopic ratios. In addition, SLP (1925-1999; Fig. 10) and OWDA 410
(1925-2002; Fig. 11) composites for the instrumental period also show consistent results with the 411
expected dry and wet years depending on low/high extreme values detected in the tree ring 412
proxies. Therefore, these composites corroborate the validity of our approach of using extreme 413
analyses in tree-ring records to explore the occurrence of wet and dry periods prior to the 414
instrumental period. 415
The three tree-ring parameters present distinct sensitivity to summer moisture availability, while 416
high and low extremes exhibit distinct seasonality and an asymmetric moisture signal. Whereas 417
TRW seems to reflect local atmospheric circulation features, stable isotopes share some large-418
scale atmospheric patterns across the IP and western Europe that are of interest for this study in 419
order to infer changes in water availability over the IP more broadly. Here, we propose a novel 420
non-linear method to explore past hydroclimatic variability based on the analysis of extremes in 421
the isotopic series to detect specific years in the past (Table 2), in which the proxies recorded 422
significant deviations from average hydroclimatic conditions. Thus, the most likely occurrence 423
of years with wet/dry conditions is recorded independently by each tree-ring parameter for the 424
last 400 years, allowing for precise seasonality and attribution to related atmospheric patterns. 425
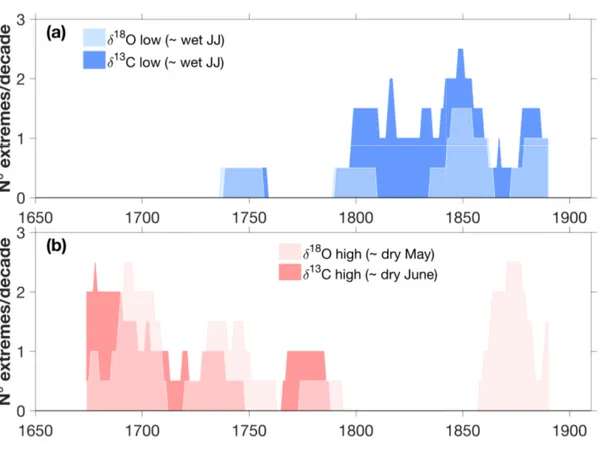
Specifically, the extreme isotopic values respond to summertime/late spring moisture availability: 426
wet June-July (low δ13C and low δ18O), dry June (high δ13C) and dry May (high δ18O). Hence, 427
these isotopic records are used as proxies for informing about northwestern IP hydroclimate 428
variability during late spring/early summer during the period 1665 to 1900 (Fig. 12). 429
A consistent wet period in the second half of the 19th-century is the most prominent feature 430
for the reconstruction of wet summers (Fig. 12a) based on the high occurrence of wet years 431
detected by low values in the isotopic proxies (Table 2). This is reflected in low δ13C values 432
for an extended period of time and even more pronounced in low δ18O centred around 1850. 433
Undoubtedly, indicators of ‘wetness’ (depleted isotope values), agree on the persistent mid-434
19th century pluvial. In addition, any ‘dryness’ indicators (enriched isotope values) are absent 435
during that period as shown in the reconstruction of dry late spring-early summer (Fig. 12b). 436
8 Discussion 437
The persistent mid-19th century pluvial seen in our reconstruction (Fig. 12) is corroborated by 438
higher than usual precipitation levels reported between 1835 and 1875 in Barcelona (northeast 439
IP) based on a recently published high-quality instrumental record (Prohom et al. 2015), with a 440
6-year record of rainy years (~1840s-1850s), unique in the next 160 years (Rodrigo and 441
Barriendos 2008; Camuffo et al. 2013). Moreover, historical documentation also reported a 442
lack of droughts and more frequent and severe catastrophic floods in the mid-19th century in 443
Iberia (Barriendos and Martin-Vide 1998; Llasat et al. 2005; Barriendos and Rodrigo 2006), 444
ending this period of extreme floods with the 1874 Santa Tecla flash flood in Catalonia with 445
more than 500 deaths (Ruiz-Bellet et al. 2015). This 19th century pluvial period is also 446
confirmed by higher frequency of extreme events, such as strong snowstorms, marine storms, 447
atmospheric convective activity and catastrophic floods, reported without a well-marked 448
seasonality (Barriendos and Martin-Vide 1998). This unusual occurrence of wet years, 449
associated with high atmospheric instability, may result from a prevalent meridional 450
circulation associated with cold air aloft, which – upon contact with warm/humid air masses 451
from the Mediterranean – may trigger torrential rainfall over the IP, especially over the 452
northeastern IP (Barriendos and Martin-Vide 1998). These severe atmospheric events may 453
also be associated with marked negative NAO phases and advection of cooler air aloft, 454
producing strong rainfall events during such a ‘cold phase’ across the entire northern IP, and 455
thus being detectable on both sides: northeastern (i.e. Mediterranean) and northwestern (i.e. 456
Atlantic) IP, where our study site is located. 457
This information based on historic data aligns with the synoptic situation reported in our 458
composite maps from the instrumental and pre-instrumental periods. During the instrumental 459
period, low δ13C and δ18O years show circulation anomalies that are consistent with this 460
interpretation with anomalous high SLP over Iceland and lower in the mid-latitudes (Fig. 6k,l), 461
leading to anomalous northwesterly moisture transport from the Atlantic onto the IP (Fig. 6h,i). 462
These circulation features are also associated with anomalous cool SAT across the broader IP 463
(Fig. 6e,f). In the pre-instrumental period, the SLP anomaly pattern associated with low δ18O 464
years during this unusual pluvial period (Fig. 8c) is indicative of the negative NAO conditions 465
suggested above. 466
Nevertheless, not all the atmospheric events occurred synchronically between the Atlantic and 467
the Mediterranean sides of the northern IP. During the late Maunder Minimum (1675-1715) 468
historic data based on Catholic rogation ceremonies from northeastern locations in Catalonia 469
show almost no drought with steady precipitation levels (Barriendos 1997), whereas rogations 470
from locations with a stronger Atlantic influence show drier conditions, such as Toledo and 471
Zamora located in the western IP during spring (Domínguez-Castro et al. 2010) and the Ebro 472
basin (Vicente-Serrano and Cuadrat 2007). This situation may be linked to a prevalent 473
anticyclone associated with cold conditions that may lead to dry weather in the Atlantic region, 474
but to moderate precipitation levels in the Mediterranean side driven by moisture coming from 475
the East. Consistently with the historical findings from the Atlantic side, our late spring-early 476
summer reconstruction (Fig. 12b) indicates higher occurrence of dry years detected by high 477
values in both isotopic records during the late Maunder Minimum. 478
In contrast, other dry periods were co-occurring across the entire northern IP, as for example a 479
drought during 1775-1778, evident in the Ebro basin under a strong Atlantic influence 480
(Vicente-Serrano and Cuadrat 2007). The anomalous climatic conditions extended along the 481
Mediterranean coast and is considered one of the strongest climatic irregularities occurring 482
during the Maldà Oscillation in Catalonia, northeastern IP (Barriendos and Llasat 2003). This 483
period was likely associated with sustained high pressure anomalies over central Europe 484
(Luterbacher et al. 2000), which may have produced a ’blocking’ situation preventing the 485
arrival of low pressure systems from the Atlantic Ocean. In our high δ13C years indicative of 486
dry June conditions, the SLP anomalies (Fig. 7h, Fig. 8e) show comparable features to such a 487
scenario, which could have led to prolonged droughts in the Western Mediterranean Basin, 488
interspersed with flooding events (Barriendos and Llasat 2003). 489
Overall, our isotopic tree-ring reconstruction shows the most noticeable period with frequent 490
dry summers from 1665 to 1700 considering the total extent spanning until 1900. In agreement, 491
historical data from Toledo Cathedral based on rogations reported the most severe droughts 492
occurring between 1576-1800, whereas almost no droughts were found during the 1800-1900 493
period (Dominguez-Castro et al. 2008). That this period displays a lack of droughts agrees 494
with the 19th century pluvial situation described in Fig. 12a. In addition, years with extreme 495
values in the tree-ring proxies (Table 2) concur with some particular years of extreme droughts 496
described by historical documentation, such as the years 1680 (Domínguez-Castro et al. 2010), 497
1753, 1817 or 1824 (Domínguez-Castro et al. 2012). Finally, the drought period detected by 498
the isotopic tree-ring series during the second half of the 19th century is confirmed by 499
historical proxies showing dry conditions for the Ebro basin during the same period and a 500
strong positive NAO index at the end of the 19th and early 20th century (Vicente-Serrano and 501
Cuadrat 2007) and by instrumental records from Barcelona that show a dry spell from 1878 to 502
1919 (Prohom et al. 2015). From 1880 to 1910 extremely low grain production was reported in 503
Spain that led to strong reductions in food availability during the first years of the 20th century 504
and related impacts as social conflict and migrations (Vicens Vives 1985; Blanco et al. 1986). 505
Although starvation and migration are driven by a myriad of phenomena, including political 506
and social factors, the dry period in the second half of the 19th century may have also played a 507
role in this historically known crisis of subsistence and economic migrations due to hunger, 508
which coincided with the famous Galician, and Asturian migration to South America (Ojeda 509
and San Miguel 1985; Gómez Gómez 1996). 510
To summarise, independent sources (natural and historical) of past climate variability validate 511
our findings that attribute the non-linear moisture signals recorded by extreme tree-ring values 512
to distinct large-scale atmospheric patterns, and they allow for targeted seasonal 400-yr 513
reconstructions of summer hydroclimate for extreme wet and dry conditions independently. 514
515
9 Conclusions 516
An almost symmetric seasonal moisture signal was recorded during years with highest/lowest 517
δ13C values, with precipitation anomalies being significant for similar months (Fig. 5e). This 518
explains the robust and strong linear relationship between δ13C and precipitation seen in 519
correlations (Fig. 2). An opposite behaviour may render the weaker precipitation signal held by 520
the other tree-ring parameters. TRW and δ18O series show a much more marked seasonal 521
asymmetry in their moisture signal. These analyses of extremes revealed that high/low proxy 522
values do not necessarily correspond to mirror images in the atmospheric anomaly patterns, 523
suggesting different drivers and seasonality associated with asymmetric moisture signatures in 524
the proxies, and thus hampering the strength of their climate signal when linear approaches are 525
used (Fig. 2). 526
Severe flooding and droughts are likely to become more frequent with an intensifying water 527
cycle in a warmer world (Wentz et al. 2007; Trenberth 2011; Hartmann et al. 2013). For 528
sustainable water resources management, information about past hydroclimatic changes are 529
needed. Our approach determining the frequency of extreme climatic conditions in the past is a 530
step forward towards a more realistic range of past climate variability considering that the 531
standard methodology based on linear regressions are biased towards the mean climate and often 532
underestimate extremes (McCarroll et al. 2015). Extreme analyses point to a better mechanistic 533
understanding of links between tree-ring proxies and large-scale atmospheric dynamics and can 534
improve climate reconstructions based on proxies with asymmetric and non-stationary signals. 535
Since this information is not available with a traditional linear approach, non-linear methods in 536
palaeoclimate research are useful to overcome the complexity of reconstructing atmospheric 537
features. The distinct seasonal signal in stable isotopes and ring-width supports multi-parameter 538
approaches for advances in the field. 539
540
Acknowledgements 541
We thank Oriol Bosch and Octavi Planells for their participation in sampling and laboratory 542
work. Use of the following data sets is gratefully acknowledged: Global Precipitation 543
Climatology Center data by the German Weather Service (DWD) accessed through 544
http://gpcc.dwd.de; TS by the Climate Research Unit at the University of East Anglia; NNR 545
data provided by NOAA/OAR/ESRL PSD, Boulder, Colorado, USA, through their website 546
http://www.cdc.noaa.gov; and the 20CR Project supported by the U.S. DOE, Office of Science 547
Innovative and Novel Computational Impact on Theory and Experiment program, and Office 548
of Biological and Environmental Research, and by the NOAA Climate Program Office. This 549
research was partially supported by the EU project ISONET (Contract EV K2-2001-00237) 550
and the EU FP6 project Millennium (GOCE 017008). L.A.H. was supported by the Marie 551
Curie International Outgoing Fellowship PIOF-GA-2009-253277 grant within the FP7-552
PEOPLE-2009-IOF program. CCU was supported by the the Penzance and John P. Chase 553
Memorial Endowed Funds and the Investment in Science Fund at WHOI. 554
REFERENCES 556
Andreu Hayles L (2007) Climate and atmospheric CO2 effects on Iberian pine forests assessed 557
by tree-ring chronologies and their potential for climatic reconstructions. University of 558
Barcelona 559
Andreu L, Planells O, Gutiérrez E, Helle G, Schleser GH (2008) Climatic significance of tree-560
ring width and δ13C in a Spanish pine forest network Tellus Series B-Chemical and 561
Physical Meteorology 60:771-781 562
Andreu-Hayles L, Planells O, Gutiérrez E, Muntan E, Helle G, Anchukaitis KJ, Schleser GH 563
(2011) Long tree-ring chronologies reveal 20th century increases in water-use efficiency 564
but no enhancement of tree growth at five Iberian pine forests Global Change Biology 565
17:2095-2112 doi:10.1111/j.1365-2486.2010.02373.x 566
Barbour MM (2007) Stable oxygen isotope composition of plant tissue: a review Functional 567
Plant Biology 34:83-94 doi:http://dx.doi.org/10.1071/FP06228 568
Barriendos M (1997) Climatic variations in the Iberian Peninsula during the late Maunder 569
Minimum (AD 1675-1715): an analysis of data from rogation ceremonies The Holocene 570
7:105-111 doi:10.1177/095968369700700110 571
Barriendos M, Llasat MC (2003) The Case of the `Maldá' Anomaly in the Western 572
Mediterranean Basin (AD 1760–1800): An Example of a Strong Climatic Variability 573
Climatic Change 61:191-216 doi:10.1023/a:1026327613698 574
Barriendos M, Martin-Vide J (1998) Secular Climatic Oscillations as Indicated by Catastrophic 575
Floods in the Spanish Mediterranean Coastal Area (14th–19th Centuries) Climatic 576
Change 38:473-491 doi:10.1023/a:1005343828552 577
Barriendos M, Rodrigo FS (2006) Study of historical flood events on Spanish rivers using 578
documentary data Hydrological Sciences Journal 51:765-783 doi:10.1623/hysj.51.5.765 579
Bladé I, Liebmann B, Fortuny D, Oldenborgh GJ (2011) Observed and simulated impacts of the 580
summer NAO in Europe: implications for projected drying in the Mediterranean region 581
Climate Dynamics 39:709-727 doi:10.1007/s00382-011-1195-x 582
Blanco A et al. (1986) Historia de España, . Historia 16, ISBN 84-85229-81-9 edn., Madrid 583
Borella S, Leuenberger M, Saurer M (1999) Analysis of delta O-18 in tree rings: Wood-cellulose 584
comparison and method dependent sensitivity Journal of Geophysical Research-585
Atmospheres 104:19267-19273 586
Buntgen U, Frank D, Grudd H, Esper J (2008) Long-term summer temperature variations in the 587
Pyrenees Climate Dynamics 31:615-631 doi:10.1007/s00382-008-0390-x 588
Buwen D, Rowan TS, Tim W, Kevin H (2013) Variability of the North Atlantic summer storm 589
track: mechanisms and impacts on European climate Environmental Research Letters 590
8:034037 591
Cai W, Cowan T, Thatcher M (2012) Rainfall reductions over Southern Hemisphere semi-arid 592
regions: the role of subtropical dry zone expansion Scientific Reports 2 593
doi:10.1038/srep00702 594
Camuffo D et al. (2013) Western Mediterranean precipitation over the last 300 years from 595
instrumental observations Climatic Change 117:85-101 doi:10.1007/s10584-012-0539-9 596
Compo GP et al. (2011) The Twentieth Century Reanalysis Project Quarterly Journal of the 597
Royal Meteorological Society 137:1-28 doi:10.1002/qj.776 598
Cook ER, D'Arrigo RD, Mann ME (2002) A Well-Verified, Multiproxy Reconstruction of the 599
Winter North Atlantic Oscillation Index since a.d. 1400* Journal of Climate 15:1754-600
1764 doi:10.1175/1520-0442(2002)015<1754:awvmro>2.0.co;2 601
Cook ER, Kairiukstis L (1990) Methods of Dendrochronology in Applications in the 602
Environmental Sciences Kluwer, Dordrecht, 394 pp., 603
Cook ER, Peters K (1997) Calculating unbiased tree-ring indices for the study of climatic and 604
environmental change Holocene 7:359–368 605
Cook ER et al. (2015) Old World megadroughts and pluvials during the Common Era Science 606
Advances 1 doi:10.1126/sciadv.1500561 607
De Luis M, Carlos Gonzalez-Hidalgo J, Longares LA, Stepanek P (2009) Seasonal precipitation 608
trends in the Mediterranean Iberian Peninsula in second half of 20th century Int J 609
Climatol 29:1312-1323 doi:10.1002/joc.1778 610
Domínguez-Castro F, García-Herrera R, Ribera P, Barriendos M (2010) A shift in the spatial 611
pattern of Iberian droughts during the 17th century Clim Past 6:553-563 doi:10.5194/cp-612
6-553-2010 613
Domínguez-Castro F, Ribera P, García-Herrera R, Vaquero JM, Barriendos M, Cuadrat JM, 614
Moreno JM (2012) Assessing extreme droughts in Spain during 1750–1850 from 615
rogation ceremonies Clim Past 8:705-722 doi:10.5194/cp-8-705-2012 616
Dominguez-Castro F, Santisteban JI, Barriendos M, Mediavilla R (2008) Reconstruction of 617
drought episodes for central Spain from rogation ceremonies recorded at the Toledo 618
Cathedral from 1506 to 1900: A methodological approach Global and Planetary Change 619
63:230-242 doi:10.1016/j.gloplacha.2008.06.002 620
Dorado Liñán I et al. (2012) Estimating 750 years of temperature variations and uncertainties in 621
the Pyrenees by tree-ring reconstructions and climate simulations Clim Past 8:919-933 622
doi:10.5194/cp-8-919-2012 623
Dorado Liñan I, Gutiérrez E, Andreu-Hayles L, Heinrich I, Helle G (2012) Potential to explain 624
climate from tree rings in the south of the Iberian Peninsula Climate Research 55:121-625
136 doi:10.3354/cr01126 626
Dorado Liñán I et al. (2011) Pooled versus separate measurements of tree-ring stable isotopes 627
Science of The Total Environment 409:2244-2251 628
Dorado Liñán I et al. (2015) Eight-hundred years of summer temperature variations in the 629
southeast of the Iberian Peninsula reconstructed from tree rings Climate Dynamics 44:75-630
93 doi:10.1007/s00382-014-2348-5 631
Esper J et al. (2015) Atlantic and Mediterranean synoptic drivers of central Spanish juniper 632
growth Theoretical and Applied Climatology 121:571-579 doi:10.1007/s00704-014-633
1254-4 634
Farquhar GD, O’Leary MH, Berry JA (1982) On the Relationship between Carbon Isotope 635
Discrimination and the Intercellular Carbon Dioxide Concentration in Leaves Australian 636
Journal of Plant Physiology 9:121-137 637
Fernández A, Génova M, Creus J, Gutiérrez E (1996) Dendroclimatological investigations 638
covering the last 300 years in Central Spain. . In: Tree Rings, Environment and Humanity 639
(eds. Dean JS, Meko DM, Swetman TW), pp. 181-190 RADIOCARBON. 889 pp. 640
Frank DC et al. (2015) Water-use efficiency and transpiration across European forests during the 641
Anthropocene Nature Clim Change 5:579-583 doi:10.1038/nclimate2614 642
http://www.nature.com/nclimate/journal/v5/n6/abs/nclimate2614.html ‐ 643
supplementary‐information 644
Friedman JH (1984) A variable span scatterplot smoother. Laboratory for Computational 645
Statistics. Stanford University Technical Report No. 5. 646
Fritts H (1976) Tree rings and climate. Academic Press, New York , 433 pp., 647
Gagen M, McCarroll D, Jalkanen R, Loader NJ, Robertson I, Young GHF (2012) A rapid 648
method for the production of robust millennial length stable isotope tree ring series for 649
climate reconstruction Global and Planetary Change 82–83:96-103 650
doi:http://dx.doi.org/10.1016/j.gloplacha.2011.11.006 651
García Antón M, Franco Múgica F, Maldonado J, Morla Juaristi C, Sainz Ollero H (1997) New 652
data concerning the evolution of the vegetation in Lillo pinewood (Leon, Spain) J 653
Biogeogr 24:929-934 doi:10.1046/j.1365-2699.1997.00181.x 654
Giorgi F (2006) Climate change hot-spots Geophys Res Lett 33 655
Giorgi F, Lionello P (2008) Climate change projections for the Mediterranean region Global and 656
Planetary Change 63:90-104 657
Gómez Gómez P (1996) De Asturias a América, Cuba (1850-1930): la comunidad asturiana de 658
Cuba. . Ed. Pedro Gómez Gómez, Oviedo 659
Hartmann DL et al. (2013) Observations: Atmosphere and Surface. In: Stocker TF, D. Qin, G.-K. 660
Plattner, M. Tignor, S.K. Allen, J. Boschung, A. Nauels, Y. Xia, V. Bex and P.M. 661
Midgley (eds.) (ed) Climate Change 2013: The Physical Science Basis. Contribution of 662
Working Group I to the Fifth Assessment Report of the Intergovernmental Panel on 663
Climate Change Cambridge University Press, Cambridge, United Kingdom and New 664
York, NY, USA., 665
Hernández A et al. (2015) Sensitivity of two Iberian lakes to North Atlantic atmospheric 666
circulation modes Climate Dynamics 45:3403-3417 doi:10.1007/s00382-015-2547-8 667
Hoerling M et al. (2012) Anatomy of an Extreme Event Journal of Climate 26:2811-2832 668
doi:10.1175/jcli-d-12-00270.1 669
Hurrell JW (1995) Decadal Trends in the North Atlantic Oscillation: Regional Temperatures and 670
Precipitation Science 269:676-679 671
Kalnay E et al. (1996) The NCEP/NCAR 40-Year Reanalysis Project Bulletin of the American 672
Meteorological Society 77:437-471 doi:10.1175/1520-673
0477(1996)077<0437:tnyrp>2.0.co;2 674
Karnauskas KB, Ummenhofer CC (2014) On the dynamics of the Hadley circulation and 675
subtropical drying Climate Dynamics 42:2259-2269 doi:10.1007/s00382-014-2129-1 676
Kistler R et al. (2001) The NCEP–NCAR 50–Year Reanalysis: Monthly Means CD–ROM and 677
Documentation Bulletin of the American Meteorological Society 82:247-267 678
doi:10.1175/1520-0477(2001)082<0247:tnnyrm>2.3.co;2 679
Konter O, Holzkämper S, Helle G, Büntgen U, Saurer M, Esper J (2014) Climate sensitivity and 680
parameter coherency in annually resolved δ13C and δ18O from Pinus uncinata tree-ring 681
data in the Spanish Pyrenees Chemical Geology 377:12-19 682
doi:http://dx.doi.org/10.1016/j.chemgeo.2014.03.021 683
Labuhn I et al. (2014) Tree age, site and climate controls on tree ring cellulose δ18O: A case 684
study on oak trees from south-western France Dendrochronologia 32:78-89 685
doi:http://dx.doi.org/10.1016/j.dendro.2013.11.001 686
Lau WKM, Kim KM (2015) Robust Hadley Circulation changes and increasing global dryness 687
due to CO2 warming from CMIP5 model projections Proceedings of the National 688
Academy of Sciences of the United States of America 112:3630-3635 689
doi:10.1073/pnas.1418682112 690
Laumer W, Andreu L, Helle G, Schleser GH, Wieloch T, Wissel H (2009) A novel approach for 691
the homogenization of cellulose to use micro-amounts for stable isotope analyses Rapid 692
Communications in Mass Spectrometry 23:1934-1940 693
Leavitt SW, Long A (1984) Sampling strategy for stable carbon isotope analyses of tree rings in 694
pine Nature 311:145-147 695
Lehmann J, Coumou D (2015) The influence of mid-latitude storm tracks on hot, cold, dry and 696
wet extremes Scientific Reports 5:17491 doi:10.1038/srep17491 697
http://www.nature.com/articles/srep17491 ‐ supplementary‐information 698
Linderholm HW, Folland CK, Walther A (2009) A multicentury perspective on the summer 699
North Atlantic Oscillation (SNAO) and drought in the eastern Atlantic Region Journal of 700
Quaternary Science 24:415-425 doi:10.1002/jqs.1261 701
Llamas MR (2003) Lessons learnt from from the impact of the neglected role of groundwater in 702
Spain’s water policy. Water Resources Perspectives: Evaluation, Management, and 703
Policy, A. S. Sharhan and W. W. Wood, Eds., Elsevier Science, Amsterdam, 63–81. 704
Llasat M-C, Barriendos M, Barrera A, Rigo T (2005) Floods in Catalonia (NE Spain) since the 705
14th century. Climatological and meteorological aspects from historical documentary 706
sources and old instrumental records Journal of Hydrology 313:32-47 707
doi:http://dx.doi.org/10.1016/j.jhydrol.2005.02.004 708
Loader NJ, Robertson I, Barker AC, Switsur VR, Waterhouse JS (1997) An improved technique 709
for the batch processing of small wholewood samples to α-cellulose Chemical Geology 710
136:313-317 711
Loader NJ, Young GHF, Grudd H, McCarroll D (2013) Stable carbon isotopes from Torneträsk, 712
northern Sweden provide a millennial length reconstruction of summer sunshine and its 713
relationship to Arctic circulation Quaternary Science Reviews 62:97-113 714
doi:http://dx.doi.org/10.1016/j.quascirev.2012.11.014 715
López-Moreno JI, Beguería S, Vicente-Serrano SM, García-Ruiz JM (2007) Influence of the 716
North Atlantic Oscillation on water resources in central Iberia: Precipitation, streamflow 717
anomalies, and reservoir management strategies Water Resources Research 43:W09411 718
doi:10.1029/2007wr005864 719
Lu J, Deser C, Reichler T (2009) Cause of the widening of the tropical belt since 1958 720
Geophysical Research Letters 36 doi:10.1029/2008gl036076 721
Lu J, Vecchi GA, Reichler T (2007) Expansion of the Hadley cell under global warming 722
Geophysical Research Letters 34:L06805 doi:10.1029/2006gl028443 723
Luterbacher J et al. (2000) Monthly mean pressure reconstruction for the Late Maunder 724
Minimum Period (AD 1675–1715) Int J Climatol 20:1049-1066 doi:10.1002/1097-725
0088(200008)20:10<1049::aid-joc521>3.0.co;2-6 726
Luterbacher J et al. (2002) Reconstruction of sea level pressure fields over the Eastern North 727
Atlantic and Europe back to 1500 Climate Dynamics 18:545-561 doi:10.1007/s00382-728
001-0196-6 729
Manrique E, Fernandez-Cancio A (2000) Extreme climatic events in dendroclimatic 730
reconstructions from spain Climatic Change 44:123-138 731
McCarroll D et al. (2009) Correction of tree ring stable carbon isotope chronologies for changes 732
in the carbon dioxide content of the atmosphere Geochimica Et Cosmochimica Acta 733
73:1539-1547 doi:10.1016/j.gca.2008.11.041 734
McCarroll D, Loader NJ (2004) Stable isotopes in tree rings Quaternary Research Reviews 735
23:771-801 736
McCarroll D, Pawellek F (1998) Stable carbon isotope ratios of latewood cellulose in Pinus 737
sylvestris from northern Finland: variability and signal-strength Holocene 8:675-684 738
doi:10.1191/095968398675987498 739
McCarroll D, Young GH, Loader NJ (2015) Measuring the skill of variance-scaled climate 740
reconstructions and a test for the capture of extremes The Holocene 25:618-626 741
doi:10.1177/0959683614565956 742
Meko DM, Touchan R, Anchukaitis KJ (2011) Seascorr: A MATLAB program for identifying 743
the seasonal climate signal in an annual tree-ring time series Computers & Geosciences 744
37:1234-1241 doi:http://dx.doi.org/10.1016/j.cageo.2011.01.013 745
Melvin TM, Briffa KR (2008) A "signal-free" approach to dendroclimatic standardisation 746
Dendrochronologia 26:71-86 747
Mitchell TD, Jones PD (2005) An improved method of constructing a database of monthly 748
climate observations and associated high-resolution grids Int J Climatol 25:693-712 749
Naulier M et al. (2015) A millennial summer temperature reconstruction for northeastern Canada 750
using oxygen isotopes in subfossil trees Clim Past 11:1153-1164 doi:10.5194/cp-11-751
1153-2015 752
Nicault A, Alleaume S, Brewer S, Carrer M, Nola P, Guiot J (2008) Mediterranean drought 753
fluctuation during the last 500 years based on tree-ring data Climate Dynamics 31:227-754
245 doi:10.1007/s00382-007-0349-3 755
Ojeda G, San Miguel JL (1985) Campesinos, emigrantes, indianos Emigración y economía en 756
Asturias, 1830-1930. . Salinas, Ed. Ayalga. ISBN 84-7411-132-3., 757
Orden Martín R (2013) El pinar de Lillo. Bedia Artes Gráficas, S. C. Santander (Cantabria, 758
Spain), 90 pp. ISBN: 978-84-695-6855-2. 759
Pauling A, Luterbacher J, Casty C, Wanner H (2006) Five hundred years of gridded high-760
resolution precipitation reconstructions over Europe and the connection to large-scale 761
circulation Climate Dynamics 26:387-405 762
Planells O, Gutiérrez E, Helle G, Schleser G (2009) A forced response to twentieth century 763
climate conditions of two Spanish forests inferred from widths and stable isotopes of tree 764
rings Climatic Change 97:229-252 doi:10.1007/s10584-009-9602-6 765
Previdi M, Liepert BG (2007) Annular modes and Hadley cell expansion under global warming 766
Geophysical Research Letters 34:L22701 doi:10.1029/2007gl031243 767
Prohom M, Barriendos M, Sanchez-Lorenzo A (2015) Reconstruction and homogenization of the 768
longest instrumental precipitation series in the Iberian Peninsula (Barcelona, 1786–2014) 769
Int J Climatol:n/a-n/a doi:10.1002/joc.4537 770
Rodó X, Baert E, Comin FA (1997) Variations in seasonal rainfall in Southern Europe during the 771
present century: relationship with the North Atlantic Oscillation and the El Niño-772
Southern Oscillation Climate Dynamics 13:275-284 773
Rodrigo FS, Barriendos M (2008) Reconstruction of seasonal and annual rainfall variability in 774
the Iberian peninsula (16th–20th centuries) from documentary data Global and Planetary 775
Change 63:243-257 doi:http://dx.doi.org/10.1016/j.gloplacha.2007.09.004 776
Rodriguez-Puebla C, Encinas AH, Nieto S, Garmendia J (1998) Spatial and temporal patterns of 777
annual precipitation variability over the Iberian Peninsula Int J Climatol 18:299-316 778
doi:10.1002/(sici)1097-0088(19980315)18:3<299::aid-joc247>3.0.co;2-l 779
Ruiz-Bellet JL, Balasch JC, Tuset J, Barriendos M, Mazon J, Pino D (2015) Historical, 780
hydraulic, hydrological and meteorological reconstruction of 1874 Santa Tecla flash 781
floods in Catalonia (NE Iberian Peninsula) Journal of Hydrology 524:279-295 782
doi:http://dx.doi.org/10.1016/j.jhydrol.2015.02.023 783
Saurer M, Schweingruber F, Vaganov EA, Shiyatov SG, Siegwolf R (2002) Spatial and temporal 784
oxygen isotope trends at the northern tree-line in Eurasia Geophysical Research Letters 785
29:7-1-7-4 doi:10.1029/2001GL013739 786
Saurer M et al. (2014) Spatial variability and temporal trends in water-use efficiency of 787
European forests Global Change Biology 20:3700-3712 doi:10.1111/gcb.12717 788
Schneider U, Becker A, Finger P, Meyer-Christoffer A, Ziese M, Rudolf B (2014) GPCC's new 789
land surface precipitation climatology based on quality-controlled in situ data and its role 790
in quantifying the global water cycle Theoretical and Applied Climatology 115:15-40 791
doi:10.1007/s00704-013-0860-x 792
Seftigen K, Linderholm HW, Loader NJ, Liu Y, Young GHF (2011) The influence of climate on 793
13C/12C and 18O/16O ratios in tree ring cellulose of Pinus sylvestris L. growing in the 794
central Scandinavian Mountains Chemical Geology 286:84-93 795
doi:http://dx.doi.org/10.1016/j.chemgeo.2011.04.006 796
Tejedor E, de Luis M, Cuadrat J, Esper J, Saz M (2015) Tree-ring-based drought reconstruction 797
in the Iberian Range (east of Spain) since 1694 International Journal of 798
Biometeorology:1-12 doi:10.1007/s00484-015-1033-7 799
Trenberth K (2011) Changes in precipitation with climate change Climate Research 47:123-138 800
doi:10.3354/cr00953 801