SCUOLA DI SCIENZE
Dipartimento di Chimica Industriale “Toso Montanari”
Corso di Laurea Magistrale in
Chimica Industriale
Classe LM-71 - Scienze e Tecnologie della Chimica Industriale
Bimetallic catalysts for CO
2
electroreduction
Tesi di laurea sperimentale
CANDIDATO
Luca MIGLIACCIO
RELATORE Chiar.mo Prof.Maria Cristina CASSANI
CORRELATORE Prof.
Kazuhiro TAKANABE
___________________________________________________________________________________________________________ Anno Accademico 2016-2017 _______________________________________________
ABSTRACT
Bimetallic catalysts for CO
2electroreduction
Over the last decades, many steps have been taken in the search for an effective method to reduce carbon dioxide to small organic molecules that can be used as fuel or building blocks for the chemical industry. The object of this work is to prepare two bimetallic electrocatalysts utilizing Cu combined with Au or In for the efficient and selective reduction of CO2 to CO,
HCOOH and small fuels molecules. The copper-gold electrode is prepared through the electrodeposition of Cu on the surface of Au, using the underpotential deposition (UPD) technique to obtain a copper monolayer. The prepared electrode shows a high current density compared to Au electrode. Bimetallic metal oxides of CuInO2 is used as the precursor to
prepare Cu-In alloys electrodes for electrochemical reduction of CO2. The electrocatalyst
preparation is carried out using a thermal reducing treatment able to form different catalytic surfaces with different Cu-In alloys or single-phase metals. The best sample shows a high faradaic efficiency toward CO (71%) at the low overpotential of −0.8 V vs RHE. This study shows two examples of scalable and inexpensive preparation methods of bimetallic surfaces, which may use as selective electrocatalysts for the aqueous reduction of CO2.
In questo lavoro vengono esaminati due diversi catalizzatori per la riduzione elettrochimica della anidride carbonica in soluzione acquosa. Per entrambi è utilizzato un approccio bimetallico che ha come punto cardine l’utilizzo del rame, in quanto metallo non nobile, a basso costo e facilmente reperibile. Un elettrodo è preparato depositando per via elettrochimica un singolo strato atomico di rame su una superficie di oro tramite sfruttando il fenomeno della deposizione a potenziale inferiore. I test catalitici mostrano una densità corrente maggiore di quella ottenibile utilizzando un elettrodo d’oro non modificato. Il secondo catalizzatore è preparato utilizzando un ossido misto di rame ed indio (CuInO2), come precursore per la sintesi
di una lega Cu-In in grado di convertire selettivamente la CO2 a CO (efficienza faradica del
71%) a basse sovratensioni. Questo studio dimostra che è possibile preparare delle superfici bimetalliche per la riduzione della CO2 in soluzione acquosa, attraverso metodi facilmente
Table of contents
Chapter 1 1
The aim of the thesis 1
1 Introduction 3
1.1 Global Warming 3
1.2 The carbon cycle 7
1.3 Challenges of CO2 control and utilization 8
1.4 Electrochemical reduction of CO2 11
1.4.1 Overview 11
1.4.2 Faradaic Efficiency 15
1.4.3 Electrode metals and reduction potential 16
1.4.4 Reaction mechanisms 19
1.4.5 Copper Alloy Electrocatalysts 23
1.5 Key challenges for the electrochemical reduction of CO2 25
1.6 Bibliography 27
Chapter 2 31
2 CO2 Electroreduction on Au/Cu electrode 31
2.1 Results and discussions 33
2.1.1 Cu on Au deposition strategy 33
2.1.2 Electrochemical CO2 reduction measurements 38
2.2 Experimental section 44
2.2.1 Materials 44
2.2.2 Instruments 44
2.2.3 Preparation on the Au substrate 44
2.2.4 Monolayer deposition 45
Chapter 3 51
3 CO2 Electroreduction on Cu-In Alloy 51
3.1 Results and discussions 53
3.1.1 Synthesis of CuInO2 precursor and its direct use for CO2 reduction 53
3.1.2 Thermal reducing treatment and samples characterization 58 3.1.3 Electrochemical CO2 reduction measurements 70
3.2 Experimental section 77 3.2.1 Materials 77 3.2.2 Instruments 77 3.2.3 CuInO2 synthesis 78 3.2.4 Electrophoretic deposition 79 3.2.5 Thermal treatment 79
3.2.6 Electrochemical reduction measurements 79
3.3 Conclusions 79
3.4 Bibliography 81
Chapter 4 83
List of Figures
Figure 1-1. (a) Temperature anomaly recorded during the last century; data sources [2] [3]. (b) CO2 concentration in the atmosphere from 1980 to 2017, recorded in Mauna Loa
Observatory (Hawaii). ... 4
Figure 1-2. Inventories and fluxes in the carbon cycle (2008 estimates) [7]. ... 7
Figure 1-3. CO2 capture from power generation plants. ... 10
Figure 1-4. Walsh diagram of CO2 orbital energies in linear and bent geometries [22]. ... 15
Figure 1-5. Possible structure of adsorbed CO2 on surface metals. ... 19
Figure 1-6. (a) proposed mechanism for initial electron transfer to adsorb CO as rate determining step, (b) (c) the reaction mechanisms assumed according with the observed transfer coefficient and reaction order. In orange, the Cu atoms. ... 21
Figure 1-7. The assumed reaction mechanisms for the formation of ethylene. (a) “Prior association” of two adsorbed CO, (b)mechanisms with CH2 formation. In orange, the Cu atoms. ... 22
Figure 2-1. Schematic representation of the electrolytic cell used for the study of the redox deposition system. (1) Au spiral counter electrode; (2) Hg/Hg2Cl2 reference electrode; (3) Au sheet as working electrode; 50 mM H2SO4 and 5 mM CuSO4, Argon saturated electrolytic solution. ... 33
Figure 2-2. Deposition and dissolution of Cu on the gold polycrystalline substrate in 50 mM H2SO4 + 5 mM CuSO4. CV of bulk deposition of Cu on Au (blue line). CV of monolayer deposition (red line). Blank acquisition in 50 mM H2SO4 solution (black-dash line). ... 34
Figure 2-3. Deposition of a Cu monolayer using a linear sweep voltammetry from 0.92 to 0.40 V vs RHE. ... 35
Figure 2-4. XPS spectra of Cu 2p for the Cu monolayer on Au substrate. ... 36
Figure 2-5. Current density comparison among Au, Au/CuML, Au/Cu5nm and Au/Cu10nm electrodes (0.1 M KHCO3, pH 6.8, saturated CO2). ... 39
Figure 2-6. Faradaic efficiency analysis of Au electrode at applied potentials for H2 (blue), CO (red) and HCOOH (green). The Faradaic efficiency showed is an average value calculated at the steady-state current and product concentration (0.1 M KHCO3, pH 6, saturated CO2). ... 40 Figure 2-7. Faradaic efficiency analysis of Au/CuML electrode at applied potentials for H2 (blue),
CO (red) and HCOOH (green). The Faradaic efficiency showed is an average value calculated at the steady-state current and product concentration (0.1 M KHCO3, pH 6.8,
calculated at the steady-state current and product concentration (0.1 M KHCO3, pH 6.8,
saturated CO2). ... 42
Figure 2-9. Faradaic efficiency analysis of the Au/Cu10nm electrode at applied potentials for H2 (blue), CO (red) and HCOOH (green). The Faradaic efficiency showed is an average value calculated at the steady-state current and product concentration (0.1 M KHCO3, pH 6.8, saturated CO2). ... 43
Figure 2-10. Scheme of the electrochemical cell used for the electrochemical measurements and the products analysis system. (1) Pt spiral counter electrode; (2) Ag/AgCl reference electrode; (3) working electrode;(4) glass chamber for the counter electrode; (5) 0.1 M KHCO3, CO2 saturated electrolytic solution; (6) inlet of CO2 gas; (7) outlet of gas products. ... 47
Figure 3-1.. Delafossite crystal structure of CuInO2. Crystal lattice data obtained from the website: http://www.catalysthub.net/ and elaborated using the open source software VESTA 3.4.0 (Visualization for Electronic and Structural Analysis). ... 53
Figure 3-2. XRD diffractorgram of CuInO2 as prepared heating at 400°C. ... 54
Figure 3-3. XRD diffractorgram of CuInO2 as prepared heating at 500°C. ... 55
Figure 3-4. Schematic representation of Electrophoretic deposition of CuInO2 on carbon paper substrate. ... 56
Figure 3-5. Chronopotentiometric electrolysis profile at current density of −1.67 mA cm−2 (0.1 M KHCO3, pH 6.8, CO2 saturated). ... 57
Figure 3-6. XRD diffractogram of the electrode surface after CO2 reduction experiment. ... 58
Figure 3-7. TGA of CuInO2, Cu2O and In2O3 obtained by flowing a H2 4% in Argon stream, with a ramping rate of 10 °C min−1 in a temperature range from 25 to 900 °C. ... 60
Figure 3-8. TPR analysis of CuInO2, Cu2O and In2O3 obtained by flowing a H2 4% in Argon stream, with a ramping rate of 10 °C min−1 in a temperature range from 25 to 900 °C. ... 61
Figure 3-9. XRD profile of the CuInO2 on carbon paper sample thermal reduced at 450 °C under H2 4% flow in argon (300 mL min−1). ... 62
Figure 3-10. XRD profile of the CuInO2 on carbon paper sample thermal reduced at 600 °C under H2 4% flow in argon (300 mL min−1). ... 63
Figure 3-11. XRD profile of the CuInO2 on carbon paper sample thermal reduced at 800 °C under H2 4% flow in argon (300 mL min−1). ... 64
Figure 3-12. SEM images of the CuInO2 powder. ... 65
Figure 3-13. SEM images of the thermal reduced sample at 450 °C. ... 66
Figure 3-17. Comparison of the Faradaic Efficiencies obtained during the CO2 reduction
experiments at constant current density. ... 71 Figure 3-18. XRD analysis of the 450 °C sample before CO2 reduction experiment. ... 72
Figure 3-19. XRD analysis of the 450 °C sample after CO2 reduction experiment. ... 72
Figure 3-20. Current density and Faradaic efficiencies of the 200 °C thermally reduced sample at various applied potentials from −0.4 to −0.8 V vs RHE in CO2 saturated 0.1 M KHCO3
solution. ... 73 Figure 3-21. Current density and Faradaic efficiencies of the 450 °C thermally reduced sample at
various applied potentials from −0.4 to −0.8 V vs RHE in CO2 saturated 0.1 M KHCO3
solution. ... 74 Figure 3-22. Current density and Faradaic efficiencies of the 600 °C thermally reduced sample at
various applied potentials from −0.4 to −0.8 V vs RHE in CO2 saturated 0.1 M KHCO3
solution. ... 75 Figure 3-23. Current density and Faradaic efficiencies of the 800 °C thermally reduced sample at
various applied potentials from −0.4 to −0.8 V vs RHE in CO2 saturated 0.1 M KHCO3
List of Tables
Table 1.1. The 1992-2013 CO2 Emissions per Region/Country (Giga Tons). Data Source: Carbon
Dioxide Information Analysis Center, Environmental Sciences Division, Oak Ridge
National Laboratory, Tennessee, United States. ... 6 Table 1.2. Physical and chemical properties of carbon dioxide [16]. ... 12 Table 1.3. Standard potentials of reduction of CO2 in aqueous solution at pH 7 at 25 °C and 1
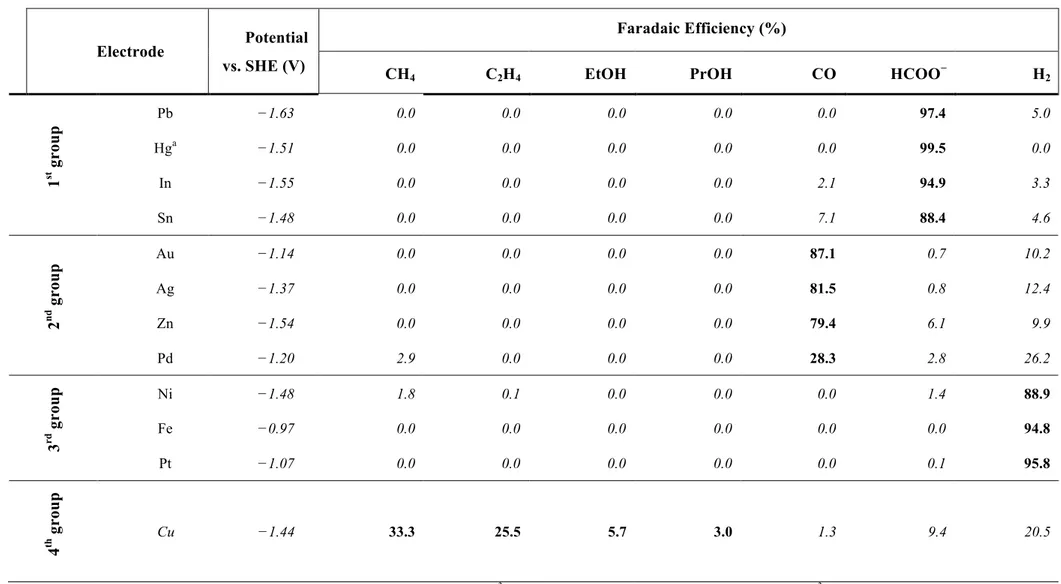
atm [21]. ... 14 Table 1.4. Faradaic efficiencies of Products in CO2 reduction at various metal electrodes a. ... 18
Chapter 1
The aim of the thesis
This thesis work was carried out at KAUST Catalysis Center (Saudi Arabia), at the group of Photocatalysis, under the supervision of the Prof. Kazuhiro Takanabe. The development of a highly efficient and selective catalyst for the electrochemical reduction of CO2 is one
of the biggest scientific challenges; which focused the attention of the academic world and major company.
The purpose of our experimental work was to explore the catalytic performance of a bimetallic catalyst consisting of a substrate of Au covered by a Cu layer at various thickness. In particular, the study aimed to increase the selectivity of Cu towards methane and ethylene production, exploiting the electronic effect due to the presence of a gold substrate.
Afterwards, considering the peculiarities of oxide derived copper (OD-Cu) as a catalyst for CO2 reduction and the effects of the presence of an adjacent heteroatom, our attention
focused on optimizing the preparation of a catalyst already studied with the aim of improving its applicability to an industrial level. A bimetallic oxide of copper and indium has been successfully used as a precursor of a Cu-In alloy for CO2 reduction. High
selectivities towards CO and formic acid at relatively low overpotential were found, with a total faradic efficiency of 94% CO2 reduction. However, the electrochemical reduction
of this precursor to Cu-In alloy has low reproducibility, for this reason, it has been explored the possibility of using a thermal approach to form the Cu-In alloy.
1 Introduction
1.1 Global Warming
Concerns about global warming have led to an increase in interest in reducing atmospheric carbon dioxide (CO2) concentrations. While research groups base their work on the search
for alternative processes with low CO2 production, the need to find a solution to stabilize
carbon concentration in the atmosphere becomes more and more urgent, pending a final transition to low-carbon alternatives. Thus, today's challenge is to make carbon dioxide no longer a problem, but as a resource that used in energy production.
Global warming is a phenomenon of an increase in the average surface temperatures of the Earth, which is not due to natural causes and found since the beginning of the 20th century. Such warming has been found to be not uniform across the globe, but hottest areas (in the northern hemisphere) are present and are more pronounced on the mainland than in the marine waters [1].
In Figure 1-1 a are shown the GISS Surface Temperature Analysis (GISTEMP), an estimate of global surface temperature change. The data are collected around the middle of every month from NOAA GHCN v3 (meteorological stations), ERSST v4 (ocean areas), and SCAR (Antarctic stations) [2] [3].
Global warming is now 0.6 °C over the last three decades, while in the last century the average annual temperature has increased by 0.8 °C. A misplaced platitude says that most of the global warming occurred before 1940. During the first half of the twentieth century there was a moderate fluctuating temperature increasing, but since 1975 the average temperature increased faster, with a mean speed of 0.2 °C per decade [4].
Figure 1-1. (a) Temperature anomaly recorded during the last century; data sources [2] [3]. (b) CO2
concentration in the atmosphere from 1980 to 2017, recorded in Mauna Loa Observatory (Hawaii).
This global average increase would be attributable to the increase in the atmospheric concentration of greenhouse gases, particularly carbon dioxide, which is a consequence of human activity especially the generation of energy using fossil fuels and deforestation. The main greenhouse gases are: water vapor, responsible for the greenhouse effect in a percentage ranging between 36-70%; carbon dioxide (CO2), which affects 9-26%; methane
(CH4), which affects 4-9%; ozone (O3), which affects between 3-7% [5].
CO2 globally released results from different sources, both natural and anthropogenic
globally. Among natural sources, there are soils, inland waters, oceans and volcanic activities; instead, the main anthropogenic sources include cement industry, metrics, land transport, aviation, shipping, and compost reactors. However, the main cause of CO2
emissions is the combustion of fossil fuels, which are the primary contributors to climate change [6].
Human activity has always produced carbon dioxide, but the earth-atmosphere system has always managed to self-regulate CO2 concentration in the various environmental
compartments. From about 1750 until 2000, however, the concentration of carbon dioxide in the atmosphere increased from 280 ppm to 368 ppm, and about 388 ppm in 2010 [7]. In 2015, the value of 400 ppm was exceeded, as it was recorded at the Mauna Loa observatory (Figure 1-1 b).
due to the global financial crisis [8] and some green policy. On the other hand, China has surpassed the United States since 2007 in CO2 emissions by almost four times their
emissions in 20 years.
The European Union has relatively low CO2 emissions compared to those of China and
the United States. The country with the highest value being Germany, which with 0.76 GigaTons in 2013 representing 22.3% of European emissions, followed by United Kingdom, Italy and France.
However, it should be emphasized that direct carbon dioxide emissions represent only a small proportion when compared to natural carbon streams. In order to better understand the effects of human activity on the climate, it is necessary to consider how these affect the mechanisms of exchange between the various environmental compartments: for example, land use has reduced the carbon absorption capacity of the soil, while acidification of the oceans entails less CO2 absorption capacity [7].
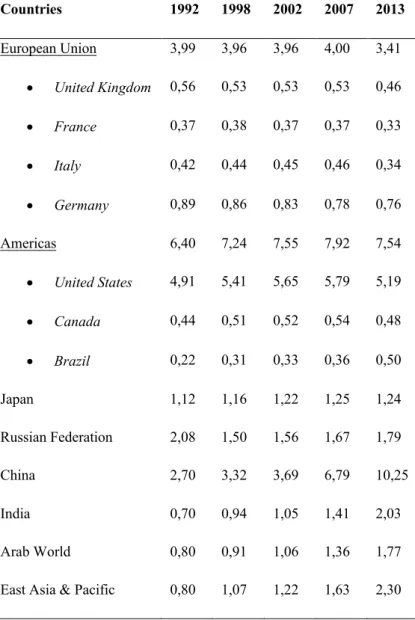
Table 1.1. The 1992-2013 CO2 Emissions per Region/Country (Giga Tons). Data Source: Carbon Dioxide
Information Analysis Center, Environmental Sciences Division, Oak Ridge National Laboratory, Tennessee, United States.
Countries 1992 1998 2002 2007 2013 European Union 3,99 3,96 3,96 4,00 3,41 • United Kingdom 0,56 0,53 0,53 0,53 0,46 • France 0,37 0,38 0,37 0,37 0,33 • Italy 0,42 0,44 0,45 0,46 0,34 • Germany 0,89 0,86 0,83 0,78 0,76 Americas 6,40 7,24 7,55 7,92 7,54 • United States 4,91 5,41 5,65 5,79 5,19 • Canada 0,44 0,51 0,52 0,54 0,48 • Brazil 0,22 0,31 0,33 0,36 0,50 Japan 1,12 1,16 1,22 1,25 1,24 Russian Federation 2,08 1,50 1,56 1,67 1,79 China 2,70 3,32 3,69 6,79 10,25 India 0,70 0,94 1,05 1,41 2,03 Arab World 0,80 0,91 1,06 1,36 1,77
1.2 The carbon cycle
Atmospheric CO2 concentration is the result of complex exchanges between the
atmosphere, the biosphere and the ocean masses, becoming part of the carbon cycle complex. About 40% of the amount of CO2 emitted by human activities is absorbed by
vegetation and oceans every year, whereas the residual 60% remains in the atmosphere [9].
Figure 1-2. Inventories and fluxes in the carbon cycle (2008 estimates) [7].
Given the global problem, the carbon cycle (Figure 1-3) is governed by a source-accumulation mechanism, so there are several sites where carbon is stored, in particular: atmosphere, vegetation or biomass, soil, oceans and lithosphere. The carbon breakdown between the different sites is regulated by flows. A flow is defined as the quantity of an entity that passes through a closed surface per unit of time, if the flow is out of the surface, this becomes a source, but if the stream is incoming it becomes a storage site [10].
Oceans are the main carbon storage site on Earth, where it is estimated that there are about 38,000 GT of inorganic carbon equivalent to approximately 50 times the carbon present in the atmosphere [11]. Each year, about 90 GT of carbon are released into the atmosphere and about 92 GT are absorbed by the oceans. So, this continuous exchange of CO2 between atmosphere and oceans results in a net absorption of carbon dioxide of about
!"#+ %#" ⇄ %#!"' ⇄ %(+ %!"
')
%!"') ⇄ %(+ !"
'#)
Once it has been absorbed, the carbon tends to move from the surface layer (300 m) to the ocean depths. Due to the increased solubility of CO2 in cold water and high salinity,
the absorption efficiency depends on latitude, resulting in the formation of cold and dense water masses [11].
Phytoplankton plays a key role in the absorption of carbon dioxide, which in fact contributes through the photosynthesis process to lower the partial pressure of CO2 in the
surface layers of the oceans, thus favoring the absorption of CO2 from the atmosphere. It
has been estimated that this phenomenon contributes to reducing the concentration of carbon dioxide in the atmosphere by about 150-200 ppm. Indeed, about 25% of the carbon bound through the photosynthesis is deposited in the ocean depths in the form of calcium carbonate (from phytoplankton shells) [11].
As for the atmosphere, it has been estimated that a carbon content of 750 GT and the CO2 concentration is currently around 400 ppm that increasing every year about 2ppm [7].
Concentration depends heavily on interaction with other environmental compartments, especially the earthy vegetation with photosynthesis determines a fluctuating seasonal pattern during the year.
1.3 Challenges of CO
2control and utilization
Greenhouse gas emissions are mainly due to the consumption of fossil fuels. Among them, CO2 emission control is the most important area for controlling greenhouse gas emissions.
In recent decades, the international community is moving towards finding long-term solutions that can stop the growth of CO2 concentration in the atmosphere.
There are mainly five technical options for controlling carbon dioxide emissions: energy choices, energy efficiency and CO2 capture, sequestration and utilization.
Choosing an energy source is the first step to reducing CO2 emissions. A
straightforward example would be to opt to use natural gas rather than charcoal. Generally, the H/C ratio in hydrocarbons is inversely proportional to the amount of carbon dioxide
Improving energy efficiency is another important area with a high impact on CO2
production. In the United States, the energy efficiency of systems to produce electricity from fossil sources is around 35%, for cars this figure is even lower, around 20% [14]. So, the development of new energy utilization systems, such as new hybrid-powered vehicles, can implement efficiencies at 30% or more. Likewise, the development of new catalysts that can selectively reduce the formation of CO2 in oxidation reactions is a significant
commitment to modern industries [15].
Carbon dioxide can be considered not only as a greenhouse gas but also as a starting reagent to obtain various organic chemicals or fuels. The key word represents the use of renewable sources (such as solar energy) to derive the energy needed to convert CO2.
CO2 is not a high added value product but is often the defective product of many
industrial processes. The energy consumption that leads to the formation of CO2 represents
a loss in economic terms. However, it is interesting to note that the amount of CO2 emitted
as a CO2 rich stream by the production plants and waste gas from the manufacturing
industry is far more than the amount of carbon used to produce many chemicals, organic materials and liquid transport fuels [16].
The primary barrier to using CO2 is the lack of driving forces pushing the market
towards this direction. In particular, it is necessary to consider that a fundamental part of the total price of the operation is the costs of capture, storage, separation, purification and transport of CO2.
Three different approaches to carbon dioxide capture can be identified [7]: • As a pure or near-pure CO2 stream (from industrial process).
• Concentration of the discharge from an industrial process into a pure or near-pure CO2 stream.
• Direct air capture into a pure stream of CO2 or into a stable product.
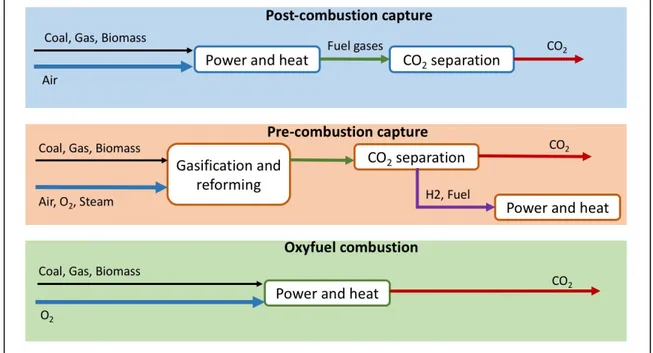
Carbon dioxide content in a stream from power generation plants that use fossil fuels varies between 3% (typically for plants using natural gas) and 15% (coal-fired plants). CO2
capture from power generating plants is known as "post-combustion capture" and involves the use of various separation technologies including chemical and physical absorbents and membranes. As an alternative to post-combustion capture, there are two possible
directly compressed and transported. The second alternative, called "pre-combustion capture", involves a partial oxidation of fuel that forms a flow of a mixture of H2 and CO2
with a percentage of CO2 between 15-60% which can be readily separated using the
techniques used for the post-combustion capture. The resulting hydrogen and fuel stream can be conventionally combusted in a turbine gas [7].
Figure 1-3. CO2 capture from power generation plants.
The direct capture of CO2 from the atmosphere represents an opposite situation
concerning the case of the cement industry. In fact, the concentration of CO2 in the air, as
seen before, is considerably lower (about 400 ppm), which makes the absorption process much more complicated. A spray-tower system that uses a sodium hydroxide solution as the absorbent liquid, which has been shown to absorb 15 tons of CO2 per year per square
meter on a laboratory scale [17]. However, the scale-up of such a plant would require absorbing walls of about 15 meters long and up to 6 km long. The strength of this process is that, unlike the ones described above, it does not change the CO2 emissions, but directly
affects the reduction of carbon dioxide concentration in the atmosphere [7].
To capture CO2 different techniques are currently being studied and used. Among
these, which are most promising at the moment are geological storage and ocean storage. In the first case, oil or gas reserves or in non-potable water formations are used; CO2
water storage is much more accessible than oil or gas storage; it is estimated to be two or three times greater [7] [18].
In the case of ocean storage, however, the basic idea is to take advantage of the ocean's storage capacity over the atmosphere. Long-term storage can be achieved by gaseous CO2
venting or supercritical fluid at a depth sufficient to avoid rising to surface water. Alternatively, CO2 can be stored as a supercritical glider at very high pressures under 3000
meters of depth. Pools of this type have been observed nearby the deep water hydrothermal vents as a result of the separation of CO2 from vented gases. Other options for oceanic
storage include increased photosynthetic activity in nutrient-depleted surface waters, including through direct fertilization [7].
1.4 Electrochemical reduction of CO
2 1.4.1 OverviewCarbon dioxide is, with water, the final combustion product of any carbon and hydrogen containing compounds. CO2, a 16e- molecule,(molar weight 44.0 g mol-1) is a colorless
and odorless gas. It is an apolar linear molecule (O=C=O), in which the oxygen atoms are each covalently double bonded to a single carbon atom. Carbon dioxide has two different reaction sites: the carbon atom is an electrophile; instead, the oxygen atoms are nucleophiles. This particular aspect makes CO2 a bifunctional catalyst [19]. The carbon
dioxide is the more stable among carbon based substances under the environmental conditions, for this reason, its chemistry is very poor. With a C=O bond energy of 187 kcal mol-1, much higher than C=C (145 kcal mol-1) and O=O (116 kcal mol-1) bonds [6], is possible to understand the low reactivity of CO2.
Table 1.2. Physical and chemical properties of carbon dioxide [16].
Property Value and unit
Molecular weight 44.01 g mol−1
Sublimation point at 1 atm −78.5 °C
Triple point at 5.1 atm −56.5 °C
Triple point pressure 5.185 bar
Critical Temperature (Tc) 31.04 °C
Critical Pressure (Pc) 72.85 atm (7383 kPa)
Critical Density (rc) 0.468 g cm−3
Gas Density at 0 °C and 1 atm 1.976 g dm−3
Solid Density 1560 g dm−3
Specific volume at 1 atm and 21 °C 0.546 m3 kg−1
Latent heat of vaporization at the triple point (−78.5 °C) 353.4 J g−1
Latent heat of vaporization at 0 °C 231.3 J g−1
Viscosity at 25 °C and 1 atm CO2 0.015 cP
Solubility in water at 25 °C and 1 atm 0.759 mL CO2 / mL H2O
Heat of formation at 25 °C, ∆H° gas −393.5 kJ mol−1
Entropy of formation at 25 °C, S° gas 213.6 J K−1 mol−1
Gibbs free energy of formation at 25 °C, ∆G° gas −394.3 kJ mol−1
Heat capacity under constant pressure at 25 °C 37.1 J mol−1 °C−1
Heat capacity under constant volume at 25 °C 28.1 J mol−1 °C−1
Thermal conductivity 14.65 mW m−1 k−1
The conversion of CO2 to valuable chemicals is the most important target for reducing
the emissions of this greenhouse gas into the atmosphere. Indeed, to date, the ability to control CO2 emissions using only renewable energy sources (e.g. solar, wind and water) is
the less efficient. The major reason is the absence of large-scale energy storage systems, which can overcome the intermittent nature of renewable sources. The main products of carbon dioxide reduction are carbon monoxide (CO), formic acid (HCOOH), oxalic acid (H2C2O4), methane (CH4), methanol (CH3OH), formaldehyde (CH2O), ethylene (CH2CH2)
and ethanol (CH3CH2OH) [6]. Various approaches to the formation of these products may
be used: homogeneous catalysis, heterogeneous catalysis, photocatalysis or electrochemical reduction. Among them, the electrochemical reduction has the advantage of using renewable resources as the source of electricity, making this approach the one with the highest environmental compatibility.
Also, CO2 conversion using an electrochemical approach has great interest due to
various technical advantages. The process is easily controllable by modulating the applied potential and the reaction temperature; the supporting electrolyte can be completely recycled, minimizing the total consumption of chemicals; the electrochemical reaction system is compact, modular and easy for scale-up for industry application [20].
In an electrochemical cell, the reduction of carbon dioxide occurs at the cathode while the anode takes on the reaction of oxygen evolution. As can be seen in Table 1.3, although the CO2 reactivity is very low, CO2 reduction potential is not very negative when compared
to the hydrogen evolution reaction in aqueous electrolyte solution (equation 7).
However, the carbon dioxide reduction is not so easy, because the real potential for CO2 reduction is much more negative than the equilibrium potential. The cause of this
wide overpotential is the formation of the intermediate CO2·−, which is formed by
electronic transfer from the electrode to a CO2 molecule (equation 8) [21]. The formation
of this reaction intermediate was proposed in 1960 by Jordan and Smith, and later, using polarography technique was discovered that the formation of this intermediate is the determining step of the CO2 reduction [21].
Table 1.3. Standard potentials of reduction of CO2 in aqueous solution at pH 7 at 25 °C and 1 atm [21]. Half-Electrochemical Thermodynamic Reactions Electrode Potentials (V vs. SHE) !"#+ %#" + 2+)→ %!"")+ "%) −0.43 (1) !"#+ %#" + 2+)→ !" + 2"%) −0.52 (2) !"#+ 6%#" + 8+)→ !%5+ 8"%) −0.25 (3) 2!"#+ 8%#" + 12+)→ ! #%5+ 12"%) −0.34 (4) 9!"#+ 9%#" + 12+)→ !#%8"% + 12"%) −0.33 (5) 3!"#+ 13%#" + 18+)→ ! '%9"% + 18"%) −0.32 (6) 2%#" + 2+)→ 2"%)+ %# −0.41 (7) !"#+ +)→ !"#∙) −1.90 (8)
The reaction mechanisms of the CO2 reduction on metal electrodes has been amply
studied during the last decades. Nevertheless, the mechanisms of formation of small organic molecules as products are not entirely clear. The main complication is due to the wide variety of products and the number of transferred electrons that can occur on the surface of the electrode. The assumptions now accepted come from the observation of charge transfer and the use of macroscopic electrochemical testing for the reaction orders determination.
The exact geometry of CO2·− on metal surface is still unclear but, looking at the Walsh
diagram in Figure 1-5, is possible to better understand bonds angles of CO2 and its
intermediate. The highest occupied molecular orbital (HOMO) is the lπg orbital, that
represent the π−C−O bonds [22]; the lowest unoccupied molecular orbital (LUMO) is the 2πu orbital, that represent the π Ione pairs. The diagram shows how the energy position of
Figure 1-4. Walsh diagram of CO2 orbital energies in linear and bent geometries [22].
In the bent molecules, the degeneracies of all π orbital are split in energies. In the case of the lπg orbital in both degeneracies the energy required to maintain the new geometric
conformation is higher than the linear geometry, on the other hand, in the case of the 2πu
orbital, there is a stabilization in energy terms. The Walsh diagram explains why the bond angle of the CO2 absorbed on the metal electrode surface is close to 133°, because of the
occupancy of the HOMO with an electron in the CO2·− intermediate [19]. 1.4.2 Faradaic Efficiency
The faradaic efficiency (F.E.) is one of the most popular indexes used to measure the utilization efficiency of electricity when two or more faradaic reactions co-occur at an electrode. In other words, the faradaic efficiency of a specific product of CO2
electroreduction reveals the ratio between the amount of energy (electrons) the system requires and the amount of the product formed. It is calculable from the number of electrons consumed in the electro reduction process:
where m is the number of moles of product formed, n is the number of electrons required for the formation of one molecule of product, ℱ is the Faraday constant and ir,t is the circuit
current. The integration of current in the time interval corresponding at the charges passed through the electrode.
The F.E. towards a product may be affected by several factors; many experimental results show that changing the system parameters the selectivity of the process can significantly change. Certainly, the F.E. depends on the element or chemical composition of the catalyst [23]; but also, the morphology of the electrode surface is a critical parameter, for example, the thickness of the catalyst layer or the catalyst particle size [24] [25]. Other experimental conditions such as pH, reaction time and temperature, may be essentials parameters to evaluate the faradaic efficiency [26].
1.4.3 Electrode metals and reduction potential
The catalyst material influences, at the same operating conditions (e.g. temperature, CO2
concentration, electrolyte solution), the selectivity of the CO2 reduction reaction. The
previous study by Hori’s group shows that it is possible to classify the electrocatalytic metals into four fundamental groups [21]:
• The 1st group consists of several metals characterized by a high hydrogen
overvoltage, low absorption capacity of CO, and high overvoltage for CO2 to
CO2·−, and consequently weak stabilization of that intermediate. The metals
included in this group are Hg, Pb, In, Sn, Cd, and the major product from CO2
reduction is formate ion (HCOO−).
• The 2nd group consists of metals characterized by a medium hydrogen
overvoltage, the weak absorption capacity of CO, and can catalyze the breakage of the C−O bond and at the same time, promotes the desorption of CO. The metals included in this group are noble metals such as Au and Ag but also Pd, Zn and Ga. The major product from CO2 reduction is carbon monoxide (CO).
• The 3rd group consists of metals characterized by a low hydrogen overvoltage.
Therefore, the hydrogen evolution reaction is the main reaction that occurs on the electrode’s surface. The metals of this group are Ni, Fe, Pt and Ti.
• The 4th group include only Cu, which has unique features for the CO
Previously, the standard potential of the reduction of CO2 was showed in Table 1.3: the
thermodynamic potential depends on the products, for example at 25 °C and pH 7 the required potentials to obtain CO and HCOO− are −0.52 and −0.43 V vs SHE respectively. However, Table 1.4 shows the experimental values of the potentials required for the reduction of CO2 at the same current density. These potentials are much more negative
than those obtained from thermodynamic data because, as discussed above, the main reason is that the formation of the CO2·− radical anion as intermediate species requires a
large overpotential.
In order to better understand how the potential depends on the metal used as a catalyst, it is interesting to compare the potential needed for CO2 reduction, for each metal, and the
respective heat of fusion. Interestingly, the HCOO− formation metals need a very negative potential and have a low heat of fusion value. On the other hand, the CO formation metals need a less negative potential and have a higher heat of fusion value [21]. The heat of fusion of metals is correlated to the extent of d electron contribution to metallic bond and may be used as a measure of the availability of the d electrons [27]. The extent of the stabilization of CO2·− depends on d electron availability. Therefore, in case of metals such
as Au, Cu, Ag, Zn, with a high heat of fusion, the stabilization of CO2·− is high and this
means that an extra negative charge on oxygen atom promotes the protonation of CO2
Table 1.4. Faradaic efficiencies of Products in CO2 reduction at various metal electrodes a.
Electrode Potential vs. SHE (V)
Faradaic Efficiency (%)
CH4 C2H4 EtOH PrOH CO HCOO− H2
1 st gr ou p Pb −1.63 0.0 0.0 0.0 0.0 0.0 97.4 5.0 Hga −1.51 0.0 0.0 0.0 0.0 0.0 99.5 0.0 In −1.55 0.0 0.0 0.0 0.0 2.1 94.9 3.3 Sn −1.48 0.0 0.0 0.0 0.0 7.1 88.4 4.6 2 nd gr ou p Au −1.14 0.0 0.0 0.0 0.0 87.1 0.7 10.2 Ag −1.37 0.0 0.0 0.0 0.0 81.5 0.8 12.4 Zn −1.54 0.0 0.0 0.0 0.0 79.4 6.1 9.9 Pd −1.20 2.9 0.0 0.0 0.0 28.3 2.8 26.2 3 rd gr ou p Ni −1.48 1.8 0.1 0.0 0.0 0.0 1.4 88.9 Fe −0.97 0.0 0.0 0.0 0.0 0.0 0.0 94.8 Pt −1.07 0.0 0.0 0.0 0.0 0.0 0.1 95.8 4 th gr ou p Cu −1.44 33.3 25.5 5.7 3.0 1.3 9.4 20.5
1.4.4 Reaction mechanisms
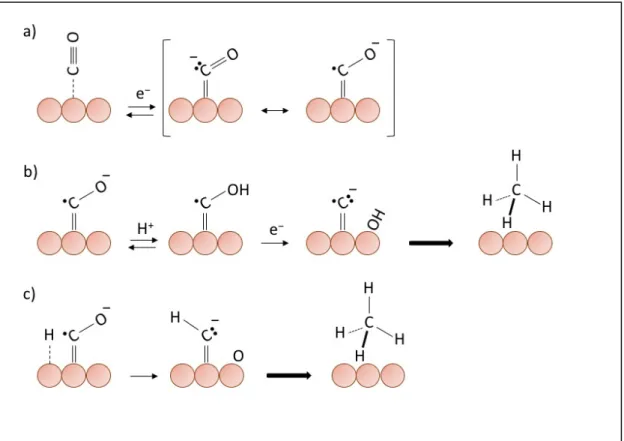
The reaction mechanisms on the electrode surface depend mainly on the nature of the metal catalyst and its interaction with the CO2·− radical anion intermediate. There are two
different ways to adsorb the CO2 on the metal surface: can take place an interaction with
carbon or oxygen or both, to form carbon or oxygen coordination, or mixed coordination respectively (Figure 1-6). The coordination with the metal surface is crucial for the following step. In fact, there are two main pathways for the consecutive reduction of the adsorbed CO2·−, which implicates the formation of the two major main products of CO2
reduction, carbon monoxide and formate ion.
Figure 1-5. Possible structure of adsorbed CO2 on surface metals.
The CO2·− radical anion adsorbed on the metal surface works like a nucleophilic
reactant at the carbon atom or oxygen atom. Hence, in case of an oxygen coordination with the metal (e.g. Indium or Tin), the CO2·− takes a proton from a H2O molecule at the
nucleophilic carbon atom, producing HCOO· adsorbed. The next step is the subsequent reduction of HCOO· to HCOO− at the electrode and its desorption [29]. The reaction steps can be write as:
!"# ∙&+ (
#" → (!"" ∙ + "(& (!"" ∙ + *& → (!""&
atom is strongly coordinated with the transition metal because a back donation from metal to CO2, that stabilizes it by a strong charge transfer [30]. The H2O, the electrophilic
reagent, reacts with the oxygen of the adsorbed radical anion, forming CO and OH. Carbon coordination favors the protonation of oxygen and not carbon, preventing the formation of HCOO· and favoring the formation of ·COOH [29]. Subsequently, the radical ·COOH will be reduced to form CO, that is easily desorbed from the metal surface:
!"# ∙&+ (
#" → ∙ !""( + "(& ∙ !""( + *& → CO + "(&
With the aim of proving the proposed reaction mechanism, it has been demonstrated that CO formation on a gold electrode does not depend on the pH of the electrolyte; hence the protons donor is not H+ but the H2O molecule [21].
If the metal used strongly adsorbs CO on its surface (e.g., Pt, Ni, Fe, Ti), the main reaction at the electrode is the hydrogen evolution. This reaction is, in fact, the major side reaction that happens at the same time as CO2 reduction.
(-+ *& → (
./0 2(./0 → (#
Contrary to that seen with Au, Ag and Zn, a Cu electrode has a greater ability to adsorb CO on its surface. This property involves that Cu can further reduce CO to hydrocarbons and alcohols.
CH4 formation occurs at more negative potential than C2H4, around −1.22 V and −1.12
V vs SHE respectively. Moreover, the formation of ethylene is favored by high electrolyte pH values [29]. As a consequence of these observations, it is conceivable that there are two different paths of reaction for the formation of methane and ethylene.
Figure 1-6. (a) proposed mechanism for initial electron transfer to adsorb CO as rate determining step,
(b) (c) the reaction mechanisms assumed according with the observed transfer coefficient and reaction order. In orange, the Cu atoms.
As demonstrated by ab initio calculations, the Cu-C bond of the adsorbed CO anion radical on the surface of Cu has a double bond character [31]. After the formation of the CO anion radical (Figure 1-6 a), two reaction pathways can take place to obtain the methane production [32]:
• the first pathway provides an acid-base reaction to oxygen, with the formation of irreversible C-H bonds, leading to the production of CH4 (Figure 1-6 b);
• the second pathway, on the other hand, proceeds with a radical CO anion reaction with an adsorbed hydrogen on the metallic surface, forming a radical C-H radical which evolves towards the formation of CH4 (Figure 1-6 c).
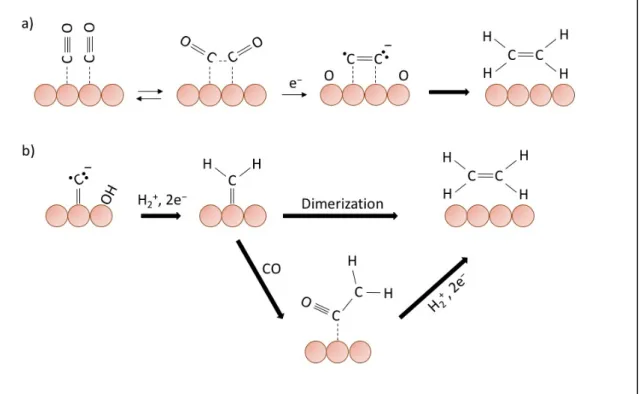
The ethylene formation starts at a lower potential than methane, and as the rate determining step of electron transfer occurs, is possible to assume that there is the formation of some bond between two adjacent CO radical anions, followed by reduction to C2H4 (Figure 1-7 a). Alternatively, could happen another pathway to obtain the ethylene
Figure 1-7. The assumed reaction mechanisms for the formation of ethylene. (a) “Prior association” of
two adsorbed CO, (b)mechanisms with CH2 formation. In orange, the Cu atoms.
Until now, the mechanism that allows the formation of C-H bond on Cu electrode, during the reaction between water or H+ with CO2·− or CO, is not clear. In order to clarify
this aspect, some experiments were carried out using different crystal faces of Cu.
Using crystal faces dominated by Cu (100), high faradic efficacy values towards ethylene were obtained, recording a relatively low overpotential. It is possible to explain this result by observing the reaction mechanism supposed in Figure 1-7 (a), that shows a reaction intermediate with two CO molecules adsorbed on the copper surface. The formation of this intermediate requires interaction between the π orbitals of the CO molecules, which with vibrational motions accompany the oxygen atoms to interact with the copper surface. This transition state is easier to obtain with the right atomic arrangement that matches Cu (100) terrace surface [33].
On the contrary, the crystal faces dominated by Cu (111) show more negative potentials than Cu (100), favoring the methane production. Instead, the Cu (110) surfaces polarize to the most negative potential producing organic molecules with two or more carbon atoms such as acetic acid [34]. It follows that using a polycrystalline Cu the selectivity of the CO2
1.4.5 Copper Alloy Electrocatalysts
As described in the previous section, among the electrode metals, only the Cu has the peculiarity of being able to produce hydrocarbons during the CO2 reduction reaction at
potential more negative than −1.0 V vs SHE. However, this extensive overpotential makes the process inefficient. For this reason, several modifications have been made to copper electrodes, as surface treatments (e.g. thermal or acid treatments) or modifying the surface of the electrode by inserting of heteroatoms.
Surface treatments are usually applied to remove surface contamination or surface irregularity caused by mechanical polishing. It was demonstrated that the product selectivity of a Cu electrode might be strongly affected by its surface treatments. Lately, a research group from Stanford has shown that an oxide derived copper (OD-Cu), could be a good precursor to obtain a catalyst with a high efficiency [35]. In particular, they show how an annealing treatment, followed by an electrochemical reduction of the oxide-derived copper, can produce a mixture of CO and HCOOH from CO2 at low overpotential (−0.5 V
vs RHE). Moreover, acceptable faradaic efficiency toward CO ( 45% F.E. in a potential ranging from −0.3 to −0.5 V vs RHE) was achieved, and an improvement of stability, at least several hours, compared to the rapid deactivation of polycrystalline Cu under identical conditions. The assumption carried forward to explain the improvement in CO faradaic efficiency, is that the formations of active sites can strongly bind the CO and suppress the hydrogen evolution reaction. These active sites are produced during the electrochemical reduction of copper oxide to the metallic state [36].
Subsequently, experiments were carried out with oxidized gold using electrochemical methods. As can be seen from Table 1.4, gold is a metal belonging to the 1st group identified by Y. Hori, so it has a high selectivity towards CO as well as a low overpotential. The results obtained show that oxide derived gold (OD-Au) has a metastable surface capable of accelerating the CO2 reduction reaction, showing a remarkable catalytic
activity. Besides, high faradaic efficacy values have been achieved toward CO ( 99%) at very low overpotential (−0.35 V vs RHE) [37].
Similarly, nanocrystalline lead films prepared by electrochemical reduction of PbO2
The presence of small amount of heteroatoms on the electrode surface could influence the selectivity of the CO2 reduction reaction. There were used several methods to modify
the metal surface, among these the electrochemical under potential (to obtain an atomic monolayer) or overpotential deposition are the easiest. For instance, the CO faradaic efficiency of pure Cu is 69%, while if the Cu surface is modified with a decoration of Cd or Pd, the faradaic efficiency becomes 82% and 0% respectively [29].
Several Cu-based alloys have been examined for the CO2 reduction. Changes in the
electronic structure and the crystallographic characteristics (including the introduction of vacations and dislocations) are a combination that allows major changes in the selectivity of reaction products and reaction rates.
For example, Cu-Ni and Cu-Fe alloys, formed by electrochemical deposition, have shown a significant decline of CH4 and C2H4 production, favoring the hydrogen evolution
reaction when the coverage of Ni or Fe increase [39].
Other alloys catalysts as Cu-Pb, Cu-Zn, Cu-Cd have been studied; the first one showed a distributed selectivity toward CO and HCOOH; the alloys catalysts with Zn and Cd, instead, have shown a different behavior compared to elemental metals, with lower overpotential and greater distribution of faradic efficiencies [40].
A bimetallic Cu-Sn catalyst was developed by electrodeposition of tin on the Cu surface, and different thickness of that layer was investigated. The results obtained showed a high selectivity to make CO from CO2 reduction (>90% F.E.) over a wide potential range
(−0.4 to −0.8 V vs. RHE) with an excellent stability [41].
For a better understanding of the reaction mechanism, Kim D. et al. have investigated the CO2 reduction activity of Au-Cu bimetallic nanoparticles in a monolayer platform, with
the purpose to quantitatively compare the activity and selectivity of a different composition ratio of Au and Cu [42]. It was found a peak of activity for the Au3Cu nanoparticles (93.1
times the only Cu nanoparticles), but they also identified the two most significant effects that may influence the selectivity of the CO2 reduction reaction using a bimetallic catalyst:
an electronic and a geometric effect. The electronic effect is due to the change in the electronic structure of a catalyst and influences the binding strength of intermediates that in case of transition metals depends on the d-bands interaction with the adsorbed species.
atom at the adjacent atom, where the intermediate is adsorbed, can stabilize the adsorbed species allowing the further reaction step.
Reske R. et al. have investigated the thickness effects of Cu layers on Pt substrate on the activity and selectivity of CO2 reduction [43]. They have shown that varying the Cu
overlayers thickness is possible to control the product selectivity. This altered product distribution is recallable to the strain and electronic effects. While the electronic effect decreases with the increase in the atomic distance between the two elements until it disappears to a specific thickness of the Cu layer; on the contrary, the tensile strain effect remains unchanged even at great distances.
A Cu-In alloy catalyst was investigated following two different ways of preparation: electrochemical reduction of oxidized Cu and simultaneous deposition on In, otherwise by electrochemical reduction of a bimetallic mixed oxide (CuInO2) used as a precursor. Both
of them catalyzed the CO2 reduction to CO with high faradaic efficiency toward CO,
showing an exceptional stability of the electrode.
1.5 Key challenges for the electrochemical reduction of CO
2As already mentioned above, the electrocatalytic reduction of CO2 is a challenge and an
opportunity for the academic world and industry. However, in order to reach the goal, it is necessary to take into account many aspects of both project and resource nature.
The catalyst properties are essential to optimize the desired process, which is why the main parameters investigated are catalytic activity, selectivity to a particular product, and electrode stability. As discussed above, a high overpotential is often a critical limit for some metals tested for the electrochemical reduction of CO2. By reading Table 1.4, it can
be noted that among the metals capable of producing formic acid or carbon monoxide, only Au and Pd have a less negative potential reduction of −1.3 V vs SHE, which is still very high if the goal is to use this technology in the future. Also, using the most promising metal, Cu requires a more negative reduction potential of Au, around −1.44 V vs SHE (at equal current density).
An important goal of the electrochemical reduction of CO2 is to find a catalyst capable
products are formic acid and methane [44], the first is undoubtedly the easiest to produce, yet none of the catalysts developed to date has a high selectivity towards this desired product under normal pressure and temperature conditions.
One of the greatest obstacles is the deactivation of the catalyst due to the poisoning of the electrode surface. An important study by Hori et al. showed the main causes of the limited stability of the Cu electrode. The heavy metal impurities in the electrolyte solution; few organic substances in water; and some intermediate produced during the CO2
reduction [45]. Furthermore, operating conditions, such as applied potential or current density, can affect the durability of the electrode. For example, it has been shown that the pulsed electrolysis method may decrease deactivation of the electrode, or pretreatment of a copper electrode by applying a potential can change the characteristics of the electrode surface and extend its durability [46].
Due to the stability of the CO2 molecule, its reduction requires a great deal of energy.
Consequently, the cost of electricity is an important parameter during the electroreduction process of CO2. Moreover, it must be considered that renewable sources of energy must
be used to avoid extra CO2 emissions, which entails higher energy costs. Besides, chemical
consumption is a cost that has to be taken into account for industrial development.
Energy consumption during the reduction process is high also because of the low catalytic activity of the catalysts. To overcome this problem, consider the cost of energy is critical to the development of this technology. Using fossil fuels as a primary source of electricity would certainly be cheaper, but this is a viable one if the objective is to control CO2 emissions in the environment. To date, the lowest-cost, CO2-free energy is the nuclear
power, followed by wind energy that is expected to fall in price in the near future [47]. In conclusion, the properties of the catalyst are a key factor for CO2 electroreduction
technology. In order to achieve the set objectives, the three most important aspects of catalytic activity must be implemented: activity, selectivity and stability. In detail, it is necessary to obtain high faradaic efficiencies towards the desired products and low hydrogen evolution reaction.
1.6 Bibliography
[1] INTERGOVERNMENTAL PANEL ON CLIMATE CHANGE, «Climate Change 2007: The Physical Science Basis.», IPCC WGI Fourth Assessment Report, 2007. [2] GISTEMP Team, «GISS Surface Temperature Analysis (GISTEMP)», NASA
Goddard Institute for Space Studies, 2017. [Online]. Available: https://data.giss.nasa.gov/gistemp/. [Consultato il giorno 29 07 2017].
[3] Hansen, J. R. Ruedy, M. Sato e K. Lo, «Global surface temperature change.», Rev.
Geophys., vol. 40, 2010.
[4] J. Hansen, M. Sato, R. Ruedy, K. Lo, D. W. Lea e M. Medina-Elizade, «Global temperature change.», PNAS, vol. 103, n. 39, 2006.
[5] J. T. Kiehl e K. E. Trenberth, «Earth's Annual Global Mean Energy Budget.»,
BulletinoftheAmericanMeteorologicalSociety, vol. 78, n. 2, 1997.
[6] J. Qiao, Y. Liu, J. Zhang e S. Basu, Electrochemical Reduction of Carbon Dioxide: Fundamentals and Technologies, New York, London, Boca Raton: CRC, 2016.
[7] Rackley e A. Stephen, Carbon capture and storage, Oxford: Butterworth-Heinemann Elsevier.
[8] G. P. Peters, G. Marland, C. Le Quéré, T. Boden, J. G. Canadell e M. R. Raupach, «Rapid growth in CO2 emissions after the 2008–2009 global nancial crisis», Nature climate change, vol. 2, n. 1, p. 2, 2012.
[9] ENEA, «ENEA per lo studio dei cambiamenti climatici e dei loro effetti», Roma, 2007.
[10] G. Burba e D. Anderson , A brief practical guide to eddy covariance flux measurements: principles and workflow examples for scientific and industrial applications, Li-Cor Biosciences, 2010.
[11] P. Falkowski, R. J. Scholes, E. Boyle, J. Canadell, D. Canfield, J. Elser, N. Gruber, K. Hibbard, P. Högberg, S. Linder, F. T. Mackenzie, B. Moore III, T. Pedersen, Y. Rosenthal, S. Seitzinger, V. Smetacek e W. Steffen, «The Global Carbon Cycle: A Test of Our Knowledge of Earth as a System.», Science, vol. 290, n. 5490, pp. 291-296, 2000. [12] M. C. Colin Baird, Chimica Ambientale, Zanichelli, 2013.
[13] Halmann, M. Martin e M. Steinberg, Greenhouse gas carbon dioxide mitigation: science and technology, CRC press, 1998.
[14] Cooper e I. Andrew, «Polymer synthesis and processing using supercritical carbon dioxide.», Journal of Materials Chemistry, vol. 10, pp. 207-234, 2000.
[15] Manzer e E. Leo, «CO2 Emission Reductions: An Opportunity for New Catalytic
Technology.», ACS Symposium series, vol. 809, pp. 39-52, 2002.
[16] Song e Chunshan, «Global Challenges and strategies for control, conversion and utilization of CO for sustainable development involving energy, catalysis, adsorption
[17] J. K. Stolaroff, D. W. Keith e G. V. Lowry, «Carbon Dioxide Capture from Atmospheric Air Using Sodium Hydroxide Spray.», Environmental Science &
Technology, vol. 42, n. 8, p. 2728–2735, 2008.
[18] M. Bentham e G. Kirny, «CO2 Storage in Saline Aquifers.», Oil & Gas Science and
Technology, Notthigham, 2005.
[19] A. Di Benedetto e M. Aresta, «Artificial carbon sinks: utilization of carbon dioxide for the synthesis of chemicals and technological applications.», in Greenhouse Gas Sinks, CABI Books, 2007, p. 98–114.
[20] A. S. Agarwal, Y. Zhai, D. Hill e N. Sridhar, «The Electrochemical Reduction of Carbon Dioxide to Formate/Formic Acid: Engineering and Economic Feasibility.»,
ChemSusChem, vol. 4, p. 1301 – 1310, 2011.
[21] Y. Hori, «Electrochemical CO2 Reduction on Metal Electrodes.», Modern aspects of Electrochemestry, n. 42, 2008.
[22] H. J. Freund e M. W. Roberts, «Surface chemistry of carbon dioxide.», Surface
Science Reports, vol. 25, pp. 225-273, 1996.
[23] H. Noda, S. Ikeda, Y. Oda, K. Imai, M. Maeda e K. Ito, «Electrochemical reduction of carbon-dioxide at various metal-electrodes in aqueous potassium hydrogen carbonate solution.», Bulletin of the Chemical Society of Japan, vol. 63, n. 9, p. 2459–2462, 1990. [24] J. J. Wu, P. P. Sharam, B. H. Harris e X. D. Zhou, «Electrochemical reduction of carbon dioxide: IV Dependence of the faradaic ef ciency and current density on the micro- structure and thickness of tin electrode.», Journal of Power Sources, vol. 258, p. 189–194, 2014.
[25] J. J. Wu, F. G. Risalvato, S. G. Ma e X. D. Zhou, «Electrochemical reduction of carbon dioxide III. The role of oxide layer thickness on the performance of Sn electrode in a full electrochemical cell.», Journal of Materials Chemistry A, vol. 2, n. 6, p. 1647– 1651, 2014.
[26] Y. Ougitani, T. Aizawa, N. Sonoyama e T. Sakata, «Temperature dependence of the probability of chain growth for hydrocarbon formation by electrochemical reduction of CO2.», Bulletin of the Chemical Society of Japan, vol. 74, n. 11, p. 2119–2122, 2001.
[27] J. E. Huheey, E. A. Keiter e R. L. Keiter, Inorganic Chemistry: Principles of Structure and Reactivity, Pearson Education, 2006.
[28] Y. Hori, H. Wakebe, T. Tsukamoto e O. Koga, «Electrocatalytic process of CO selectivity in electrochemical reduction of CO2 at metal electrodes in aqueous media», Electrochimica Acta, vol. 39, n. 11-12, pp. 1833-1839, 1994.
[29] W. Li, «Electrocatalytic Reduction of CO2 to small Organic Molecule Fuels on Metal
Catalysts», in Advances in CO2 Conversion and Utilization, Washington, American
Chemical Society, 2010, pp. 55-76.
[30] S. Sakaki, «An ab Initio MO/SD-CI Study of Model Complexes of Intermediates in Electrochemical Reduction of CO2 Catalyzed by NiC12(cyclam)», Journal of American Chemical Society, vol. 114, pp. 2055-2062, 1992.
[32] M. Gattrell, N. Gupta e A. Co, «A review of the aqueous electrochemical reduction of CO2 to hydrocarbons at copper», Journal of Electroanalytical Chemistry, vol. 594, pp.
1-19, 2006.
[33] Y. Hori, R. Takahashi, O. Koga e N. Hoshi, «Electrochemical reduction of carbon dioxide at various series of copper single crystal electrodes», Journal of Molecular
Catalysis A: Chemical, vol. 199, pp. 39-47, 2003.
[34] I. Takahashi, O. Koga, N. Hoshi e Y. Hori, «Electrochemical reduction of CO2 at
copper single crystal Cu(S)-[n(111)×(111)] and Cu(S)-[n(110)×(100)] electrodes»,
Journal of Electroanalytical Chemistry, vol. 533, pp. 135-143, 2002.
[35] C. W. Li e M. W. Kanan, «CO2 Reduction at Low Overpotential on Cu Electrodes
Resulting from the Reduction of Thick Cu2O Films.», Journal of American Chemical Society, vol. 134, p. 7231−7234, 2012.
[36] A. Verdaguer-Casadevall, C. W. Li, T. P. Johansson, S. B. Scott, J. T. McKeown, M. Kumar, I. E. Stephens, M. W. Kanan e I. Chorkendorff, «Probing the active surface sites for CO reduction on oxide-derived copper electrocatalysts», Journal of the American
Chemical Society, vol. 137, n. 31, p. 9808–9811, 2015.
[37] Y. Chen, C. W. Li e M. W. Kanan, «Aqueous CO2 Reduction at Very Low
Overpotential on Oxide-Derived Au Nanoparticles.», Journal of The American Chemical
Society, vol. 134, pp. 19969-19972, 2012.
[38] C. H. Lee e M. W. Kanan, «Controlling H+ vs CO2 Reduction Selectivity on Pb
Electrodes», ACS Catalysis, vol. 5, n. 1, p. 465–469, 2015.
[39] T. Yamamoto, D. Tryk, A. Fujishima e H. Ohata, «Production of syngas plus oxygen from CO2 in a gas-diffusion electrode-based electrolytic cell», Electrochimica Acta, vol.
47, n. 20, pp. 3327-3334, 2002.
[40] M. Watanabe, M. Shibata, A. Kato, M. Azuma e T. Sakata, «Design of Alloy Electrocatalysts for CO2 Reduction III . The Selective and Reversible Reduction of
Formula on Cu Alloy Electrodes», Journal of The Electrochemical Society, vol. 138, n. 11, 1991.
[41] S. Sarfraz, A. T. Garcia-Esparza, A. Jedidi, L. Cavallo e K. Takanabe, «Cu-Sn Bimetallic Catalyst for Selective Aqueous Eletroreduction of CO2 to CO.», ACS Catalysis, vol. 6, pp. 2842-2851, 2016.
[42] D. Kim, J. Resasco, Y. Yu, A. M. Asiri e P. Yang, «Synergistic geometric and electronic effects for electrochemical reduction of carbon dioxide using gold-copper bimetallic nanoparticles.», Nature Communications, vol. 5, pp. 1-8, 2014.
[43] R. Reske, M. Duca, M. Oezaslan, K. J. P. Schouten, M. T. M. Koper e P. Strasser, «Controlling Catalystic Selectrivety during CO2 Electroreduction on Thin Cu Metal
Overlayers-», The Journal of Physical Chemistry Letters, vol. 4, pp. 2410-2413, 2013. [44] J. Qiao, Y. Liu, F. Hong e J. Zhang, «A review of catalysts for the electroreduction
of carbon dioxide to produce low-carbon fuels.», Chemical Society Reviews, vol. 2, 2014. [45] Y. Hori, H. Konishi, T. Futamura, A. Murata, O. Koga, H. Sakurai e K. Oguma,
copper-oxide electrodes.», Journal of Solid State Electrochemistry, vol. 11, n. 4, p. 554– 557, 2007.
[47] M. Fan e J. Qiao, «Challenges and perspectives of CO2 Electroreduction.», in Electrochemical Reduction of Carbon Dioxide: Fundamentals and Technologies., vol.
Chapter 2
2 CO
2Electroreduction on Au/Cu electrode
Initially, the research work was focused on the electrochemical deposition of different thicknesses layer of copper on a gold substrate.
Subsequently, the working electrodes, thus obtained, were used as electrocatalysts for the reduction of CO2 in an aqueous solution. The objective of the work was to get a
2.1 Results and discussions
2.1.1 Cu on Au deposition strategy
In order to construct an experimental procedure with certain operating conditions, an experimental study of the system consisting of the gold electrode and the electrode deposition solution was conducted.
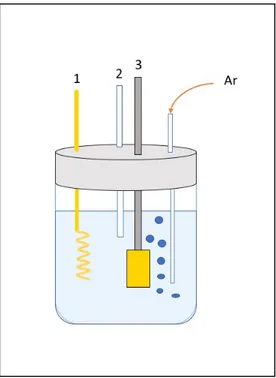
Figure 2-1. Schematic representation of the electrolytic cell used for the study of the redox deposition
system. (1) Au spiral counter electrode; (2) Hg/Hg2Cl2 reference electrode; (3) Au sheet as working
electrode; 50 mM H2SO4 and 5 mM CuSO4, Argon saturated electrolytic solution.
A previously prepared gold electrode was used as working electrode, in a three electrodes cell (Figure 2-1) filled with 45 mL of 50 mM H2SO4 and 5 mM CuSO4 solution.
A gold wire was the counter electrode, and a Hg/Hg2Cl2 electrode was used as reference.
After saturating the solution bubbling argon gas, the electrochemical system was investigated at a potential range from −0.5 to 1.8 V vs RHE with a scan rate of 10 mV s−1 by cyclic voltammetry. Subsequently, in order to detect the redox potential for the underpotential deposition of Cu on Au, a cyclic voltammetry was conducted in a potential window between 0.4 and 0.8 vs RHE with a scan rate of 10 mV s−1.
Figure 2-2. Deposition and dissolution of Cu on the gold polycrystalline substrate in 50 mM H2SO4 + 5
mM CuSO4. CV of bulk deposition of Cu on Au (blue line). CV of monolayer deposition (red line). Blank
acquisition in 50 mM H2SO4 solution (black-dash line).
In Figure 2-2 the voltammograms acquired are shown. Observing the blue line, we can locate the peak relative to the copper reduction from Cu2+ to Cu, in a range of potential
between −0.25 and 0.27 V vs RHE, with an anodic peak potential of 0.23 V vs RHE. Moreover, the reduction and oxidation peaks of gold are visible around 1.20 and 1.55 V vs RHE respectively [48]. Instead, observing the red line, we can locate the peak relative to the copper under potential reduction from Cu2+ to Cu, in a range of potential between 0.41 and 0.60 V vs RHE, with an anodic peak potential of 0.5 V vs RHE.
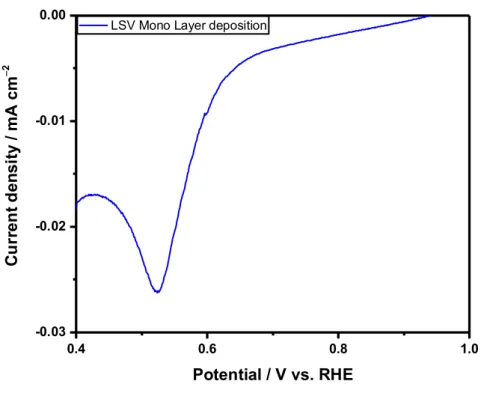
In order to obtain a full Cu monolayer deposition, a linear sweep voltammetry from 0.92 V to 0.40 V vs RHE (scan rate 10 mV s−1) was carried out (Figure 2-3). For each
deposition, the electrode was pretreated applying a potential of 0.92 V vs RHE for 20 seconds in the same solution.
-0.5 0.0 0.5 1.0 1.5 2.0 -2 0 2 4 6 8 C u rr en t d en si ty / mA cm -2 Potential / V vs RHE Cu reduction Blank
Cu under potential reduction
0.4 0.5 0.6 0.7 0.8 -0.10 -0.05 0.00 0.05 0.10 0.15 C urr ent d e ns it y / m A c m -2 Potential / V vs RHE
![Figure 1-2. Inventories and fluxes in the carbon cycle (2008 estimates) [7].](https://thumb-eu.123doks.com/thumbv2/123dokorg/7424480.99156/19.892.139.791.289.644/figure-inventories-fluxes-carbon-cycle-estimates.webp)
![Table 1.2. Physical and chemical properties of carbon dioxide [16].](https://thumb-eu.123doks.com/thumbv2/123dokorg/7424480.99156/24.892.158.708.213.954/table-physical-chemical-properties-carbon-dioxide.webp)
![Figure 1-4. Walsh diagram of CO 2 orbital energies in linear and bent geometries [22]](https://thumb-eu.123doks.com/thumbv2/123dokorg/7424480.99156/27.892.277.677.105.562/figure-walsh-diagram-orbital-energies-linear-bent-geometries.webp)