UNIVERSIT `
A DI PISA
Scuola di Dottorato in Ingegneria “Leonardo da Vinci”
Corso di Dottorato di Ricerca in
Ingegneria dell’Informazione
Tesi di Dottorato di Ricerca
The Internet of the Future:
Quality of Service and Energy Efficiency
SSD: ING-INF/03
Autore:
Gianfranco Nencioni
Relatori:
Ing. Rosario G. Garroppo
Prof. Stefano Giordano
Prof. Franco Russo
Copyright c Gianfranco Nencioni, 2012
Manuscript received February 28, 2012
S
OMMARIO
Una delle sfide pi`u importanti del ventunesimo secolo nel campo delle reti di telecomuni-cazioni `e la minimizzazione del consumo di energia fornendo congiuntamente una Qualit`a del Servizio (QoS). Pertanto, di recente la comunit`a di ricerca ha iniziato a studiare una serie di iniziative miranti a migliorare la QoS e l’efficienza energetica nell’Internet del futuro. In questo scenario, le Service Overlay Network (SON) sono emerse come un modo proficuo per affrontare questi problemi senza modificare l’infrastruttura sottostante. Invece, il Network Power Management (NPM) cerca i metodi che sono in grado di ottenere risparmi energetici sfruttando opportunamentele caratteristiche energetiche dei dispositivi di rete. In questa tesi, viene analizzato il problema della progettazione topologica di una SON dal punto di vista delle prestazioni. Poich`e la soluzione analitica del problema `e computazionalmente troppo complessa, si confrontano le prestazioni di un insieme limitato di topologie note. Sulla base di euristiche, tre nuove topologie overlay vengono proposte. Attraverso numerose simulazioni, le prestazioni delle topologie overlay candidate vengono valutate in diversi scenari di rete, tenendo conto del carico e del traffico accettato tra i nodi overlay. Inoltre, questa tesi si con-centra sul NPM descrivendo quattro problemi di progettazione di rete per ridurre il consumo energetico delle reti attuali e future. I problemi sono risolti per mezzo di risolutori MILP e MINLP, che ottengono delle soluzioni ottimali o approssimate. Dal momento che in scenari di reti di grandi dimensioni questi approcci sono computazionalmente troppo complessi, sono proposte varie euristiche per i diversi metodi di NPM. L’efficacia degli approcci proposti e dell’euristiche viene esplorata in diversi scenari di rete reali, valutando l’impatto di diversi parametri di rete. I risultati mostrano che le topologie SON sono un’ottima scelta perch`e mantengono le stesse prestazioni riducendo l’overhead associato. Inoltre, questa tesi mette in luce l’importanza di una buona caratterizzazione del comportamento energetico dei disposi-tivi di rete. Notevoli risparmi energetici possono essere raggiunti sfruttando le caratteristiche di potenza dei dispositivi. Le euristiche proposte sono in grado di ridurre il tempo di calcolo e di ottenere risparmi energetici comparabili.
A
BSTRACT
One of the most important challenges of the twenty-first century in the telecommunication network field is the minimization of the energy consumption jointly providing Quality of Ser-vice (QoS). Therefore, recently the research community started to study a set of approaches aimed at improving QoS and energy efficiency in the Internet of the Future. In this scenario, Service Overlay Networks (SONs) have emerged as a profitable way to address these issues without changing the underlying infrastructure. Instead, the Network Power Management (NPM) framework looks for methods which are able to achieve energy savings by suitably exploiting the power consumption features of energy aware network devices.
In this thesis, the topology design problem of a SON from a performance point of view is analyzed. Since the analytical solution of the problem is computationally too complex, we compare the performance of a limited set of well-known topologies. Based on heuristics, three new traffic demand-aware overlay topologies are also proposed. Through extensive simulations, the performance of the candidate overlay topologies is evaluated in different network scenarios, taking into account overhead and accepted traffic between the overlay nodes. Moreover, this thesis focuses on NPM by describing four power aware network design problems for reducing the power consumption of current and future networks. The problems are solved by means of MILP and MINLP solvers, which obtain optimal or approximated solutions. Since these approaches are computationally too complex in large network sce-narios, several heuristics are proposed for the different NPM methods. The effectiveness of the proposed approaches and heuristics is explored under different real network scenarios by evaluating the impact of several network parameters. The results show that the proposed SON topologies are a valuables option in the different analyzed scenarios because they maintain the same performance reducing the associated overhead. Furthermore, this thesis highlights the importance of well characterizing the power behavior of the network devices. Notable power savings can be only achieved by exploiting each power aware features. The proposed heuristics can reduce the computational time and obtain comparable power savings.
C
ONTENTS
Sommario i Abstract iii Contents v List of Figures 1 List of Tables 3 List of Algorithms 5 List of Publications 7 1 Introduction 9 1.1 Motivations . . . 9 1.2 Main contributions . . . 11 1.3 Outline . . . 112 Service Overlay Networks 13 2.1 Background . . . 13
2.2 Problem Statement . . . 15
2.3 Overlay Network Topologies . . . 17
2.3.1 Full-Mesh (FM) . . . 17
2.3.2 K-Minimum Spanning Tree (KMST) . . . 18
2.3.3 Mesh-Tree (MT) . . . 18
2.3.4 Adjacent-Connection (AC) . . . 19
2.3.6 Pruned Adjacent-Connection (PAC) . . . 22
2.3.7 Demand-aware Adjacent-Connection (DAC) . . . 22
2.4 Performance Analysis . . . 23
2.4.1 Simulations Settings . . . 23
2.4.2 Performance Metrics . . . 26
2.4.3 Simulations Results . . . 27
2.5 Conclusions . . . 37
3 Network Power Management 39 3.1 Background . . . 39
3.2 Literature review . . . 41
3.3 Problem formulations . . . 43
3.3.1 Power Aware Routing (PAR) . . . 45
3.3.2 Power Aware Network Design (PAND) . . . 46
3.3.3 Power Aware Routing and Network Design (PARND) . . . 46
3.3.4 Power Aware Routing and Network Design with Bundled Links (PARND-BL) . . . 47
3.4 Heuristic of the PAR problem . . . 47
3.5 Heuristic of the PARND problem . . . 50
3.6 Heuristics of the PARND-BNBL problem . . . 51
3.6.1 Time Limited PAR Heuristic (TLPH) . . . 53
3.6.2 PAR Meta Heuristic (PMH) . . . 54
3.7 Heuristic of the PARND-BL . . . 55
4 Performance Analysis of NPM 57 4.1 Evaluation of PAR problem and its heuristic . . . 57
4.1.1 Simulations settings . . . 57
4.1.2 Simulation results . . . 61
4.2 Evaluation of PARND problem and its heuristic . . . 66
4.2.1 Simulations settings . . . 66
4.2.2 Simulation results . . . 69
4.3 Performance analysis of PARND-BL problem . . . 75
4.3.1 Simulation settings . . . 75
CONTENTS vii
4.4 Evaluation of NPM models . . . 80
4.4.1 Simulation settings . . . 81
4.4.2 Simulation Results . . . 83
4.5 Evaluation of PARND-BNBL problem and its heuristics . . . 94
4.5.1 Simulation settings . . . 95
4.5.2 Simulation results . . . 95
4.6 Evaluation of PARND-BL problem and its heuristics . . . 101
4.6.1 Simulation settings . . . 101
4.6.2 Simulation results . . . 101
4.7 Conclusions . . . 106
5 Conclusions and perspectives 111
L
IST OF
F
IGURES
2.1 Backbone QoS Overlay with Intra-domain nodes . . . 15
2.2 Backbone QoS Overlay with Inter-domain nodes . . . 16
2.3 Full-mesh overlay topology . . . 18
2.4 Two-minimum-spanning-tree overlay topology . . . 19
2.5 Mesh-tree overlay topology . . . 20
2.6 Adjacent-connection overlay topology . . . 20
2.7 Two-shortest path tree overlay topology . . . 21
2.8 Pruned adjacent-connection overlay topology . . . 23
2.9 Demand-aware adjacent-connection overlay topology . . . 24
2.10 AND for a flat IP-layer network with N=300 . . . 28
2.11 BRR for a flat IP-layer network with N=300 . . . 28
2.12 DRR for a flat IP-layer network with N=300 . . . 29
2.13 ATWD for a flat IP-layer network with N=100 . . . 30
2.14 ATWD for a flat IP-layer network with N=300 . . . 30
2.15 AND for a hierarchical IP-layer network with N=600 . . . 31
2.16 BRR for a hierarchical IP-layer network with N=600 . . . 32
2.17 DRR for a hierarchical IP-layer network with N=600 . . . 32
2.18 ATWD for a hierarchical IP-layer network with N=100 . . . 33
2.19 ATWD for a hierarchical IP-layer network with N=600 . . . 34
2.20 AND for real network scenario with N=600 . . . 35
2.21 BRR for real network scenario with N=600 . . . 35
2.22 DRR for real network scenario with N=600 . . . 36
2.23 ATWD for real network scenario with N=600 . . . 37
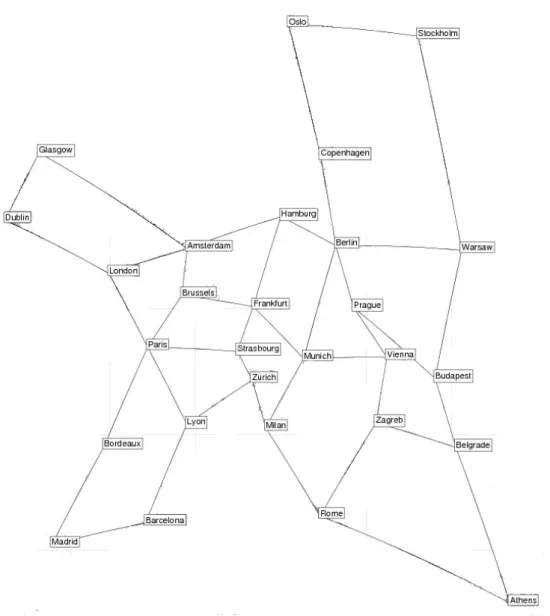
4.1 European core topology considered in the simulation study - nobel-eu . . . . 58
4.3 Power savings as a function of the TL and the approximation of cubic curve . 63
4.4 Energy savings and network topology - PAR Case . . . 64
4.5 Energy savings and network topology - DPRA Case . . . 65
4.6 Power consumption of node v, Pv,T (v)N = PvC+ Pv,T (v)RP . . . 67
4.7 Network topology of Exodus (US) . . . 68
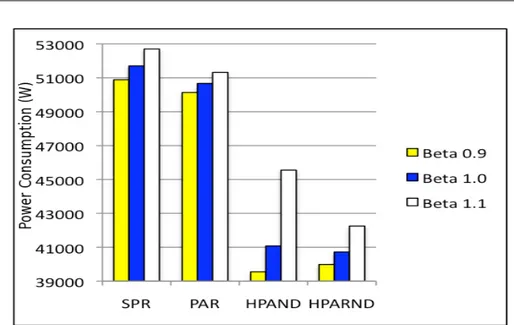
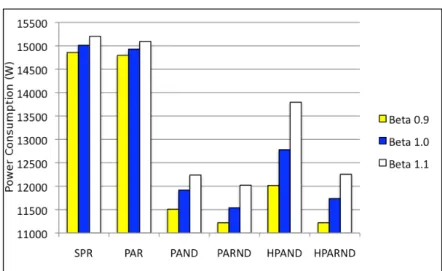
4.8 Power consumption vs. the compared strategies - nobel-eu Scenario . . . 70
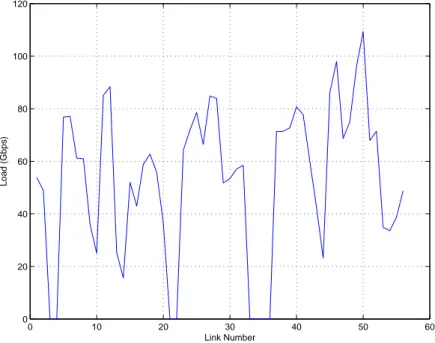
4.9 Load of the links forβ = 1.0 - nobel-eu Scenario . . . 71
4.10 Power consumption vs. the compared strategies - Exodus Scenario . . . 72
4.11 Load of the links forβ = 1.1 - Exodus Scenario, case HPAND . . . 73
4.12 Load of the links forβ = 1.1 - Exodus Scenario, case PAND . . . 74
4.13 Power Consumption vs. Bundle Size (Nuv∀uv ∈ E), α = 1.0 . . . 77
4.14 Power Consumption vs. Demand Factor (α), Nuv= 3∀uv ∈ E . . . 78
4.15 Power Consumption vs. Number of Core Nodes . . . 79
4.16 Histogram of the load of nodes with the SPR, PAR and PAND approaches -Abovenet Topology . . . 85
4.17 Histogram of the load of nodes with the SPR, PAR and PAND approaches -Exodus Topology . . . 86
4.18 Histogram of the PICs composing the powered on links - Exodus Topology . 87 4.19 Histogram of the PICs composing the powered on links - Abovenet Topology 88 4.20 Histogram of the PICs composing the powered on links - Sprintlink Topology 90 4.21 Histogram of the load of nodes with the SPR, PAND, PARND and PARND-BL approaches - Sprintlink Topology . . . 91
4.22 Histogram of the link utilization with the PAR, PAND, PARND and PARND-BL approaches - Sprintlink Topology . . . 92
4.23 Telekom Austria Topology . . . 96
4.24 Histograms of the load of nodes with the SPR, PAR and PARND-BNBL approaches - Abovenet Topology . . . 98
4.25 Power Consumption vs load factorα . . . 105
4.26 Power Consumption vs number of transit nodes . . . 107
L
IST OF
T
ABLES
4.1 Comparison of the computation times (in s) and the 99% CI . . . 62
4.2 Standard deviation of load of each network node after the SPR (Gb/s) . . . . 65
4.3 Power Consumption (W) . . . 76
4.4 Statistics of the Network Scenarios . . . 82
4.5 Number of PICs per Link . . . 83
4.6 Power Consumption (W) vs Topology . . . 84
4.7 Number of Powered On Links/PICs . . . 90
4.8 CPU times (s) . . . 93
4.9 Number of Paths per Flow (avg/max) . . . 94
4.10 Power Consumption and CPU time of TLPH vsγ . . . 97
4.11 Power Consumption (W) vs Topology . . . 99
4.12 Number of Powered On Link/PICs . . . 100
4.13 CPU times (s) . . . 100
4.14 Power Consumption (W) vs Topology . . . 102
4.15 Number of Powered On Network Elements (Nodes/Links/PICs) . . . 103
4.16 CPU times (s) . . . 103
L
IST OF
A
LGORITHMS
1 Dijkstra-based Power-aware Routing Algorithm . . . 48
2 Setδ . . . 48
3 Calculate CvMAX ∀v ∈ V . . . 49
4 Calculate CMAX uv ∀uv ∈ E . . . 50
5 Heuristic for the PARND problem . . . 51
6 PARND-BNBL Heuristic . . . 52
7 HPAR . . . 54
L
IST OF
P
UBLICATIONS
International Journals
1. Davide Adami, Christian Callegari, Stefano Giordano, Gianfranco Nencioni, and Michele Pagano, “Design and Performance Evaluation of Service Overlay Networks Topolo-gies“, Academy Publisher Journal of Networks (JNW), Vol 6, No 4, April 2011, Pages 556-566, DOI: 10.4304/jnw.6.4.556-566.
International Conferences
2. Rosario G. Garroppo, Stefano Giordano, Gianfranco Nencioni, and Maria Grazia Scutell`a, ”Network Power Management: models and heuristic approaches”, IEEE Global Telecom-munications Conference (GLOBECOM 2011), Dec 5-9, 2011, Houston,Texas, USA. 3. Christian Callegari, Rosario G. Garroppo, Stefano Giordano, Gianfranco Nencioni, and
Michele Pagano, ”Power measurement campaign for evaluating the energy efficiency of current NICs”, First International Workshop on Sustainable Internet and Internet for Sustainability (SustaInet), Jun 20, 2011, Lucca, Italy.
4. Rosario G. Garroppo, Stefano Giordano, Gianfranco Nencioni, and Michele Pagano, ”Energy Aware Routing based on Energy Characterization of Devices: Solutions and Analysis”, 4th International Workshop on Green Communications (GreenComm4), Jun 9, 2011, Kyoto, Japan.
5. Christian Callegari, Rosario G. Garroppo, Stefano Giordano, and Gianfranco Nencioni, ”A New Markov Model for Evaluating the ALR Dual-Threshold Policy”, 2nd Interna-tional Workshop on Green Communications (GreenComm2), Dec 4, 2009, Honolulu, Hawaii, USA.
6. Davide Adami, Christian Callegari, Stefano Giordano, Gianfranco Nencioni, and Michele Pagano, ”Design and Performance Evaluation of Service Overlay Networks Topolo-gies”, International Symposium on Performance Evaluation of Computer and Telecom-munication Systems (SPECTS 2009), Jul 13-16, 2009, Istanbul, Turkey.
7. Davide Adami, Christian Callegari, Stefano Giordano, Gianfranco Nencioni, and Michele Pagano, ”Topology Design of a Service Overlay Network for e-Science Applications”, INGRID 2009, Apr 1-3, 2009, Alghero, Italy.
Other works
8. Gianfranco Nencioni, Rosario G. Garroppo, Stefano Giordano, and Maria Grazia Scutell`a, ”Power Aware Routing and Network Design with Bundled Links”, Conference of Gruppo nazionale Telecomunicazioni e Teoria dell’Informazione (GTTI 2011), Jun 20-22, 2011, Taormina, Italy.
C
HAPTER
1
I
NTRODUCTION
1.1
Motivations
In the last decade, with the tremendous growth of multimedia technologies and the increasing popularity of real-time applications, the support of Quality of Service (QoS) in the Internet has been in a great demand and several architectures to provide QoS (e.g., Integrated Ser-vices (IntServ [18] and Differentiated SerSer-vices (DiffServ) [16]) have been proposed by the IETF (Internet Engineering Task Force). Nevertheless, the deployment of these approaches is unlikely to be feasible in the long run, because IntServ has scalability problems, and DiffServ can only provide QoS with very coarse granularity. Moreover, appropriate business models are difficult to be introduced, because the Internet Service Providers (ISPs) are only concerned with providing QoS in their own administrative domains. As a result, the current Internet basically provides only a best-effort packet delivery service.
Though, for provisioning a QoS-like features, current current networks are widely overpro-visioned. Considering that the current network equipments are not energy aware, i.e. they consume always the same energy when they are underutilized or not. The energy saving has become one of the most important challenges of the twenty-first century for environmental and economical reasons. From an environmental perspective, due to the lack of diffusion and efficiency of renewable energy, the reduction of power consumption is important because the production of energy is directly related to the emission of carbon dioxide (CO2), the main
reason of global warming. From an economical point of view, the incremental growth of the energy price and of the power demand of emerging countries makes energy saving a key issue to contain the increase of energy cost in various sectors (industrial, commercial, residential). Furthermore, we are witnessing an explosive growth in the use of Information and Communi-cation Technologies (ICTs) equipment that is rapidly becoming a major consumer of energy.
Indeed, according to the SMART 2020 study, CO2emissions from ICT are increasing at a
rate of 6% per year and with such a growth rate they could represent 12% of worldwide emissions by 2020 [30]. These trends are confirmed by other studies. As an example, the European Commission DG INFSO report [25] estimated European telcos and operators to have an overall network energy requirement equal to 14.2 TWh in 2005, which will rise to 21.4 TWh in 2010, and to 35.8 TWh in 2020 if no green network technologies will be adopted. Furthermore, the power consumption of Verizon during 2006 was 8.9 TWh (about 0.26% of USA energy requirements) [47], while the NTT group reports that the amount of electric power in fiscal year 2004 needed for telecommunications in Japan was 4.2 TWh [34]. In this scenario, the research community is studying a set of approaches for improving the energy efficiency in the Future Internet. Detailed and up to date surveys on the different ap-proaches investigated for an energy efficient networking are presented by the authors of [17] and [55]. Recent works on energy efficient networks have defined energy aware problems and have proposed solutions on two relevant aspects: the Network Device Design and the
Network Power Management.
The Network Device Design consists in devising energy efficient mechanisms implemented in network equipments, which leads to the design of energy aware network devices [32] [36]. In this field, we can mention two main approaches:
• the resource adaptation that attempts to reduce energy consumption by adapting the
power consumption to the provided resources (processing, bandwidth, etc.)
• the low power mode that provides the maximum resources during the active period to
maximize the idle period when the device is switched to a state characterized by a very low power consumption.
Examples of these approaches are Adaptive Link Rate (ALR) [32] and Low-Power Idle (LPI) [36] respectively, two mechanisms for reducing power consumption of Ethernet Network Card.
The Network Power Management (NPM) is expressed by methods aimed to achieve fur-ther energy savings by means of appropriate strategies, in terms of protocols and network control/management, that exploit the power consumption features of energy aware network devices.
If energetic improvements can be achieved by new devices and management techniques realized from scratch, the QoS improvements have to be obtained by means of solutions with a minimum impact on current and future Internet. Concerning this, Service Overlay
1.2 Main contributions 11
Networks (SONs) have emerged as a profitable way to provide QoS. A SON consists in a virtual network built on top of an IP network. A SON is composed of overlay nodes, which can be customized so as to build in complex features and to cooperate with each other in order to provide new services without any change to the routers of the underlying IP network. The overlay nodes can be connected each other by means of overlay link, which are logical links and really are IP-layer paths, usually composed of one or more physical links. Moreover, an overlay path consists of one or more overlay links.
1.2
Main contributions
This thesis is specifically focused on the design of SON topologies and on the study of NPM methods.
In particular, the topology design problem of a SON from a performance point of view is addressed. Since the analytical solution of the problem is computationally too complex, the performance of a limited set of well-known topologies is compared. Based on heuristics, three new traffic demand-aware overlay topologies are proposed. Through extensive simula-tions, the performance of the candidate overlay topologies is investigated in different network scenarios, taking into account overhead and accepted traffic between the overlay nodes.
Moreover, this thesis focuses on NPM by describing four power aware network design prob-lems, with related mathematical models, for reducing the power consumption of current and future networks. Each problem is based on different characterizations and power awareness of the network devices, leading either to Mixed Integer Linear Programming (MILP) models or to Mixed Integer Nonlinear Programming (MINLP) models. Given that these problems are NP-hard, several heuristics of the NPM methods are also. The effectiveness of the proposed approaches and heuristics is explored by performing extensive simulations under different real network scenarios and evaluating the impact of several network parameters.
1.3
Outline
The remainder of this thesis is structured as follows.
Chapter 2 addresses the topology design of SON. In particular, the basic concept of SON are outlined and the proposed topology design problem is formalized. Moreover, some existing SON topologies as well as the new overlay topologies are presented. Finally, a simulative
analysis to investigate the impact of the overlay topologies on performance and overhead is presented.
Chapter 3 introduces the problem of NPM. In particular, a set of general NPM models is presented and several heuristic approaches are proposed.
Chapter 4 analyzes the performance of the NPM models and the heuristics presented in the previous chapter. In particular, the effectiveness of the proposed methods and approaches is explored under different real network scenarios, by evaluating the impact of several network parameters.
Chapter 5 finally draws some conclusions for this thesis and discusses open issues and further perspectives for this research field.
C
HAPTER
2
S
ERVICE
O
VERLAY
N
ETWORKS
2.1
Background
In recent years, Service Overlay Networks (SONs) have emerged as a profitable way to facilitate the deployment of QoS-sensitive applications, such as VoIP, videoconference, online gaming, etc. A SON is a virtual network built on top of an IP network, whose nodes, the overlay nodes, can be customized so as to build in complex features and to cooperate with each other in order to provide new services without any change to the routers of the underlying IP network. Pairs of overlay nodes are connected by means of logical links, also known as overlay links, which really are IP-layer paths, usually composed of one or more physical links. Moreover, an overlay path consists of one or more overlay links. A distinguishing characteristic of SONs is that the overlay links could be overlapped at the physical layer even though they are completely separated at the overlay layer. Non-overlay traffic or other overlay links may pass through a part or a whole group of IP-layer links. This means that the overlay links capacities are not fixed and cannot be controlled by the overlay nodes. To obtain satisfactory performance, the overlay nodes need continuously probing the network, so as to obtain updated information on the status and performance of the overlay links.
SONs can be classified as End-user Overlay Networks and Backbone Overlay Networks. The first type of SON [12] [11] is constructed among the end hosts without any support from the intermediate network nodes. Though highly flexible, End-user Overlay Networks cannot guarantee end-to-end QoS, since the overlay links typically cross many intermediate Autonomous Systems (ASs), and the uncontrolled peering structure is unlikely to provide direct QoS support to the end-users. Due to these difficulties, the second type of overlay networks was introduced in several research works [24] [31] [48] [41] [40]. Usually managed by third parties, Backbone QoS Overlays may be classified in two different categories, based
on the overlay nodes location: either only at the edge (see [24] [31] [40]), or also in the core of different domains (see [48] [41]).
To optimize the performance and profitability of a SON, the first step is the selection of the best topology connecting the overlay nodes. When considering different topologies, it is necessary to understand how they affect the overlay routing performance and how to efficiently build overlay topologies connecting all the overlay nodes. Several works have focused on the selection of the best overlay links (e.g. [52]), but other issues, such as binding end systems to overlay access nodes [52], positioning the overlay nodes [35] [19] or choosing the right number of overlay nodes [19], have also been faced. In these studies, the overlay topology is usually represented as a graph and the topology design problem is expressed as an optimization problem. The general approach relies on the use of heuristic algorithms that allow finding a near-optimal solution.
Most works [52] [35] [26] [49] [57] analyze the topology design problem from an economic point of view with the aim to minimize the cost for the deployment of the SON. Only a few works [39] [42] deal with the SON topology design problem from a network performance perspective. In [39], the authors aim at finding the overlay topology minimizing a cost function which takes into account the overlay link creation cost and the routing cost. They also highlight how the traffic demand affects the creation of new overlay links. In [42], instead, the authors compare several existing and some new overlay topologies in terms of resilience.
In this thesis, the topology design problem is formalized by taking into account the traffic demand among the overlay nodes as performance metric to be optimized. Since this problem is computationally too complex, we investigate the performance and overhead of several candidate SON topologies by varying the number of overlay nodes and the IP network size. More specifically, three different models for the topology at IP-layer (flat, hierarchical, real) are taken into account and the performance of seven overlay topologies built on top of those IP networks is compared: four topologies are well-known since they have been already introduced in the literature, whereas the other three (K-Shortest-Path-Tree, Pruned Adjacent-Connection and Demand-aware Adjacent- Adjacent-Connection) are completely new.
In the performance evaluation, the best overlay topology is considered the one that, on equal terms of accepted traffic and performance, has the lowest overhead, due to the overlay network maintenance traffic.
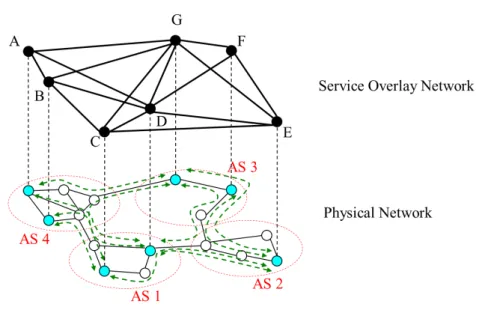
2.2 Problem Statement 15
Figure 2.1: Backbone QoS Overlay with Intra-domain nodes
2.2
Problem Statement
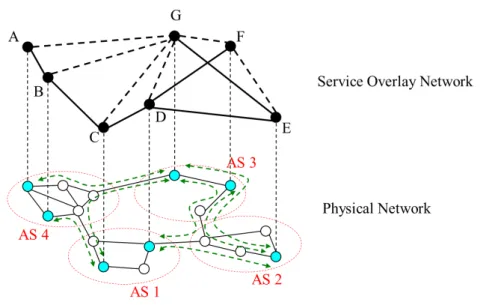
This thesis is focused on Backbone QoS Overlays with intra-domain nodes (Figure 2.1), where the overlay nodes can be placed either at the edge or in the core of each domain.
In the following, a more detailed description of this architecture is not provided, because it is out of scope. The chosen architecture, indeed, is only an instance used to evaluate the overlay routing performance when varying the overlay topology.
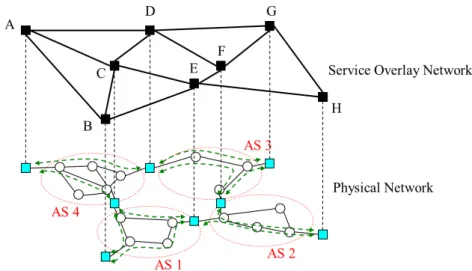
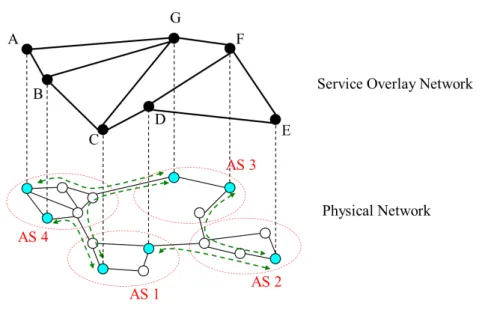
The experimental results obtained in this thesis are also valid in the case of Backbone QoS Overlays (see Figure 2.2) with Inter-domain nodes.
In the following, we suppose that:
• The location of the overlay nodes is pre-determined.
• The metric associated to each overlay link is the delay and the overlay path between a
pair of overlay nodes is selected by using the Dijkstra algorithm.
• Each overlay path is composed of IP-layer links. At IP layer, the cost of each link is
assigned in inverse proportion to the link bandwidth and the shortest path between a pair of IP nodes is computed by using the Dijkstra algorithm.
Figure 2.2: Backbone QoS Overlay with Inter-domain nodes
Therefore, the overlay topology construction problem can be formulated as follows. Let us consider:
• The IP-layer topology GP(VP, EP) where
– VPis the set of nodes.
– EPis the set of IP layer links.
– Nis the total number of VPnodes.
• A set of overlay nodes, VO, which is a subset of VP.
– Mis the total number of VOnodes. • The IP-layer path-link indicator function Pmn
i j , where Pi jmn= 1 if the IP-layer path
between m and n includes the IP-layer link i j.
• The overlay path-link indicator function Qxy
mn, where Qxymn= 1 if there is an overlay path
from x to y that includes the overlay link mn.
• The delay of the IP-layer link i j, Di j.
2.3 Overlay Network Topologies 17
The goal is to find the topology GO(VO, EO) (i.e., a sub-set of overlay links, EO) that
minimizes the cost function:
∑
i j Txy∑
mn Qxymn∑
i j Di jPi jmn (2.1)in which the end-to-end delay is weighted by the traffic demand, with the constraints:
• ∑mneomn ≤ d, where d is the maximal node degree and eomn = 1 if an overlay link
between m and n exists, eomn= 0 otherwise.
• ∑mnQxymn∑i jDi jPi jmn≤ δ , where δ is the overlay paths delay constraint. • ∑xyTxyQxymn≤ τmn, whereτmnis the available bandwidth of the overlay link mn.
It is worth highlighting that if popular or greedy nodes exist, the topology layout does not change, but such nodes are located at the centre, so as to minimize their latency with respect to the other nodes (see [43] for further details).
The degree constraint attends to limit the overhead associated to the overlay link monitoring (e.g., delay, available bandwidth, overlay traffic demand). Thus, if the node degree is higher, the overhead is greater.
2.3
Overlay Network Topologies
The problem formulated in the previous section is NP-hard and therefore it is too complex from a computational point of view. The basic idea behind our approach is to interconnect the overlay nodes by means of the most common network topologies and to choose the best topology with respect to a set of performance metrics.
This section lists the main features of several candidate topologies that appeared in litera-ture. Moreover, three new overlay topologies are proposed.
2.3.1
Full-Mesh (FM)
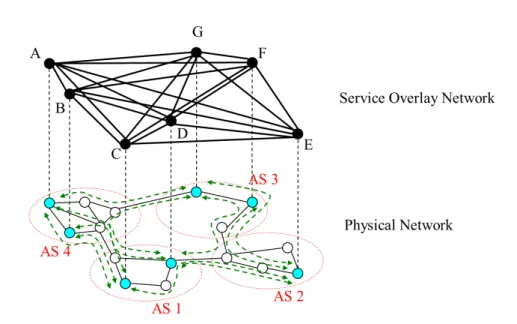
In the FM overlay network topology, each node is adjacent to all the other nodes at overlay layer. Therefore, every node has the same number of neighbours, i.e. the same node degree (d). As said previously, to retrieve information on the status and performance of the overlay links, every node has to periodically send probing packets to all the neighbours at overlay
Figure 2.3: Full-mesh overlay topology
layer. The FM topology is therefore characterized by the highest overhead, due to the overlay monitoring traffic. An example of FM topology is shown in Figure 2.3.
2.3.2
K-Minimum Spanning Tree (KMST)
A minimum spanning tree (MST) is the lowest cost tree among all the candidate trees con-necting a given set of nodes. A KMST overlay topology is composed of K MSTs, where the k-th MST of the composite graph is the MST of the initial graph excluding the edges of the previously computed MSTs. Therefore, the overlay links of the K trees are not overlapped. The K value can be chosen as a trade-off among cost, performance and node degree constraint. This approach has been proposed in [54] so as to minimize the overhead due to the amount of information exchanged for link monitoring. Figure 2.4 shows a 2MST, where the two trees are depicted with dashed and solid lines, respectively.
2.3.3
Mesh-Tree (MT)
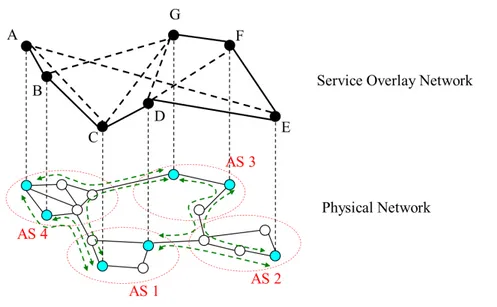
This topology (called Mesh-Tree in [42]) is obtained by joining the MST connecting all the overlay nodes with the set of overlay links connecting the overlay nodes that have a
2.3 Overlay Network Topologies 19
Figure 2.4: Two-minimum-spanning-tree overlay topology
grandchild-grandparent or uncle-nephew relationship in the MST. Figure 2.5 shows an MT overlay topology: the MST is represented with solid lines, whereas links joining nodes with a grandchild-grandparent or uncle-nephew relationship are dashed.
2.3.4
Adjacent-Connection (AC)
The Adjacent Connection (AC) topology relies on the knowledge of the IP-layer topology. The construction of the AC topology, proposed in [41] and [44], is based on the following condition: if no overlay node is directly connected to the nodes belonging to the IP-layer path between any pair of overlay nodes, an overlay link connecting this pair of overlay nodes is created. Figure 2.6 shows an example of AC overlay topology.
2.3.5
K-Shortest Path Tree (KSPT)
The K-Shortest Path Tree (KSPT) is first novel topology introduce in this thesis. It is con-structed taking into account the traffic demand among the overlay nodes. A SPT is made up of minimum cost paths from a node (root) towards all the other nodes. In this case, the metric is the overlay link delay. The choice of the K value, like in KMST, results from a trade-off
Figure 2.5: Mesh-tree overlay topology
2.3 Overlay Network Topologies 21
Figure 2.7: Two-shortest path tree overlay topology
among cost, performance and node degree constraints. A KSPT topology can be constructed as follows:
1. Initialize KT h= ceiling[M/3], K = 0.
2. Create a SPT for each overlay node.
3. Select the SPT whose root corresponds to the overlay node with the greatest traffic demand.
4. Add the SPT to the topology layout. Increment the value of K (K = K + 1).
5. Calculate the average node degree. If it is greater than the node degree constraint or
KT his reached, end. Otherwise, continue.
6. Select the SPT with minimum overlap with the created topology. Go to step 4. Figure 2.7 shows a 2SPT, where the two trees, with roots G and C, are depicted by using dashed and solid lines, respectively.
2.3.6
Pruned Adjacent-Connection (PAC)
The Pruned Adjacent-Connection (PAC), is a novel topology, which is proposed and con-structed for a real network scenario by exploiting the previous results obtained in flat and hierarchical network scenarios. PAC is a modified version of the AC topology, where some overlay links are deleted so as to reduce the node degree. In more detail. an overlay link is deleted if it connects two nodes with the highest degree. The number of overlay links to be deleted is determined by a fixed degree threshold, Th, which is proportional to M.
A PAC topology can be constructed as follows:
1. Create an AC topology and determine the degree of each overlay node. 2. Select the overlay node, i, with the highest degree.
3. Select the neighbour of i, j, with the highest degree.
4. Delete the overlay link between i and j, and update the node degree.
5. Calculate the average node degree. If it is greater than the threshold Th, go to step 2.
Otherwise, end.
Figure 2.8 shows an example of PAC overlay topology.
2.3.7
Demand-aware Adjacent-Connection (DAC)
As the previous one, the Demand-aware Adjacent-Connection (DAC), is a new topology aimed at a real network scenario as PAC. However, DAC allows to take also into account the traffic demand among the overlay nodes. DAC, like PAC, is a modified version of the AC topology, where some overlay links are deleted to reduce the node degree. In more detail, an overlay link is deleted if it interconnects two nodes with the highest traffic demand. Also in this case, the number of overlay links to be deleted is determined by a fixed degree threshold,
Th, proportional to M.
A DAC topology can be constructed as follows:
1. Create an AC topology, determine the degree of each overlay node, and calculate the aggregate traffic demand of each overlay node, as the sum of the incoming and outgoing traffic.
2.4 Performance Analysis 23
Figure 2.8: Pruned adjacent-connection overlay topology
2. Select the overlay node, i, with the lowest aggregate traffic demand and whose degree is greater than the threshold Th.
3. Select the neighbour of i, j, with the lowest aggregate traffic demand and with a node degree greater than the threshold Th.
4. Delete the overlay link between i and j, and update the node degree.
5. Calculate the average node degree. If it is greater than the threshold Thand i and j
exist, go to step 2. Otherwise, end.
Figure 2.9 shows an example of DAC overlay topology.
2.4
Performance Analysis
2.4.1
Simulations Settings
To compare the performance of the topologies described in the previous section, flat and hierarchical IP- layer topologies generated by means of BRITE [2] are considered.
Figure 2.9: Demand-aware adjacent-connection overlay topology
In the flat topology, the generation model to interconnect the nodes is based on the Wax-man’s probability [53]:
P(u, v) =α · eβ·L−δ (2.2)
where P(u, v) is the probability that a link between the nodes u and v is created,α (0 < α ≤ 1) andβ (0 < β ≤ 1) are Waxman specific parameters (in our simulations α = 0.03, β = 0.03), δ is the Euclidean distance between the nodes, and L is the maximum distance between any two nodes. The link bandwidth has been assigned according to a uniform distribution in the range [10, 1000]Mb/s. It is worth highlighting that this value does not represent the IP-layer link capacity, but the available bandwidth, since non-overlay traffic may pass through the same links. The link delay has been assigned in proportion to the link length.
To create a hierarchical random topology, a top-down approach that consists of the following three steps has been adopted:
1. Generate an AS-level topology according to the Waxmans model (for redundancy reasons, we setα = 1).
2.4 Performance Analysis 25
same parameters as for the flat topology.
3. Finally, use the random method to interconnect ASs asc dictated by step 1: if (i, j) is a link in the AS-level topology, then two nodes (u, v), randomly chosen from ASs (i, j), are interconnected at 512Mb/s.
Simulations have been carried out randomly associating overlay nodes with the generated IP-layer nodes and interconnecting them through one of the topologies described in Section 2.3.
For a fair comparison of the candidate topologies and to also meet the node degree constraint d, other research works modify the construction of the topology as follows: if an overlay node degree exceeds d in the resulting overlay topology, only the d closest neighbours overlay nodes are maintained, while the others are pruned. Since this approach dramatically affects the intrinsic nature of each topology, the overlay node degree is considered as a primary performance metric without changing the resulting overlay topology.
Moreover, the traffic demand is generated according to a uniform distribution normalized with respect to M, so that the overall traffic demand is statistically the same when the number of overlay nodes changes. A customized simulation environment has been developed by using C programming language. Three simulation scenarios have been considered:
1. The IP-layer topology is flat [N = (100, 150, 200, 250, 300)] and the number of overlay nodes changes [M = (10, 20, 40, 60, 80%)· N].
2. The IP-layer topology is hierarchical [N = (100, 200, 300, 400, 600), Number of ASs=4, Number of nodes per-AS=(25, 50, 75, 100, 150)] and the number of overlay nodes changes [M = (10, 20, 40, 60, 80%)· N].
3. A case study, corresponding to a “real network scenario” with a large hierarchical IP-layer topology [N=600, Number of ASs=4, Number of nodes per AS=150] and a small number of overlay node [M = (1, 2, 4, 6, 8%)· N].
The average value and the 99% confidence interval of each performance metric have been evaluated in the three scenarios by performing a set of 50 independent simulations for each pair (N, M).
2.4.2
Performance Metrics
To compare the performance of different overlay topologies, four parameters are introduced, each of them highlighting a specific topology feature.
• Bandwidth Rejection Ratio (BRR)
This performance parameter represents the probability that an overlay path with bandwidth and delay requirements can not be created due to bandwidth unavailability:
BRR =Number of bandwidth rejected end-to-end overlay paths
Total number of end-to-end overlay paths (2.3)
• Delay Rejection Ratio (DRR)
This performance parameter represents the probability that an end-to-end overlay path with bandwidth and delay requirements can not be created due to delay limitations although the bandwidth constraint could be satisfied:
DRR =Number of delay rejected end-to-end overlay paths
Number of bandwidth accepted overlay paths (2.4)
• Average Node degree (AND)
This performance parameter provides information on the topology overhead. If di is the
neighbours number of the i-th overlay node, AND can be defined as follows:
AND =∑ M i=1di
M (2.5)
• Accepted Traffic Weighted Delay (ATWD)
This performance parameter describes the capability of the topology to associate low delays to the highest traffic demands:
ATW D = ∑i j(Accepted traffic demand between the nodes i, j× Delayi j)
Total accepted traffic (2.6)
It is worth emphasizing that the ATWD is strictly related to the cost function (2.1) defined in Section 2.2. Indeed, the only difference is that the ATWD is normalized with respect to the accepted traffic. This normalization is necessary for a fair comparison, because the accepted traffic varies with the overlay topology.
2.4 Performance Analysis 27
2.4.3
Simulations Results
A different graph has been worked out for each performance metric in case of flat and hierarchical topologies. In the following, the simulation results concerning AND, BRR and DRR are reported only for the largest size of the IP-layer network, whereas as regards ATWD the results obtained for the smallest size of the IP-layer network are also reported, since the ATWD performance significantly varies with the number of IP-layer nodes. Since the experimental results obtained in the flat topology cases (see the following sub-section), show that KSPT outperforms the other topologies, the simulations with PAC and DAC topologies are only performed when the IP-layer network is hierarchical and in the real network sce-nario. The behaviour of both topologies is analyzed with two values of the degree threshold:
Th= (M/3, M/2) in the hierarchical IP-layer network casel, Th= (M/2, 2· M/3) in the real
network scenario case, respectively.
Flat IP-layer Network Model
Figure 2.10 shows the AND trend in a flat IP-layer network (N = 300) when M ranges from 0.10·N to 0.80·N. It is worth highlighting that the behaviour of this metric is not affected by the size of the IP-layer network, so these results may also be extended to IP-layer networks with a different number of nodes.
The graph outlines that MT always has the minimum node degree that remains constant independently of M.
Moreover, the AND of KMST and KSPT increases almost linearly with M, but KSPT outperforms KMST due to the different way K is selected and the mechanism used to limit the value of K when the AND is too high.
Concerning the AC overlay topology, at the beginning, the AND is the highest one and increases up to reaching a maximum value when M = 0.20·N. Afterwards, it starts decreasing and, when M≥ 0.60 · N, AC outperforms not only KMST, but also KSPT. Indeed, when M increases, it is more likely that another overlay node exists along the path between whichever pair of overlay nodes and therefore the number of overlay links decreases. The AND of FM (not reported in the graph) is always equal to M− 1.
Figure 2.11 reports the BRR average value and confidence interval for N = 300. As outlined in the graph, FM, KMST, AC and KSPT show a similar behaviour. MT, instead, always has the highest BRR. This result is in accordance with the node degree trend: since MT has the lowest node degree, also the overall available bandwidth is the lowest.
0 10 20 30 40 50 60 70 80 90 0 20 40 60 80 100 120 M (%N)
Average Node Degree
KMST MT AC KSPT
Figure 2.10: AND for a flat IP-layer network with N=300
0 10 20 30 40 50 60 70 80 90 35 40 45 50 55 60 65 70 75 M (%N) BRR (%) FM KMST MT AC KSPT
2.4 Performance Analysis 29 0 10 20 30 40 50 60 70 80 90 30 35 40 45 50 55 60 65 70 75 80 M (%N) DRR (%) FM KMST MT AC KSPT
Figure 2.12: DRR for a flat IP-layer network with N=300
Figure 2.12 shows the DRR trend. Also in this case, FM, KMST, KSPT and AC show a similar trend that decreases with M. Instead, MT has the worst performance, since its DRR values are always significantly higher than the ones obtained for the other topologies when
M≥ 0.20 · N. This is due to the lower node degree of the MT topology.
Finally, let us consider the ATWD parameter. By definition, this metric has low values when the overlay topology favours the creation of overlay paths with the lowest delay between the overlay nodes that exchange the largest amount of traffic. In a small size flat IP-layer network (see Figure 2.13), KSPT and MT perform better than the other topologies. On the contrary, as shown in Figure 2.14, in a large size flat IP-layer network MT sharply outperforms FM, KMST, KSPT and AC.
From the simulation results, we can infer that MT performs worse than the other overlay topologies because, although it is characterized by the lowest AND and ATWD metrics, the BRR has the highest values (see Figure 2.11) and therefore most of the traffic demand is rejected. In flat IP-layer networks, the overlay topology should be chosen based on the number of overlay nodes. If the number of both overlay and IP nodes is small, KMST is the best overlay topology. Instead, if the number of overlay nodes is small, but the IP-layer
0 10 20 30 40 50 60 70 80 90 0.26 0.28 0.3 0.32 0.34 0.36 0.38 0.4 0.42 0.44 M (%N) ATWD FM KMST MT AC KSPT
Figure 2.13: ATWD for a flat IP-layer network with N=100
0 10 20 30 40 50 60 70 80 90 0.58 0.6 0.62 0.64 0.66 0.68 0.7 0.72 0.74 0.76 M (%N) ATWD FM KMST MT AC KSPT
2.4 Performance Analysis 31 0 10 20 30 40 50 60 70 80 90 0 50 100 150 200 250 M (%N)
Average Node Degree
KMST MT AC KSPT PAC(Th=M/3) DAC(Th=M/3) PAC(Th=M/2) DAC(Th=M/2)
Figure 2.15: AND for a hierarchical IP-layer network with N=600
network size is large, the best overlay topology is KSPT. When the number of overlay nodes is large, AC is always the best overlay topology, because it performs in the same way as the other overlay topologies, but its AND is the lowest.
Hierarchical IP-layer Network Model
In a hierarchical IP-layer network, the AND behaviour (see Figure 2.15) is similar to that obtained for a flat IP-layer network. Nevertheless, the graph outlines that AC always has a lower AND than KMST. PAC and DAC allows reducing the AND only when M = 0.10· N and the reduction is in inverse proportion to Th.
Figure 2.16 and Figure 2.17 show the BRR and DRR behaviours for N = 600, respectively. Also in this case, the trends are similar to those obtained for flat IP-layer topologies and MT performs worse than all the other candidate topologies. However, it is relevant to highlight that, apart from MT, KSPT has the highest BRR and DRR and the performance difference among KSPT and FM, KMST, AC is greater for small and middle size overlay networks.
The BRR of PAC and DAC is the same as FM, KMST, and AC, instead the DRR is higher. When Th= M/3 PAC and DAC perform worse than KSPT. Basically, DAC performs better
0 10 20 30 40 50 60 70 80 90 76 78 80 82 84 86 88 90 92 M (%N) BRR (%) FM KMST MT AC KSPT PAC(Th=M/3) DAC(Th=M/3) PAC(Th=M/2) DAC(Th=M/2)
Figure 2.16: BRR for a hierarchical IP-layer network with N=600
0 10 20 30 40 50 60 70 80 90 5 10 15 20 25 30 35 40 45 50 55 M (%N) DRR (%) FM KMST MT AC KSPT PAC(Th=M/3) DAC(Th=M/3) PAC(Th=M/2) DAC(Th=M/2)
2.4 Performance Analysis 33 0 10 20 30 40 50 60 70 80 90 0.1 0.12 0.14 0.16 0.18 0.2 0.22 M (%N) ATWD FM KMST MT AC KSPT PAC(Th=M/3) DAC(Th=M/3) PAC(Th=M/2) DAC(Th=M/2)
Figure 2.18: ATWD for a hierarchical IP-layer network with N=100
than PAC, while DAC (Th= M/2) performs like FM, KMST, and AC.
Figure 2.18 and Figure 2.19 highlight that the ATWD parameter behaviour in small and large size hierarchical IP-layer networks, respectively, shows some differences with respect to the flat topology. Indeed, although the number of IP-layer nodes is increased, MT and KSPT do not exhibit any performance improvement as it occurred in case of a flat topology.
PAC and DAC perform better in small size hierarchical IP- layer networks and with a higher degree threshold.
In summary, also in hierarchical IP-layer networks, MT underperforms the other overlay topologies for the same reasons as in case of a flat network. As far as the remaining topologies are concerned, AC outperforms all the other topologies, due to the knowledge of the underlay topology which allows AC to reduce the node degree and, as a result, the overhead. PAC and DAC are two valuable alternatives to AC to further reduce the node degree, but a performance worsening occurs. More specifically, DAC performs better than PAC, highlighting the advan-tages of building traffic demand-aware topologies. Finally, the results of the simulations outline that KSPT is not a suitable topology for hierarchical IP networks, since it always performs worse than the other overlay topologies (except MT).
0 10 20 30 40 50 60 70 80 90 0.4 0.42 0.44 0.46 0.48 0.5 0.52 0.54 0.56 0.58 0.6 M (%N) ATWD FM KMST MT AC KSPT PAC(Th=M/3) DAC(Th=M/3) PAC(Th=M/2) DAC(Th=M/2)
Figure 2.19: ATWD for a hierarchical IP-layer network with N=600
Case study: real network scenario
Figure 2.20 shows the AND trend in a real network scenario when M ranges from 0.01· N to 0.08· N.
The graph outlines that the AND increases almost linearly with M for all the overlay topologies except for MT, which has the minimum AND that remains constant independently of M.
The AND of AC always have the maximum node degree. To be noted that PAC and DAC reduce the AND of AC. When the degree threshold is equal to 2 + M/3, PAC and DAC have almost the same AND as KMST.
Regarding KSPT, it outperforms KMST due to the reason explained in the previous sections. Figure 2.21 reports the BRR average value and confidence interval. As outlined in the graph, all the topologies show a similar decreasing behaviour. When M > 0.01· N, BRR is very low, because the overall traffic demand is low in this scenario. When M = 0.01· N the bandwidth request for each node is high due to the way used for generating the traffic matrix (see Section 2.4.1) and since it overloads the links, BRR assumes a significant value.
2.4 Performance Analysis 35 0 1 2 3 4 5 6 7 8 9 0 5 10 15 20 25 30 35 M (%N)
Average Node Degree
KMST MT AC KSPT PAC(Th=M/2) DAC(Th=M/2) PAC(Th=2M/3) DAC(Th=2M/3)
Figure 2.20: AND for real network scenario with N=600
0 1 2 3 4 5 6 7 8 9 −10 0 10 20 30 40 50 M (%N) BRR (%) FM KMST MT AC KSPT PAC(Th=M/2) DAC(Th=M/2) PAC(Th=2M/3) DAC(Th=2M/3)
0 1 2 3 4 5 6 7 8 9 50 55 60 65 70 75 80 85 90 M (%N) DRR (%) FM KMST MT AC KSPT PAC(Th=M/2) DAC(Th=M/2) PAC(Th=2M/3) DAC(Th=2M/3)
Figure 2.22: DRR for real network scenario with N=600
that decreases with M. Instead, MT has an increasing trend. To be noted that KSPT has the worst performance, while PAC and DAC have a worse DRR than AC, due to the introduction of the node degree threshold.
Figure 2.23 highlights that the ATWD behaviour, when the number of overlay nodes is very small (M = 0.01· N), depends on the overlay nodes position. All the overlay topologies have similar behaviour, only MT always has the minimum ATWD that remains constant independently of M.
To sum up, in a real network scenario MT does not underperform the other overlay topolo-gies as in the previous cases, even though it has the lowest degree. KSPT topology has an high DRR. As far as the remaining topologies are concerned, KMST outperforms all the other topologies, due to the large amount of available bandwidth (for M≥ 0.02 · N BRR ≈ 0) that allows it to exploit its ability of minimizing the global delay. Regarding the two novel topolo-gies, PAC and DAC, they have a lower degree than AC, so they have similar performance to KMST.
2.5 Conclusions 37 0 1 2 3 4 5 6 7 8 9 0.45 0.5 0.55 0.6 0.65 0.7 0.75 M (%N) ATWD FM KMST MT AC KSPT PAC(Th=M/2) DAC(Th=M/2) PAC(Th=2M/3) DAC(Th=2M/3)
Figure 2.23: ATWD for real network scenario with N=600
2.5
Conclusions
In this chapter, the topology design problem of SONs with performance requirements has been addressed taking into account both the traffic demand and the overhead. This problem has been theoretically formalized, but since it is computationally too complex, the perfor-mance of some reference overlay topologies has been compared and three new topologies, called KSPT, PAC, and DAC have been introduced. Through extensive simulations, the performance and overhead of each overlay topology have been investigated either when the IP-layer network model is flat or hierarchical and in a real network scenario.
The results presented in this chapter show that MT always performs worse than the other overlay topologies. Moreover, when the size of the flat IP-layer network is large and the number of overlay nodes is small, KSPT is a valuable option.
Instead, when the IP-layer network is hierarchical, the AC topology outperforms all the other network topologies, because it takes advantage of the underlay topology knowledge. Moreover, PAC and particularly DAC are two possible alternatives to the AC topology to reduce the node degree. Finally, in a real network scenario with a large amount of available
bandwidth, KMST outperforms all the other overlay topologies and MT does not underper-form the other overlay topologies as in the previous cases.
C
HAPTER
3
N
ETWORK
P
OWER
M
ANAGEMENT
3.1
Background
Generally speaking, the Network Power Management consists in determining the design and the routing strategies that permit to minimize the overall power consumption of a network by taking into account the power consumption of the network elements and the traffic demand among the nodes. Therefore, two critical issues can be devised in NPM: the time horizon characterizing the traffic demands and the power behavior of the network devices.
Regarding the first issue, the time scale of the NPM approaches should be peak/off-peak traffic periods. In fact, usually there are no significant changes in the traffic matrix within each peak and each off-peak period. Therefore, the off-peak period (or peak period) can be exploited for estimating the traffic matrix in the next peak period (or off-peak period) and then computing the solution to optimize the network power consumption. The duration of the peak/off-peak period is in the order of day/night, the maximum acceptable time for computing a NPM solution can be reasonably assumed in order of 6/12 hours.
Regarding the second issue, the energy characterization of the network devices is important because it determines what can be exploited to minimize the overall power consumption of the network. In this thesis, a general power consumption model of a router has been taken into account, which is composed of three main components [37]:
• chassis;
• route processor.
The chassis can be powered off (i.e. it works at a low power mode); the corresponding power consumption can be assumed constant if the chassis is powered on, and zero otherwise.
The energy consumed for transferring a bit from a node u to a node v is due to diverse components, such as the power consumed by the PIC in node u used to transmit the bit and that used by the PIC of node v to receive it. In the rest of the thesis, when considering traffic sent from a certain node u to a certain node v, the corresponding power consumption and the related capacity value will be associated with the PIC at node u, without distinguishing the power contributions given by the transmitter and the receiver PICs. Obviously, in the reverse direction, they will be associated with the PIC at node v. Furthermore, since in most actual scenarios the network operators try to use similar devices in their core network, we shall assume that the power consumption and the capacity of the PIC used to transmit along (u, v) are equal to those of the PIC used for transmitting along (v, u). However, in the case of a link connecting two nodes with diverse hardware features, the power consumption and the capacity of the PICs used to transfer the traffic in the two directions could be different. Each PIC can be powered off. In particular, there is a constant, non zero, power consumption when the PIC is powered on, and a zero power consumption when the PIC is powered off.
As far as the power consumption of the route processor is concerned, it generally depends on the traffic load of the router in a nonlinear way (see [56]). In [45], the authors present several possible behaviors:
• linear - switch architectures like Batcher, Crossbar and Fully-Connected; • logarithmic - equipments implementing hibernation techniques;
• cubic - equipments that use energy saving methods such as dynamic voltage and
dy-namic frequency scaling (DVS-DFS);
• on-off - almost the totality of current network equipments that consume always the
maximum power in every load condition.
Finally, in modern core networks pairs of routers are typically connected, for each traffic direction, by multiple PICs that form one logical bundled link [23]; this technique is called link aggregation and is standardized by IEEE 802.1AX [38]. Link aggregation technique is widely diffused because it allows one to easily upgrade the link capacity by adding new PICs, and to reach link capacities bigger than that available by using the current fastest technology.
3.2 Literature review 41
For example, a 40 Gb/s bundled link may comprise four OC-192 PICs with capacity 10Gb/s each. By taking into account the link aggregation technique, in this thesis the ability of each PIC of the bundled links to be powered off has been explored.
Based on the energetic and technological characterization of the network devices described above, four basic NPM problems, which will be deeply investigated hereafter, are listed as follows:
• PAR - Given traffic demands associated with the nodes, PAR consists in determining the
traffic routing strategy that permits to minimize the overall power consumption of the network, by taking into account only the power consumption of the nodes concerning the route processor;
• PAND - Given traffic demands associated with the nodes, PAND consists in
determin-ing the traffic routdetermin-ing strategy that permits to minimize the overall power consumption of the network, by considering the possibility to power off entire links and/or nodes of the network;
• PARND - Given traffic demands associated with the nodes, PARND consists in
deter-mining the traffic routing strategy that permits to minimize the overall power consump-tion of the network, by jointly considering the possibility of powering off entire links and nodes of the network, and the power consumption of route processor;
• PARND-BL - Given traffic demands associated with the nodes, PARND-BL consists
in determining the traffic routing strategy that permits to minimize the overall power consumption of the network, by even considering the possibility to power off single PICs of bundled links.
3.2
Literature review
Starting from the seminal work on the study of power efficient network devices presented by the authors of [33], recently many efforts have been devoted to define strategies aimed at reducing the power consumption of the whole network infrastructure, and not only the one of single or few components.
In this framework, a first set of works has been devoted to define models for the problem PAND, introduced in Section 3.1. In particular, the authors of [20] present first measurements
of power consumption of networking devices, and then evaluate the total network consump-tion of a certain network topology given the power footprint of each element. The authors propose a standard Capacitated Multicommodity Minimum Cost Flow (CMCF) formulation [29] for finding the minimum set of network elements to be powered on in order to guarantee the required service. However, the complexity of the proposed model grows very fast as the number of the devices increases. The model in [29] is thus very expensive to solve even for small networks. The authors of [21] study the strategies to concentrate network traffic on a minimal subset of network resources in order to power off network nodes and links while still guaranteeing full connectivity and maximum link utilization constraints. Furthermore, by taking into account strict constraints on the computational time, they provide efficient heuristics that permit to find an approximated solution in an acceptable computational time also in large network scenarios. A variation of this class of problems is presented by the authors of [27], which propose a simple heuristic to power off links when bundles of multiple physical cables are present.
A second set of works has been focused on the definition and the solution of PAR problem. The authors of [45] presented a study on the reduction of the overall power consumption that can be achieved when the energy profiles of the network devices are taken into account during routing and traffic-engineering operations. They consider coarse linear approximations of the power consumption of the network devices and, then use a linear programming solver (e.g CPLEX [5]). However, PAR is a nonlinear multicommodity flow problem, since the power consumption of energy aware network devices is generally a nonlinear function of their workload. Given this feature, the PAR problem should be modelled solved by means of a nonlinear programming solver such as Ipopt (Interior Point OPTimizer) [6], a software package for large-scale nonlinear optimization that implements an interior-point line-search filter method. This has been performed in this study, as reported in the next chapter.
A third set of works has been proposed aimed at jointly considering the power aware routing and the network design (PARND). In particular, the authors of [15] discuss the problem by considering different technology assumptions. However, differently from our work, they assume that nodes and even links have a linear energy behavior. Furthermore, this computa-tional study takes into account only the GEANT topology composed of 23 nodes and 74 links. Hence, differently from this work, they do not consider the impact of the network topology on the performance of the discussed solution. The authors of [13] propose a heuristic to solve the PARND problem. Differently from this study, they consider only the link energy consumption, which is assumed to be linearly proportional to the traffic that flows through.
3.3 Problem formulations 43
In this thesis, there are the preliminary ideas for modelling the nonlinear behavior of the routers based on the indications in [37]. In particular, the considered energy model is given by the sum of two constant addends associated with the power consumption of the chassis and the PICs, and one variable (nonlinear) element associated with the route processor.
On the other hand, none has proposed and solved a general NPM problem like PARND-BL, that permits to minimize the overall power consumption of a network by choosing a routing strategy that jointly exploits the power behavior of the route processors as well as the ability of powering off the chassis of the routers and all (or even single) PICs of bundled links.
The presented models have been evaluated by finding their optimal and/or approximated solutions and proposing new heuristic solutions.
An additional contribution of this thesis is to report the results of several wide computational experimentations, on several real network topologies, aimed at investigating the efficiency of the proposed power aware approaches from different perspectives.
3.3
Problem formulations
Let us introduce the parameters and the notation to define and formulate the power aware problems studied in this paper. The starting point of the analysis is a network modeled as a directed graph G = (V, E), where V denotes the set of the nodes and E is the set of the arcs, modelling the network links.
The following parameters are assumed to be given in order to characterize the power con-sumption of the network elements:
• PPIC
uv is the power consumption of a PIC that transmits traffic from node u to node v
(i.e., a PIC of link (u, v));
• PC
v is the power consumption concerning the chassis of the node v; • PRP
v,T (v)is the power consumption concerning the route processing of the node v at the
traffic throughput T (v); as justified before, hereafter Pv,T (v)RP is assumed to be a nonlinear function.
Since each logical link is generally composed of a set of PICs, the overall power consump-tion for the traffic transmission on a link (u, v) is equal to the number of powered on PICs, in node u connected to v, multiplied by PuvPIC. In other words, the maximum power consumption
associated with a directional link (u, v) is given by Nuv· PuvPIC, where Nuv is the maximum
number of PICs forming the bundled link that connects node u to node v. Concerning the traffic demand and the capacity of nodes and links, we define:
• D is the set of the origin-destination pairs of the traffic matrix;
• dsdis the traffic demand between the source node, s, and the destination, d; • CN
v is the capacity of node v; • CPIC
uv is the capacity of each PIC which composes the link (u, v); • CL
uvis the capacity of the link (u, v) (in the case of bundled link CuvL = CuvPIC· Nuv).
Three sets of variables are defined to state the NPM problems:
• fsd
uv is the amount of dsdflowing through the link (u, v);
• xv∈ {0,1} is set to 1 when the node v is powered on, and to 0 otherwise; • nuvis the number of powered on PICs which compose the link (u, v).
The traffic throughput of node v can then be defined as the total traffic entering v plus the flow originated from v, according to the following formula:
T (v) =
∑
(u,v)∈E(s,d)
∑
∈Dfuvsd+
∑
(v,d)∈D
dvd. (3.1)
Now the NPM problems addressed in this study can be presented, together with related mathematical models. The first problem is a power aware routing problem that, by assuming that all the nodes and all the PICs of the network are powered on, aims to route the traffic demands in such a way as to minimize the overall power consumption of the network. The
PAR problem leads to a nonlinear multicommodity flow model. The second problem, PAND,
considers the possibility to power off nodes and links of the network in order to reduce the overall power consumption. This is done by approximating the power behavior of the nodes to the worst case, so leading to a Mixed Integer Linear Programming (MILP) design and routing model. Problem PARND generalizes both PAR and PAND. In fact it addresses both the possibility of powering off nodes and links as well as the routing strategy, by however considering the true, nonlinear power behavior at the nodes. The corresponding model is therefore a mixed integer nonlinear programming model. Finally the last problem,