POLITECNICO DI MILANO
School of Civil, Environmental and Land Management Engineering Master of Science in Civil Engineering for Risk Mitigation
Acknowledging the complexity of data to assess buildings' seismic damage and vulnerability. Shifting towards enhanced methods and processes of data
collection and management.
Supervisor Professor: Eng. Maria Pia Boni
MSc. Thesis of: Nicolás Rueda Mojica
Matr. 913321
2
Abstract
The main objective of the present thesis is to study quality, availability, organization, and management of the seismic buildings’ damage data and the buildings’ seismic vulnerability data involved in the seismic models at a territorial scale, and to propose improvements respect the actual situation. The starting point was the categorization of the most relevant aspects that the data should have to be used effectively in the modeling of seismic risk/scenario of buildings, being considered also useful for analyzing existing damage databases, methodologies, platforms, and systems. These factors and indicators are then applied to evaluate the data flow in three methodologies (European Macroseismic Scale 1998, Hazus MH and the Vulnerability Index methodology - GNDT approach). Likewise, three databases (mainly for damage), two census databases, a platform, a methodology and a collecting system are evaluated using the studied indicators.
Finally, the study concludes with the analysis of the quality and characteristics of the data collected in the post-event (using the Aedes form) and in peacetime (Italian census 2011) to determine information related to structural damage, seismic vulnerability, and structural typologies, of the Marche 1997-1998 and Norcia 2016-2017 earthquakes. Moreover, a proposal of a database conceptual model for residential buildings damage data is presented.
Keywords: Buildings damage data, Seismic vulnerability data, Loss models, Data quality, Databases, Census data, Data collection.
3
Sommario
Lo scopo principale di questa tesi è quello di analizzare qualità, disponibilità, organizzazione e gestione di dati di danno sismico e vulnerabilità sismica di edificie proporne un miglioramento. Dati utilizzati nei modelli di calcolo di scenari e rischio sismico ad una scala territoriale. Questa analisi inizia con la classificazione dei principali aspetti che tali dati dovrebbero avere per essere efficacemente utilizzabili nei suddetti modelli, considerando, quindi, anche aspetti ed indicatori utili alla valutazione di database di danni, metodologie, piattaforme, sistemi di raccolta dati. Tali aspetti ed indicatori sono stati quindi applicati per la valutazione del flusso dei dati in tre metodologie (valutazione dei dati di input e output richiesti per la European Macroseismic Scale 1998, Hazus MH e la metodologia dell'Indice di Vulnerabilità - approccio GNDT). Inoltre, utilizzando gli aspetti in precedenza classificati, sono stati analizzati tre databases (principalmente di danni), due database censuari, una piattaforma, una metodologia ed un sistema di raccolta dati esistenti.
Infine, lo studio si conclude con l'analisi delle caratteristiche dei dati di danno raccolti nel post-evento (utilizzando la scheda Aedes), dei terremoti Marche 1997-1998 e Norcia 2016-2017, e in tempo di pace (censimento ISTAT 2011), per determinarne inoltre i possibili utilizzi nei modelli di vulnerabilità e sismica e valutazione dei danni. Inoltre viene anche proposto un modello concettuale di database relazionale relativo ai dati di danno di edifici residenziali.
Parole chiave: Dati sui danni agli edifici, Dati sulla vulnerabilità sismica, Modelli di perdita, Qualità dei dati, Database, Dati del censimento, Raccolta dei dati.
4
Acknowledgements
First and foremost, I would like to express my sincere gratitude to my professor and supervisor Maria Pia Boni for her counselling, supervision, and commitment
throughout the thesis process. Her knowledge, experience and advice were essential to complete my document.
In addition, I extend a special thanks to the Eng. Erika Ceriana Mayneri who was available and willing to present all the information and research carried out with the Erikus system. And the PhD student Anna Faiella for her help, and guidance, in the proposal of the last chapter dedicated to the relational database for residential
buildings.
This thesis is dedicated to Dolores, Luis Francisco, Teresa, Leonor, Carolina and all the people who have supported me throughout the process.
5
Index
Abstract... 2 Sommario ... 3 Acknowledgements ... 4 Index of Figures ... 7 Index of Tables ...10 Index of Equations ...11 1. Introduction ...122. Role of the vulnerability and damage data in the seismic risk modeling process: importance and characteristics ...15
2.1. Importance in modeling seismic risk ...15
2.2. Data organization factors. ...16
2.2.1. Accuracy ...16
2.2.2. Temporality - Phase of the event ...20
2.2.3. Data storage organization: databases quality characteristics ...25
2.3. Indicators. ...30
3. Seismic vulnerability and damage data: some methodologies and databases .33 3.1. Typological methodologies. ...33
3.1.1. European Macroseismic Scale 98 ...35
3.1.2. Hazus MH ...41
3.2. Single Building methodologies. ...49
3.2.1. Vulnerability index methodology – GNDT approach ...50
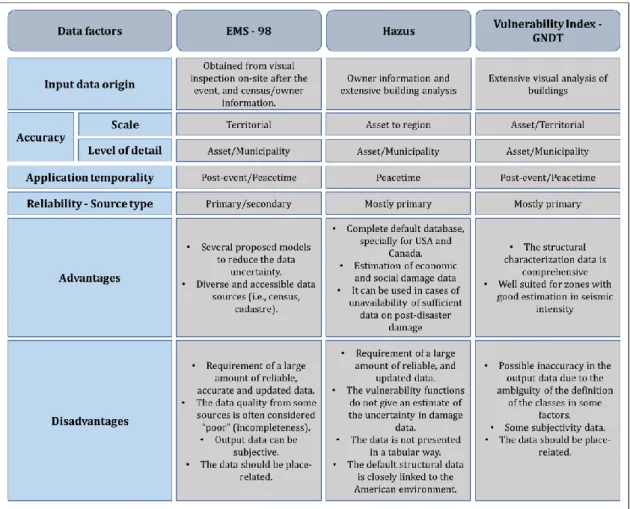
3.3. Comparison of the methodologies/scale ...54
3.4. Damage databases and data sharing methodologies, platforms, and systems. ...56
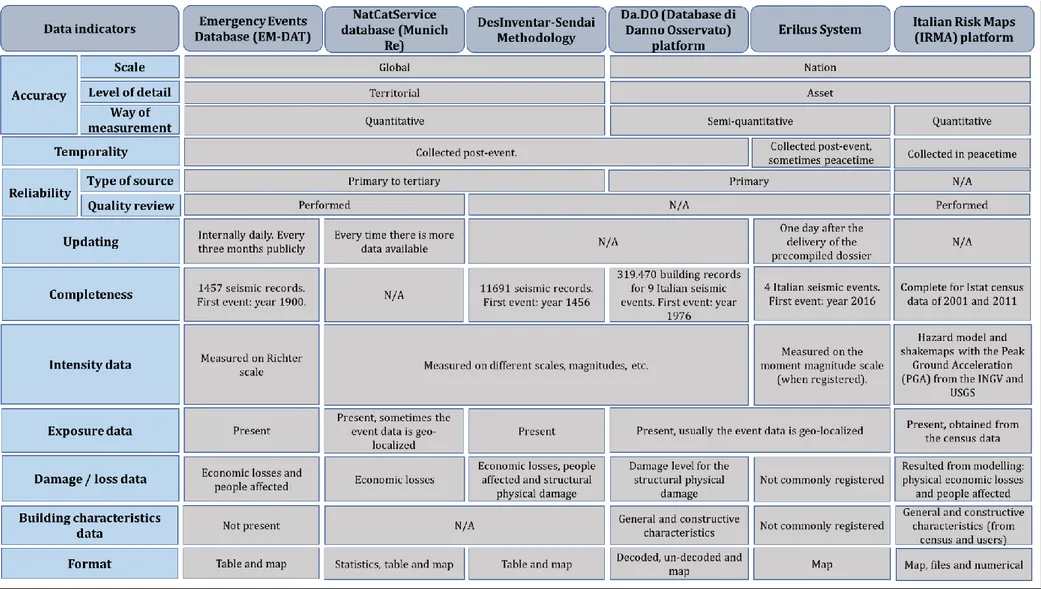
3.4.1. Emergency Events Database (EM-DAT) ...57
3.4.2. NatCatService database (Munich Re) ...60
3.4.3. DesInventar-Sendai Methodology ...64
3.4.4. Da.D.O. (Database di Danno Osservato) platform ...67
3.4.5. Erikus System ...70
3.4.6. Italian Risk Maps (IRMA) platform ...74
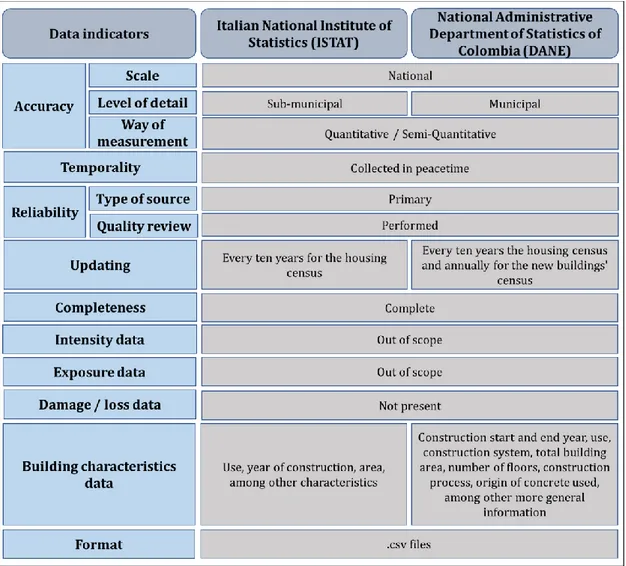
3.5. Census database. ...77
6 3.5.2. National Administrative Department of Statistics of Colombia (DANE)
79
3.6. Comparison of the databases/methodologies/platforms/systems. ...82
4. Damage and vulnerability data management: the case of Marche 1997 and Norcia 2016 ...84
4.1. Characteristics and possible uses of the available data. ...84
4.1.1. Da.D.O. damage data for the Marche region in 1997 ...84
4.1.2. Aedes data for the province of Norcia in 2016 ...88
4.1.3. Data from the 2011 census of Norcia ...91
4.2. Methodology to analyze the available data. ...95
4.2.1. Representativeness of the post-event data with respect to the census data 96 4.2.2. Identification of the relevant data for the assessment of typologies, damages, vulnerability, and visit’s level of completeness ...97
4.3. Results of the analysis of the available data. ... 102
4.3.1. Representativeness of the Norcia 2016 data in the census data... 102
4.3.2. Assessment of the data of typologies, damages, extra information, and visit’s level of completeness ... 106
5. Conceptual proposal for the assessment of the data: Relational database for residential buildings for structural damage and seismic vulnerability ... 114
5.1. Entities, attributes, and Entity Relationship Diagram ... 114
6. Conclusions and Suggestions ... 130
7. Bibliography ... 135
8. Appendices ... 147
Appendix 1. Building vulnerability and exposure form – GNDT (Ricci, 2017) .. 147
Appendix 2. EM-DAT database for earthquake damage data. Twenty most recent events (CRED, 2020) ... 151
Appendix 3. Disaster reporting form or Data card of DesInvetar-Sendai (UNDRR, 2020) ... 156
Appendix 4. Usability and damage in the seismic emergency’ form or Scheda di Agibilità e danno nell'emergenza sismica - Aedes (Protezione Civile, 2014) ... 157
7
Index of Figures
Figure 1-1. General scheme for the approach of the project...14
Figure 2-1. Data requirement for risk modelling (De Groeve et al., 2013). ...18
Figure 2-2. Vulnerability assessment for Da.D.O. Webgis (Dolce et al., 2018)...19
Figure 2-3. Pre and post disaster damage assessments (Menoni et al., 2017). ...21
Figure 2-4. Data management in the post-event (Mejri et al., 2017). ...24
Figure 2-5. Reliability of databases - Adapted from Grasso and Diley, 2016. ...26
Figure 2-6. Accessibility of databases - Adapted from Grasso and Diley, 2016...27
Figure 2-7. Concept map of the data organization factors. ...31
Figure 3-1. Fragility function for a medium height reinforced concrete moment frames in Macedonia (Castillo,2005). ...35
Figure 3-2. Quantity definition in the EMS-98 (Grünthal, 1998). ...36
Figure 3-3. Input-Output data in the EMS-98 scale for the three applications. ...37
Figure 3-4. Structural typology and vulnerability classes in the EMS-98 (Grünthal, 1998). ...39
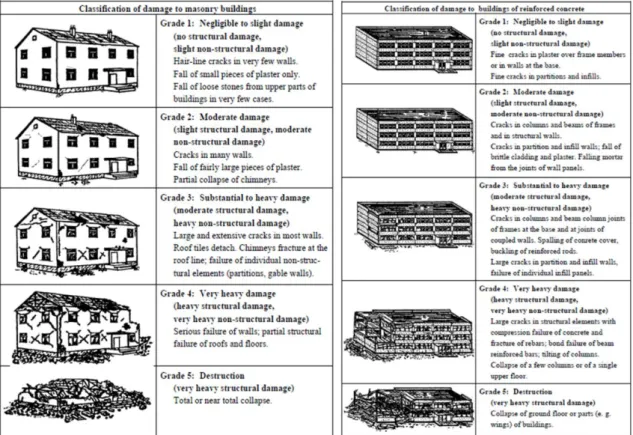
Figure 3-5. Masonry and reinforced concrete levels of damage in the EMS-98 (Grünthal, 1998). ...40
Figure 3-6. Hazus Earthquake Model Methodology (FEMA, 2020). ...42
Figure 3-7. Input-Output data in the Hazus methodology. ...43
Figure 3-8. Fragility functions in Hazus (FEMA, 2020). ...47
Figure 3-9. Building capacity and demand spectrum in Hazus (FEMA, 2020). ...47
Figure 3-10. Damage states in Hazus (FEMA, 2013). ...48
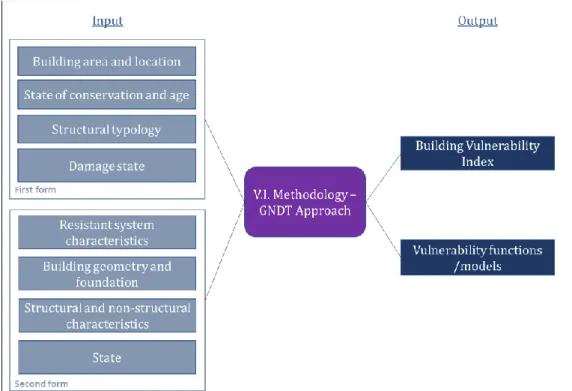
Figure 3-11. Input-Output data in the Vulnerability Index Methodology – GNDT Approach. ...50
Figure 3-12. Fragility functions (Vicente et al., 2009). ...53
Figure 3-13. Concept map of the data characteristics comparison of the presented methodologies. ...56
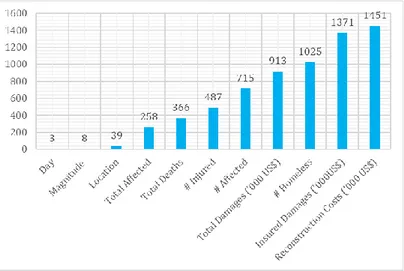
Figure 3-14. Void cells in some categories of the database for ground movement at EM-DAT, 03-Dic-2020. ...59
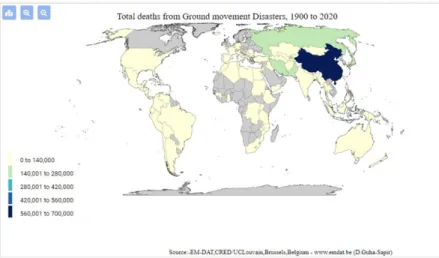
Figure 3-15. Data mapping tool of the EM-DAT, for total deaths from ground movement disasters of 02-Dic-2020 (Adapted from the EM-DAT database). ...60
Figure 3-16. Layout for the data introduction in NatCatService of Munich Re (Adapted from Hoeppe, 2009). ...61
Figure 3-17. Data introduction in NatCatService for a seismic event (UNDRR, 2005). ...63
8 Figure 3-19. Data Card with the location of the earthquake epicenter of the 27th of
February of 2017 in Huila, Colombia, Event UNGRD-2017-0049 (UNDRR, 2020). .67 Figure 3-20. Georeferenced data of the Da.D.O. database by 2017 (Dolce et al., 2017).
...70
Figure 3-21. Aedes form precompiled for the field survey. (Ceriana Mayneri et al., 2020). ...71
Figure 3-22. Erikus system interface of the usability data (Ceriana Mayneri et al., 2020). ...73
Figure 3-23. Exposure/vulnerability format to download from IRMA and comply (Borzi et al., 2020). ...75
Figure 3-24. Fragility functions format to download from IRMA and comply (Borzi et al., 2020). ...75
Figure 3-25. Damage/risk tool of IRMA platform (Borzi et al., 2020). ...76
Figure 3-26. Concept map of the data indicators comparison of the presented census data. ...82
Figure 3-27. Concept map of the data indicators comparison of the presented damage and vulnerability-related databases/methodologies/platforms/systems. ...83
Figure 4-1. Characteristic aspects to analyze the data. ...84
Figure 4-2. Possible uses of the data for Marche 1997. ...87
Figure 4-3. Possible uses of the data for Norcia 2016. ...90
Figure 4-4. Possible uses of the Produced Census for Norcia 2011. ...92
Figure 4-5. Possible uses of the Free Census for Norcia 2011. ...95
Figure 4-6. Concept map of the representativeness analysis for the Norcia data. ...96
Figure 4-7. Norcia 2016 data divided by residential and non-residential use. ... 102
Figure 4-8. Norcia 2016 data divided by the three main seismic events. ... 103
Figure 4-9. Percentage of buildings surveyed in each event with respect to the census data – Norcia 2016. ... 103
Figure 4-10. Classification of the “other structures” field in the Aedes form – Norcia 2016. ... 104
Figure 4-11. Affected buildings by typology– Norcia 2016. ... 105
Figure 4-12. Affected buildings by use and total– Norcia 2016. ... 106
Figure 4-13. Buildings by use – Marche 1997. ... 106
Figure 4-14. Precision levels of the typological data classification – Marche 1997. ... 107
Figure 4-15. Precision levels of the EMS-98 data classification – Marche 1997. ... 107
9 Figure 4-17. Precision levels of the extra information classification – Marche 1997.
... 108
Figure 4-18. Precision levels of the typological data classification for residential use – Norcia 2016. ... 109
Figure 4-19. Precision levels of the typological data classification for non-residential use – Norcia 2016. ... 110
Figure 4-20. Precision levels of the EMS-98 and Hazus data classification for residential use– Norcia 2016. ... 110
Figure 4-21. Precision levels of the EMS-98 and Hazus data classification for non-residential use– Norcia 2016. ... 110
Figure 4-22. Precision levels of the damage data classification for residential use – Norcia 2016. ... 111
Figure 4-23. Precision levels of the damage data classification for non-residential use – Norcia 2016. ... 111
Figure 4-24. Precision levels of the extra-information classification for residential use – Norcia 2016. ... 112
Figure 4-25. Precision levels of the extra-information classification for non-residential use – Norcia 2016. ... 112
Figure 4-26. Records fulfill for the visit accuracy’ field for residential use – Norcia 2016. ... 112
Figure 4-27. Records fulfill for the visit accuracy’ field for non-residential use – Norcia 2016. ... 113
Figure 5-1. Entity Relationship Diagram. ... 115
Figure 5-2. Economic loss for the damage entities – Adapted from the LODE project (Faiella et al., 2021)... 115
Figure 5-3. Damage dynamics of the Entity Relationship Diagram. ... 116
Figure 5-4. Event’s entity definition. ... 117
Figure 5-5. Assessment Survey’s entity definition. ... 118
Figure 5-6. Residential Building’s entity definition. ... 119
Figure 5-7. Components of five attributes of the Residential Buildings’ entity. ... 119
Figure 5-8. Inhabitants’ entity definition. ... 122
Figure 5-9. Other structures’ entity definition. ... 123
Figure 5-10. Road Network Category’s Entity Relationship Diagram (Faiella et al., 2021). ... 124
Figure 5-11. Damage to residential buildings’ entity definition. ... 125
Figure 5-12. Damage to people’s entity definition. ... 126
Figure 5-13. Damage to other structures’ entity definition. ... 127
10
Index of Tables
Table 2-1. Data characteristic indicators. ...32 Table 3-1. Damage probability matrix for a vulnerability class A (Castillo, 2005). .34 Table 3-2. Structural typologies in Hazus 4.2 SP3 (FEMA, 2020). ...46 Table 3-3. Score and weights for individual parameters in masonry (GNDT, 1993). ...52 Table 3-4. Distribution of the data record in Da.D.O. at 2018 (Adapted from Dolce et al., 2018). ...69 Table 4-1. Classification of the way of measurement for some data fields in Marche 1997 in Da.D.O. ...85 Table 4-2. Data accuracy and collection temporality in Marche 1997 in Da.D.O. ...86 Table 4-3. Classification of the quantitative and semi-quantitative way of measurement for some data fields in Norcia 2016...89 Table 4-4. Data accuracy and collection temporality for Aedes Norcia 2016. ...89 Table 4-5. Parameters to define typologies in Produced Census for Norcia 2011. ..91 Table 4-6. Data accuracy and collection temporality in Produced Census for Norcia 2011. ...91 Table 4-7. Data presented in the Free Census file for the building category in Norcia 2011. ...94 Table 4-8. Data accuracy and collection temporality in Free Census for Norcia 2011. ...94 Table 4-9. Representativeness analysis by categories of the Census. ...97 Table 4-10. Fields records suitable to define a general building typology in Marche 1997. ...98 Table 4-11. Fields records suitable to define a general building typology in Norcia 2016. ...99 Table 4-12. Precision levels for the building typology definition in each file. ...99 Table 4-13. Fields records suitable to define the EMS-98 and Hazus building typology. ...99 Table 4-14. Field parameters suitable to provide damage data in Marche 1997. . 100 Table 4-15. Field parameters suitable to provide damage data in Norcia 2016. ... 100 Table 4-16. Field parameters suitable to provide vulnerability data in Marche 1997 and Norcia 2016. ... 101 Table 4-17. Precision levels for the building vulnerability definition in each file. 101 Table 4-18. Fields to define the typology category – Norcia 2016. ... 104
11
Table 5-1. Construction details component’s list – Residential buildings’ entity. . 120
Table 5-2. Typologies list for the Vertical, Horizontal and Roof components – Residential buildings’ entity. ... 121
Table 5-3. Position options – Residential buildings’ entity. ... 121
Table 5-4. Soil characterization options – Residential buildings’ entity. ... 121
Table 5-5. Age categories – Inhabitants’ entity. ... 123
Table 5-6. Use categories – Other structures’ entity. ... 124
Table 5-7. Type categories – Damage to Residential buildings’ entity. ... 125
Table 5-8. System’s position categories – Damage to Residential buildings’ entity. ... 125
Table 5-9. Type categories – Damage to other structures’ entity. ... 127
Table 5-10. Level categories – Damage to other structures’ entity. ... 127
Table 5-11. Type categories – Damage to utilities infrastructures’ entity. ... 128
Index of Equations
Equation 5-1. Direct Economic loss for the housing target C4 in the Sendai Framework (UNISDR, 2017). ... 122Equation 5-2. Economic value of loss in houses damaged, or C4a, in the Sendai Framework (UNISDR, 2017). ... 122
Equation 5-3. Economic value of loss in houses destroyed, or C4b, in the Sendai Framework (UNISDR, 2017). ... 122
Equation 5-4. Number of people affected by damaged houses, or B3, in the Sendai Framework (UNISDR, 2017). ... 128
Equation 5-5. Number of people affected by destroyed houses, or B4, in the Sendai Framework (UNISDR, 2017). ... 128
12
1. Introduction
Over time many natural disasters have occurred, leaving new lessons and observations that allow the evolution and proposal of the models (Grossi et al., 2008). Events such as the Hurricane Andrew 1992 or the Northridge Earthquake in 1994 have exposed the need for more sophisticated models that have high resolution data. Furthermore, these events have highlighted the problems of incompleteness or inaccuracy that the data has (Grossi et al., 2008).
Incompleteness and inaccuracy are not the only quality issues the data can have. Considering the seismic models developed for the various aspects related to the phenomena and/or their impact on a territory, data quality problems may be due also to aspects such as precision, temporality, availability, sharing, and interoperability. Moreover, the way in which the data is evaluated can be done from various perspectives.
As an example, concerning the buildings vulnerability data at territorial level, one of the main problems is to determine the characteristics of buildings, since this information is very often difficult to be obtained, incomplete or out of date, especially for large areas or a large sample of buildings. The data could have many formats (paper forms, Excel files, etc.), and in the case of paper forms, the information requires one more step to be digitized, as in the case of AeDES forms in Italy. Furthermore, the characteristics necessary to define the vulnerability of a building vary according to the methodology used and requires different levels of detail and quantity.
Changing perspective and moving to structural damage, the data can be derived by models, as scenarios, or collected after an event. When it comes by a model application, the data can be of different types depending on factors such as the methodology considered, the elements included in the model or the involved disciplines.
Regarding the damage data collected after an event, the collection could follow a non-systematic methodology, since the data could respond to the requirements of the end user (Mejri et al., 2017), and the result tends to be non-uniform and reprocessed for analysis (Colombi et al., 2008). Institutions, such as the Joint Research in 2015, have proposed indicators that could help standardize the procedure for recording and collecting damage/loss data; however, no specific agency or staff has been selected to coordinate this process and the subsequent use of the data. (Gall, 2017).
13 All this demonstrates the high level of complexity that the collection and management of this kind of data can have, even in its exchange between researchers from different countries due to factors such as the terminology and language used (Dolce et al., 2004).
Considering the issues so far introduced, the objective of the present thesis, is to study quality, availability, organization, and management, of the buildings’ damage data, calculated, or collected after an event, and the buildings’ seismic vulnerability data involved in the seismic models at a territorial scale. The actual situation of all these aspects will be analyzed, using also real cases data, and proposal for improvements, will be then presented. Other important data of the seismic phenomenon (such as hazard assessment, exposure, etc.), are not part of the scope of the thesis, and their study could involve other relevant and complex aspects that are not going to be studied in this document.
The strategy to address the objective is shown in Figure 1-1. The first step is the presentation of the problem and corresponds to chapter 2. It consists of classifying and evaluating the main characteristics of the required data for the modeling of the seismic risk/scenario for buildings at a territorial level, the main factors to be considered for its management and the indicators that must be taken to carry out an evaluation of the quality of a database. A global vision will be handled but focusing on the main aspects that affect the damage and vulnerability data.
The second step (chapter 3) is the study of buildings vulnerability and seismic damage data, by the presentation of cases related to the way in which the data is actually used, collected, and stored. So, the data flows in three methodologies: two “typological approaches” (EMS 98 and Hazus) and one related to single building (Vulnerability Index Method - GNDT approach) will be studied. The following aspects will be addressed: how damage is measured, what are the relevant characteristics to define vulnerability, and the assumptions made. Likewise, databases (EM-DAT, Munich Re, Da.D.O.), census data (Italian and Colombian), platforms, (IRMA), methodologies (DesInventar-Sendai), collecting systems (Erikus) will be analyzed using as a basis the data indicators discussed in Chapter 2.
The third step is presented in chapter 4 and analyzes how the quality of the real data is, with two events: Marche 1997 and Norcia 2016 in Italy. This analysis will examine the quality of the data to produce damage and vulnerability information when it is recollected after an event (with the Aedes form for these two events) and also using the Norcia Census data.
14 The fourth step is the fifth chapter, where a conceptual framework to design a relational database for the management of damage data and seismic vulnerability of residential buildings is proposed. And lastly, chapter 6 is related to the conclusions and suggestions.
15
2. Role of the vulnerability and damage data in the seismic risk
modeling process: importance and characteristics
2.1. Importance in modeling seismic riskOver the years, different damage models have been proposed to estimate the impact of a seismic event on a territory, and in particular the effects on buildings. These models in general terms, represent the combination of hazard, exposure, and vulnerability analysis and require different types of data for their assessment. These three aspects are essential to determine the level of damage, however, events such as the earthquake in Southern Italy 1980 (Corsanego and Gavarini, 1993), New Zealand 2010 (Wallemacq et al., 2018) or Haiti 2010 (Bevere et al., 2019) have highlighted the influence of vulnerability in risk modeling and damage determination. These events also demonstrate the possible difficulties of having data at the territorial scale.
The definitions of vulnerability are many and depend on several factors, for this thesis, vulnerability can be understood as the predisposition of an object, or a system, to be damaged by a seismic event, being an intrinsic characteristic of the element. But the variety of ways to describe vulnerability has led many authors to propose different models to address it.
Vulnerability models consider data that interacts at a spatial, temporal, and functional scale (Cardona et al., 2012), with varied information sources (such as empirical or historical), different formats (i.e., paper forms, digital, georeferenced, Excel, etc.) and involve the largest amount of available and relevant data (such as composite indicators or damage functions). However, the data presents gap problems, and is rarely found in the desired quality and quantity (Mejri et al., 2017), which generates a level of uncertainty that the models must face, and that is still being debated.
One of the main ways to reduce this uncertainty is by comparing the model results with the actual effects of earthquake damage. This raises the fact that damage data is an important source of information for vulnerability assessments and/or for their validation (Schneiderbauer et al., 2017), and shows the direct relationship between damage and vulnerability data. Nevertheless, this damage information is often presented as a partial inventory of buildings, is only available for single towns/regions/provinces, and with poor data quality (Bessason and Bjarnason, 2015).
16 Another way to reduce data uncertainty, proposed by the Sendai Framework in the priority 1, focuses on the way data is handled. The data should be collected and evaluated periodically, and it must include georeferenced information on vulnerability that allows a better understanding of the risk (UNDRR, 2015).
For this reason, the characteristics of vulnerability and damage data are crucial in seismic damage models and have been extensively studied. In this thesis, the approach to be used for the vulnerability and damage data is carried out from a typological perspective at a territorial scale. Moreover, aligned with the data management priority of the Sendai Framework, the quality characteristics of the possible databases are presented.
2.2. Data organization factors
Before discussing the different vulnerability and damage methodologies and databases (Chapter 3), it is useful to examine the different characteristics of the data. In this sense, it will be carried out from three perspectives: accuracy, temporality, and quality characteristics.
2.2.1. Accuracy
The impact of natural events varies in space, having a possible impact from a small population to an entire region (without counting the cascade effect in areas far from the event). This usually entails that the first step in a seismic analysis is the accuracy quality definition when data related to seismic risk or scenario processes have to be collected, searched, or used. The term accuracy represents the legitimacy, precision, and authenticity with which the information is required (Maslin et al., 2010).
The required level of precision is relative to the use of the data. However, it is going to be analyzed from two approaches: its geographical scale, and its level of detail or granularity.
The scale is here considered as the extension of the geographic area involved in the model’s applications and/or data collection after an event. Different geographical extension levels can be considered. As example, De Groeve et al., 2013 defined, for the disaster losses data, five levels for their study ranging from the smallest to the largest entity to be analyzed (the term they used to coin this attribute was "scope"):
17 a) Asset. b) Municipality. c) Region. d) Nation. e) Global.
Regarding these five scale levels, there is another term often associated called the geographic Minimum Reference Unit (MRU). The geographic MRU is the smallest scale level used in the model or application performed. For the hazard, exposure and vulnerability data must be at least the same as level of application of the model, although it is preferable to have it at a previous level for greater precision (Zuccaro, 2015). This could be considered the biggest problem, since most catastrophic events occur at the municipality-region level, international damage databases do not register on a municipal or asset extent (Joint Research Center, 2015), and the vulnerability data at the local level does not exist at the sufficient resolution (Schneiderbauer et al., 2017).
For the global scale, since 2009, there is a non-profit foundation in Pavia (Italy) called Global Earthquake Model that seeks to help all the countries to generate a seismic risk model in a standardized, reliable, and collaborative way with geospatial open data (GEM, 2020).
The territorial scale is not defined in these five levels, as it is a term mainly used in urban planning for the analysis of information at the regional and sub-regional level (Zuccaro, 2015), or urban and regional level (Galland and Elinbaum, 2015), and with these concepts the "territorial" scale is defined in this study.
On the other hand, the level of detail or granularity is understood as the precision with which the data is recorded (De Groeve et al., 2013), having the exact five levels of classification of the scale. This factor is normally handled with the scale, as they define the quality and specificity of the outcome.
This relationship is relevant for data management when there is information on a smaller scale than the level of detail of the original data, since in these cases there may be a lack of information, a bad record and/or the existing data has been inferred. The favorable case is when both factors handle the same level of detail, or the granularity has a smaller level than the scale, for example, in the case of the municipal scale, the level of detail is asset. In the case of databases, a database will be better when the data is generalized from a smaller level of detail, than inferred from a more generalized level.
18 In regard to risk modelling, the scale and granularity of the data depend on the model being used and the desired result. The structural vulnerability in these models should have an asset level of detail, in order to improve the earthquake models and building codes. In the Figure 2-1 (De Groeve et al., 2013), the requirements of some approaches are shown.
Figure 2-1. Data requirement for risk modelling (De Groeve et al., 2013).
Assessing this asset level of precision for structural vulnerability can become a problem. Nevertheless, there are approaches, especially for damage data, that provides a fine level of detail, and a preliminary assessment of its severity. This approach is related to databases with a Geographic Information System - GIS (Saint-Martin et al., 2018). GIS is a framework to manage the geographic data and share it in maps. This way of handling the data allows a more precise and rapid analysis of the damage and vulnerability data in buildings, since this information can be related to specific positions in the territory.
Another problem with the structural vulnerability data is the data itself. The vast majority of databases and information open to the public focus solely on damage data, and do not include seismic vulnerability. The information needed to define the seismic vulnerability in many cases is not standardized, disseminated, and/or not available to the public.
An example that involves data on vulnerability and damage, is the Database of Observed Damages or Database di Danno Osservato - Da.D.O., created by the National Civil Protection Service of Italy from the data of the earthquakes from 1976 to 2013. The information on damage and vulnerability was compiled based on the information accumulated in the different usability forms available at that time from different earthquakes. In the Figure 2-2, the vulnerability classification of buildings
19 with the European Macroseismic Scale 98 produced by Da.D.O.. is presented (Dolce et al., 2018).
The construction of this database showed the problems of dissimilarities in the vulnerability data of different survey-formats, which generated comparability problems, an uncertainty of 5-10%, and disaggregated output data (Dolce et al., 2018). Additionally, Da.D.O. is not open to the public, but can be accessed by users working in universities or research centers after a request.
Figure 2-2. Vulnerability assessment for Da.D.O. Webgis (Dolce et al., 2018).
The dissimilarities in Da.D.O. damage and vulnerability data were typically due to the formats scale to measure the buildings damage (prior to the European Macroseismic Scale 1998, survey formats had 6 to 8 levels of damage), and the characteristics definition of the buildings in the survey forms (i.e., the Friuli 1976 form had 4 types of vertical structures and the Emilia 2012 form had 7 types). Additionally, each survey form has a different way of measuring the data, having some sections with numerical values and other sections with descriptive classifications.
This way of measuring data can be an important factor in data handling and accuracy. Among the different approaches to classify these ways of measuring data, this thesis three categories will be used: qualitative, quantitative, and semi-quantitative. Each of these categories has its advantages and disadvantages, without one being absolutely better than the other to measure data.
20 The first way of measuring data, or the qualitative category, generally seeks to describe or characterize textually without being directly linked to a more precise numerical classification (FAO and WHO, 2009). In the case of data on damage and vulnerability, Yépez et al., 1996 said that in the Italian method of the Vulnerability Index (presented in section 3.2.1), the factor of location and foundation of the building in the second level of the forms is measured in a textual/qualitative way without generating a numerical rating. Likewise, a qualitative classification can be seen in the definition of the different building typological categories of the European Macroseismic Scale 1998.
This qualitative way of measuring the data cannot require as much information as the quantitative one (FAO and WHO, 2009), but on the other hand, it can become very subjective and not so precise as it is not linked to a numerical value.
The second way of measuring the data, or the quantitative category, is characterized by assigning a numerical value to the analysis. In the case of data on damage and vulnerability, this type of measurement can be seen in the calculation of the earthquake magnitude (i.e., Peak Ground Acceleration - PGA), or damages in monetary terms. This type of quantitative measurement allows the data to be compared but may require a greater level of detail and time to obtain the information (FAO and WHO, 2009). Also, it is recommended that similar units should be handled within the same category.
The last way of data measurement, or semi-quantitative category, pursues to manage a middle ground between the two previous categories. Middle ground that can be achieved using a categorization scale as in the European Macroseismic Scale 1998 (presented in section 3.1.1) with the damage and intensity scales.
This semi-quantitative categorization often produces a data ranking and does not require as much level of detail (FAO and WHO, 2009), however, by not requiring such level of detail, it may not be as accurate as the quantitative data.
2.2.2. Temporality - Phase of the event
Pre-event and post-event risk assessment are two different, but related, perspectives for examining damage and vulnerability data. In the pre-event, the damage is assessed according to a probabilistic or deterministic analysis, and the seismic vulnerability is assigned based on the structural and non-structural features of the building. In the post-event, the damage is analyzed, given the characteristics of the event and the vulnerability of the structure (Figure 2-3).
21
Figure 2-3. Pre and post disaster damage assessments (Menoni et al., 2017).
These two ways of measuring damage and to consider the vulnerability are commonly related because the damage data collected in a post-event analysis, can be used for the calibration or the proposal of a pre-event vulnerability model; especially with empirical methodologies, which requires a lot of post-event information (Ortega et al., 2019). This means that the data used in both phases could comprise similar problems, although there are specific characteristics that will be explained below.
In both assessments, damage can be measured as the physical damage to the elements and/or the monetary cost of repairing in the economic sector to which they belong, the economy in general, or society as a whole (Menoni et al., 2017).
In the pre-event phase, the seismic risk/scenario processes have primarily the objective to predict the possible level of damage in the area. An objective that requires, as first, the definition of the vulnerability level of the exposed elements. This definition involves in most of the cases data at an asset level, and can vary until the national level, depending on the coverage of the event.
The methods for analyzing vulnerability in this phase are numerous and vary according to factors such as the availability of resources, or the desired outcome. For example, Corsanego and Gavarini, 1993 proposed five perspectives to study seismic vulnerability based on: the results obtained, the way to measure vulnerability, the source of knowledge and the type of object to which the building is assimilated. The last perspective is the one used in this thesis and is also classified
22 by many authors as “semi-empirical models” as it requires both historical information and analytical models. The information extracted from the event is used to correct possible differences in the forecast of damage, although the amount of information is high and is normally not available (Ortega et al., 2019).
The proposal of semi-empirical vulnerability models may have other problems, in addition to the absence of sufficient damage data, namely: the need for a statistically meaningful population of observed damage buildings, the definition of the damage limit condition, the geographical validity of the method, and the asses of multiple types of damage (Menoni et al., 2017).
The need for a statistically valid population requires the greatest amount of reliable information on buildings to define its vulnerability, with census and cadastral databases being the most widely used sources. However, the classification of buildings and their general information is generally considered "poor" in the census and is inferred from national statistics, requiring a first-level survey of buildings (Bernardini et al, 2005).
The second problem is related to the connection between the place where the risk assessment is carried out and the adopted definition for damage and vulnerability, since these two variables definition are highly dependent on the cultural context and vary according to the quantity of buildings surveyed. Authors such as Menoni et al., 2017 propose as a solution that the definition of damage has to be according to the type of building, and not to the damage itself, probably reducing any possible dependence on the cultural context.
As can be seen, the risk assessment and the data used are closely related to the geographical area in which they are defined (third problem). Which means that many of these models only fully apply to certain regions and cannot be used in other contexts. This has been a great advantage for many reinsurers as they can analyze the consequences of the events almost immediately, since they already have a model of the place (Menoni et al., 2017); being only necessary to geolocate the data, process the new information and refine the result. However, it makes the knowledge output of the models not fully usable in other countries.
The fourth problem is associated with the importance that direct physical damage data can have, which in many cases leads to a scarcity in the indirect damage data. Accessible indirect data can be very limited, mainly on damage to economic systems induced by direct damage, lifeline failures and losses due to business interruptions. (Menoni et al., 2017).
23 Moving to the phase that follows the earthquake, it is in this post-event phase that the collection of the damage and vulnerability data (collected mainly through the usability forms) is mostly carried out. In the post-event it is possible to distinguish three different phases: emergency, recovery, and reconstruction. The damage data cannot be considered static or exclusive to one of the phases. When an event occurs, data begins to be gathered from many approaches, and seeks to solve the problems that each phase contains. Nevertheless, these data must be considered as part of a whole, when integrated with others, producing new information in the different phases of disaster management, including updating historical data (Mejri et al., 2017).
The first phase, or emergency phase, seeks to solve public health and safety problems, and is generally the shortest of all, lasting from days to approximately two weeks (Brown et al., 2011). At the building level, all damage data is largely collected in-situ, by filling out a first-level paper survey form for usability assessment (i.e., AeDES paper form in Italy); detecting the level of damage in structural and non-structural elements to define the safety of the buildings (De Martino et al., 2017). The process of collecting data on damage is not simple, and sometimes not rigorously carried out, if the earthquake has a large scale, due to the possible complications generated by the organization of the data collection process or the amount of resources (surveyors, time, money, etc.) that may be required.
During the emergency phase, the buildings’ information collected during peacetime, i.e., cadastral and census statistics, can be modified by the seismic event. Therefore, the damage data that is being collected in the post-event period has an additional task: update the historical information from databases. (Mejri et al., 2017).
This damage data along with the information related to the characteristics of the buildings, which allows to define the vulnerability and degree of damage of buildings, is sometimes difficult to fully comply with in a quick survey (Tertulliani et al., 2009). This, added to the inaccessibility of some areas due to the debris on the roads, complicates the compilation. However, satellite images, georeferenced data and collaborative methods have reduced and facilitated the time required and the accessibility necessary to perform the analysis.
Many authors agree that this geo-spatial collaborative approach allows the result to be fast, combining all types of data, and with an acceptable level of detail. This geo-located data collected through crowdsourcing can be organized with Geographic Information Systems – GIS which also allows analyzing possible trends
24 that are not visible on paper from another perspective (Mejri et al., 2017). Even though, it is generally recognized that much of this data needs be reprocessed and evaluated to verify its authenticity, a process that can be time consuming. Additionally, in many cases it is not easy to obtain it due to licensing problems, or unavailability in developing countries (Ajmar et al., 2011).
The second phase, or recovery phase, needs the data that derives from the emergency time to start studying the possible relief measures to undergo in the recovery and reconstruction phase. Most of the damage and usability data collected is being organized in databases and in other formats (i.e., Excel files or folders for paper formats). To help standardize how data (mainly related to damage) are managed, and recorded, there are platforms such as the DesInventar database created by the United Nations Office for Disaster Risk Reduction - UNDRR. It is currently used by 85 countries in the world, distributed by continent as follows: Africa 36%, America 33%, Asia 22%, Europe 7%, and Oceania 1%.
The last phase (reconstruction phase) is the longest and involves mostly the definition of plans and data evaluation to support long-term decisions related to retrofitting and reconstruction measures. The Figure 2-4 shows the proposal made by Mejri et al, 2017, in which it is stated that most of the data produced in the two preceding stages, the historical information, and external variables related to the community and finances, are used in this last phase.
25 2.2.3. Data storage organization: databases quality characteristics A database is a way of collecting and managing data that is kept together in an organized or logical way, according to Information and Communication Technologies - ICT. For its structuring, there are many models, stored in digital format.
In the case of data on damage and vulnerability, the information is not always organized according to the definition of the ICT database. Much information is stored in the form of a list, paper form or Excel files, and its organization is not standardized. A possible example of this, is the way in which seismic vulnerability data is found scattered in cadastral files, census statistics, usability paper forms or in structural studies, moreover, in many cases, not available for further studies.
For this reason, this chapter presents the main quality characteristics that a damage or vulnerability database should have, in a user/researcher point of view. For this, the six aspects defined for a database by Grasso and Diley, 2016 will be taken: sustainability, continuity, credibility, public accessibility, quality assurance and application for decision-making. In this thesis the aspect of sustainability will not be analyzed, since it is considered more a problem related to the way the database is operated. For the remaining five aspects, they will be analyzed as follows: credibility and quality assurance as reliability, public accessibility as accessibility, continuity as updating, and application for decision-making as usages.
• Reliability
A database is considered credible if the data is obtained from official sources when this is possible. If a database is unreliable, people will often focus on solving data problems or correcting the errors (Redman, 2013), modifying the quality of the result, and the initial objective of the investigation.
In database management, it is widely known that reliability means that the database operates without causing any problems, more specifically, that the data is accurate and consistent (Watts, 2020). For damage and seismic vulnerability databases this can be understood in two ways, with the type of source that is handled to have a certain level of accuracy, and with the quality review to ensure consistency.
The source types are defined by three levels: primary, secondary, and tertiary. In the first, the data is taken directly from the origin, in the secondary the primary is
26 discussed or analyzed, and the tertiary is a summary or condensation of the data with a citation of the first two levels (Virginia Tech University Libraries, 2017). Normally, data on damage and vulnerability is expected to be collected from primary and secondary sources, not tertiary, which allows a good level of credibility of the information.
About the second way of defining reliability, the quality review it has, data quality assurance can be done in several ways. Two of the most common methods are of triangulation and member checking of all the information. Triangulation is related to the search for other sources of information that confirm the recorded data. While the member verification is corroborating the damage and vulnerability of the data with the people involved in the seismic event. It is recommended to document the quality validation process performed in the metadata of the database.
The Figure 2-5 shows the results of reliability in a study by Grasso and Diley, 2016 of 44 governmental, and 13 non-governmental damage databases.
Figure 2-5. Reliability of databases - Adapted from Grasso and Diley, 2016.
As can be seen, most damage databases regardless of who manages them, are considered credible in their sources by using official sources. But less than 20% (18% government-hosted, 15% non-government hosted) go through a quality validation of the data, or they simply do not document if this process is performed. These two factors cause the reliability of many databases to be poor, and the data that is stored loses value for a research use.
Associated with the vulnerability data, the data is generally organized according to specific studies for some regions or certain seismic events; and depending on the requirements of the study, the data storage format is selected. An example of how to organize vulnerability information is the Da.D.O. database, which as discussed in section 2.2.1, is a damage database that also contains information on the vulnerability of buildings in Italy with a geo-spatial format.
27 • Accessibility
The 2010 Haiti earthquake taught that in an emergency, the best way to produce information and manage the disaster is with open data. When this disastrous event occurred, much of the important information and maps of Port-au-Prince were trapped under the debris. Thus, in an effort between the government, international entities and 600 OpenStreetMap volunteers managed to produce cartographic records equivalent to one year in 20 days, with all the relevant information about Haiti (World Bank, 2014).
This led to rethinking the way data was produced and shared, and it was concluded that the data should always be complete, primary, timely, accessible, machine-processable, non-discriminatory, non-proprietary, license free, timeless, and with the minimum cost (World Bank, 2014). Likewise, plans like the Sendai Framework highlight the importance of data accessibility to improve decision-making in disaster risk reduction (UNDRR, 2015). And authors like Ortega et al., 2019 acknowledge the contribution of open data, in this case post-earthquake damage data, for the validation of seismic vulnerability methodologies for vernacular architecture on the island of Faial in Portugal.
As a consequence of the 2010 Haiti Earthquake, platforms or web-based applications like GeoNode (World Bank, 2014) have been created to fulfill these propositions, although there are also platforms such as Google Maps or OpenStreetMap. In relation to the existing damage databases, the accessibility state is shown in Figure 2-6.
Figure 2-6. Accessibility of databases - Adapted from Grasso and Diley, 2016.
As shown, there are still many damage databases that are either completely closed or with limited access on demand, therefore a comprehensive hazard and risk
28 assessment is complex due to the challenges of lack of accessibility and compatibility of the risk data (Tomas et al., 2014).
Furthermore, countries already have data stocks for risk mitigation inaccessible even to stakeholders within the nation. This, due to the paper format that the data handle (i.e., traditional post-event surveys), the technologies that enclose the data in proprietary ecosystems that only allow it to be delivered to a small group, or the fragmentation of the data in different bureaucratic areas that is complicated to assemble (World Bank, 2014).
• Updating
An important requirement to make the best decisions is to have the most actual information, this data update being based on whether it is damage or vulnerability. In the case of damage data and its static nature, each record can be considered unique and should not change much in the future.
On the other hand, the vulnerability requires constant updating due to its dynamic nature, and its evolution with each seismic event. This evolution is due to the accumulation of damage in the building (not only due to seismic events) that will affect its behavior in the future. This accumulation of damage has been called "cumulative damage" by authors such as Graziani et al, 2018.
The evolutionary characteristic of vulnerability is not usually reflected in the structural information of the census or cadastral databases. The most related information is the "existence of some structural reinforcement in the building". But damage vulnerability reduction information is not normally involved.
In consequence, several authors recommend that the data of vulnerability and damage has to be georeferenced in the land cover maps of the zone. This incorporation of data could help decision making for the post-event modification/demolition and reconstruction processes, as defined by the Sendai Framework (Ghaffarrian et al., 2019).
• Usages
A database can have many uses based on different factors (i.e., stakeholders), allowing quality to be defined from this perspective. In this thesis, the aspects related to possible uses, influencing a database characteristic, can be summarized in
29 five categories: scale of the data, type of considered phenomena, types of loss and damage, the type of knowledge they have and the application in the damage models. The scale, as defined in section 2.2.1, is the geographic coverage of the data. The scale that a database can manage depends mainly on the area affected by the event and the use that the data will have by the stakeholders. For example, if the data is used for decision-making in a country, it is better to have a database that contains national information and not isolated data from certain municipalities. Typically, a structural damage database is expected to be at the municipal scale, with building information at the same level, level that can be obtained by aggregation or disaggregation of the available data.
The second aspect, or type of considered phenomena, depends on how the hazard is categorized. For instance, authors as Wallemacq, 2018 classify disasters in termed weather or climate-related (hydrological, meteorological, and climatological), and geophysical disasters (in which earthquakes are located). A database can be used for one category of hazard or cover several types.
Depending on the type of loss and damage (third category), a database often record data on human deaths and/or in economic terms. Usually, this is a criterion to determine if an event enters the database and will be evaluated. For example, the Munich Re NatCatService classifies an event from 0 to 6, with 0 being the event that did not cause death or economic loss, which will be included but not evaluated (Munich Re, 2011).
For the fourth category, in disaster risk management, Menoni et al., 2015 defined four types of knowledge with four types of stakeholders (scientists, private sector, public sector, and civil society). The relationship is direct but not exclusive, that is, a stakeholder may have/require more than one type of knowledge. The four categories are:
• Scientific knowledge: those interested in this type of knowledge are scientists. They look for the data that allow to improve, or create, the knowledge of the event and all the elements involved.
• Organizational knowledge: the stakeholders are the public and private sectors. They look for data that supports decision-making and to improve procedures and technologies.
• Regulatory knowledge: it is the knowledge related to laws, regulations, and procedures. Therefore, the actors are also the public and private sectors that are responsible for protecting and controlling society.
30 • Common knowledge: it is the cultural and oral knowledge, often without a
formal basis, which is shared by a group of people as the civil society. A damage database must have data that allows the creation of any of these four types of knowledge. Nonetheless, it has been proven that neither the databases, mainly those of insurers, nor any landslide study is flexible enough for different uses due to its gaps, thematic bias or problems related to the complexity of the event (Thomas et al., 2014).
The last use, or application in the damage model, is related to the utilization of the data in a damage model. That is, whether the data could be used to propose a new damage model or could be applied to refine an existing model. Regarding the proposal of a new damage model, the data that is normally needed should have the characteristics of scale, granularity and/or collection time (peacetime or post-event) that the desirable model will require.
Whereas, to refine a model, often the data needed is related to the damage occurred (i.e., the data collected after the event). This type of data should be able to improve the precision of the estimations made in the existing model (scenario or probabilistic). In this fifth type of use, the same data set can be used to define/refine a damage model and is recommended that these data are geo-referenced to permit a wider usage (i.e., to produce maps).
A database can have different uses when it meets the parameters presented in this section. The data must be cataloged and classified to handle a terminology accepted at the highest level and thus facilitate its interoperability (Thomas et al., 2014).
2.3. Indicators
In order to make a judgment of the desirable quality of the data present in a vulnerability and/or damage database, this section will present the indicators that some authors recommended for analyzing damage databases. These indicators, together with the data organization factors introduced in section 2.2 and summarized in the conceptual map of Figure 2-7, will allow the creation of a framework to carry out the evaluation of the database in terms of data.
The indicators used in the thesis were proposed by Grasso and Diley, 2016 for the damage databases analysis. These authors proposed 19 indicators that they divided into five categories (characteristics, content profile, quality assurance, accessibility,
31 and uses). The first two categories are used to describe the data and the database, and the remaining three, quality.
The Table 2-1 exposes the indicators proposed by the two authors as follows: those in blue are originally proposed by Grasso and Diley, 2016, and the additional indicators are in accordance with the topics presented in the section 2.2 to analyze the damage/census databases and data sharing methodologies, platforms, and systems of the sections 3.4 and 3.5. Two indicators (data gaps and applications) were not presented because they are considered to be more related with the uses of the databases and not to the characteristics of the data itself. The Table 2-1 is presented as a guide, in order to have a base of how a database can be analyzed.
Figure 2-7. Concept map of the data organization factors.
INDICATORS
1. General characteristics
Area covered: Level of scope.
Scale of the data: Level of scale.
Way of measurement: Quantitative, Semi-Quantitative, Qualitative.
Region: Continent(s).
32 INDICATORS
Type of the institution: Private or public institution in charge of the database. Name of the institution:
Language:
Types of formats used: Georeferenced, CSV, etc.
Temporality: Collection moment of the data.
2. Content profile
Year of establishment of the
database:
Years of record:
Completeness of the records:
Disaster event identification
number:
Intensity data: Way to present the seismic data. Exposure data: Area affected by the event data . Building characteristics data:
3. Reliability
Level of the data sources used: Primary, secondary, and tertiary.
Quality assurance standards:
Completeness: Number of records.
4. Accessibility
Data access: Yes, No, Limited.
5. Updating
Type of updating: Automatic, semiautomatic, manual, nonexistent, unavailable. 6. Uses
Type of hazards: Hydrological, meteorological, climatological, and geophysical.
Type of losses: Casualties, damage and/or economic.
Users: Government, NGO's, private sector, etc.
33
3. Seismic vulnerability and damage data: some methodologies
and databases
The characteristics of the vulnerability and damage data at a territorial scale will be analyzed with one of the vulnerability classifications defined by Corsanego and Gavarini, 1993. These authors described the type of object to which the building is assimilated, as one of the ways of grouping seismic vulnerability analysis methodologies, having the following three categories: typological, mechanistic and hybrid. The typological methodologies that will be exposed are the European Macroseismic Scale 1998 (EMS-98) and Hazus since they can be considered two of the most used methodologies. As for the mechanistic and hybrid, they will be approached more generally with a single building perspective with the vulnerability index – GNDT approach.
These methodologies not only focus on estimating the vulnerability of structures, but they also need damage data to define the intensity of the event and the level of damage per se. They assess the impact of buildings on a scale from zero or minimal damage to collapse and determine the scale of intensity.
However, the analysis of the data will not only be according to these methodologies. It will also be observed how the data is collected, stored, and presented in eight databases. The first three databases are focused exclusively on damage/loss data from different perspectives. The subsequent three databases are Italian applications with geo-referenced data. And the last two are census-type databases, which are used to obtain structural and non-structural data on buildings for the vulnerability modeling in Italy and Colombia.
3.1. Typological methodologies
The typological methodologies are diverse and differ depending on factors such as data availability or the objective of the study. They seek to group buildings into vulnerability classes according to characteristics as geometry, structural layout, or construction material. These classes are expected to have a similar response to a seismic event, so they are related to vulnerability functions to propose a probable damage value according to different seismic parameters (i.e., intensity, pseudo-acceleration, etc.), from discrete or continuous perspective.
In the case of functions of a discrete nature, they are called Damage Probability Matrix (DPM). These matrices are constructed to present the probability of a level
34 of damage given a level of intensity of the event, based on the analysis of damage data from past earthquakes. Tables like the one shown in Table 3-1 presents an example of DPM for a vulnerability class A, according to Castillo, 2005.
Table 3-1. Damage probability matrix for a vulnerability class A (Castillo, 2005).
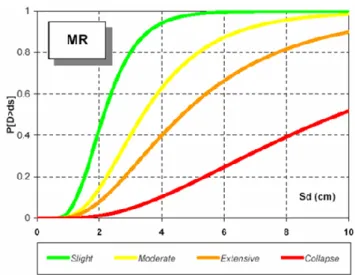
In the continuous case they are called “fragility functions” and show the relationship of a seismic parameter with the probability of exceeding a damage level. The Figure 3-1 illustrates an example of a fragility function for the typology of reinforced concrete moment frames of medium height in Macedonia with the seismic parameter of pseudo-displacement (Sd in centimeters), presented by
Castillo, 2005. These curves are not only performed for vulnerability classes, but they can also be produced for a building or its elements.
The information to define the vulnerability functions and the typological classes of the method is mainly related to the characteristics of the buildings, the judgment of local experts, and the damage data caused by past seismic events. These damage data must be sufficient to allow a refinement of the model and validate the hypotheses that were taken for the definition of vulnerability, which also allows qualifying typological methods as a posteriori analysis (Carniel et al., 2001). Events such as the 1976 Friuli earthquake in Italy showed that the more damage data is collected, the better the definition of the correlations between typologies and the damage experienced (Carniel et al., 2001; Grimaz and Malisan, 2017).
35
Figure 3-1. Fragility function for a medium height reinforced concrete moment frames in Macedonia (Castillo,2005).
An important characteristic of typological methods is that they only allow vulnerability analysis to be carried out in large areas, that is, on a territorial scale. The objective of these methodologies is to collect as much data as possible to define a relationship between the vulnerability and the damage of a typological class, without going into the analysis of the behavior of each building. In this sense, the random errors in the vulnerability assessment are insignificant when analyzing a large sample (Carniel et al., 2001).
3.1.1. European Macroseismic Scale 98
The European Macroseismic Scale 1998 (EMS-98) is the macroseismic intensity scale actually mostly used in Europe, and it constituted an evolved step in the history of the previous scales. In fact, it introduced current construction typologies which scales such as Medvedev-Sponheuer-Kárník (MSK) or Modified Mercalli (MM) did not have, involve the advances in macroseismology (Musson et al., 2009), offer a greater detail in the definition of all grades and classes (i.e., intensity, structural typologies, quantitative terms, etc.), and to illustrate the damage scale that permits a comparison (and avoids uncertainties) in the definition of the degree of damage (Grünthal, 1998). The Figure 3-2 illustrates the scale that was entered into the EMS-98 to help avoid ambiguity in the damage degree quantitative terms.
Considering the above-mentioned characteristics of the scale, the related data to be collected should have the higher level of detail with a sufficient scale according to the coverage of the earthquake.
36 The EMS-98 is particularly effective when it comes to a building stock scale with a mix of different typologies, as it is the typical case in Italian cities (Graziani et al., 2018).
Figure 3-2. Quantity definition in the EMS-98 (Grünthal, 1998).
Regarding the temporality of the data, it can be collected and analyzed both in post-event and/or in peacetime, it depends on the uses. The data should have the highest possible level of detail that allows the definition of the intensity, typology, vulnerability, and damage.
The type of data flow required in the various aspects related to the EMS-98, can be very different and depends on many factors. Therefore, three applications have been analyzed to put in evidence the related data flow, and in particular the similarities. The examples are based on Tertulliani et al., 2009, Graziani et al., 2018, and Rossi et al., 2018. The three applications sought to assess the level of damage and vulnerability of buildings with the EMS-98 in Central Italy: the first application for the earthquake sequence of 2009, and the remaining two applications for the earthquake sequence in the same region in 2016-2017.
When studying these applications, certain similarities were found in the way the data flows:
1. The settlements are divided based on the size to define the inspection process. For small villages (up to 100 structures), the inspection is carried out in detail for each building. While for medium villages, the settlement is divided into sectors and a group is assigned to each sector (Rossi et al., 2018).
For large areas, EMS-98 recommends dividing the settlement in small areas due to the difference in seismic characteristics that can occur within a large territory.
2. The visual inspection of the building is carried out seeking to collect mainly the following data: construction material, state of conservation, state and type of structural connections, construction details, age of the building, and if there is any retrofitting or maintenance measure.
37 3. The building damage impact is evaluated, defining the possible effects of
the damage caused by one shock or a sequence of earthquakes.
4. When possible, information related to the perception of the seismic event by the population of the area is collected. Accompanied by the evaluation of journalistic reports or telephone interviews with municipal authorities (Rossi et al., 2018).
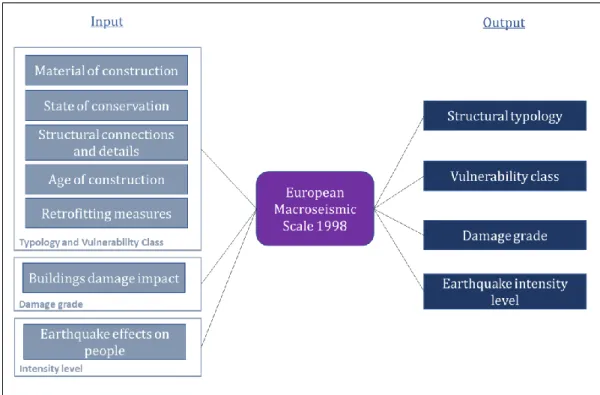
With the data collected, the following information was defined in each application: the structural typology, the vulnerability class, the damage level, and the intensity level according to EMS-98. In the Figure 3-3, the input and output data that were handled in the three applications are presented, dividing the input data by categories.
Figure 3-3. Input-Output data in the EMS-98 scale for the three applications.
The data processing performed in the three cases to obtain the different outputs (shown in the Figure 3-3), is then presented.
• Earthquake Intensity level
The Macroseismic Intensity can be defined as the strength classification of the shaking in a place, in terms of the observed effects rather than a physical parameter (Musson and Cecić, 2011). On the European macroseismic scale 1998, the observed effects are evaluated mainly in three groups: humans, living objects and animals, and in buildings. However, for the application cases, the intensity is evaluated