Civil and Environmental Engineering Department
Biological phosphorus removal at the
wastewater plant Milano San Rocco –
Preliminary laboratory tests
Supervisor: Prof. Roberto CanzianiCo-supervisor: Eng. Roberto Di Cosmo
Master of Science Thesis by: Mariia Evgrafova Student Id. Number: 841061
Contents
Content of figures...vii
Content of tables...viii
Abstract...1
1. Introduction to phosphorus removal...3
1.1 Environmental importance...3
1.2 Phosphorus sources and its structure in municipal wastewater...3
1.3 Phosphorus source control and effluent quality standards...5
2. Phosphorus removal methods...9
2.1 Chemical Precipitation...9
2.1.1 General principle...9
2.1.2 Process configuration and limitations...10
2.2 Biological phosphorus removal...10
2.2.1 General principle...10
2.2.2 Advantages...11
3. Enhanced Biological Phosphorus Removal Process...13
3.1 Biochemical mechanism of EBPR...13
3.1.1 Simplified model for anaerobic metabolism of bio-P bacteria...13
3.1.2 Simplified model for aerobic metabolism of bio-P bacteria...14
3.2 Concentration profiles through the treatment plant...15
3.3 Overview of general types of EBPR processes...17
3.3.1 Phosphotus removal without nitrification...17
3.3.2 Phosphorus removal with nitrification and high influent BOD/P ratios...18
3.3.3 Phosphorus removal with nitrification and low influent BOD/P ratios...18
3.4 Design parameters and limitations for EBPR...20
3.4.1 Influent wastewater characteristics...20
3.4.2 Diurnal variation...21
3.4.3 Anaerobic contact time...21
3.4.4 Solids retention time...22
3.4.5 Aeration design...22
3.4.6 Alkalinity and pH...22
4. Wastewater treatment plant Milano San Rocco...23
4.1 General...23
4.2 Advanced technology and reduced environmental impact...25
4.3.1 Pretreatment...26
4.3.2 Biological treatment...26
4.3.3 Secondary settling...28
4.3.4 Chemical phosphorus removal...29
4.3.5 Sand filtration...29
4.3.6 Disinfection...29
5. Laboratory tests for EBPR...31
5.1 Laboratory test set-up...31
5.1.2 Aerobic phosphorus uptake...34
6. Factors affecting performance of EBPR on Milano San Rocco WWTP...37
6.1 Anaerobic conditions...37
6.2 Availability of readily biodegradable carbon sources...39
6.2.1 Physical method – flocculation-filtration method...39
6.2.2 Biologically based method – respirometric tests...41
6.3 Phosphorus release and denitrification...46
6.4 Evaluation of conditions that may favor EBPR at Milano San Rocco WWTP...46
7. Conclusions...49
References...51 Appendix 1. Phosphorus release/uptake results tests
Appendix 2. ORP data-set for April 2017 Appendix 3. Respirometry tests results.
Content of figures
Figure 1. Schematic processes of anaerobic metabolism of PAOs...15
Figure 2. Schematic processes of aerobic metabolism of PAOs...16
Figure 3. Profile of BOD an P in the mixed liquor as it passes through the EBPR plant...17
Figure 4. Profile of Ortho-P,VFAs, PHAs, Poly-P and glycogen in the mixed liquor as it passes through the EBPR plant...17
Figure 5. Phoredox (A/O) process...18
Figure 6. A2O process...19
Figure 7. University of Capetown (UCT)...20
Figure 8. Virginia Initiative Plant (VIP) process...20
Figure 9. Johannesburg (JHB) process...21
Figure 10. Schematic planification of the Water treatment plant Milano San Rocco...26
Figure 11. Process scheme of the Plant Milano San Rocco...27
Figure 12. Actual sedimentation tanks with moving bridge...31
Figure 13. Scheme of possible reorganization of Milano San Rocco Plant for EBPR process.32 Figure 14. Scheme of laboratory organization of EBPR process for Milano San Rocco Plant.33 Figure 15. Anaerobic test...35
Figure 16. Aerobic test...35
Figure 17. Phosphorus release/uptake curve (representative example from 27 of April)...36
Figure 18. Flocculated and settled inflent sample with “clear” zone...41
Content of tables
Table 1. Phosphorus compound structure in domestic wastewater...7
Table 2. Limits of outflow content for water treatment plants for standard provisions expressed 24-hour average...8
Table 3. Limits of outflow content for water treatment plants for “sensitive areas” expressed in annual averages...9
Table 4. Minimal influent wastewater ratios for achieving a soluble P effluent concentration of ≤ 0.50 mg/L...22
Table 5. Configuration of typical semi-line with eight tanks in a row...29
Table 6. Parameters of the inflow distribution between tanks A1/A2/O5...30
Table 7. Oxidation reduction potential (ORP) and metabolic conditions...34
Table 8. Simulation results of ortho-P and ORP level (example from 27 of April)...36
Table 9. Results of prerequisite phosphorus release...37
Table 10. Results of removal capacity per unit MLSS concentration (X)...38
Table 11. Influent WW parameters and their ratios to P...39
Table 12. Physical method results of COD fractions...41
Abstract
The work has tested the potential of phosphorus release and uptake under different operating conditions in batch tests.Sludge from the wastewater treatment plant of Milano San Rocco has been used. Control tests with the addition of acetate have been carried out to find the potential maximum release and uptake of phosphorus by PAO organisms in the biomass present in the sludge.
Later real influent has been used as substrate to define the actual response of PAO organisms. Tests have been repeated in different days over a two-month period. The response has been compared with literature data to assess the suitability of the wastewater to trigger the process of enhanced phosphorus removal.
Test has shown that the process is feasible, but the high redox potential of recycled sludge and the relatively low concentration of readily biodegradable substrate in the influent wastewater may require an adaptation of tanks and recycle flows in the real plant to have good chances of promoting PAO activity and a successful P removal process in San Rocco WWTP, which was not designed to perform this biological process.
1. Introduction to phosphorus removal
Phosphorus (P) is an essential nutrient for plants, animals and humans. It is one of the 20 most abundant elements in the solar system, and the 11th most abundant in the earth’s crust. Surface waters contain certain level of phosphorus in various compounds. In natural conditions the phosphorus concentration in water is balanced i.e. accessible mass of this constituent is close to the requirements of the ecological system. When the input of phosphorus to waters is higher than it can be assimilated by a population of living organisms the problem of excess phosphorus content occurs.1.1Environmental importance
Human activities, however, have resulted in excessive loading of phosphorus into many freshwater systems. For instance, it is an important element to agricultural and industrial activity, and there are concerns over its depletion as a non-renewable resource. An excessive use of fertilizers in the agricultural and industrial sectors, daily human activities are the main sources of great acceleration in pollution of discharged wastewater with large fractions of nutrients, in particular of P loads. As a result, discharging of untreated domestic and industrial wastewater leads to serious eutrophication (nutrient enrichment) of receiving natural water bodies. The most recognizable manifestations of this phenomena are algal blooms that occur during summer. Over-nutrient enrichment results in low dissolved oxygen (DO), fish kills, murky water and depletion of desirable flora and fauna. In some cases toxic algae such as
microsystis was found in algal blooms. This in turn causes extensive economic losses because
of the degradation of fisheries, tourist facilities and coastal regions.
In addition, the overgrowth of algae increases the need to use higher chlorine doses of drinking water, which in turn, leads to higher levels of disinfection by products. Consequently, removing P from discharged wastewaters is of great urgency for protection water bodies from pollution.
1.2Phosphorus sources and its structure in municipal wastewater
Phosphorus (P) enters municipal wastewater treatment facilities from both domestic and industrial sources. Obviously, in densely populated regions domestic wastewater is the dominating source of phosphorus in municipal discharges. Different authors estimated the proportion of domestic vs. total around, Rybicki S. (1997). Advanced wastewater treatment.
Report No 1. Phosphorus removal from wastewater. Division of Water Resources Engineering Department of Civil and Environmental Engineering Royal Institute of Technology. Stockholm estimates 75% of the total phosphorus load comes from domestic sources. Its contributions come from human waste and detergents. As an examples, an average load that was estimated by Simon A. Parsons and Jennifer A. Smith. April 2008. Phosphorus Removal and Recovery from Municipal Wastewaters. Centre for Water Science, Cranfield University Cranfield, Bedfordshire, MK43 OAK, UK; al 2008, is 0.60 kg P capita-1 y-1 from human waste, 0.30 kg P capita-1 y-1 from laundry detergent and 0.10 kg P per capita-1 y-1 from other household cleaning products. The phosphorus coming from detergents might be difficult to determine, report Alexander G.C. and Stevens R.J. (1976) Per capita phosphorus loading from domestic sewage. Water Research vol.10, pp. 257-769. because its structure has a tendency to vary in different countries in the range of 0.65 - 2.0 gP capita-1 d-1 and its concentration in raw municipal wastewater tends to change due to life style (e.g. nutrition), urbanization, industrial development, and other factors.
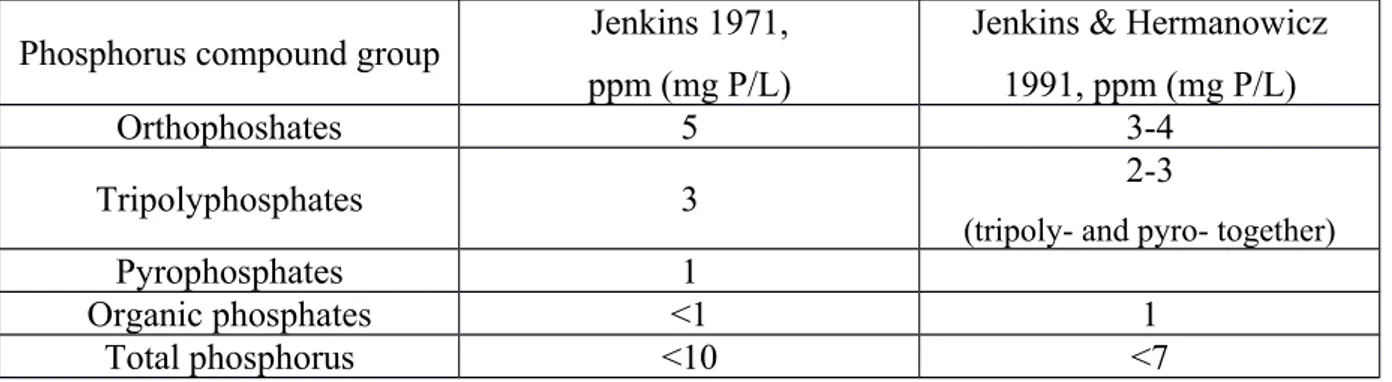
As the reference, to show a structure of phosphorus compounds in municipal wastewater, next data from report work of Rybicki S. (1997). Advanced wastewater treatment. Report No 1. Phosphorus removal from wastewater. Division of Water Resources Engineering Department of Civil and Environmental Engineering Royal Institute of Technology. Stockholm was extracted and presented in the Table 1. Phosphorus compound structure in domestic wastewaterError: Reference source not found
Phosphorus compound group Jenkins 1971, ppm (mg P/L)
Jenkins & Hermanowicz 1991, ppm (mg P/L)
Orthophoshates 5 3-4
Tripolyphosphates 3 2-3
(tripoly- and pyro- together)
Pyrophosphates 1
Organic phosphates <1 1
Total phosphorus <10 <7
Table 1. Phosphorus compound structure in domestic wastewater
From this table it can be observed that phosphates are classified as orthophosphates, polyphosphates and organic phosphates. The dominating phosphorus group in domestic (municipal) wastewater over others is orthophosphates.
Another classification of phosphorus compounds present in water distinguishes two main forms of P which are: dissolved (soluble) and particulate (attached to or a component of particulate matter). Ortho phosphorus is the primary dissolved form of phosphorus and is readily available to microorganisms. Particulate phosphorus can change from one form to another (called cycling) in response to a variety of environmental conditions. Microbial decomposition of organic compounds can convert organic particulate P to dissolved P. Some of the P in soil mineral particles can also be converted to dissolved P both in the water column and during chemical and physical changes in bottom sediment. Only the most tightly bound forms of particulate phosphorus are not generally available for bacterial growth. Because phosphorus changes its forms, for engineering calculations it is preferable to measure total phosphorus rather than any single form to determine the amount of nutrient that can be fed to the microorganisms.
According to this phosphorus classification, the main goals of wastewater treatment are removal of organic matter and suspended solids.
1.3Phosphorus source control and effluent quality standards
The Water Framework Directive commences with the words:
“Water is not a commercial product like any other but, rather, a heritage which must be protected …”
This idea of high importance of maintenance of water quality for the society was transmitted in Directive - European Union Legislation on wastewater treatment and nutrients removal, that was published by Foundation for Water Research in 2005, Blöch H. (2005). European Union legislation on wastewater treatment and nutrients removal Presentation H. Blöch European Commission, Directorate General Environment. Foundation for water research. The Directive provides the idea of necessity of following the Legislation not only by the scientific community and other experts, but also to an ever increasing extent by citizens and environmental organizations. Also, European Legislation is setting ambitious objectives for the protection of water resources across Europe by means of:
binding on environmental objectives, innovation and technological progress,
planning at a technical, financial and political level, involving the civil society, and thus
providing a living example of good European governance.
According to Legislation, nutrients removal and reduction technologies are in the center of environmental efforts on water protection. Another Directive - Council Directive 91/271/EEC
concerning urban waste-water treatment was adopted on 21 May 1991., has implemented
objectives for the urban wastewater treatment plants by limiting outflow contents, see in Table 2 and Table 3.
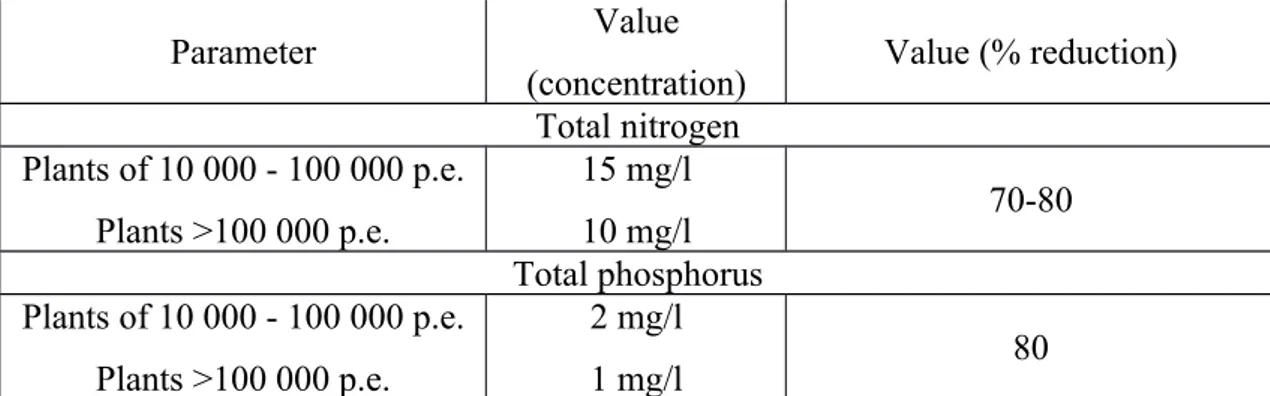
Parameter Value (concentration) Value (% reduction)
BOD5 25 mg/l 70-90
COD 125 mg/l 75
Table 2. Limits of outflow content for water treatment plants for standard provisions expressed 24-hour average.
Parameter Value
(concentration) Value (% reduction) Total nitrogen Plants of 10 000 - 100 000 p.e. Plants >100 000 p.e. 15 mg/l 10 mg/l 70-80 Total phosphorus Plants of 10 000 - 100 000 p.e. Plants >100 000 p.e. 2 mg/l 1 mg/l 80
Table 3. Limits of outflow content for water treatment plants for “sensitive areas” expressed in annual averages.
By term “sensitive areas” were defined next water bodies:
natural freshwater lakes, other freshwater bodies, estuaries and coastal waters which are found to be eutrophic or which in the near future may become eutrophic if protective action is not taken;
surface waters intended for the abstraction of drinking water which could contain more limiting concentrations of contaminates if action is not taken;
As it can be observed from Directive, limiting concentration of phosphorus for outflow from the plan is very strict. This fact should induce the accuracy in controlling the sources of phosphorus. One of approach named “control at source” has been successfully studied and applied in United States in the 1970´s, Porcella D.B., Bruce Bishop A. Stock image comprehensive management of phosphorus water pollution; 1976. The results have shown that the detergents - main sources of municipal phosphorus discharge - can be relatively easy controlled and limited. The main phosphate-containing constituent of washing powder is a sodium tripolyphosphate (STPP) - approx. 90% of phosphate detergent mass in the United States. As preventive action to eliminate or significantly reduce this source of contamination several STPP substitutes have been proposed e.g. nitriloacetic acid (NTA), zeolites, unsaturated sulphonated organic acids etc.
For instance, as Barnard J. (1983) Background to biological phosphorus removal. Water Sci. Tech. vol.15 pp.1-13. reports, in Switzerland, a country which had experienced significant problems with eutrophication of lakes, the government decided first to reduce and then prohibit the usage of phosphorus-containing detergents in the 80´s. This resulted in a visible decrease of phosphorus in the effluent of municipal wastewater treatment plants. Phosphorus content measured as P/BOD5 fraction in primary effluent has been reduced by 30 % applying preventive controlling methods.
Therefore, stringent effluent quality standards for wastewater treatment plants (WWTPs) are compulsively implemented by many national governments of the world. In Italy, according to Decreto legislativo 3 aprile 2006, n. 152 Norme in materia ambientale;, P content in the effluent are required to meet the same limits recommended by European water treatment Directive presented in Table 2 and Table 3.
2. Phosphorus removal methods
According to the general phosphorus classification, the main goals of wastewater treatment are removal of organic matter and suspended solids. Phosphorus can be removed from wastewater by transforming it from a soluble form into a solid that can be removed by sedimentation. Two widely used processes of transfer to a solid phase may be performed:
chemical precipitation; biological removal.
Both typically achieve effluent concentrations of 1 to 2 mg/L and, if combined with filtration processes, levels as low as 0.2 mg/L are possible.
1.4Chemical Precipitation
Chemical precipitation, the most commonly applied process, can remove up to 90% of all influent P. It is relatively simple and needs little equipment aside from a chemical holding tank and a pump. The main mechanisms of chemical phosphorus removal system are precipitation with metal ions and next removal together with the sludge in the separation unit -sedimentation tank, flotation tank, etc. The chemicals used are either iron (Fe) or aluminum (Al) chlorides or sulphates; bivalent Fe2+ and trivalent Fe3+ are preferable.
1.4.1 General principle
At the heart of the chemical precipitation two unit processes should be considered: hydrolysis of iron compounds and precipitation of phosphorus compounds. In neutral or basic water addition of ferrous complexes results in formation of ferric hydroxides. If there is soluble phosphate in the water, it reacts with the Fe3+/Fe2+ to form an insoluble salt, ferric phosphate. A simplified chemical equation illustrating iron precipitation of phosphorus is given below:
Fe3+ + 3H
2O→ Fe(OH)3 + 3H+ ; Fe3+ + PO43- → FePO4↓
Because the reaction of Fe with water is very fast, mixing needs to be thorough. Once Fe hydroxide has formed, the rate at which it absorbs P is quite slow. The better the mixing, the more P is removed per unit Fe added. The optimum pH for Fe coagulation is around 5. Higher pH increases the tendency for Fe hydroxide formation, thus requiring even more rapid mixing. The precipitate settles and is removed as a sludge.
A precipitation of phosphorus compounds by aluminum sulfate is much like the iron salts previously described with iron salts.
1.4.2 Process configuration and limitations
Chemical precipitation process configuration is divided by groups according to dosage point and way of reaction. direct precipitation
• pre-precipitation
• simultaneous precipitation • post - precipitation
Even the method of chemical precipitation is widely used and relatively simple, however, it relies a lot on the addition of chemicals, which for its turn may contain hazardous materials (such as heavy metals) that can either pass through with the effluent or accumulate in the sludge. Also, possibility to corrosion of iron salts (such as ferric chloride FeCl3 and ferrous chloride FeCl2 should be handled for proper performance of the water treatment plant.
1.5Biological phosphorus removal
1.5.1 General principle
The fundamental principle of any biological treatment of water underlie in the transformation of biodegradable organic matter present in wastewater in dissolved and particulate form into the final products by means of simple metabolism. This process rely on bacteria, nematodes or other unicellular microorganisms, which use normal cellular processes as ingestion, respiration, growth and division. All these microorganisms develop and grow colonies, aggregating together with suspended material and forming active sludge flocks. A subsequent phase of biomass separation from the treated water is followed the process, which takes place by gravity because the specific weight of the flakes is slightly higher than that of the water. This process is called sedimentation and constitutes the final stage of the biological purification process.
As an alternative, the activated sludge process can be modified to achieve enhanced biological phosphorus removal (EBPR) by creating a sequence of anaerobic and aerobic zones. This provides an environment that favors the growth of Phosphorus Accumulating Organisms (PAOs).
1.5.2 Advantages
Even if the biological removal is quite complex process, it relies less on the addition of chemicals and offers the opportunities to reuse the phosphorus, which can be later released from cells and converted to calcium phosphate or the mineral struvite, that have been shown to be excellent fertilizer. If compared with chemical phosphorus removal, biological methods (bio-P) are still more economical and environmental friendly (Sathasivan A.(2009). Biological phosphorus removal process for wastewater treatment. Water and wastewater treatment technology. Department of Civil and Construction Engineering, Curtin University of Technology, Perth WA 6845, Australia;).
4. Enhanced Biological Phosphorus Removal Process
1.6Biochemical mechanism of EBPRThe researches of processes evolving during anaerobic phase in the sludge and microorganisms responsible for that uptake and release of P started from mid-1960s. Pioneer works of Barnard J. (1983) Background to biological phosphorus removal. Water Sci. Tech. vol.15 pp.1-13. have studied phosphorus release under non-aerated conditions, which was defined as prerequisite to subsequent aerobic phosphate uptake. The releasing polyphosphate was described by other authors (Fuhs GW., Chen M., (1975) - Microbial Ecology Microbiological basis of phosphate removal in the activated sludge process for the treatment of wastewater.. – Springer;It is released from intracellular polyphosphate granules by the action of some type of bacteria. This ability refers to different types of bacteria, microalgae, and fungi, which ability to uptake and store orthophosphate in excess of their biological requirements is exploited for EBPR. For simplicity the class of this specific microbiota was named - phosphorus accumulating organisms (PAOs). A biochemical model was postulated to describe the metabolism of bio-P bacteria and intracellular reactions under different conditions.
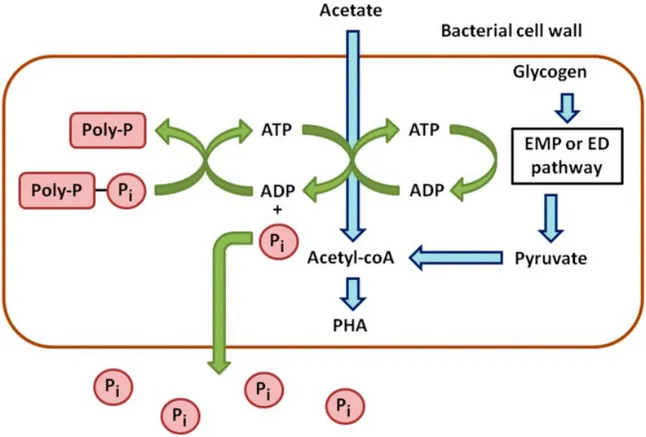
1.6.1 Simplified model for anaerobic metabolism of bio-P bacteria
It was postulated that PAOs subjected to anaerobic conditions could consume their polyphosphate reserves to produce energy for the transport and storage of simple carbon such as acetate. This poly-P is a high energy phosphate (PO4) groups joined together. It is present in all cells but the PAOs are capable to accumulate it in their cells. When organic material undergoes fermentation reactions, smaller and more readily available organic molecules are formed known as volatile fatty acids (VFAs). VFAs typically found in wastewater are acetic acid (acetate) and propionic acid. So, the VFAs provide the food for PAOs. Carbon sources available under these conditions will be primarily utilized for production of biological polymers PHA. Polyhydroxyalkanoates (PHAs) are energy-rich carbon polymers inside a bacterial cell, which are converted from readily available organic molecules such as volatile fatty acids (VFAs) in the wastewater. Unusable phosphate molecules that accumulate
intracellularly would be then released. Figure 1 (Cédric T., Huu-Thanh N., Alison B., Anissa D., Lies De C., Raphaëlle C, Evi M., Erik M.and Frank D. (2016), Characterisation of Phosphate Accumulating Organisms and Techniques for Polyphosphate Detection: A Review. sensors shows the processes of anaerobic metabolism of PAOs.
Figure 1. Schematic processes of anaerobic metabolism of PAOs.
1.6.2 Simplified model for aerobic metabolism of bio-P bacteria
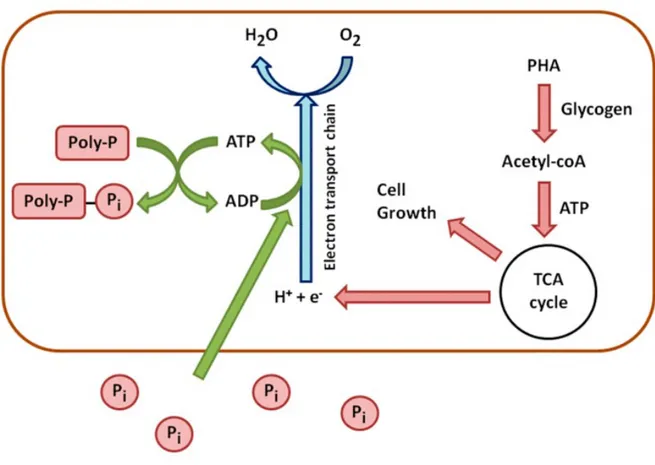
In the aerobic zone PAOs use PHA as a source of carbon and energy for metabolism and cell growth. PAOs will also restore their supplies of glycogen and poly-phosphate in the aerobic zone to replenish their stored poly-phosphate, hence, PAOs will take up excess phosphate from the mixed liquor, which is the actual mechanism of enhanced biological phosphorus removal. Figure 2 (Cédric T., Huu-Thanh N., Alison B., Anissa D., Lies De C., Raphaëlle C, Evi M., Erik M.and Frank D. (2016), Characterisation of Phosphate Accumulating Organisms and Techniques for Polyphosphate Detection: A Review. sensors shows that, under aerobic conditions, internal energy produced from the consumption of stored or external carbon would result in a high energy level (ATP/ADP ratio) and in new cell growth.
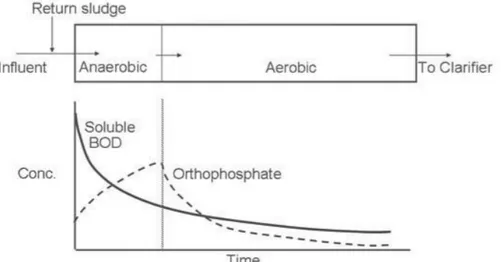
Figure 2.Schematic processes of aerobic metabolism of PAOs. 1.1Concentration profiles through the treatment plant
As it was described above, in the anaerobic zone PAOs will rapidly take up BOD (as VFAs) and release orthophosphate into the mixed liquor. As the wastewater passes through the anaerobic zone, VFA will rapidly decrease and orthophosphate will increase, see Figure 3. In the aerobic zone BOD will continue to decrease. As PAOs restore their poly-phosphate supplies in the aerobic zone the concentration of orthophosphate in the mixed liquor will rapidly decrease.
Figure 3.Profile of BOD an P in the mixed liquor as it passes through the EBPR plant (from Wisconsin Department of Natural Resources. Introduction to Phosphorus Removal Study Guide.
January 2009 Edition;
Under anaerobic conditions PAOs take up VFA from the mixed liquor and store it as PHA within their cells. To do this PAOs use the glycogen and polyphosphate as energy sources -depleting their stores of these compounds. Under aerobic conditions PAOs use up their stored PHA for metabolism and growth and to restock their supplies of glycogen and poly-phosphate. To build up their supply of polyphosphate PAOs will take up excess orthophosphate from the mixed liquor in the aerobic zone, see Figure 4.
Figure 4. Profile of Ortho-P,VFAs, PHAs, Poly-P and glycogen in the mixed liquor as it passes through the EBPR plant (Wisconsin Department of Natural Resources. Introduction to
1.2Overview of general types of EBPR processes
Process selection for EBPR is very specific and a number of factors must be considered including; effluent phosphorus concentration requirement, existing process and available equipment, process needs for nitrification and nitrogen removal, wastewater characteristics, phosphorus recovery methods and operational requirements. There are three different EBPR process configurations, defined by Metcalf & Eddy, I., Tchobanoglous, G., Burton, F., & Stensel, H. D. (2003). Wastewater engineering: Treatment and reuse. Boston: McGraw-Hill. al., 2003, that are generally applied:
nitrification is not required;
nitrification is required with high BOD/P ratios in the influent wastewater; nitrification is required with low BOD/P ratios in the influent wastewater.
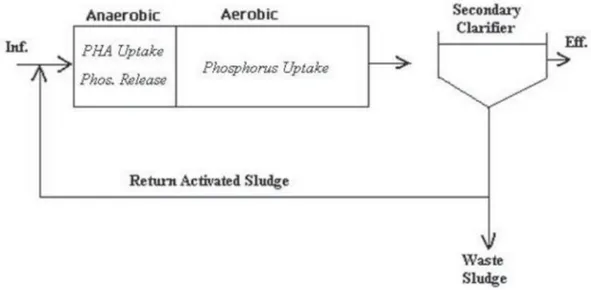
1.6.3 Phosphotus removal without nitrification
This process represents the basic anaerobic/aerobic sequence and was introduced by Barnard (1975). As shown on Figure 5, settled and thickened activated sludge is returned to the anaerobic reactor. Barnard was the first who clarified the need for anaerobic contacting between activated sludge and influent wastewater before aerobic degradation to accomplish enhanced biological phosphorous removal. The process was identified as the Phoredox process and has also been referred to an anaerobic/oxic (A/O) process. Nitrification does not occur to any appreciable extent in the A/O process, as it is designed with low aerobic SRT values from 2 to 3 d at 20°C and 4 to 5 d at 10°C. These relatively low SRTs are adequate for growth and proper performance of the PAOs.
Figure 5. Phoredox (A/O) process, from Metcalf & Eddy, I., Tchobanoglous, G., Burton, F., & Stensel, H. D. (2003). Wastewater engineering: Treatment and reuse. Boston: McGraw-Hill. al., 2003.
1.6.4 Phosphorus removal with nitrification and high influent BOD/P ratios
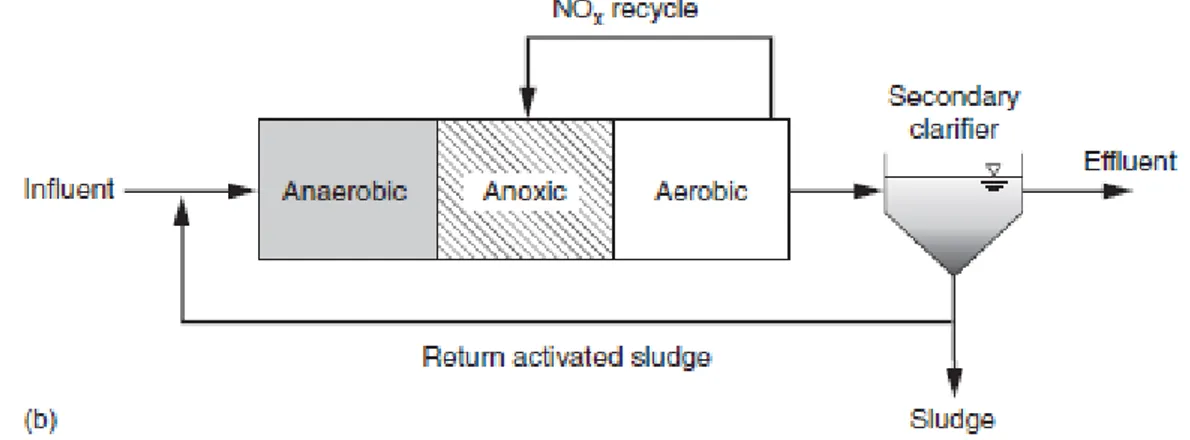
Nitrates, that are needed to meet discharge requirements and present in the return activated sludge flow, being recycled to the anaerobic zone can be detrimental to EBPR performance. Other non-PAO heterotrophic bacteria will use nitrate fed to the anaerobic zone to consume rbCOD for nitrate reduction, leaving less rbCOD available for PAOs. With less rbCOD available, there is less PAO growth and less phosphorus removal by EBPR. If no nitrate removal occurs with nitrification systems, EBPR is not possible. For these reason the A2O (anaerobic-anoxic-aerobic) process was introduced. In the A2O process, nitrate is removed by the anoxic/aerobic sequence shown on Figure 6, but the return activated sludge (RAS) recycle to the anaerobic zone still contains nitrate. If the wastewater has a high favorable influent BOD/P ratio (typically greater than 30/1) there will likely be enough rbCOD for both the nitrate removal and sufficient PAO growth. For weaker wastewaters or wastewaters with a lower BOD/P ratio, the amount of influent rbCOD consumed by heterotrophic denitrifying bacteria is such where there is not enough rbCOD left to support the amount of PAO growth needed for removal of the desired amount of influent phosphorus.
Figure 6. A2O process, from Metcalf & Eddy, I., Tchobanoglous, G., Burton, F., & Stensel, H. D.
(2003). Wastewater engineering: Treatment and reuse. Boston: McGraw-Hill. al., 2003
1.6.5 Phosphorus removal with nitrification and low influent BOD/P ratios
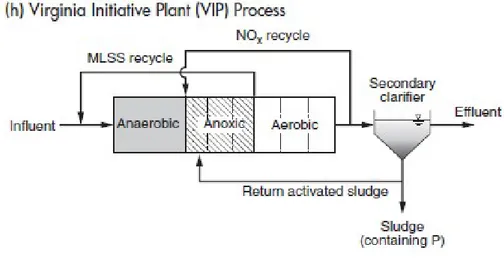
Avoidance of nitrate in mixed liquor returned to the anaerobic contact zone is desired for EBPR with weak wastewater, low influent BOD/P ratios and/or for a treatment goal to maximize phosphorus removal without chemical addition. The University of Capetown (UCT) process is a common EBPR process that has been used in anoxic/aerobic nitrogen removal processes to prevent the addition of nitrate to the anaerobic contact zone, presented on Figure 7. In this process the return activated sludge is directed to an anoxic zone instead of the anaerobic contact zone. The return mixed liquor to the anaerobic contact zone is taken from the anoxic zone or effluent where the nitrate concentration is typically below 0.50 mg/L.
Figure 7. University of Capetown (UCT), from Metcalf & Eddy, I., Tchobanoglous, G., Burton, F., & Stensel, H. D. (2003). Wastewater engineering: Treatment and reuse. Boston: McGraw-Hill. al., 2003. Next series of processes with the aim to remove most all nitrates fed to the EBPR anaerobic contact zone was designed: VIP (Virginia Initiative Plant), JHB (process originated in Johannesburg, South Africa). All of them are similar to A2O or to UCT processes but with the difference of introduction of the additional anoxic zones which reduce the nitrates. Also the
processes are designed as a high rate systems, operating with much shorter SRTs, which maximizes EBPR efficiency.
Figure 8. Virginia Initiative Plant (VIP) process (Metcalf & Eddy, I., Tchobanoglous, G., Burton, F., & Stensel, H. D. (2003). Wastewater engineering: Treatment and reuse. Boston: McGraw-Hill. al.,
2003).
Figure 9. Johannesburg (JHB) process (Metcalf & Eddy, I., Tchobanoglous, G., Burton, F., & Stensel, H. D. (2003). Wastewater engineering: Treatment and reuse. Boston: McGraw-Hill. al., 2003).
1.7Design parameters and limitations for EBPR
Most of the mainstream processes described for enhanced biological phosphorus removal incorporate the necessary anaerobic contacting between influent wastewater and activated sludge, followed by an anoxic or aerobic zone for bio-oxidation of stored intracellular poly-b-hydroxy-alkanoates (PHA) and phosphorus uptake by the PAOs. Limitation of COD and hence, the presence of easily biodegradable organic matter lead to a competition for carbon source between P removal and traditional heterotrophic denitrification. Nitrification is the process where ammonia is converted to nitrates. If nitrates are present in the anaerobic zone, it
becomes anoxic (NO3). Denitrifying bacteria under anoxic conditions will uptake VFAs, thus decreasing the VFAs available for PAOs.
Realization of EBPR is very specific process for design and realization as it performance deals with lifecycle of PAO which requires the respect of characterized parameters.
1.7.1 Influent wastewater characteristics
As EBPR is affected by the influent wastewater characteristics, including rbCOD and VFAs, the measurement of these constituents is essential to evaluate the design and performance of EBPR systems. The amount of enhanced biological phosphorus removal is related directly to the amount of acetate and propionate taken up by PAOs in the anaerobic contact zone and converted to carbon storage products that provide energy and growth in the subsequent anoxic and aerobic zones. Recommended wastewater characteristics for EBPR performance to achieve an effluent soluble P concentration ≤ 0.50 mg/L are shown in Table 4, was taken from the Metcalf & Eddy, I., Tchobanoglous, G., Burton, F., & Stensel, H. D. (2003). Wastewater engineering: Treatment and reuse. Boston: McGraw-Hill. al., 2003.
Influent substrate parameter Value Reference
VFA/P 8 Wentzel (1990)
rbCOD/P 18 Barnard (2006)
BOD/P 30 Sedlak (1991)
COD/P 60 U.S. EPA (2010)
Table 4. Minimal influent wastewater ratios for achieving a soluble P effluent
concentration of ≤ 0.50 mg/L, (Metcalf & Eddy, I., Tchobanoglous, G., Burton, F., & Stensel, H. D. (2003). Wastewater engineering: Treatment and reuse. Boston: McGraw-Hill. al., 2003). Because acetate and propionate are the substrates consumed by PAOs in the anaerobic contact zone, the VFA to P ratio is a good predictor of the amount of P that can be removed. The amount of VFA available to the PAOs in the anaerobic contact zone is greater than the influent wastewater VFA concentration due to fermentation of other rbCOD in the wastewater. The given ratios are based on the assumption that the EBPR process does not have an excessively long SRT and that minimal nitrates are fed to the anaerobic contact zone.
1.7.2 Diurnal variation
The diurnal variation in wastewater strength is also an important process consideration. Knowing that the performance of phosphorus-storing bacteria depends on the availability of fermentation substrates, it is important to know if periods of low influent wastewater strength
may affect EBPR performance. For domestic wastewaters, the influent total BOD and rbCOD concentrations will vary with time over a 24-h period, with lower concentrations in the late evening and early morning hours. For smaller-sized communities, the variations are usually more pronounced and very little rbCOD may be present at certain times. During wet-weather conditions, especially in the winter, EBPR may be difficult to achieve due to cold, low strength wastewater that does not readily become anaerobic.
1.7.3 Anaerobic contact time
As acetate and propionate are taken up rapidly and detention times of about 0.25 to 1.0 h are adequate for fermentation of rbCOD. If the anaerobic contact time is too long, a secondary release of phosphorus can occur. The time of less than 3.0 hours of the anaerobic contact was defined not performing secondary phosphorus release.
1.7.4 Solids retention time
Two adverse effects on phosphorus removal efficiency are associated with processes with long SRTs. First of all, the higher the SRTs the higher the endogenous decay and the lower the excess biomass produced, with a reduction in P removal, which is proportional to the amount of biomass wasted.
Secondly, at long SRT values, PAOs will deplete more of their intracellular storage products. If the intracellular storage products are depleted, less efficient P uptake occurs in the aerobic contact zone.
1.7.5 Aeration design
The aeration zone configuration and DO concentration affects EBPR phosphorus uptake efficiency and effluent soluble P concentrations. A DO concentration of 1.5 mg/L is needed in the aerobic zone or the P removal efficiency will be reduced. Biological phosphorus removal can be affected in biological nutrient removal systems unless the dissolved oxygen concentration in the phosphorus uptake zone remains between 1.5 and 3.0 g/m3.
1.7.6 Alkalinity and pH
The pH values greater than 7.0 can favor PAO dominance in their competition for the acetate provided by the influent wastewater and that produced in the anaerobic contact tank. To
assure that a favorable pH is available for efficient EBPR performance, an alkalinity balance, accounting for the influent alkalinity concentration, alkalinity consumed by nitrification, and alkalinity produced by denitrification, should be done.
Summarizing, the EBPR is a sustainable process that uses the natural metabolism of specific bacteria PAO. The stability of its performance strictly depends on a parameters affecting the lifecycle of PAO. Thus, the design parameters selection is the first step for the EBPR. Current study has an aim to practically create and study the parameters characterized the process of EBPR on the treatment plant Milano San Rocco.
5. Wastewater treatment plant Milano San Rocco
1.8General
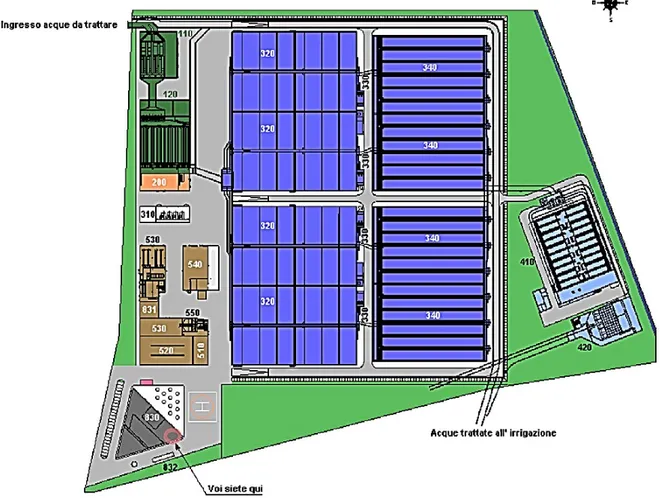
Since December 2014 MM Metropolitana Milanese has been managing and directing the Milan San Rocco Water treatment plant after moving from Degremont company on the basis of an agreement with the city of Milan. Until that date, MM had exercised only a controlling activity on the depuration, giving the city and the municipal administration all the guarantees of operational effectiveness and full environmental compatibility of the plant. The Plant San Rocco located in the Parco Agricolo Sud of Milan, between the municipalities of Rozzano and Opera, has a potential treatment of more than one million equivalent inhabitants and is located in the service of an area of 101 km2 in the western part of the city. In particular, approximately 40% of the sewage discharge of the municipality of Milan and a part of the sewerage of the municipality of Settimo Milanese flow to the Plant. The Plant became fully operational in December 2004. The layout of the Plant is presented in Figure 10. Schematic layout of the Water treatment plant Milano San Rocco.Figure 10.
Figure 10. Schematic layout of the Water treatment plant Milano San Rocco. 110 – Inflow;
120 – Pre-treatment (screening); 200 – Degritting and degreasing units;
320 – Primary biological treatment (activated sludge in 4 lines of 155.000 m3 – STEEP FEED, MBBR, IFAS, N+DN, GREENBASS;
340 – Clarifier;
410 - Sand filtration; 420 – Disinfection UV; 430 – Chemical Phosphorus remove; 310 – Air treatment; 520 – Stabilisation; 530 – Dewatering; 540 – Thickening, aerobic digestion.
1.9Advanced technology and reduced environmental impact
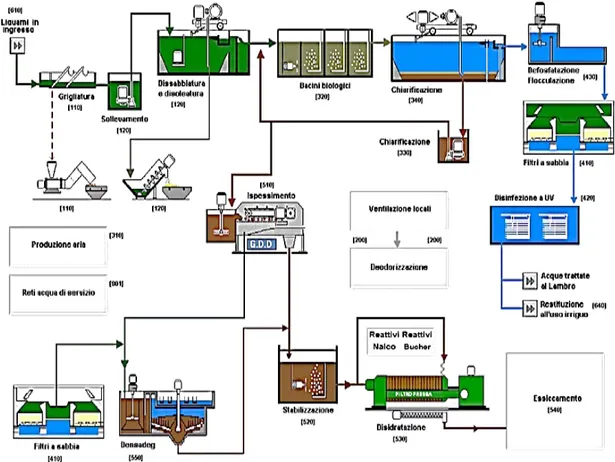
The plant has its main strength in its conceptual simplicity of the treatment process adopted. The applied technology is the mixed blend of activated sludge and biomass (IFAS process), already made on multiple plants and therefore widely tested. The aerated mixture, leaving the tank, is sent to sedimentation where the activated sludge is separated from the purified effluent, which can then be discharged from the purified surface, while the sludge is partially reintroduced into the system by means of a recirculation circuit (RAS). One part of RAS is then periodically extracted as a super flow to be sent out for disposal. For this particular application, the purification process further optimizes through the use of a step feed inflow to biological section and alternate zones process. Whole plant scheme is presented in Figure 11.
Figure 11. Process scheme of WWTP Milano San Rocco.
The wastewater line is made by 8 biologic compartment. The plant is also equipped with an innovative process control that achieves qualitatively better outputting waste limits than prescribed by applicable regulations for the benefit of environmental impact. In the final phase of the purification, the effluent is subjected to filtration on sand-filter and a further ultraviolet treatment which makes the water ideal for reuse in agriculture serving a large area (about 8000 hectares) in southwest of Milan. This practice of reuse is a tradition of good
water management, since the Middle Ages when it was established on the territory of Milan by the Cistercensi monks. The sludge resulting from the water treatment is brought to drying and disposed as inert waste,
1.10 Treatment processes
1.10.1 Pretreatment
The mechanical pre-treatments placed at the head of the plant include: double stage screening section: coarse to 30 mm and end to 3 mm; initial lifting;
degritting and degreasing (oil removal).
The inflow water coming to the plant is subjected to screening. There are four coarse automatic grids of 3 cm, followed by eight fine automatic grids of 3 mm, with the function of protecting the pumps and the biological process.
The water is then pumped (maximum flow rate of 12 m3s-1) using eight submerged pumps with single flowrate of 1.5 m3s-1. The lifting system allows the system to operate afterwards with natural gravity and inclination.
The water goes to biological treatment through four channels. The elimination of about 80% of dragged sand with fraction of 200-250 μm is obtained. The removal of oils and fats is of fundamental importance to avoid the formation of undesirable odors and foams, which would decrease the efficiency of air-to-liquid oxygen exchange. Discharged water from degritting and degreasing feed the biological process in the maximum flow rate of 9 m3s-1. The liquors from the digesters are fed to the biological treatment basins. No primary sedimentation phase is provided.
1.10.2 Biological treatment
Biological treatment, having the aim of the removal of organic and nitrogen compounds, is characterized by the presence of four parallel lines divided into two lines. Each semi-line, as shown in Figure 11, is made up of eight tubs in series, including two anoxic tanks and six aerated tanks, with the following features:
A1 tank: pre-denitrification - anoxic zone, with sludge recirculation input and first part of inflow, equipped with mechanical mixers;
O1 tank: partially aerated zone;
O2 tank: aerated nitrification zone, continuous ventilation with regulation on dissolved oxygen. Particularly interesting because in 2014 it was converted to MBBR - IFAS by adding support for the growth of biomass adhesion and the insertion of retaining grids of the suspended material;
O3 tank: oxic zone.
A2 tank: second anoxic pre-denitrification zone (second inflow), equipped with mechanical mixers;
O4 tank: nitrification-denitrification aerated zone.
O5 tank: nitrification-denitrification aerated zone by GREENBASS® process with input of inflow during the rainfall conditions;
O6 tank: nitrification-denitrification aerated zone by GREENBASS® process.
Table 5. Configuration of typical semi-line with eight tanks in a row.
The inflow to biological process is divided, depending on the flow rate, between the tanks A1, A2 and O5. Three different control levels are defined for its management:
"Low Dry ": for a flow below 0.45 m3d-1 per semi-line;
"High Dry": for a flow rate greater than 0.45 m3d-1 for semi-line and less than 0.72 m3d-1;
"Rain": for instantaneous flow greater than 0.72 m3d-1 or greater than 0.61 m3d-1 for a period longer than 60 minutes, per semi-line.
The control parameters for the inflow distribution between tanks A1, A2 and O5 are given in Table 6.
Inflow at “Dry” period 3.6 m3 s-1
Inflow at "Rain" 5.76 (4.88) m3 s-1
Inflow hydraulic distribution A1 / A2 / O5 at
"Low Dry" 100/0/0 %
Inflow hydraulic distribution A1 / A2 / O5 at
"High Dry" 70/30/0 %
Inflow hydraulic distribution A1 / A2 / O5 at
"Rain" 37/25/38 %
Table 6. Inflow distribution between tanks A1/A2/O5. 1.10.3 Secondary settling
The settling process takes place within twelve sedimentation rectangular shape tanks, with a single surface area of 1500 m2. Each settler pair is equipped with a moving bridge with independent operation from the others. On each of these, a sonar level sensor is installed to monitor the height of the mud bed. A pumping system aspirates the sludge from the sediment bottom based on the top of the sludge bed provided by the sonar. Part of the aspirated sludge is recycled to the head of the biological reactors, and a portion of the part sent to the sludge line for disposal.
Figure 12. Actual sedimentation tanks with traveling bridge.
1.10.4 Chemical phosphorus removal
Phosphorus removal is made during the sedimentation phase by adding the ferrous chloride in the proportion to the inflow concentration. The flocculated and settled FePO4 then is removed by the third filtration system.
1.10.5 Sand filtration
The plant is equipped with ten sand filters, able to reduce the concentration of suspended solids at output to a value of 1 mgL-1. Filters are provided with a mixed air and water backwash system. The backwash sludge produced is sent to the sludge line.
1.10.6 Disinfection
Before being discharged into the water body or to be used for irrigation, the water is subjected to a disinfection process. The water from the filtration section reaches the disinfection unit at a single line consisting of a two-line treatment chamber. Water passes through channels where ultraviolet lamps (UVCs) are submerged. Exploiting their germicidal power, the microbial charge is reduced obtaining partially or completely disinfected water. This depends on the final destination of the wastewater. In fact, the Milan San Rocco plant, generally from May to September, reuses irrigation treated water by feeding the rocks Pizzabrasa and Carlesca. Water for rocks is subject to more demineralization treatments, having to meet a tabular limit for Escherichia Coli of 10 UFC/100mL, unlike 5,000 UFC/100mL for drainage in the river Lambro.
7. Laboratory tests for EBPR
1.11 Laboratory test set-upThe laboratory tests were carried out in order to achieve EBPR process simulating a modification of the WWTP Milano San Rocco real flow-scheme. The first anoxic tank for laboratory research is supposed being transformed into an anaerobic tank, by avoiding nitrate recirculation and leaving without aeration for enough time in order to allow reaching the low ORP value in the mixed liquor, thus, achieving deep anaerobic conditions. Figure 13 shows a possible outline of the modified process to convert the existing process into an EBPR process
Figure 13. Possible process modification of the biological section to achieve EBPR.
As it shown in Error: Reference source not found, the possible modified biological process can be divided into two treatment stages in series: phosphorus release (under anaerobic conditions) and phosphorus uptake (at higher oxidation-reduction potential – ORP - values); P uptake occurs simultaneously with denitrification/nitrification processes.
Mixers are supposed to be installed in the anaerobic and anoxic zones for keeping the sludge in suspension. The aerobic zone is aerated with fine bubble aeration system. In general low concentration of nitrate (NOx ≤ 0.5 mg/L) should be present in RAS recycle stream. The absence of nitrates in the RAS flow entering the anaerobic zone would help keeping low ORP values, which favors P release and VFA uptake. If this is true, the RAS flow can be directly recycled to the anaerobic reactor.
For the experimentation, the proposed scheme was transformed and simplified according to the basic A/O scheme shown in Figure 5 and discussed in chapter 3. Batch tests are carried out in order to reproduce the Phoredox scheme.
Figure 14. Conceptual scheme reproduced in the laboratory batch tests.
A sample of 1 liter from RAS line has been used. The tests aim to simulate two processes with different conditions. For the first anaerobic stage the beaker was covered tight to prevent it from aeration. For the second aerobic stage the sample was transported to an open beaker with aeration diffuser plunged in it. Initial control tests have been done before partition with batch tests to regulate testing conditions.
Testing conditions
PAOs behavior and consequent effectiveness of EBPR process is strictly related to temperature variability. Test were carried out controlling wastewater temperature to 200C ± 0,5 (max ±10C). Another important parameter is pH level that should be in a range of 7.5-8.5 not to limit PAO growth.
To test the potential maximum release and uptake of phosphorus by PAO organisms in the sludge sampled from the WWTP, acetate was added under anaerobic conditions. Subsequently, to assess the P rerelease and uptake under operating conditions, real wastewater has been added in place of acetate.
In the first series of batch tests, in order to ensure the stable concentration of soluble and readily available COD and not limit the activity of PAOs, an initial dose of 30-50 mg/L of sodium acetate (CH3-COONa or, shortly, NaAc) was added. It immediate dissolves into Na+ and acetate (CH3-COO-):
CH3-COONa⟶ Na+ + CH3COO
-The second series of batch tests aim to study the real influent effectiveness as substrate to define the actual response of PAO organisms.
Tests have been repeated in different days over a two-month period. The response has been compared with literature data to assess the suitability of the wastewater to trigger the process of enhanced phosphorus removal.
1.11.1 Anaerobic phosphorus release
A real-time monitoring of the biological phosphorus process should keep record of the oxidation reduction potential (ORP) and dissolved oxygen (DO) values. DO measured values are not accurate when approaching levels close to zero. Therefore, true and actual anaerobic or anoxic conditions cannot be assessed with a simple dissolved oxygen meter.
ORP an excellent and preferred method for measuring anaerobic (a highly reducing environment). In wastewater, the oxidation-reduction potential is the tendency of the solution to either gain or lose electrons. Oxidizing agents take on electrons while reducing agents give up electrons. Raw wastewater typically contains more reducing agents than oxidizing agents and in the bacteria, in the presence of oxygen, oxidizes these reducing agents. ORP measures the movement of electrons in wastewater solution. It is a measurement of the ratio of oxidizing and reducing agents in solution. ORP is measured in millivolts (µV). Reference ranges of ORP values to check actual process conditions are presented
in Table 7 (
Gronsky, et al., 1992).
Table 7. Oxidation reduction potential (ORP) and corresponding metabolic conditions.
In this work it has been considered that ORP values lower than – 150 mV represent fermentative anaerobic conditions. The reason of this choice is described in more detail in chapter 6.
The fresh sample of RAS had very high ORP levels (over +200 µV) due to high flow velocity and turbulence that caused its re-aeration. For this reason the time of anaerobic phase was prolonged up to 12 hours during which the oxidation-reduction reactions decelerate
showing negative ORP values. Once the desired reducing conditions were achieved, 30-50 mg/l sodium acetate was instantly added to the reactor. During the following 30-60 minutes, phosphate (ortho-P) concentration was measured to determine the maximum release rate. Figure 15 illustrates the experiment set-up during anaerobic condition.
Figure 15. Laboratory equipment to carry out the anaerobic tests.
1.11.2 Aerobic phosphorus uptake
By the end of the anaerobic phase the acetate was consumed and phosphorus was released into solution, the sludge was transferred to an open beaker under aerobic conditions. During next 2-5 hours the specific aerobic phosphorus uptake rate was measured.
Figure 16. Laboratory equipment to carry out the aerobic test.
Finally the data has been collected (Table 8) and the phosphorus release/uptake curve has been constructed. As it was predicted by theory, the ORP level is rising due to the presence of DO. The resulting curve (Figure 17) of phosphorus release/uptake has good correlation with the P-profile discussed in the paragraph 3.2. Moreover, comparing the initial and final values of P, the uptake rate shows rapid dynamics, hence, the presented PAOs uptaking
orthophosphate in greater amount than their normal biological growth requirements reaching an acceptable value of 1,85 mg/l before filtration stage.
Process Anaerobic Aerobic
Time, min 0 5 15 30 60 65 75 90 120 180 240 300
ORP, µV -324 -316 -321 -325 -334 -320 -318 -280 -33 14,2 23,7 43 P, mg/L 8,1 22 34,65 36,1 38,05 37 35 26,15 16,05 5,96 3,16 1,85
Table 8. Results of ortho-P and ORP level during 27 of April test.
Figure 17. Phosphorus release/uptake curve example from 27 of April).
Phosphorus release and uptake were done from 18 of April till 8 of June. In each testing day a new sample of sludge (from the recycle flow, RAS) was taken.
Some tests have been done after leaving the sludge sample unaerated overnight, to reduce its ORP to values lower than -150 mV before adding the organic substrate. The results of tests are shown in Appendix 1.
9. Factors affecting performance of EBPR
on Milano San Rocco WWTP
1.12 Anaerobic conditionsLowest ORP values (less than 300 µV) corresponding to anaerobic conditions were observed after 12 hours with primary release of phosphorus into surrounding liquid. This release of P is a prerequisite for further uptake of phosphorus and its amount shows more than 20% of final accumulated P.
Date anaerobicphase (h) ORP
(mV) P of fresh sample (mg/L) P release (mg/l) P1 prerequisite released (mg/l) Type of substrate added Substrate added P relase final (mg/L) ∆P1/Pfinal (%) 19/04 2,5 -134 1,97 2,88 0,9 NaAc 30 mg/l 10,40 9% 20/04 4 -165 2,21 3,24 1,0 NaAc 30 mg/l 14,38 7% 26/06 6 -190 2,34 4,71 2,4 NaAc 30 mg/l 17,65 13% 27/04 >12 -324 2,31 8,10 5,8 NaAc 50 mg/l 38,05 15% 02/05 >12 -318 3,57 13,6 10,0 NaAc 50 mg/l 36,30 28% 03/05 >12 -200 2,33 21,0 18,7 inflow 100 ml 33,15 56% 09/05 >12 -319 2,91 26,8 23,9 NaAc 50 mg/l 36,15 66% 17/05 >12 -304 2,35 23,8 21,5 inflow 200 ml 30,30 71% 24/05 6 -147 3,34 11,18 7,8 inflow 200 ml 13,06 60% 30/05 6,5 -102 1,28 7,35 6,1 inflow 200 ml 11,25 54% 31/05 >12 -338 1,92 8,83 6,9 NaAc 50 mg/l 36,00 19% 08/06 3 -27 2,17 2,65 0,5 NaAc 50 mg/l 10,42 5%
Table 9. Results of prerequisite phosphorus release.
Red values shown in Table 9 correspond to a P release higher than 20% of the initial concentration. However, the high redox potential of recycled sludge prevented a good P release. The tests on 27th April and 31st May gave low P release values in spite of the very low ORP and the addition of acetate. These exceptions were probably affected by some unknown reasons (e.g.: unwanted re-aeration of the sludge sample, error in sampling, etc.). In general, good results were achieved after the sludge has been kept unaerated for more than 6 hours, before adding the organic substrate.
Also, phosphorus removal capacity can be referred to the unit biomass (as MLSS, Table 10). It increases with increasing anaerobic retention time, with no increase in soluble COD. This is an indication the hydrolyzed biodegradable substrate has been absorbed by the biomass.
Date anaerobicphase (h) (mV)ORP Type of substrate added Substrate added X MLSS (g/l) ∆P total (mg/l) ∆Ptot/X (mg/g) 19/04 2,5 -134 NaAc 30 mg/l 5,47 8,4 1,5 20/04 4 -165 NaAc 30 mg/l 4,89 12,2 2,5 26/06 6 -190 NaAc 30 mg/l 4,7 15,3 3,3 27/04 >12 -324 NaAc 50 mg/l 6,07 35,7 5,9 02/05 >12 -318 NaAc 50 mg/l 6,94 32,7 4,7 03/05 >12 -200 inflow 100 ml 4,04 30,8 7,6 09/05 >12 -319 NaAc 50 mg/l 7,18 33,2 4,6 17/05 >12 -304 inflow 200 ml 6,6 28,0 4,2 24/05 6 -147 inflow 200 ml 5,6 9,7 1,7 30/05 6,5 -102 inflow 200 ml 4,28 10,0 2,3 31/05 >12 -338 NaAc 50 mg/l 6,12 34,1 5,6 08/06 3 -27 NaAc 50 mg/l 3,2 8,3 2,6
1.13 Availability of readily biodegradable carbon sources
The amount of the readily biodegradable carbon compounds cannot be measured directly so various authors have proposed different approaches to estimate this portion into the inflow wastewater. Typically some indirect methods were proposed to assess this factor.
In this work two experimental methods have been used to quantify the rbCOD: physically and biologically based.
1.13.1 Physical method – flocculation-filtration method
The physical methods offer some advantage over the biological methods. They are relatively simple and the results can be obtained in a relatively short period. The main idea of physical methods is laid in the observed differences in molecule size: rbCOD consists of relatively small molecules that are readily transported into microbial cells, whereas sbCOD comprises larger and more complex molecules that require extracellular breakdown (hydrolysis) to smaller units before uptake and utilization. Accordingly, physical separation of the two biodegradable COD fractions on the basis of molecular size has been proposed by several research works (Mamais et al., 1993; Bortone et al.,1994) as an approximation of the observed biokinetic division. The principle used for the filtration method is the larger the pore size, the more particulate material passes through the filter and the less accurate the separation between rbCOD and sbCOD. Filtration membrane 0.45μm was proposed to overcome this problem, separation of colloidal/particulate material (sbCOD) before filtration through filters.
Testing procedure
For the flocculation-filtration, 100 ml sample of influent was dosed with 1 ml of aluminium sulphate Al(SO4)3. The mixture was stirred rapidly for 2 minutes and then flocculation phase was observed. During the flocculation phase, aggregated and settled flocs leave a “clear” liquid zone. Then 5 ml sample was drawn from the clear liquid zone and filtered through a glass fiber paper filter and the COD of the filtrate is determined using appropriate COD cuvette test (ISO 15705). Observations of the test set up are presented on Figure 18 and Figure 19.
Figure 18. Flocculated and settled influent sample with “clear” zone.
Figure 19. Filtrated soluble COD.
In the test procedure, the filtrate derived from the influent contains both rbCOD and unbiodegradable soluble COD (usCOD), since both COD fractions are soluble. In order to define different fractions of the influent COD the data of COD outflow was taken. Considering the final filtration and observing very little values of suspended solids (SS_out) < 1 mg/L, it was assumed that COD_out has tiny amount of rbCOD and thus, can be neglected. The difference between COD_ff of influent and COD_out will result the rbCOD fraction, see Table 11.
Data COD_tot COD_ff_in COD_sol_out SS_out rbCOD_ff
% of COD_t ot 17/05 263 48 8 1 40 0,15 18/05 275 68 13 2 55 0,20 24/05 263 39 7 1 32 0,12 08/06 234 52 8 1 44 0,19
Table 11. Physical method results of COD fractions. An approximation of 20% of total COD can be considered as rbCOD.
1.13.2 Biologically based method – respirometric tests
Biological method indirectly measures biodegradable substrate. Respirometry is basically based on the measurement of oxygen consumption by an active sludge in response to certain substrate injections in the sludge appropriately placed in a laboratory bioreactor under aerobic conditions. OUR (Oxigen Uptake Rate) is a measure directly related to the consumption of substrate by biomass, hence its growth kinetics.
OUR(t) = OURh + OURend = (1- YH)*dS(t)/dt + OURend
where S is the degraded substrate in terms of concentration of COD, YH is the maximum heterotrophic yield or thermodynamic yield expressed as gCOD-biomass/gCOD-substrate, OURend is the rate of oxygen consumption for endogenous metabolism.
In current laboratory test the "single-OUR" method is been used. Following the procedure it is sufficient to have a single descending curve of dissolved oxygen in closed respirometry. The method involves a closed breathing experiment: an influent dosage is made of aerated active sludge, under endogenous conditions and after ATU injection to inhibit nitrification activity. The choice of sodium acetate as the reference synthetic substrate is common as a representative of the readily biodegradable fraction of a municipal wastewater. The method assumes that the biomass assimilates the rbCOD present in the wastewater in the same way of sodium acetate. After that, rbCOD of the wastewater is calculated starting from the DO cons reports the dynamics of DO concentration due to the addition of a small amount of readily biodegradable substrate. The dynamics of DO concentration due to the addition of a small amount of readily biodegradable substrate is presented in Figure 20.
Zone 1-2. DO saturation level in the activated sludge suspension is maintained by continuous aeration.
Zone 2-3. Aeration stopped; without any substrate addition the DO concentration decreases at a constant rate corresponding to endogenous respiration (OURend).
Zone 3-4. With the addition of a pure readily biodegradable substrate (sodium acetate), the rate at which the sludge consumes DO increases and we observe a steeper slope.
Zone 4-5. When the substrate is completely depleted from the liquid, the DO decreases at a much lower rate, close (even not equal) to the initial endogenous conditions (OURend). After the complete removal of the substrate added, ∆DO = (DO4*-DO4) represents the short-term oxygen consumption due to the substrate added. However, when real effluent is added, the trend may not be linear, and a curve may be observed.
Procedure
The COD of the acetate can be determined theoretically on the basis of ThOD (Theoretical Oxygen Demand) ≈ 0.78 gCOD/gAcetate added.
To calculate the calibration curve three independent tests were done to get points, each point obtained with a different dose of acetate according to the following procedure:
1) a sample of 1 liter of pre-aerated activated sludge after dosing ATU (10-20 mg/L); 2) bring DO concentration close to saturation (> 6.5 mgO2/L) by aerating for a few minutes; 3) stop the aeration and immediately after that add a known amount of CH3COONa
(predefined 6, and 12 mg/l);
4) measure the concentration of oxygen every 10 seconds;
5) stop measuring the DO when the concentration of DO reaches the lower limit value of 2 -1.5 mgO2/L (but the current test was prolonged till zero level);
6) Repeat the procedure (step 2 to 6) adding increasing amounts of acetate.
Results give three dissolved oxygen curves (Figure 21) from which ∆DO (referred to substrate addition response) is then used to calculate heterotrophic yield.
Figure 21. Series of dissolved oxygen (DO) profiles – with NaAc addition 8 of May 2017. The last test was done using the 100 ml sample of real influent as substrate addition.
Figure 22. Dissolved oxygen (DO) profile with inflow addition 8 of May 2017
Assuming that the only available substrate is the one added, the consumption of oxygen through the integration into the time of the exogenous OUR can be calculated.
The YH (heterotrophic yield) value derive from the following relations: bCOD = CODoxidised + CODsynth
rbCOD = ∆DO+YH*rbCOD YH = 1- ∆DO/rbCOD mg/l of NaAc rbCOD 0,78 grbCOD/gAcN a ΔDO,mg/ L Yh 6 4,68 3,3 1,4 0,70 8 6,24 4,4 1,80 0,71 12 9,36 6,9 2,5 0,73 average YH 0,72
YH from inflow line 0,77
rbCOD inflow, mg/l 47,11
Table 12. Results of YH and rbCOD of influent 8 of May 2017.
The ∆DO value obtained with the dosage of the wastewater is used in the calibration curve to obtain the corresponding COD value.
4 5 6 7 8 9 10 0.0 0.5 1.0 1.5 2.0 2.5 3.0 f(x) = 0.23 x + 0.32 R² = 1
rbCOD mgCOD/l vs.oxygen consumption mg/l
Figure 23. Calibration curve for rbCOD determination in influent wastewater 8 of May 2017. Comparing with physical method the same percentage (20%) of rbCOD from COD total was reached by respirometric tests.
1.14 Phosphorus release and denitrification
In general the more phosphorus is released in an anaerobic tank, the higher the removal efficiency. However, if nitrates are present, competition occurs between denitrifying bacteria and phosphate-accumulating bacteria for organic carbon. This affects the uptake of VFAs and hence the synthesis of PHAs and the subsequent release of phosphorus during aeration phase. Therefore, nitrates should be removed before getting the anaerobic tank where P release has to take place. This can be done by adding a pre-anoxic tank to perform endogenous denitrification (as reported in Virginia plant scheme in Figure 8) or by a sludge recirculation from the anoxic tank to the anaerobic tank (as reported in Johannesburg plant scheme in Figure 9).
In present laboratory tests which mimic the A/O plant type, the prolonged period of anaerobic conditions guarantees the NOx concentration.
1.15 Evaluation of conditions that may favor EBPR at Milano San Rocco WWTP
In paragraph 1.7.1. it was discussed the direct correlation between the EBPR efficiency and the influent wastewater characterization parameters. As it was defined, the ratio VFA/P and rbCOD/P are the most direct correlations for potential evaluation of EBPR performance. To verify this statement the data of 30 days was taken. With the absence of VFA and rbCOD data, the reference percentage of 20% of total COD for rbCOD is assumed.
April
COD_in rbCOD BOD₅_in P TOT_in COD/P rbCOD/P BOD/P ORP range, mV mgO₂/l mgO₂/l mgO₂/l mgP/l Favorablewhen >60 Favorablewhen >18 Favorablewhen >30
1 405 81 219 3,82 106,0 21,2 57,3 -50...-320 2 366 73,2 216 3,32 110,2 22,0 65,1 3 439 87,8 222 5,57 78,8 15,8 39,9 4 346 69,2 203 4,95 69,9 14,0 41,0 5 488 97,6 183 4,87 100,2 20,0 37,6 -90...-370 6 405 81 183 4,68 86,5 17,3 39,1 7 342 68,4 200 5,20 65,8 13,2 38,5 8 332 66,4 185 5,45 60,9 12,2 33,9 9 512 102,4 220 5,80 88,3 17,7 37,9 10 464 92,8 210 5,12 90,6 18,1 41,0 -120...-380 11 450 90 235 4,82 93,4 18,7 48,8 12 453 90,6 235 4,80 94,4 18,9 49,0 13 405 81 229 4,48 90,4 18,1 51,1 14 360 72 229 3,03 118,8 23,8 75,6 -200...-390 15 410 82 241 2,85 143,9 28,8 84,6 16 340 68 209 2,68 126,9 25,4 78,0 17 385 77 229 2,73 141,0 28,2 83,9 -180...-400 18 400 80 230 5,35 74,8 15,0 43,0 19 415 83 254 4,50 92,2 18,4 56,4 20 300 60 174 4,22 71,1 14,2 41,2 21 400 80 158 3,90 102,6 20,5 40,5 -150...-370 22 380 76 161 3,70 102,7 20,5 43,5 23 395 79 170 4,08 96,8 19,4 41,7 24 350 70 132 4,35 80,5 16,1 30,3 25 360 72 164 4,32 83,3 16,7 38,0 26 272 54,4 130 2,31 117,7 23,5 56,3 -130...-300 27 517 103,4 320 2,09 247,4 49,5 153,1 28 172 34,4 70 2,60 66,2 13,2 26,9 29 238 47,6 82 3,15 75,6 15,1 26,0 -30…-280 30 171 34,2 82 3,02 56,6 11,3 27,2
Table 15. Influent WW parameters and their ratios to P.
5 presents the main WW characteristics during April (COD total, BOD5 and rbCOD) and their ratios to total phosphorus concentration in the influent. Results show that, in general, at low rbCOD/P ratios correspond low influent COD (< 350 mg/L).
ORP data in tank O1 were also considered in the same period. It was expected that low ORP values may indicate favorable conditions for EBPR. However ORP values depend highly on measurements techniques and location of the tester. ORP values are presented in Appendix 2.