ALMA MATER STUDIORUM – UNIVERSITÀ DI BOLOGNA
SCUOLA DI INGEGNERIA E ARCHITETTURA
DIPARTIMENTO DICAM in collaborazione con il Departamento de Química FCT dell’ UNIVERSIDADE NOVA DE LISBOA
CORSO DI LAUREA IN INGEGNERIA PER L’AMBIENTE E IL TERRITORIO Curriculum internazionale Earth Resources Engineering
TESI DI LAUREA IN (tesi all’estero)
Biotechnology for the sustainable reclamation of contaminated lands and waters
Implementation of Enhanced Biological Phosphorus Removal
(EBPR) wastewater treatment processes enriched
with different microbial communities
CANDIDATO: RELATORE:
Giuseppe Alessio Costa Chiar.mo Prof. Lorenzo Bertin
CO-RELATORE: Dott. Adrian Oehmen
Sessione II
A mia mamma
che ha permesso questo nonostante tutto
1
ACKNOWLEDGEMENTS
I really would like to thank the Universidade Nova de Lisboa and the Faculdade de Ciencias e Tecnologia that have made this work possible: my first experience in a laboratory for 6 months in a wonderful city like Lisbon.
Thanks to my professor Bertin, my supervisor Dr. Adrian Oehmen, the coordinator of the department Maria Reis and especially Jorge and Monica that had the patience to teach me so many things in the laboratory, even in situations of pressure and in a demanding working environment that has made me grow in a topic that personally I have been always fascinated: the wastewater treatment processes.
Six months of erasmus that I will never forget in my life.
I thank also my family, my mum Anna and my sister Valentina, those people that have always believed in me and given to me all their support to face this hard adventure in ERE, the international faculty of environmental engineering in Bologna and given to me all the best advices while I was in Portugal and have visited me in fantastic days in which we have visited some beautiful cities in Portugal like Porto, Fatima, Coimbra, Cascais, Cabo de Roca and finally Lisbon in just a few days.
Thanks to Sergio, my Italian friend, that funny guy with which we spent a good time in the lab, without his jokes my permanence in the faculty would have been more monotonous and alone. Good conversations with him, difficult to have when you are abroad.
I thank also those wonderful Iranian guys that are Peymann, the first one met in Bologna, Amirreza, Mj, with their jokes they have made some days at university more funny.
Portineria Risorgimento staff too! Even with the part-time job they have allowed me to work on my thesis and supported me.
Last but not least, thanks to the wonderful colleagues of ERE: Eleonora, Paola, Andreina, Orsola. Despite all our trips in Europe, we have been good friends and colleagues of university, the lessons would have been more boring without their presence and also the last 2 years in Bologna!
I dedicate this thesis to my cousin’s baby that has come to this world on 2nd December!
2
Index
ACKNOWLEDGEMENTS ... 1
List of tables ... 3
List of figures ... 4
Abstract (in italiano) ... 6
I.Introduction ... 8
II. Sequencing Batch Reactors (SBR) ... 10
III. Metabolism of Tetrasphaera and Accumulibacter ... 12
IV. Operation of the bioreactors ... 14
V. Analysis ... 20
V(a). Skalar analysis ... 21
V (b). TSS and VSS ... 25
V(c). TOC analysis ... 26
V(d). HPLC ... 27
V(e). FISH ... 29
V (f). Batch tests ... 33
VI. MATERIAL AND INSTRUMENTS ... 36
VII. RESULTS and discussion ... 41
VII (a). Skalar ... 41
VII (b). TOC ... 62
VII (c). VSS and TSS ... 66
VII (d). Batch tests ... 69
VII (e). FISH results ... 72
CONCLUSIONS ... 76
Bibliography ... 77
Appendix I. Accumulibacter TSS and VSS ... 78
3
List of tables
Table 1. Carbon source composition for Tetrasphaera 17
Table 2. Phosphorus source composition for Tetrasphaera 17
Table 3. Nitrate source composition for Tetrasphaera 17
Table 4. Carbon source composition for Accumulibacter 17
Table 5. Phosphorus source composition for Accumulibacter 17
Table 6. Nitrate source composition for Accumulibacter 18
Table 7. Micronutrients composition 18
Table 8. Accumulibacter phases duration 18
Table 9. Tetrasphaera phases duration 18
Table 10. Hybridization buffer preparation 31
Table 11. Washing buffer preparation 32
Table 12. Batch test preparation 35
Table 13. Anoxic and aerobic phosphorus uptake for Accumulibacter 50 Table 14. Anoxic and aerobic phosphorus uptake for Tetrasphaera 51
Table 15. Nitrate uptake for Accumulibacter 51
Table 16. Nitrate uptake for Tetrasphaera 51
Table 17. Ammonia anoxic uptake for Accumulibacter 51
Table 18. Ammonia anoxic uptake for Tetrasphaera 51
Table 19. General table of phosphorus analysis 55
Table 20. General table of ammonia analysis 55
Table 21. General table of nitrate analysis 56
Table 22. Nitrate analysis in batch tests (A, B) in duplicates for Acc 58 Table 23. Nitrate analysis in batch tests (A, B) in duplicates for Tet 60
Table 24. Test B for Tetrasphaera, analysis of nitrite 60
Table 25. Test B for Accumulibacter, analysis of nitrite 61
4
List of figures
Figure 1. Primary and secondary wastewater treatment, www.brighthub.com 9
Figure 2. Typical SBR stages, www.t-and-d-italy.com 10
Figure 3. Tetrasphaera bioreactor 14
Figure 4. Accumulibacter bioreactor 14
Figure 5. Sampling preparation 20
Figure 6. Skalar analyzer 21
Figure 7.Tetraspherafilterafter 550°C 25
Figure 8. Filtering the sample 25
Figure 9. TOC analyzer 26
Figure 10. HPLC column 27
Figure 11. Calibration curve for propionic acid 28
Figure 12. Calibration curve for acetic acid 29
Figure 13. FISH microscope 29
Figure 14. Batch system 33
Figure 15. Autoclave 36
Figure 16. Centrifuge 36
Figure 17. Dryer for VSS evaluation 37
Figure 18. Filter paper 37
Figure 19. Filtration system 37
Figure 20. 550°C oven 38
Figure 21. 100°C oven 38
Figure 22. Carbon source pump for Tetrasphaera 38
Figure 23. Pump for nitrate feed for Tetrasphaera, carbon and nitrate for Acc. 39 Figure 24. Pump for phosphorus feed to Tetrasphaera reactor 39 Figure 25. Pump for the phosphorus feeding to Acc. reactor 40
Figure 26. pH meter 40
Figure 27. Analysis of phosphorus in the whole cycle (Feb-May 2014 41 Figure 28. Analysis of phosphorus in the whole cycle (May-June 2014) 42
Figure 29. Anoxic phosphorus uptake for Accumulibacter 42
Figure 30. Aerobic phosphorus uptake for Accumulibacter 42 Figure 31. Net phosphorus removal for the Acc. bioreactor in the whole analyzed period 43 Figure 32. Analysis of phosphorus in the whole cycle (13-19th Feb 2014) 44 Figure 33. Analysis of phosphorus in the whole cycle (Feb - May 2014) 44 Figure 34. Analysis of phosphorus in the whole cycle (May-June 2014) 44
Figure 35. Anoxic phosphorus uptake for Tetrasphaera 45
Figure 36. Aerobic phosphorus uptake for Tetrasphaera 45
Figure 37. Net phosphorus removal for the Tet. bioreactor in the whole analyzed period 46 Figure 38. Analysis of phosphorus in the whole cycle of Accumulibacter (Feb - June 2014) 47
Figure 39. Anoxic ammonia uptake for Accumulibacter 47
Figure 40. Analysis of ammonia in the whole cycle of Tetrasphaera (Feb - June 2014) 48
Figure 41. Anoxic ammonia uptake for Tetrasphaera 49
Figure 42. Nitrate uptake for Accumulibacter 50
Figure 43. Nitrate uptake for Tetrasphaera 50
Figure 44. Denitrification activity of Tetrasphaera in the whole analyzed period 52 Figure 45. Denitrification activity of Accumulibacter in the whole analyzed period 53 Figure 46. Anaerobic Tetrasphaera activity in the whole analyzed period 53 Figure 47. Anaerobic Accumulibacter activity in the whole analyzed period 54 Figure 48. Phosphorus analysis in batch tests (A,B,C) in duplicates 54
5
Figure 49. Ammonia analysis in batch tests (A,B,C) in duplicates 55 Figure 50. Nitrate analysis in batch tests (A,B,C) in duplicates 56 Figure 51. Phosphorus analysis in batch tests (A,B) in duplicates for Acc 57 Figure 52. Ammonia analysis in batch tests (A,B) in duplicates for Acc 57 Figure 53. Nitrate analysis in batch tests (A,B) in duplicates for Acc 58 Figure 54. Phosphorus analysis in batch tests (A,B) in duplicates for Tet 59 Figure 55. Ammonia analysis in batch tests (A,B) in duplicates for Tetrasphaera 59 Figure 56. Nitrate analysis in batch tests (A,B) in duplicates for Tetrasphaera 60 Figure 57. Nitrite analysis in batch tests (B) in duplicates for Tetrasphaera 61 Figure 58. Nitrite analysis in batch tests (B) in duplicates for Accumulibacter 61 Figure 59. Total organic carbon analysis (Feb-July 2014) 63 Figure 60. Total organic carbon (total removal) in the whole analyzed period 63 Figure 61. Total organic carbon (anaerobic removal) in the whole analyzed period 64 Figure 62. Total organic carbon ratio (anaerobic / total removal) in the whole analyzed period 64 Figure 63. Anaerobic Tetrasphaera activity in the whole analyzed period 65
Figure 64. TSS for Acc. in the whole analyzed period 66
Figure 65. VSS for Acc. in the whole analyzed period 67
Figure 66. TSS for Tet in the whole analyzed period 67
Figure 67. VSS for Tet in the whole analyzed period 68
Figure 68. VSS/TSS for Acc. in the whole analyzed period 68 Figure 69. VSS/TSS for Tetrasphaera in the whole analyzed period 69 Figure 70. N2O analysis for Accumulibacter test B (4th June 2014) 69 Figure 71. N2O analysis for Accumulibacter test B (4th June 2014), selected data 70 Figure 72. N2O analysis for Accumulibacter test A (3rd June 2014) 70 Figure 73. N2O analysis for Tetrasphaera test A (4th July 2014) 71 Figure 74. N2O analysis for Tetrasphaera test B (6th July 2014) 71 Figure 75. N2O analysis for Accumulibacter test C (5th June 2014) 72 Figure 76. FISH image with EUB and PAO probes, March 2014 73 Figure 77. FISH image with EUB and TET-174 probe, March 2014 73 Figure 78. FISH image with EUB and TET-266 probe, March 2014 74 Figure 79. FISH image with EUB and GAO probes, February 2014 74 Figure 80. FISH image with EUB and TET-654 probe, March 2014 75 Figure 81. FISH image with EUB and TET-174-266-654 probes, July 2014 75 Figure 82. FISH image with EUB and PAO probes, July 2014 75
6
Abstract (in italiano)
Il progetto ha l’obiettivo di studiare e favorire il processo di rimozione di fosforo da acque reflue in impianti dedicati al loro trattamento, sulla base del processo EBPR (Enhanced Biological Phosphorus Removal). Allo scopo, verranno utilizzati due bioreattori, arricchiti con microbatteri accumulatori di fosfato (PAO, Polyphosphate Accumulating Organisms) ed operanti come SBR (Sequencing Batch Reactors), alimentati ad intermittenza con 3 soluzioni, una di carbonio, una di fosforo e una di nitrato. I PAO utilizzando la sorsa di carbonio come COD, rimuovono sia il fosforo accumulato nella biomassa come polifosfato, che il nitrato, usato come accettore di elettroni. In una prima fase di acclimatizzazione si è cercato di individuare il rapporto tra la quantità di carbonio, fosforo e azoto che alimentati al bioreattore consentisse il corretto sviluppo e l’arricchimento della popolazione microbica di interesse (PAO) in equilibrio con altre popolazioni. Per contro, altri microrganismi, naturalmente presenti in un impianto di depurazione seppur in piccole quantità competono con i PAO e consumano importanti nutrimenti per essi stessi, non portando alla rimozione del fosforo.
I principali competitori studiati in questo campo sono i cosiddetti GAO (Glycogen Accumulating Bacteria) soprattutto per il consumo di carbonio. Precedenti studi (Oehmen et al.) hanno dimostrato che una alimentazione di carbonio con 75 % di acetato e 25 % di propionato risulta più favorevole ai PAO, in questo modo la popolazione di GAO può essere ridotta, in concomitanza con un pH pari a 7.5.
Accumulibacter e Tetrasphaera, inoltre, sono in grado di usare come accettore di elettroni il nitrato. In questo modo si può ottenere la rimozione simultanea di nitrati e di fosfati. Ci sono, infatti, due tipi di PAO denitrificanti: un tipo usa il nitrato come accettore di elettroni e lo converte in nitrito e infine in azoto molecolare in una serie di passaggi metabolici. Un secondo tipo, invece, usa il nitrito che viene convertito in azoto molecolare. Quindi teoricamente tutti i nitrati e i nitriti vengono convertiti in azoto molecolare (N2) che può essere emesso in atmosfera senza problema di sorta.
Ma ci potrebbero essere delle reazioni con vie metaboliche alternative che potrebbero attivarsi e portare alla produzione finale di ossidi di azoto (NOx), causando seri
problemi se emessi in atmosfera.
Alcuni studi (Kampschreur et al., “Nitrous oxide emission during wastewater treatment”,Water research, 2009) confermano l’emissione di questo potente gas ad effetto serra da impianti di trattamento di acque reflue, soprattutto sottoforma di N2O
contribuendo al cambiamento climatico.
Lo scopo di questo lavoro è anche quello di controllare questa emissione e cercare di minimizzarla, sviluppato nella seconda fase del progetto. Per fare ciò si utilizzano delle speciali sonde che misurano la concentrazione di ossidi di azoto emessi dai bioreattori durante tutte le fasi (anaerobiche, anossiche e aerobiche) 24 ore su 24. Il monitoraggio dei processi che verranno allestiti sarà di tipo sia chimico che biologico. Nel primo caso, verrà determinata la concentrazione di TOC (Total Organic Carbon) via analizzatore elementale, dei nutriliti target (fosfato, nitrato,
7
nitrito, azoto ammoniacale) via spettrofotometria, di carbonio in forma di acidi grassi volatili via HPLC (High Performance Liquid Cromatography), di solidi sospesi totali (TSS) e solidi sospesi volatili (VSS) via tecniche standard gravimetriche.
Nel secondo caso, l’impiego di tecnica FISH (Fluorescence In Situ Hybridization) sarà applicata per identificare qualitativamente la popolazione di microrganismi nei bioreattori.
8
I.Introduction
Wastewater treatment plants remove most pollutants from wastewater before being released to water bodies. In general, there are different steps of treatment: primary, secondary, optional tertiary and disinfection. In the primary treatment suspended and floated solids are taken away and sedimentation removes also suspended solids.
The secondary treatment, usually biological and called activated sludge process, is related to the removal of dissolved organic matter performed by microbes communities. A secondary sedimentation is done in this stage to remove more suspended solids. The tertiary treatment is used to remove additional pollutants, but it is generally quite expensive and not so widespread.
Sedimentation basins called clarifiers are used to allow the sludge sedimentation. A disinfection typically with chlorine or UV is done before the discharge of the effluent in order to kill harmful organisms (disease bearing microorganisms or pathogens). A treatment of the waste sludge is also required before disposal.
The EBPR (Enhanced Biological Phosphorus Removal) is a type of secondary treatment in WWTP (WasteWater Treatment Plants), quite largely used in full-scale plants worldwide. The phosphorus present in aquatic systems in high amounts can cause the growth of algae and other photosynthetic microorganisms, such as cyanobacteria (more known as blue-green algae) and consequently the death of the fauna and flora. For this reason, recently this treatment has been developed to remove the phosphorus from wastewater and in this way to respect the regulation on P removal, nowadays getting more and more stringent.
The EBPR promotes the phosphorus removal without the use of chemical precipitants, being an environmentally friendly technique and is achieved through the activated sludge process recirculating the sludge and alternating anaerobic and aerobic conditions. Then, the waste sludge enriched in polyphosphate is removed. The recirculation and the use of not expensive sources make this process cost-effective and sustainable.
A specific biomass is used in order to remove the phosphorus, the so-called PAOs (Polyphosphate Accumulating Organisms) that accumulate the phosphorus in form of polyphosphate in their cells.
Some of these organisms, the so-called DPAO (Denitrifying Polyphosphate Accumulating Organisms) use as electron acceptor the nitrate or nitrite, contributing in this way also to the removal of these compounds from the wastewater. In theory, nitrate and nitrite are converted in molecular nitrogen that can be emitted in the atmosphere, but there could be side reactions carrying to the formation of nitrous oxides (NOx), a real problem for their contribution to the greenhouse effect being 300
times stronger than CO2 (IPCC, 2011). See paragraph III. Metabolism of
Tetrasphaera and Accumulibacter for more details.
The aim of this project is to simulate in laboratory scale the EBPR, acclimatizing the biomass and enriching it, with the final objective of controlling the NOx production.
9
In order to measure the removal of COD, phosphorus and nitrogen-derivate compounds, different analysis are performed: Skalar (measuring the concentration of phosphorus, nitrate, nitrite and ammonia), TOC (Total Organic Carbon, measuring the carbon consumption in Tetrasphaera), HPLC (High Performance Liquid Chromatography, measuring the carbon consumption in PAOs), total and volatile suspended solids according to standard methods APHA (American Public Health Association, TSS and VSS, measuring the biomass enrichment), FISH (Fluorescence In Situ Hybridization, measuring qualitatively the microorganism population).
Batch test are also performed to monitor the NOx production. Some examples of
results are reported in the paragraph VI.Results and discussion.
The experimental work is carried out at the Faculdade de Ciências e Tecnologia of Universidade Nova de Lisboa (FCT-UNL) from February to July 2014 with the supervision of Doctor Adrian Oehmen.
10
II. Sequencing Batch Reactors (SBR)
The two bioreactors are operated as Sequencing Batch Reactors (SBRs), the fill and draw version of the activated sludge process. They are batch reactors operating on a number of cycles, each one including these phases: fill, react, settle, decant and idle. The time of each cycle can be manipulated in order to achieve biological nutrient removal alternating anoxic, anaerobic and aerobic. All the metabolic reactions and solid-liquid separation occur in one tank and in a specific time sequence. The exposure of the microorganisms to specific process conditions does not depend on the inflow coming inside the reactor, so this system is particularly appropriate in areas where the flow conditions of the wastewater is low or variable.
The SBR process operates within the following stages:
1) In the filling phase the influent is added to the biomass in aerated or non-aerated conditions
2) In the reacting phase the wastewater flow is limited, mixing the reactor
3) In the settling phase there is neither inflow nor outflow in quiescent conditions where there is the separation between the solid phase (biomass) and the liquid phase (supernatant)
4) In the drawing phase the clarified supernatant is discharged
5) The idling phase is a restricted period of time between draw and fill, particularly useful when there is more than one SBR.
11
The advantages over conventional activated-sludge process are the following: 1) The treatment is effective independently on the influent flow rate
2) Ideal conditions for good activated-sludge settleability and less sludge production 3) Greater operational flexibility, using automatic controls and varying the duration of the phases
12
III. Metabolism of Tetrasphaera and Accumulibacter
The Tetrasphaera microorganisms are polyphosphate accumulating organisms able to uptake aminoacids as carbon source, Accumulibacter are other PAOs, much more studied and known than Tetrasphaera, able to uptake organic carbon (volatile fatty acids, VFA) such as acetate and propionate. Both of them are largely responsible of phosphorus removal in wastewater treatment plants with activated sludge. They are mainly used in EBPR.
In the anaerobic phase the organic carbon is taken up and phosphorus is released from the cleavage (hydrolysis) of the polyphosphate compounds present in the wastewater. The energy needed to break the polyphosphate bonds comes from a polymeric compound known as PHA (PolyHydroxyAlkanoates) in the case of Acc. but still not known for the Tet. This polymer comes from the uptake of carbon (VFA, Volatile Fatty Acids such as acetate and propionate) that is accumulated inside the microorganism in the form of PHA. This is an energy source for the microorganism. In this phase also glycogen is degraded.
In the aerobic phase there is the phosphorus uptake, the PHA oxidation, so that the energy can be used and the glycogen regeneration. In this phase the biomass grows and proliferates.
In the aerobic phase the electron acceptor is oxygen whereas in the anaerobic is nitrate or nitrite. The fact that nitrogen can be used as electron acceptor in the anaerobic phase is an advantage because both nitrogen and phosphorus are removed in the same process.
There are two types of denitrifying PAOs (DPAOs): the Accumulibacter of type I uses nitrate as electron acceptor that is converted in nitrite and finally in molecular nitrogen (N2). The Accumulibacter of type II uses nitrite as electron acceptor
converting it in N2 (Oehmen et al., 2010). So, in theory all nitrate and nitrite are
converted in N2 that can be emitted in the atmosphere without problems. But there
could be some side reactions carrying to the formation of nitrogen oxides (NOx)
causing serious problems if emitted in the atmosphere. In fact this gas has a greenhouse effect 300 times stronger than CO2 (IPCC, 2011). Studies (Kampschreur et al., 2009) confirm the emission of this greenhouse gas from wastewater treatment plant, especially in the form of N2O contributing to climate change. The aim of this work is to monitor this emission and try to minimize it.
Below it is shown what happens in each phase, regarding the PHA, phosphate, biomass and glycogen.
13 PAOs
Anaerobic phase: Aerobic/Anoxic phase: - VFAs uptake - PHA degradation
- storage of PHA - Phosphorus removal - polyphosphate hydrolysis - biomass growth
- phosphorus release - glycogen production - glycogen degradation
GAOs
Anaerobic phase: Anaerobic/anoxic phase: - VFAs uptake - PHA degradation - biomass growth
- storage of PHA - glycogen production - glycogen degradation
14
IV. Operation of the bioreactors
Figure 3. Tetrasphaera bioreactor
In the laboratory there are 2 bioreactors with mixed cultures, one enriched in Accumulibacter and one in Tetrasphaera, two kind of biomass known for being PAOs (polyphosphate accumulating organisms), studied by many authors (Carvalho et al., 2007; Oehmen et al., 2007), the first ones less known compared to the latter. The 2 bioreactors are operated as Sequencing Batch Reactors (SBRs) with intermittent feeding of carbon, ammonia, nitrate, phosphorus and other micronutrients in concentrations and operating conditions that favor the growth of PAOs, alternating anaerobic, anoxic and aerobic conditions in different cycles. The bioreactors are daily controlled, measuring online temperature, air content and pH. The needed sources are periodically prepared and sampling for the analysis is done every week.
Different carbon sources are added to each bioreactor as the main source of COD (Chemical Oxygen Demand), since the two kind of biomass (Accumulibacter and Tetrasphaera) have been shown to have different preferences regarding the carbon source: acetate for Accumulibacter and casinoamina for Tetrasphaera.
The aim of the wastewater treatment is the phosphorus removal but there are other microorganisms naturally present in the wastewater that can compete with the PAOs and can consume important nutrients for them, but not eventually removing the phosphorus.
The main microorganisms studied in this field competing with PAOs are the glycogen accumulating organisms, the so-called GAOs. The presence of these microorganisms should be minimized because they consume carbon but they do not remove phosphorus. PAOs and GAOs compete for the uptake of carbon and are naturally present in the sludge.
Previous studies (Oehmen et al.) have demonstrated that a feed of carbon based on
15
75 % of acetate and 25 % of propionate is more favorable to PAOs, being the best conditions for their proliferation. The population of GAOs can be consequently reduced. Acetate and propionate are naturally present in the sludge. A prefermentation on a plant scale can be the solution in order to obtain these quantities of carbon sources.
Also 50 % of acetate and 50 % of propionate is a good condition for PAOs proliferation, but the first option is chosen for the bioreactors described before.
In order to have stable conditions in the bioreactors, all the nutrients supplied have to be consumed, so the feed of the nutrients to the bioreactors is increased gradually. Carbon source Tetrasphaera
150 ppm
Phosphorus source Tetrasphaera 30 ppm
Nitrogen source Tetrasphaera
25/02/2014 5 ppm (start of the anoxic phase) 28/02/2014 10 ppm
06/03/2014 20 ppm 13/03/2014 25 ppm 28/03/2014 30 ppm
Carbon source Accumulibacter 16/01/2014 100 ppm
29/01/2014 50 ppm 07/02/2014 100 ppm 17/02/2014 150 ppm
Phosphorus source Accumulibacter 30 ppm
Nitrogen source Accumulibacter
04/02/2014 10 ppm (start of the anoxic phase) 07/02/2014 5 ppm 17/02/2014 10 ppm 21/02/2014 20 ppm 28/02/2014 30 ppm 13/03/2014 25 ppm 28/03/2014 30 ppm 02/04/2014 25 ppm
16
The Tetrasphaera reactor was started 3 years ago with sludge from a wastewater treatment plant of Setubal (Portugal).
The Accumulibacter reactor is started in January 2014 with sludge coming from a wastewater treatment plant located in Beirolas (Portugal), near Lisbon.
Measures of carbon, nitrogen and phosphorus concentrations are taken (as described before, see paragraph V(a). Skalar analysis) in order to see if these nutrients are consumed. If they are completely consumed, then their concentrations are increased, otherwise it is decreased or kept constant depending on how much is left in the bioreactor.
The phosphorus source has been kept at 30 ppm all over the acclimatization phase. The nitrogen source for the Tetrasphaera reactor has been gradually increased up to 30 ppm, whereas more difficulties were encountered in finding the most appropriate concentration for the Accumulibacter reactor. The objective was to reach a concentration of 30 ppm like in the Tetrasphaera reactor, but the Accumulibacter reactor at this concentration was not stable, for this reason it has been decided to keep a concentration of 25 ppm. In fact, at 30 ppm the nitrate was not completely consumed, as the Skalar analysis confirmed.
The concentration of COD, nitrate and phosphate are very different from a full scale wastewater treatment plant, it is a synthetic medium fed to the bioreactor in laboratory scale. The aim is to see how the population of microorganisms behaves when present in high abundance, in order to better interpret the metabolism of these organisms without interference from the wide diversity of organisms normally present in wastewater treatment plants.
Carbon, phosphorus and nitrate are fed to the bioreactor enriched in Accumulibacter in these quantities: 250 ml/cycle, 750 ml/cycle and 50 ml/cycle respectively, 4 cycles/day are implemented, each 6 h long.
The initial COD fed is 50 ppm, during the acclimatization this will be increased up to 150 ppm.
The biomass present in the two bioreactors is approximately 1 l, the total volume of the bioreactors is therefore 2 l.
Regarding the bioreactor enriched in Tetrasphaera, 3 cycles/day are implemented, each 8 h long.
It is fed with 400 ml/cycle of carbon, 600 ml/cycle of phosphorus and 50 ml/cycle of nitrate.
In the next tables are shown the quantities of nutrients present in the different sources.
17 Carbon source (10 l) CasNa 7.9130 g NH4Cl 3.6980 g MgSO4.7H2O 5.9380 g CaCl2.2H2O 2.7600 g ATU 0.0730 g EDTA 0.1980 g Micronutrients 19.8 ml
Table 1. Carbon source composition for Tetrasphaera
Phosphorus source (20 l) K2HPO4 6.3160 g
KH2PO4 3.8528 g
Table 2. Phosphorus source composition for Tetrasphaera
Nitrate source (2 l)
40 ppm NaNO3 19.4181 g
30 ppm NaNO3 14.5640 g
Table 3. Nitrate source composition for Tetrasphaera
Carbon source (10 l) C2H3O2Na.3H2O 19.1303g C3H6O2 2.0 ml NH4Cl 5.9167 g MgSO4.7H2O 9.5000 g CaCl2.2H2O 4.4167 g ATU 0.1167 g EDTA 0.3167 g Micronutrients 31.7 ml
Table 4. Carbon source composition for Accumulibacter
Phosphorus source (25 l) K2HPO4 6.3160 g
KH2PO4 3.8528 g
18 Nitrate source (2 l)
40 ppm NaNO3 19.4181 g
25 ppm NaNO3 12.1360 g
Table 6. Nitrate source composition for Accumulibacter
Micronutrients (1 l) FeCl3.6H20 1.50 g H3BO3 0.15 g CuSO4.5H2O 0.03 g KI 0.18 g MnCl2.4H2O 0.12 g Na2MoO.2H2O 0.06 g ZnSO4.7H2O 0.12 g CoCl2.6H2O 0.15 g
Table 7. Micronutrients composition
All the sources are sterilized in the autoclave at 121 °C and 1 bar for about 3 hours. The sterilization time itself lasts for 20 minutes, then the temperature inside the autoclave has to decrease until 90 °C before being opened for safety reasons.
Each cycle is composed of 3 phases: anaerobic, anoxic and aerobic (at the beginning of the acclimatization in the Tet. bioreactor the anoxic phase was not implemented). After the aerobic phase there is the settling of the biomass, in which the stirring device is switched off, the supernatant disposal in order not to overflow the bioreactor with continuous feeding and finally the so-called idle in which argon is supplied and the bioreactor is stirred in order to assure the next anaerobic phase. Here are shown the phases duration for both the bioreactors.
Acc.
Sample Anaerobic Sample Anoxic Sample Aerobic 0 0' (8:45-09:00) 5 After feed 9 4h30 (13:30) 1 5' (09:05) 6 2h09 (11:09) 10 5h15 (14:15) 2 30' (09:30) 7 2h45 (11:45)
3 1h (10:00) 8 3h45 (12:45)
4 1h45 (10:45)
Table 8. Accumulibacter phases duration
TET
Sample Anaerobic Sample Anoxic Sample Aerobic 0 0' (08:45 -08:57) 5 After feed 9 6h (15:00) 1 0' (09:00) 6 3h24(12:24) 10 7h (16:00)
2 1h (10:00) 7 4h (13:00)
3 2h (11:00) 8 5h (14:00)
4 3h (12:00)
19
The anaerobic phase is characterized by the feeding of carbon and phosphorus, with argon sparged to guarantee the absence of oxygen. In the anoxic phase only sodium nitrate is fed with argon for the same reason.
In the aerobic phase also air is supplied. The difference between the Tet. bioreactor and the Acc. one is that in the first one the carbon is fed continuously for 2 hours, whereas in the second one the carbon is fed in 5 minutes at the beginning of the anaerobic phase.
The pH is controlled in both the reactors with HCl (0.1 M), injecting it automatically when the pH overcomes the set value: in the Tet. it is controlled at 7.1, in the Acc. at 7.5.
A low pH favours the growth of GAOs, a too high pH causes the precipitation of phosphorus, a pH equal to 7.5 is ideal for PAOs proliferation (Oehmen, et al., 2007). The temperature is set at 20 °C controlled through a water bath for both the bioreactors and the air content is measured through a sensor. Usually it is 0 % in the anaerobic phase and around 72 % in the aerobic phase. Continuous graphs in real time are shown in the computer connected to the bioreactors, from which all parameters can be controlled and the different phases can be implemented automatically.
Regarding the Tetrasphaera reactor, in order to assure a SRT (Sludge Retention Time) of 19 days it is purged 105.26 ml from the bioreactor every day, whereas for the Accumulibacter reactor this volume is equal to 200 ml/day. The following formula is used to calculate the purge:
=
20
V. Analysis
Figure 5. Sampling preparation
Sampling from the bioreactors allows measuring the quantity of the main compounds involved in the metabolism of PAOs and GAOs. A sample is composed of a liquid phase, called supernatant, and a solid phase represented by the biomass that can be easily separated through a centrifugation.
Concerning the supernatant, samples from Acc. are analyzed in the HPLC (High Performance Liquid Chromatography) to measure the VFA, others from Tet. are analyzed in the TOC (Total Organic Carbon) to measure the carbon source.Tet. and Acc. are analyzed in a spectrophotometer (Skalar) to measure nitrite, nitrate, phosphorus and ammonia.
As the sampling procedure is concerned, 10 series of Eppendorfs are prepared 16 for each series for Tet. and 12 each for Acc. See tables 8 and 9, for more details. In each series of Eppendorfs, for Tet, 8 will be for supernatant, 2 of them to analyze the phosphorus and the nitrate in the Skalar and other 8 just for the biomass. For Acc. 6 Eppendorfs are for supernatant, 2 of them to analyze the phosphorus and the nitrate in the Skalar and other 6 just for the biomass. The samples with supernatant and those ones with biomass are stored into the freezer at -20°C. The samples for phosphorus and nitrate (supernatant) are stored into the fridge at +4°C.
At the end of each phase (anaerobic, anoxic and aerobic) one sample is taken for FISH analysis, when necessary. This sample is stored into the fridge at 4°C.
At the end of the cycle (when the aerobic phase finishes) are taken one sample (5 ml tube) as Bruta, 2 for total phosphorus analysis (2 ml Eppendorf each) and another one (5 ml tube) for TSS/VSS. The samples of Bruta and TSS/VSS are stored into the fridge at +4°C, whereas the total phosphorus samples are stored into the freezer at -20°C.
In addition, are taken samples from the carbon source, phosphorus and nitrate Schotts before the cycle starts or at the end. These samples are stored into the fridge at +4°C. The sample at the end of the cycleis taken with particular attention because the settling phase starts some seconds later and the medium will be different. For this reason the sample is taken 1 or 2 minutes before the cycle finishes.
21
So, the samples from the bioreactor are taken at the times shown in the table 8 and 9 starting a timer just after the phosphorus feeding for Tetrasphaera finishes (08h57) at the beginning of the anaerobic phase. The phosphorus feeding for Tet lasts 3 minutes. Sampling after feeding means after the feeding of nitrate at the beginning of the anoxic phase. The nitrate feeding lasts 4 minutes and 26 seconds for both Tet and Acc.
The samplesare taken from the bioreactor by means of a siring directly connected to the bioreactor. Then, a centrifugation for 5 minutes at 10000 rpm is made for all the samples in order to separate the biomass (at the bottom) from the supernatant. After, the liquid supernatantcan be taken from the Eppendorf through a micropipette, paying attention not to take any biomass, and put this supernatant into the empty Eppendorfs prepared before. The supernatantwill be used to analyze the content of phosphorus and nitrate in the Skalar. The Eppendorfs obtained will be stored in the fridge or freezer as explained before.
V(a). Skalar analysis
Figure 6. Skalar analyzer
A spectrophotometer is used to measure nitrite, nitrate, phosphorus and ammonia in the supernatant. The instrument used is called Skalar and it is composed by an autosampler, a segmented flow analyzer and a computer from which the results can be seen.
The segmented flow analysis is a continuous flow method of wet chemistry analysis in which a stream of reagents and samples, segmented with air bubbles, is pumped through a manifold and treated in different processes such as mixing, heating or dialysis, before entering a flow cell to be detected. Air segmentation is used to prevent contamination.
22
Basically, the spectrophotometer measures the optical density of the sample, then it sends a signal to the interface depending on the optical density measured.
During the analysissome reagents are fed into the spectrophotometer.Reacting with the compounds mentioned above, they give products that are colored. For this reason it is called colorimetric method. If the resultant colour is white, there will be a small concentration of that compound and its peak in the resultant graph will be small, whereas if the colour is intense the concentration will be high and so the peak. The result is a graph with different peaks, in which a specific height corresponds to a specific concentration of the compound. The graph appears on the screen of the computer in real time. On the x-axis there is time, on the y-axis the response of the instrument.
The instrument works between 2 and 20 ppm, so the samples are diluted with MilliQ water reaching these quantities. The dilution is taken into account in the final results: setting the rate of dilution, the computer calculates the final concentration of the compound.
First of all, a stabilization of the instrument has to be reached with a constant baseline. Then, a calibration curve is obtained feeding standards from 4 to 20 ppm. Automatically the instrument assigns a specific concentration to different heights. The first sample is the “tracer” with 20 ppm, then there is a “wash” with only water. After, the different standards are put into the autosampler and again a standard of 20 ppm and a wash. The samples are then analyzed, each sample analysis lasting 3 minutes. After a sequence of samples there are always a drift (to correct the calibration curve) and a wash (to reset the instrument with null concentration).
In our case, the dilution of the sample for Tetrasphaera in which phosphate is measured is 4 times, whereas for Accumulibacter is 5 times. Measuring nitrite and nitrate, the samples are diluted less because they are present concentrations between 2 and 20 ppm, according to the instrument’s tolerability. On the contrary, the carbon is diluted very much because it is very concentrated, the rate of dilution being equal to 20 times. Also the phosphate source is measured, but it is just to control how much phosphorus is present in the medium, this datum is not considered in the successive data analysis.
At the end of the analysis the instrument has to be washed with water, then the baseline has to be stabilized.
A precise protocol is followed to use the Segmented Flow Analyzer.
1) reagents and standards are prepared and the reagent tubing is put into the reagent containers (appropriately labeled). The rinsing liquid supply tubingis placed on the sampler in distilled water
2) waste facilities are checked to be available 3) the pump is greased and then closed
4) the air bars are lifted by their rings and closed. Then the rings are released to place the bars square over the air tubing
23 6) The sampler is switched on and initialized
7) Interface, water bath, reactor control unit(s) and photometers are switched on. 8 ) The system is stabilized for 30 minutes
9) The software Flow Access is started. The pre-set temperature on the water bath and reactor control unit(s) is checked to be ok (40°C). The run is prepared with standards and samples appropriately diluted
10) The sampler is filled with the standards and the samples. The baseline is checked to be stable in real time and the run is started
11) When the run is finished the results are checked.
The autosampler provides the injection of the standards and the samples automatically.
In the chemistry unit the reagents are mixed with samples. The reaction mixtures are the detected. After detection the reaction mixture is sent to a waste facility. The measured signals are collected on a computer, where the data are processed.
The interface is needed for the automatic data acquisition and control of Continuous Flow analyzers. It is connected to the digital photometer, detectors, the sampler and the computer. The signals coming from the sampler and detectors are transferred to the computer.
The Skalar is used to determine the concentration of ammonia, nitrate, nitrite and phosphorus in the supernatant that should be free of biomass as much as possible. The determination of ammonia is based on the modified Berthelot reaction. The ammonia is converted to monochloramine which reacts with salicylate to 5-aminosalicylate. After oxidation a green complex is formed. The absorption of this complex is measured at 660 nm.
The determination of nitrate and nitrite is based on the cadmium reaction method; after dialysis the sample is buffered at pH 8.2 and is passed through a column containing granulated copper-cadmium to reduce nitrate to nitrite. The nitrite is determined by reacting with sulfanilamide and N-(1-naphthyl) ethylenediaminedihydrochloride to form a highly coloured azo dye measured at 540 nm.
The determination of phosphate is based on the reaction between ammonium heptamolybdate and potassium antimony (III) oxide tartrate in an acidic medium with diluted solutions of phosphate to form an antimony-phosphomolybdate complex. This complex is then reduced to ascorbic acid intensively coloured in blue. This complex is measured at 880 nm.
Standards for ammonia
20 ppm N: dilute 2.0 ml stock solution 1000 ppm N to 100 ml with rinsing liquid sampler.
16 ppm N: dilute 1.6 ml stock solution 1000 ppm N to 100 ml with rinsing liquid sampler.
24
12 ppm N: dilute 1.2 ml stock solution 1000 ppm N to 100 ml with rinsing liquid sampler.
8 ppm N: dilute 0.8 ml stock solution 1000 ppm N to 100 ml with rinsing liquid sampler.
4 ppm N: dilute 0.4 ml stock solution 1000 ppm N to 100 ml with rinsing liquid sampler.
Standards for nitrate and nitrite
20 mg N/ liter: dilute 2.0 ml stock solution 1000 mg N/liter to 100 ml with rinsing liquid sampler.
16 mg N/liter: dilute 1.6 ml stock solution 1000 mg N/liter to 100 ml with rinsing liquid sampler.
12 mg N/liter: dilute 1.2 ml stock solution 1000 mg N/liter to 100 ml with rinsing liquid sampler.
8 mg N/liter: dilute 0.8 ml stock solution 1000 mg N/liter to 100 ml with rinsing liquid sampler.
4 mg N/liter: dilute 0.4 ml stock solution 1000 mg N/liter to 100 ml with rinsing liquid sampler.
Standards for phosphate
20 mg P/ liter: dilute 2.0 ml stock solution 1000 mg P/liter to 100 ml with rinsing liquid sampler.
16 mg P/liter: dilute 1.6 ml stock solution 1000 mg P/liter to 100 ml with rinsing liquid sampler.
12 mg P/liter: dilute 1.2 ml stock solution 1000 mg P/liter to 100 ml with rinsing liquid sampler.
8 mg P/liter: dilute 0.8 ml stock solution 1000 mg P/liter to 100 ml with rinsing liquid sampler.
4 mg P/liter: dilute 0.4 ml stock solution 1000 mg P/liter to 100 ml with rinsing liquid sampler.
25
V (b). TSS and VSS
Figure 7. Tetrasphaera filter after 550°C
The Total Suspended Solids and the Volatile Suspended Solids are measured according to this procedure, based on the standard method APHA (American Public Health Association).
1) glass fibers pretreatment in the oven before at 550 °C for 30 minutes and then at 100 °C for any time
2) weight the filters without biomass 3) filter the sample with the biomass
4) heat the filter with the biomass at 100 °C and weight 5) heat the filter with biomass at 550 °C and weight
The first heating at 100 °C of the filter is needed to vaporize the water and measure the TSS, whereas the second one at 550 °C is needed to volatilize any compound with low molecular weight and measure the VSS.
26
V(c). TOC analysis
Figure 9. TOC analyzer
The Total Organic Carbon is measured for Tetrasphaera. HPLC cannot be implemented because there are not columns for aminoacids, whereas there are for acetate and propionate for which liquid chromatography can be used. The instrument measures the total and the inorganic carbon, the organic carbon is then automatically calculated as the difference between the two. The program used is TOC V sample. Preparation of the instrument:
- turn on the PC - open the air valve - turn on the instrument
- connect the instrument with the PC
Before starting the analysis, it has to be checked: - pressure at 200 kPa
- level of water between low and high - enough reagents (H20, HCl and H3PO4)
- change milli-Q water, the salts interfere in the results of inorganic carbon. Preparation of the samples:
- centrifuge the samples for 3 minutes at 10000 rpm - dilute 2 ml of sample with 8 ml of milli-Q water
27
When the TOC is ready, a green light will appear on the screen of the computer. Then, the instrument is washed with milli-Q water for 20 minutes. After the analysis there is a final wash of the instrument for 30-40 minutes, then the shut down (30 minutes).
The problem of this analysis is that there is not an autosampler, so each sample has to be placed into the instrument manually one by one. Each sample analysis lasts for around 10 minutes.
V(d). HPLC
Figure 10. HPLC column
The HPLC (High Performance Liquid Chromatography) is used to measure the consumption of carbon (that works as COD) in the Accumulibacter reactor.
The protocol followed is the following one: 1) Unfreeze the samples
2) Centrifuge the samples at 10000 rpm for 5 minutes
3) take 700 μl of supernatant and put in the filter (it is a green filter inside the eppendorf)
4) centrifuge the sample at 10000 rpm for 5 minutes 5) wash the filter
6) take out 700 μlof liquid from the eppendorf and put inside a vial with one drop of H2SO4 0.05 N
7) close the vial (the blue part on the side of the liquid) 8) store the sample in the freezer before the analysis
For the analysis, 9 different standards are prepared of 1000, 500, 250, 125, 62, 31, 15, 7 and 0 ppm with propionic acid and sodium acetate trihydrate in a solution of
28
sulfuric acid 0.01 N. The standard of 1000 ppm is prepared with 0.05 g of propionic acid and 0.1133 g of sodium acetate trihydrate in 50 ml H2SO4 0.01N. The other
standards are prepared with successive dilutions.
The standards are needed to calculate a calibration curve that put in relation the area of the pick in the HPLC analysis and the concentration of the compound of interest. In the following graphs are shown typical calibration curve for propionic acid and sodium acetate trihydrate.
The compounds of interest are propionic acid and acetic acid fed to the bioreactor as carbon source. The real concentration of the 2 compounds are calculated with their real weight.Actually in the standards it is used sodium acetic acid trihydrate, so the concentration is corrected to the acetic acid with the following formula:
[HAc] =
HAc = acetic acid
NaAc = sodium acetic acid MW = molecular weight
Vsolution (H2SO4 0.01N) = 50 ml
Figure11. Calibration curve for propionic acid
y = 0.0016x R² = 0.9991 0.00 200.00 400.00 600.00 800.00 1000.00 1200.00 0 100000 200000 300000 400000 500000 600000 700000 800000 con cen tra tion (pp m) pick area
HPr
29
Figure12. Calibration curve for acetic acid
V(e). FISH
Figure 13. FISH microscope
The Fluorescence In Situ Hybridization is used to identify qualitatively the population of the microorganisms in the medium. The hybridization consists in stimulating the different bacteria with the light and some probes added to the sample allow to see the different colours. There are 4 probes for 4 different RNA of Tetrasphaera (TET1-226, TET2-174, TET2-892 and TET3-654), 1 probe for GAO (GAO mix), 1 for PAO (PAO mix), 1 for Deflivococcus and 1 for TFO (Tetrad Forming Organisms). The last 2 are a kind of glycogen accumulating organism. In addition, EUB mix is a probe needed to identify all bacteria, being a contrast color with the specific one of the particular bacteria.
In the results, the red colour represents the specific bacteria, whereas the green represents all bacteria. Overlapping the image in red and the other in green it will be obtained an image with yellow and green colours: the yellow representing the specific bacteria and the green again the whole population. This operation is done by
y = 0.0015x R² = 0.9992 0.00 200.00 400.00 600.00 800.00 1000.00 1200.00 0 100000 200000 300000 400000 500000 600000 700000 con cen tra tion (pp m) pick area
HAc
30
the software, snapshots of different images from the microscope can be taken, being a computer connected to the microscope.
The protocol describes different phases: - sample fixation
- probes preparation
- samples application and dehydration - probes hybridization
- washing
- mounting slides Sample fixation
This phase slightly differs in the case of Gram + (Tetrasphaera) and Gram – (Accumulibacter).
Gram positive:
- add 1 ml of ethanol (98%) at -20 °C to 1 ml of sample. - store at 4°C for 4-16 hours.
- centrifuge the sample at 10000 rpm for 3 minutes - wash with 1 ml of PBS.
- centrifuge the sample at 10000 rpm for 3 minutes - mix with 0.5 ml of PBS and 0.5 ml of ethanol - store at -20 °C
Gram negative:
- add 1.5 ml of PFA (4%) to 0.5 ml of sample. - store at 4°C for 1-3 hours.
- centrifuge the sample at 10000 rpm for 3 minutes - wash with 1 ml of PBS.
- centrifuge the sample at 10000 rpm for 3 minutes - wash with 1 ml of PBS
- centrifuge the sample at 10000 rpm for 3 minutes - mix with 0.5 ml of PBS and 0.5 ml of ethanol - store at -20 °C
Probes preparation
-Hydrate the lyophilized biomass with Milli-Q water - froze and protect from light probes of 5 μl
31 Samples application and dehydration
- identify slides
- apply samples in each well (3 to 30 μl in each) - air dry (preferentially) or at the oven at 46°C
- dehydrated in an ethanol series (3 min in each): 50%, 80% and 98% ethanol (Use 50 ml Falcon tubes; max 2 slides per tube during dehydration)
- air dry or under compress air Probes Hybridization
- with a tissue paper make a “bed” inside the 50 ml Falcon tube
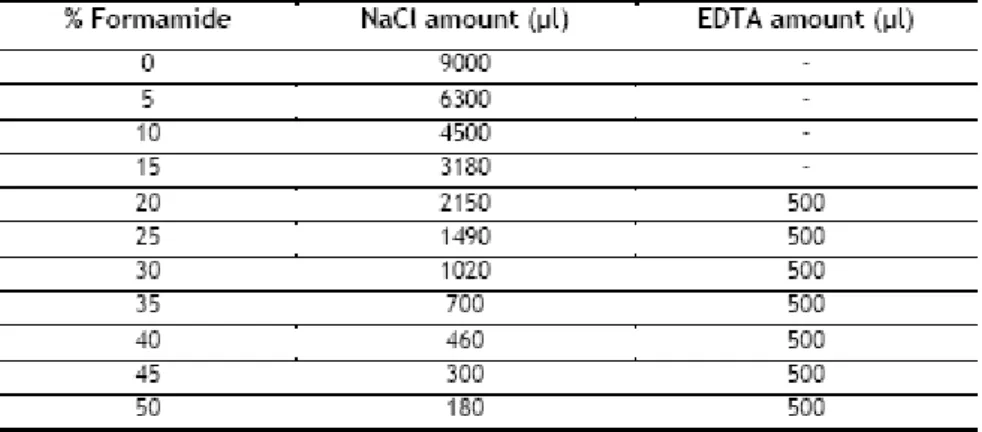
- hybridization buffer is prepared in a 2 ml eppendorf tube (final concentrations - 0.9M NaCl, 0.01% SDS, 20 mmol Tris/HCl, pH 7.2)
1) 360 μL NaCl 5M 2) 40 μL TRIS-HCl 1M
3) Formamide (see table 10 for amount) 4) Milli-Q Water (see table 10 for amount)
5) 2 μL SDS 10% (the last to mix because it can interact with NaCl and precipitate)
- apply 8μl in each well. Do not touch the slide with the tip
- apply the rest of the buffer into the hybridization tube to keep the chamber in tube moist
- apply to each well 1 μl of probe (without touching the slide; gently mix the probes in the buffer)
- place the slide into the 50 ml Falcon tube in the horizontal position - place the Falcon tube in the oven at 46°C for 1-2hours
Below is presented the table related to the preparation of the hybridization buffer.
32 Washing
- prepare wash buffer (total volume of 50 ml) in 50 ml Falcon tubes 1) NaCl 5M (see table 11 for amount)
2) 1ml of TRIS-HCl 1M
3) EDTA 0.5M (see table 11 for amount)
4) Raise the volume with Milli-Q H2O up to 50 ml
5) 50 μl SDS 10% (the last to mix)
- place wash buffer in the bath to reach 48ºC before washing the slides
- wash slides: wash each slide with a Pasteur pipette and let the excess goes to a beaker. Place the slide into the washing buffer tube and into the bath at 48ºC for 10-15 minutes.
- take the slides out and wash wells and slide (front and back) with Milli-Q water at 4ºC
- dry the slide quickly to remove every single droplet from the slide to prevent probe dissociation (use compressed air)
Below is presented the table related to the preparation of the washing buffer.
Table 11. Washing buffer preparation
Mounting slides
- apply a thin film of Vectashield to the dried slides
- place the cover slip and gently press it to force Vectashield to cover all wells - clean the excess with a tissue paper
- apply nail polish to the board of the cover slip to prevent it to move away from the slide and prevent immersion oil to enter in the wells
33
V (f). Batch tests
Figure 14. Batch system
Samples are taken from the parent reactor (Acc. or Tet.) at the end of the anaerobic phase and the batch reactor is fed with this medium. In the batch reactor only the anoxic phase is implemented, injecting N2O or others nitrate electron acceptors
according to the table 9. A sensor measures online the N2O production along the
time. The sensor transmits a signal (mVolt) to the computer that is converted in concentration (μmol/l). The sensor is very sensitive to temperature, so this is kept constant all along the analysis. Also the pH is measured online, like the temperature. The temperature is set at 20 °C and the pH at 7.1 for Tet. and 7.5 for Acc.
Before the analysis a calibration curve is obtained connecting signals and concentrations at different values. The computer shows in real time both the signal and the concentration.
Air is prevented from entering the reactor keeping it full of water, adding it inside the reactor through a syringe connected on the top of the reactor.Samples are taken through the same syringe.
Just the anoxic phase is analyzed because the de-nitrification process occurs just in this phase.
Different tests are performed injecting different nitrogen-derivate sources (nitrate, nitrite, N2O) according to the table shown below.Also a phosphorus source is fed, but
not carbon. In this way, the biomass is forced to use the internal carbon stored during the anaerobic phase.
The duration of the test is 1 hour and the samples are taken at time 0, 5, 10, 20, 30 and 60 seconds.
34 This is the protocol followed for each test:
1. Take out the solutions from the fridge 2. Calibrate the microsensor
3. Calibrate the pHmeter
4. Take the sludge at the end of the anaerobic phase from the parent reactor
5. Prepare 2 l of solution for washing sludge (100 ml macronutrients/1900ml water)
6. Wash the sludge 2 times, reaching a final volume of 450 ml. 7. Sparge the sludge with argon till the dissolve oxygen is zero. 8. Prepare the phosphorus solution, macro and micro nutrients 9. Insert the T meter with Teflon in the reactor
10. Insert the pH meter with Teflon
11. Dilute the biomass and place it inside the sealable reactor 12. Insert the N2O microsensor with Teflon
13. start the stirrer (always at the same speed for all the experiments) 14. Check there are no leakages
15. Adjust the pH: a. at 7.4 for dPAOs
b. at 7.0 for dTetrasphaera
16. Take a sample at time=0 before starting the experiment and samples from the medias
17. Add the electron acceptors needed
18. Take samples: 5, 10, 20, 30 and 60 minutes (close and open valves)
19. At minute 10 take 6 ml sample for m-RNA, freeze it with liquid nitrogen and store at -80°C
20. Centrifuge the samples at 10000 rpm for 5 minutes before separating the supernatant from the biomass
21. Filter the samples for Skalar, take the supernatant with a syringe with a needle and then take out the syringe and filter
22. Control pH by adding 0.1 M HCl or 0.5M NaOH
23. At the end of the experiment take 12 ml sample for solids and 5 ml for DNA and freeze at -20°C
24. Wash everything
25. Calibrate the microsensor
26. Put back the sludge into reactors:
a. 250 ml of dPAOs in total 450 mlafter washing b. 345 ml of dTET in total 450 mlafter washing
35
36
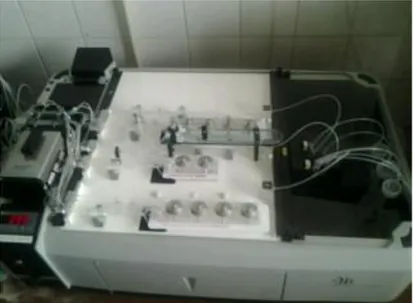
VI. MATERIAL AND INSTRUMENTS
An autoclave Uniclave77 AJC is used to sterilize the carbon medium. After the preparation of the source in a Schott, this is firmly closed, the plastic parts are covered with aluminium foil and then is placed carefully inside the autoclave, where a resistence is covered with water. Then the autoclave is firmly closed and switched on.
The temperature increases up to 121 °C and the pressure until 2 bar, at 121 °C there is the sterilization for 20 minutes, then the temperature decreases again. When the temperature reaches 90 °C and the pressure 1 bar, the autoclave can be opened, paying attention to the heat coming out.
Figure 15. Autoclave
A centrifuge VWR Microstar 17 is used to separate the supernatant from the biomass during the sampling and in the preparation of the samples for HPLC analysis. This is run at 10000 rpm for 5 minutes.
37
A dryer is used for VSS evaluation, after the filter is taken out from the oven at 550 °C. This is needed to take out the humidity from the filter. Below it is shown the type of filters used in this analysis, a Reeve Angel filter paper.
Figure 18. Filter paper Figure 17. Dryer for VSS evaluation
A filtration system KNF Neubergeris used to filter the sample in the TSS-VSS evaluation.
Figure 19. Filtration system
An oven Nabertherm is used to put the filtered sample at 550 °C. Below it is shown also the oven at 100 °C (Memmert) .
38
Figure 20. 550°C oven
Figure 21. 100°C oven
For Tetrasphaera reactor a pump Watson-Marlow sci 400 is used to pump the carbon source into the reactor. The flow is equal to 3.33 ml/min. This pump is calibrated each time the medium is changed.
39
A pump Watson-Marlow 502s is used to feed the nitrate source to the Tetrasphaera reactor, the carbon and the nitrate sources to the Acc. reactor. The flows in order are 0.18 ml/s for both the nitrate sources and 0.83 ml/s for the carbon source in the Acc. reactor. All of them are pulses.
Figure 23. Pump for nitrate feed
for Tetrasphaera, carbon and nitrate for Acc.
A pump SP311 VelpScientifica is used to feed the phosphorus medium to the Tetrasphaera reactor. The flow is 200 ml/min.
Figure24. Pump for phosphorus feed to Tetrasphaera reactor
A pump Watson Marlow sci 323 is used to feed the phosphorus source to the PAO reactor. The pulse in this case is 2.5 ml/s.
40
Figure 25. Pump for the phosphorus feeding to Acc. reactor
A pH meter Orion Dual Star pH ISE Benchtop is used to measure the pH of the solutions, in specific of the carbon sources and of the standards prepared for Skalar and HPLC analysis.
41
VII. RESULTS and discussion
The period analyzed is from February to July 2014. The batch tests started in June (reported until July).
VII (a). Skalar
The Skalar tests are performed once a week, generally the day after the sampling. The more the reactors are acclimatized, the less samples are taken. In fact, in the last months (June-July) just 4 samples were taken and the sampling is less frequent. From February to June 10 samples are taken from both Accumulibacter and Tetrasphaera reactors according to the timetable shown in tables 8 and 9. See paragraph V. Analysis for more details about the sampling procedure.
The reactors work in continuous with the cycles described in paragraph IV. Operation of the bioreactors.
Regarding the phosphorus, it is observed the typical trend of release and uptake respectively in anaerobic and anoxic/aerobic conditions.
In the anaerobic phase the phosphorus is released because of the hydrolysis of polyphosphate and the consumption of ATP in order to uptake the VFAs (Volatile Fatty Acids).
In the anoxic and aerobic phase, it can be observed the uptake of phosphorus in higher quantities than those ones released in the anaerobic phase. In addition, sludge enriched in polyphosphate is discharged: the overall balance is a successful uptake of phosphorus by the microorganisms and its decrease in the supernatant, so the EBPR works well. See table 13 and 14 for more details.
Figure 27. Analysis of phosphorus in the whole cycle (Feb-May 2014)
0.00 1.00 2.00 3.00 4.00 5.00 0.00 1.00 2.00 3.00 4.00 5.00 6.00 (P -mmo l/l) time (h)
Phosphorus Acc.
04-feb13-feb 25-feb 05-mar 11-mar 18-mar 26-mar 02-apr 09-apr 15-apr 06-mag 13-mag
42
Figure 28. Analysis of phosphorus in the whole cycle (May-June 2014)
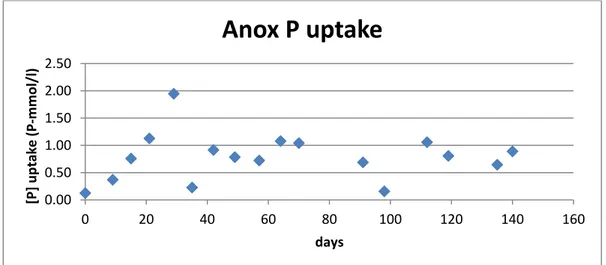
In the following graphs are shown the trends of anoxic and aerobic phosphorus uptake for Accumulibacter.
The uptake is up to 42 % and 58 % respectively. The anoxic one is in the range between 0.13 and 1.95 mmol/l, whereas the aerobic between 0.14 and 2.26 P-mmol/l for Acc. On average the anoxic is 0.79 whereas the aerobic 1.35 P-P-mmol/l.
Figure 29. Anoxic phosphorus uptake for Accumulibacter
Figure 30. Aerobic phosphorus uptake for Accumulibacter
0.00 1.00 2.00 3.00 4.00 0.00 1.00 2.00 3.00 4.00 5.00 6.00 (P -mmo l/l) time (h)
P Accumulibacter
03-giu 27-mag 19-giu 24-giu 0.00 0.50 1.00 1.50 2.00 2.50 0 20 40 60 80 100 120 140 160 [P] up tak e (P -mmo l/l) daysAnox P uptake
0.00 0.50 1.00 1.50 2.00 2.50 0 20 40 60 80 100 120 140 160 [P] up tak e (P -mmo l/l) daysAerobic P uptake
43
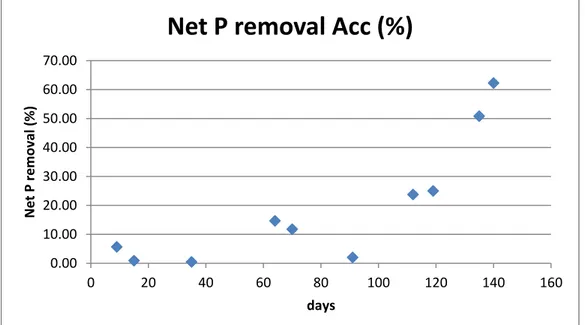
It is also calculated the net phosphorus removal, being simply the difference between the uptake and the release. The percentage is calculated again with respect to the end of the anaerobic phase. Below it is shown a graph with the percentage of net phosphorus removal all along the analyzed period. It can be observed that there is an increasing trend.
Figure 31. Net phosphorus removal for the Acc. bioreactor in the whole analyzed period
In the following graphs are shown the concentration of phosphorus in the whole cycle from February to June 2014 and the trends of anoxic and aerobic phosphorus uptake for Tetrasphaera.
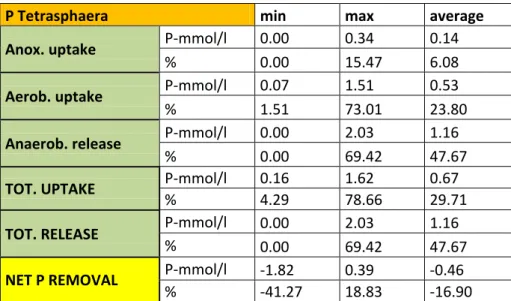
The uptake is up to 15 % and 73 % respectively. The anoxic one is up to 0.34 P-mmol/l, whereas the aerobic uptake reaches values of 1.51 P-mmol/l. On average the anoxic is 0.14 whereas the aerobic 0.53 P-mmol/l.
0.00 10.00 20.00 30.00 40.00 50.00 60.00 70.00 0 20 40 60 80 100 120 140 160 Net P removal (%) days
44
Figure 32. Analysis of phosphorus in the whole cycle (13-19th Feb 2014)
Figure 33. Analysis of phosphorus in the whole cycle (Feb - May 2014)
Figure 34. Analysis of phosphorus in the whole cycle (May-June 2014)
0.00 0.50 1.00 1.50 2.00 2.50 0.00 2.00 4.00 6.00 8.00 (P -mmo l/l) time (h)
Phosphorus Tet
13-feb 19-feb 0.00 1.00 2.00 3.00 4.00 5.00 6.00 0.00 2.00 4.00 6.00 8.00 (P -mmo l/l) time (h)Phosphorus TET
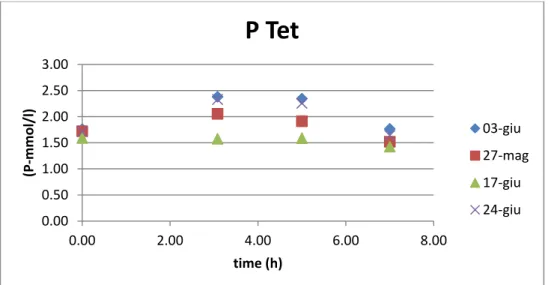
25-feb 05-mar 11-mar 18-mar 25-mar 02-apr 09-apr 15-apr 06-mag 13-mag 0.00 0.50 1.00 1.50 2.00 2.50 3.00 0.00 2.00 4.00 6.00 8.00 (P -mmo l/l) time (h)P Tet
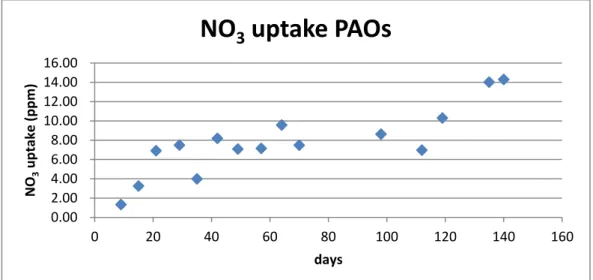
03-giu 27-mag 17-giu 24-giu45
Here are shown the uptake relatively to Tetrasphaera reactor starting from March 2014, because before it was not implemented an anoxic phase in the Tetrasphaera reactor.
In general, there is a decreasing trend of phosphorus uptake in both reactors.
Figure 35. Anoxic phosphorus uptake for Tetrasphaera
Figure 36. Aerobic phosphorus uptake for Tetrasphaera
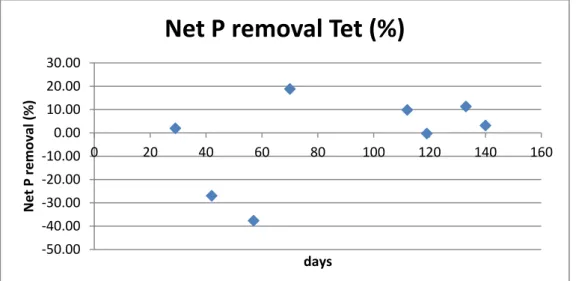
In the graph below it is shown the net phosphorus removal regarding the Tet. reactor. It can be observed that there are negative values of removal, it means that occasionally there have been also net phosphorus release with increase phosphorus concentration inside the bioreactor at the end of the cycle. Also the removal is quite low. 0.00 0.05 0.10 0.15 0.20 0.25 0.30 0.35 0.40 0 20 40 60 80 100 120 140 160 P up tak e (P -mmo l/l) days
Anox P uptake
0.00 0.20 0.40 0.60 0.80 1.00 1.20 1.40 1.60 0 20 40 60 80 100 120 140 160 P up tak e (P -mmo l/l) daysAerobic P uptake
46
Figure 37. Net phosphorus removal for the Tet. bioreactor in the whole analyzed period
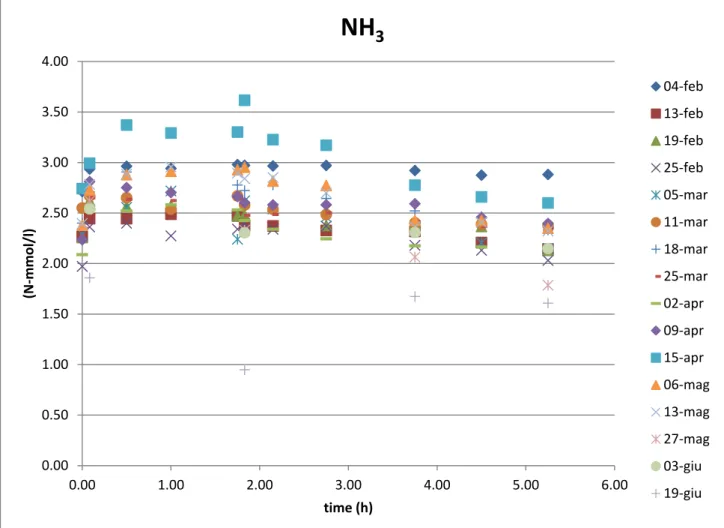
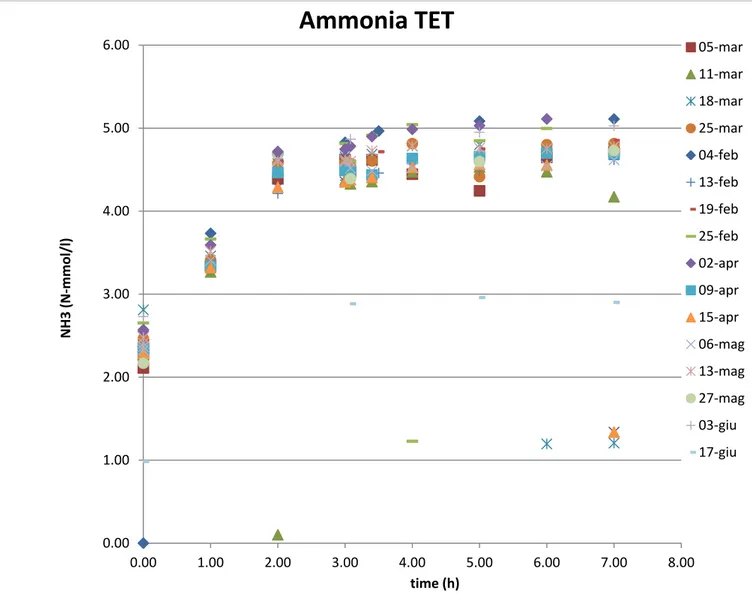
In the ammonia analysis the trends are slightly different for Tetrasphaera and Accumulibacter reactor.
In the Tet. reactor, in the anaerobic phase it can be observed an increase of ammonia in the first 2 hours: this is because of the ammonia feeding with the carbon source that lasts exactly 2 hours. In the anoxic/aerobic phase the ammonia slightly decreases because it is used for biomass growth.
In the Acc. reactor, there is the same increase as Tet. but this lasts for just some minutes (the carbon source feeding time lasts 5 minutes).
Then again a decrease due to the uptake of ammonia used for biomass growth.
It can be affirmed thatammonia is not removed for nitrification, since this process is inhibited by the addition of ATU in the media.
-50.00 -40.00 -30.00 -20.00 -10.00 0.00 10.00 20.00 30.00 0 20 40 60 80 100 120 140 160 Net P removal (%) days
47
Figure 38. Analysis of phosphorus in the whole cycle of Accumulibacter (Feb - June 2014)
The anoxic uptake of ammonia is on average 0.24 N-mmol/l with a percentage related to the end of the anaerobic phase of 8.52 %. In the first months of the analysis there was an increasing trend of the ammonia uptake up to 0.53 N-mmol/l and 18 %. In the last days there has been a high decrease of uptake due to some problems with the reactor. See table 17 for more details.
Figure 39. Anoxic ammonia uptake for Accumulibacter
0.00 0.50 1.00 1.50 2.00 2.50 3.00 3.50 4.00 0.00 1.00 2.00 3.00 4.00 5.00 6.00 (N -mmo l/l) time (h)