Environments 2019, 6, 35; doi:10.3390/environments6030035 www.mdpi.com/journal/environments Article
Occupational Fine/Ultrafine Particles and Noise
Exposure in Aircraft Personnel Operating in Airport
Taxiway
Gabriele Marcias 1,2,*,Maria Francesca Casula 3, Michele Uras 1, Andrea Falqui 4, Edoardo Miozzi 5,
Elisa Sogne 4, Sergio Pili 1, Ilaria Pilia 1, Daniele Fabbri 1, Federico Meloni 1, Marco Pau 1,
Andrea Maurizio Sanna 1, Jacopo Fostinelli 6, Giorgio Massacci 2, Ernesto D’Aloja 1,
Francesca Larese Filon 7, Marcello Campagna 1 and Luigi Isaia Lecca 1
1 Department of Medical Sciences and Public Health, University of Cagliari, 09042 Monserrato, Italy;
[email protected] (M.U.); [email protected] (S.P.); [email protected] (I.P.); [email protected] (D.F.); [email protected] (F.M.); [email protected] (M.P.); [email protected] (A.M.S.); [email protected] (E.D.); [email protected] (M.C.); [email protected] (L.I.L.)
2 Department of Civil and Environmental Engineering and Architecture, University of Cagliari,
09123 Cagliari, Italy; [email protected]
3 Department of Mechanical, Chemical and Materials Engineering, University of Cagliari,
I-09123 Cagliari, Italy; [email protected]
4 King Abdullah University of Science and Technology (KAUST), Biological and Environmental Science
and Engineering (BESE) Division, NABLA Lab, Thuwal 23955-6900, Saudi Arabia; [email protected] (A.F.); [email protected] (E.S.)
5 Department of Biomedical, Odontoiatric, Morphological and Functional Images, Occupational Medicine
Section, “Policlinico G. Martino” Hospital, University of Messina, I-98125 Messina, Italy; [email protected]
6 Department of Medical and Surgical Specialties, Radiological Sciences and Public Health, Section of Public
Health and Human Sciences, University of Brescia, 25123 Brescia, Italy; [email protected]
7 Unit of Occupational Medicine, Department of Medical Sciences, University of Trieste, 34129 Trieste, Italy;
* Correspondence: [email protected]; Tel.: +39-070-6754-435
Received: 30 December 2018; Accepted: 11 March 2019; Published: 15 March 2019
Abstract: The occupational exposure to airborne fine and ultrafine particles (UFPs) and noise in aircraft personnel employed in airport taxiway was investigated. Stationary samplings and multiple personal sampling sites and job tasks were considered. Size distribution, particle number concentrations, lung dose surface area were measured by personal particle counters and by means of an electric low pressure impactor (ELPI+TM). Morphological and chemical characterization of
UFPs were performed by transmission and scanning electron microscopy, the latter together with energy dispersive X-Ray spectroscopy based spatially resolved compositional mapping. A-weighted noise exposure level A-weighted noise exposure level normalized to an 8 h working day and Peak Sound C-weighted Pressure Level was calculated for single worker and for homogeneous exposure groups. Our study provides evidence on the impact of aviation-related emissions on occupational exposure to ultrafine particles and noise exposure of workers operating in an airport taxiway. Main exposure peaks are related to pre-flight operations of engine aircrafts. Although exposure to ultrafine particles and noise appears to not be critical if compared with other occupational scenarios, the coincidence in time of high peaks of exposure to ultrafine particles and noise suggest that further investigations are warranted in order to assess possible subclinical and clinical adverse health effects in exposed workers, especially for cardiovascular apparatus.
Keywords: ultrafine particle exposure; noise exposure; airport environments
1. Introduction
Several studies have identified civil and military aircraft activity as a potential source of particulate matter emission near airport zones [1–7]. In particular, it was highlighted that aircraft activity could contribute to increasing the levels of fine and ultrafine particles (UFPs) in the surrounding environment, with potential effects on the health of the population in the vicinity of the emission source [8–11].
In the last twenty years the research has focused on the analysis and evaluation of the fine and ultrafine particulate emissions associated with the airport activity, in particular on aircraft emissions and on exposure of the population living near airports [8,12]. However, there are a several of gaps about UFPs emission, on their behaviour in the atmosphere and, in particular, on their possible impact on the health of the people living next to the airport and working inside the airport [12].
UFPs concentration in the atmosphere can have a strong spatial and temporal variations and personal sampling can be more accurate than stationary sampling to assess UFPs personal exposure[13]. Recently, some studies have focused on UFPs personal exposure assessment in living and working environments [14–16]. However, to date there are still few studies about UFPs personal exposure in the living and working environment [17,18]. To the best of our knowledge, to date only two studies have evaluated personal exposure to UFPs in airport work environments [2,19].
Particulate matter exposure has been associated to a number of health effects on cardiovascular and respiratory system [20,21] and a potential carcinogen effect for lung [22]. Nevertheless, it is not clear yet whether the cardiovascular and respiratory effects are due to the specific chemical composition of particulate or whether they can depend on a physical mechanism associated to the size, morphology, surface area and charge of inhalable particles [23–25]. Several studies evaluated the autonomic balance of cardiovascular system, consequent to fine/ultrafine particulate exposure, both in animal [26] and human models [27,28]. These studies confirmed an association between ultrafine particulate exposure and a reduction in some heart rate variability (HRV) indexes. Noise exposure represents an additional parameter associated to working environments which showed several effects to cardiovascular system. In particular, long-term exposure to environmental noise affects cardiovascular system and can play a role in the development of manifest diseases such as hypertension, ischemic heart disease and stroke [29]. Environmental noise in airport settings represent a well-known risk factor for workers employed in airport activity and for inhabitants who live nearby airports[30]. Several studies reported an association between noise exposure generated from aircraft traffic and some effects on the cardiovascular system, such as an increased risk of cardiovascular diseases (myocardial infarction and stroke) and an increased risk of hospitalization for cardiovascular diseases for subjects living in the neighbouring areas of a civil airport [31,32]. Studies of the combined effects of noise and air pollution showed largely independent effects, which can be explained by different mechanisms of how both exposures can affect health [33–35]. Since both exposures (to UFPs and noise) can potentially influence the cardiovascular system, with a mechanism that is not fully clarified [36], studies on exposure assessment in working environments (such as the airport environment) characterized by the simultaneous presence of both risk factors, could provide information for the definition of work-based exposure matrices. To the best of our knowledge, there are not studies about simultaneous exposure to fine/ultrafine particulate matter and noise in personnel who operate in proximity of the airstrip, during aircraft passage. Accurately personal exposure assessment to air pollutants remains a significant challenge to determining their impact on human health [37].
Therefore, the increase in knowledge on simultaneous exposure to UFPs and noise could be useful for future epidemiological studies aiming at the observation of early biological effects that could clarify the presence of an additive or a synergistic mechanism of damage of the two risk factors.
The aim of the study is to assess occupational exposure to fine/ultrafine particulate and noise in aircraft personnel operating in airport taxiway during standard work activities.
2. Materials and Methods
2.1. Study Design and Sampling Environment
Between 16 March and 18 May 2018, multiple personal noise and fine/ultrafine particles (UFPs) monitoring has been carried out during an aircraft-training period.
The aircraft-training period was carried out in a small provincial airport in Sardinia, Italy. The study was conducted within a cohort of workers of the airport, with the following tasks: Aircraft Ground Equipment personnel (AGE), firefighting officer, flight security agent, aviation fuel’s administration staff (AFS). The exposure assessment has been performed exclusively via personal or environmental measurements during standard work activities and during the normal risk assessment as required by Italian legislation[38]. For this reason, participants were recruited from selected sections of the airport, through an in-site recruitment accorded with supervisors. Participation at the study was on volunteer basis and before the beginning of the test. Recruited subjects were informed about the study procedure and aims. With the aim to maximum reduce possible interferences with operational activities, samplings were planned at least one week apart and after consulting scheduled airport activities and internal supervisor organization. A total of 34 subjects were then enrolled and underwent the test session.
Working days, between 7:30 a.m. and 20:00 p.m., were considered based on the activity during training campaign of the specific section. Every day of test, two or three monitoring, lasting about 2.30 h, were performed. Two days of UFPs environmental samplings, lasting about 5 h each one, were also performed nearby the airstrip in the area of firefighting. Workers were asked to record activity diary (including times) during the sampling.
UFPs and noise data were collected in real time through instruments fitted by participant and then stored at the end of the working day. The workers wore hearing protection devices but not a dust mask.
2.2. Personal UFPs Monitoring
Personal collection of particulate matter was done using a Diffusion Size Classifier instrument (DISCmini, Matter Aerosol, Wohlen, Switzerland). DISCmini is based on unipolar diffusion charging of the particles to determine the alveolar lung deposited surface area (LDSA) concentration. Additionally, the DISCmini also allows an estimate of the mean particle size and the particle number concentration. The instrument’s range is 10–300 nm and accuracy is ±30%, with a flow rate at 1 L/min [39].
Particulates in a range between 0.25 µm and 2.5 µm were collected using a Sioutas Cascade Impactor (SKC Inc., Pittsburgh, PA, USA). Particle size cut-points are 2.5 µm (stage A), 1.0 µm (stage B), 500 nm (stage C) and 250 nm (stage D) at a 9 L/min flow rate with personal sampler Leland Legacy® air sampling pump (SKC Inc., Pittsburgh, PA, USA). In the A, B, C and D stages of the
device, Polytetrafluoroethylene (PTFE) membrane filters will be mounted for the subsequent morphological and chemical analysis of the collected particulate. Tubes attached to air intakes of each instrument were run along body of participant until the breathing zone.
Based on detected UFPs exposure, the following parameters were calculated: 1. UFPs Concentration (particles/cm3) individual and by homogeneous groups;
2. UFPs Size (nm) individual and by homogeneous groups;
3. Lung Deposition Surface Area (LDSA, µm2/cm3) UFPs concentration individual and by
homogeneous groups;
4. Total dose in term of LDSA (mm2) individual and by homogeneous groups.
Total dose LDSA represent a parameter of cumulative exposure and was calculated by the following formula:
Dose LDSA mm2 = (LDSA µm2/cm3 × Vol. cm3)/1.0 × 106
Dose LDSA mm2: The dose in terms of deposited lung surface area particles received by workers;
LDSA µm2/cm3: Mean of lung deposition particles surface area concentration;
Vol.cm3: Mean of total sampled volume on all subjects, corresponding to 143.63 L = 2 h 39 min.
2.3. Environmental UFPs Sampling
UFPs environmental sampling was carried out by means of a Low Pressure Electric Impactor model ELPI+™ (Electric Low Pressure Impactor—Dekati Ltd., Kangasala, Finland). This device allows real time detection of the particle’s diameter and number (range diameter 0.006–10 µm). The ELPI+ was connected to an air intake pump with 0.6 m3/h flow rate and a pressure of 40 mbar at the
final stage of the impactor (absolute filter). The number of UFPs was calculated as the sum of the particles having a central geometric mean diameter (Di) between 10 nm and 314 nm (D50% 6–257 nm), assuming a density of 1 g/cm3. Detailed descriptions of the ELPI+™ function and its principles
of operation are given in the literature [40]. Data processing has been performed with the ELPI + VI 2.0 software (Dekati Ltd. Software [41]).
2.4. Noise Exposure Monitoring
Personal noise sampling of continuous and impulsive noise was conducted using a BSWA Mod. MP201 (Beijing, China) microphone, connected to a Larson Davis PRM 828 preamplifier; microphone inputs were sent to a Larson Davis Model 820 (Depew, NY, USA) integrating sound level meter (1 Hz sampling rate).
All data originated from instruments were successively extracted and exported to NWWin (Noise & Vibration Works) software, for data analysis. Before starting measurement and after samplings, instruments were calibrated using a Larson Davis LD CAL 200 (Depew, NY, USA), to ensure measurement’s accuracy.
Microphone for impulse noise was placed on the helmet worn by operators during their activity. A-weighted noise exposure level (LAeq), A-weighted noise exposure level normalized to an 8 h working day (LAeq8hr) and Peak Sound C-weighted Pressure Level (LC peak) was calculated for single participant and for homogeneous exposure groups.
2.5. Particle Morphological and Chemical Analysis
Electron Microscopy techniques were used to investigate the morphology (size, shape, agglomeration) and the chemical composition of the particulate which was collected on the filters at the different stages of Sioutas Cascade Impactor. A fresh (i.e., not exposed to UFPs) filter was also investigated as a reference. In particular, after being removed from the Impactor each filter was inspected by optical stereomicroscopy and divided into two symmetrical pieces and the two halves were submitted to both transmission electron microscopy (TEM) and scanning electron microscopy (SEM) analysis. TEM imaging was used to assess the particle morphology and the corresponding images were acquired in bright field mode by a Hitachi H-7000 microscope, equipped with a W thermoionic gun operating at 100 kV and equipped with an AMT DVC (2048 × 2048 pixel) CCD Camera. Prior to observation, the filters were dipped into water, sonicated and the obtained particle dispersion was then deposited on a carbon coated (filter A) or holey carbon-coated (filters B–D) copper grid and let dry at room temperature.
Chemical composition of the particulate was assessed by SEM images. The filters at the different stages of Sioutas Cascade Impactor were analysed by means of a FEI Teneo microscope operating at a voltage of 15 kV and a beam current of 1.6 nA, after coating them with a very thin layer (10 nm) of amorphous carbon deposited by ion beam sputtering in order to make them electrically conductive and thus minimize any local charging phenomenon. Energy dispersive X-ray
spectrometry (EDX) mapping (i.e., the spatially-resolved chemical analysis) was performed using an
EDAX SDD Octane PRO EDX silicon drift detector (SDD) and by TEAM data acquisition and elaboration software.
2.6. Statistical Analysis
Analysis were conducted using SPSS (v. 24, package for Windows, SPSS Inc., Chicago, IL, USA). An α-value of 0.05 indicates statistical significance. Descriptive analysis of UFPs and noise (central tendency and dispersion) were calculated. Kolmogorov-Smirnov test was used to analyse sampling distributions. Log transformation of values was performed if the distribution was not normal. Comparisons between UFPs exposure and noise exposure levels by homogeneous groups were performed by ANOVA test for parametric data, using Log transformed values when needed.
ANOVA assumption were all respected: all the observations were independent and the variables of interest were normally distributed, testing the normality with the Kolmogorov Smirnov test. When the variables were not normally distributed, we considered log-transformed variables, confirming normality with Kolmogorov Smirnov test. In particular, a not normal distribution was found for particles number (mean), LDSA (mean) and total LDSA (mean). Then the mean of log transformed values were calculated for each variable of interest with a not normal distribution and the Kolmogorov Smirnov was performed to confirm normal distribution. Homogeneity was evaluated by Levene’s test, confirming that variance are equal between groups for log particles number, mean size, log. LDSA, log LDSA total and Laeq8hr.
A post hoc test (Tukey’s post hoc test) was performed to investigate differences among groups, when ANOVA test showed significant differences between mean values.
Correlation between UFPs parameters and noise levels was calculated by Spearman’s rho matrix for non-parametric data.
3. Results
Thirty-four operators underwent personal monitoring of fine/ultrafine particle and noise, distributed on 18 days between May and June 2018. In total, over 79 h of monitoring were done. Only one monitoring data were lost due to malfunctioning equipment during the test.
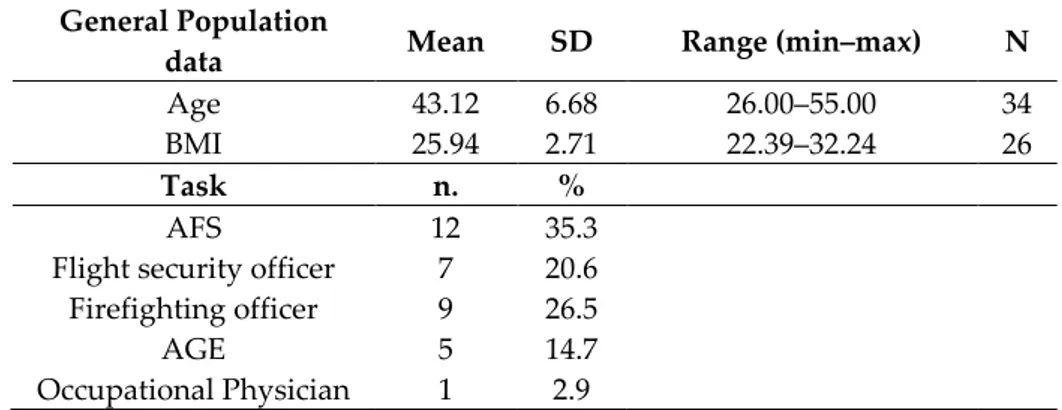
All subjects were male, with a mean age of over 43 years (ranging from 26 to 55). General data of the study population are reported in Table 1.
Table 1. General information of the study population and homogeneous groups. General Population
data Mean SD Range (min–max) N
Age 43.12 6.68 26.00–55.00 34
BMI 25.94 2.71 22.39–32.24 26
Task n. %
AFS 12 35.3
Flight security officer 7 20.6 Firefighting officer 9 26.5
AGE 5 14.7
Occupational Physician 1 2.9 3.1. UFPs Personal Exposure
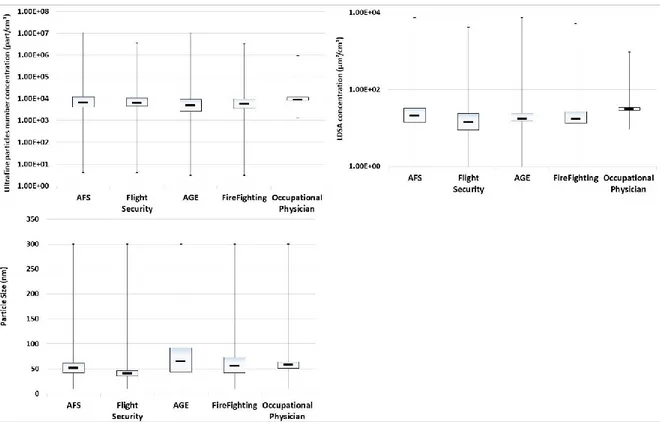
Exposure levels to UFPs expressed as median, interquartile range (IQR), arithmetic mean and standard deviation (SD) were calculated for the overall study population and by job task for homogenous groups. Figure 1 shows median, range and interquartile range of the UFPs number concentration (part/cm3), LDSA particles concentration (µm2/cm3) and particles size range (nm)
measured in homogenous groups.
Overall, the median of the UFPs number concentration measured on the 33 operators was between a minimum of 2.44 × 10³ part/cm3 and a maximum of 1.30 × 10⁴ part/cm3 (min–max
arithmetic mean: 3.43 × 10³–3.72× 10⁵ part/cm3). The median of LDSA concentration ranged from a
µm2/cm3). The average size range of particles measured was between a median of 35 nm and 103 nm,
respectively minimum and maximum (min–max arithmetic mean: 35–95 nm).
Figure 1. Median, range and interquartile range of the ultrafine particles (UFPs) number
concentration (part/cm3), particles size range (nm) and Lung Deposition Surface Area (LDSA)
particles concentration (µm2/cm3).
Figure 2 shows an example of the time variations of ultrafine particle number concentration (part/cm3) measured during of the personal sampling carried out on an AGE operator during
standard working condition. Furthermore, Figure 2 shows a summary table with the main activities carried out by worker during the sampling.
Figure 2. Example of one personal sampling of ultrafine particles (part/cm3) measured during
standard working condition.
Figure 2 shows the high variability of the UFPs number concentration measured during AGE activities. Maximum peak of UFPs number concentration (9.59 × 10⁶) was measured during support
in taxiing and taking off of the aircraft.
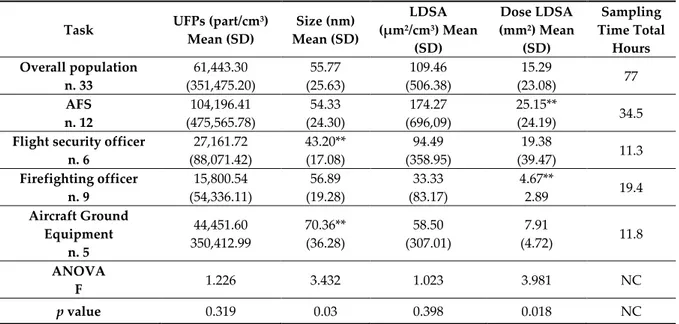
Comparing UFPs concentration, UFPs size and LDSA by means of ANOVA test, as appropriated using Log transformed variables, results showed a significant difference between groups in term of mean size range (nm) [p = 0.03] and dose of LDSA (mm2) [p = 0.018] but not for
UFPs concentration (part/cm3) and LDSA concentration (µm2/cm3) [p> 0.5] (Table 2). In particular,
flight security officers were exposed to a particle size range significantly lower than aircraft ground equipment operators. Furthermore, AFS operators were exposed to a LDSA (mm2) significantly
higher than Firefighting officers.
Table 2. Exposure levels (UFPs concentration, size range, Lung Deposition Surface Area
concentration/dose and total sampling hours) in the overall study population and by homogeneous groups.
Task UFPs (part/cm 3) Mean (SD) Size (nm) Mean (SD) LDSA (µm2/cm3) Mean (SD) Dose LDSA (mm2) Mean (SD) Sampling Time Total Hours Overall population n. 33 61,443.30 (351,475.20) 55.77 (25.63) 109.46 (506.38) 15.29 (23.08) 77 AFS n. 12 104,196.41 (475,565.78) 54.33 (24.30) 174.27 (696,09) 25.15** (24.19) 34.5
Flight security officer n. 6 27,161.72 (88,071.42) 43.20** (17.08) 94.49 (358.95) 19.38 (39.47) 11.3 Firefighting officer n. 9 15,800.54 (54,336.11) 56.89 (19.28) 33.33 (83.17) 4.67** 2.89 19.4 Aircraft Ground Equipment n. 5 44,451.60 350,412.99 70.36** (36.28) 58.50 (307.01) 7.91 (4.72) 11.8 ANOVA F 1.226 3.432 1.023 3.981 NC p value 0.319 0.03 0.398 0.018 NC
ANOVA test performed using log transformed values. NC= not calculated. ** differences between means are significant after Tukey’s post hoc test.
Results of environmental samplings of airborne particle are reported in Table 3. Sampling lasted for about five hours each one and showed similar median values, nevertheless a high dispersion as indicated by the IQR and SD.
Table 3. Summary data of stationary samplings carried out by ELPI+. Data show median, range
(Min-Max), interquartile range (IQR), mean and standard deviation (SD) of UFPs number concentration. Sampling day A B Sampling Time (hh:mm:ss) 05:39:15 04:57:15 Median 1.02 × 10⁴ 1.33 × 10⁴ Min − Max 3.86 × 10³ − 5.38 × 10⁴ 4.00 × 10³ − 2.12 × 10⁵ IQR 8.01 × 10³ − 1.36 × 10⁴ 1.08 × 10⁴ − 1.50 × 10⁴ Mean (SD) 1.16 × 10⁴ ± 5.36 × 10³ 1.56 × 10⁴ ±1.49 × 10⁴
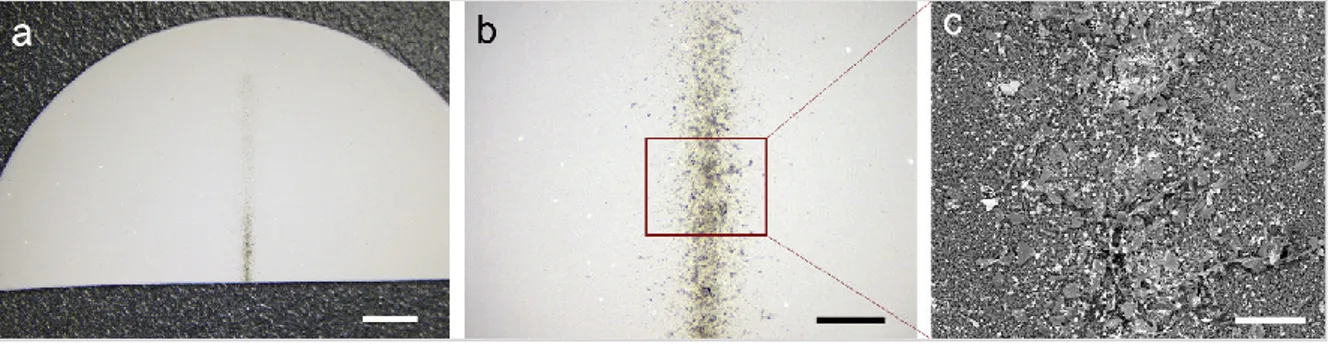
The particles collected on the Sioutas Cascade impactor filters are visible as a scattered dark grey deposit area on the filter as shown by the optical images acquired by a stereomicroscope and reported in Figure 3a,b. Morphology and chemical composition of the collected particles was investigated by TEM and SEM imaging. In particular, SEM direct imaging of the filters shows that the area of the grey contrast corresponds to particle deposits, as shown in Figure 3c.
Figure 3. Optical (a,b) and scanning electron microscope (SEM) (c) images in wide view of the
particles collected on the impactor filter. The filter is cut in two symmetrical parts which are used for SEM and TEM analysis. Scale bars length are: 2mm (a), 500µm (b), 100µm (c).
Morphological characterization of the particles collected as obtained by TEM observations is reported in Figure 4. In particular, TEM representative for the particles collected for each stage corresponding to particle size cut-points in the different stages of the impactor are shown clockwise and labelled as A, B, C, D, respectively.
Figure 4. Transmission electron microscope (TEM) micrographs representative for the particles
collected in the sampling stages labelled as (A–D), respectively and corresponding to decreasing aerodynamic diameter.
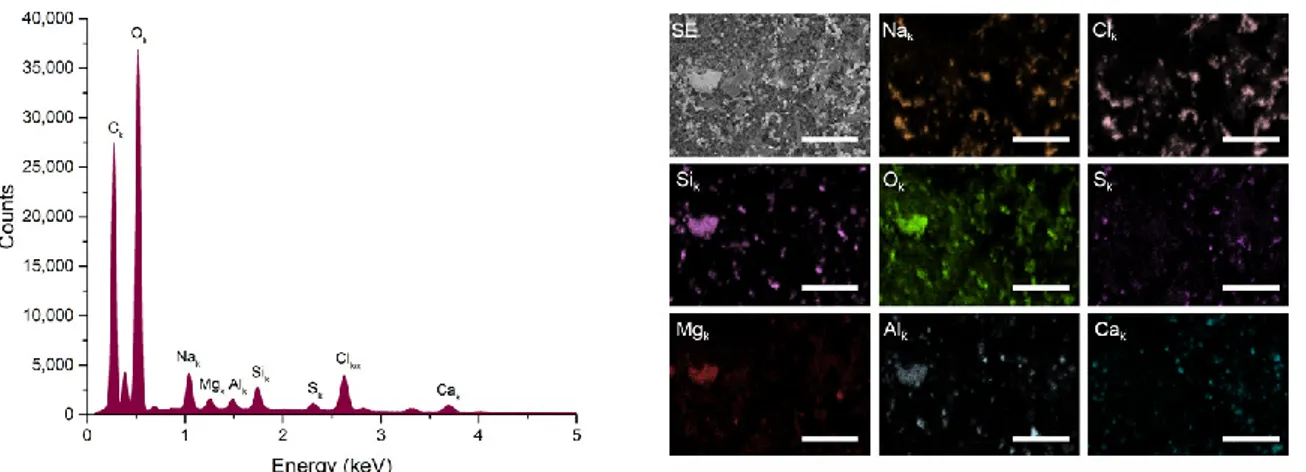
The micrographs show the occurrence of submicron-sized particles with different and irregular particle morphology. Some morphologies which are encountered at all stages are commonly ascribed to soot and carbonaceous carbon [42]. Aggregates represent the most common morphology, although it is not possible to assess whether they are actually representative of the fine particles present in the sampled atmosphere or whether they formed as a consequence of the sampling procedure or of the TEM specimen preparation route. Going from particles collected at stage A to stage D some differences can be noticed. In particular, a decrease both in the average size of the aggregates and of the individual particles that compose them is observed: while aggregates present at stage A are made out of particles of few tens of nanometres (~40 nm) and have overall size up to 550 nm, aggregates present at stage D are made out of particles with size below 10 nm and have overall size up to 120 nm. SEM investigation was used to investigate the chemical composition of the particulate collected on the filters through EDS analysis. The EDX spectra show the occurrence of the same elements in the particulate collected at the different stages and in particular of sodium, potassium, magnesium, calcium, aluminium, carbon, nitrogen, silicon, oxygen, fluorine, chlorine and sulphur, as shown in Figure 5 for the case of sample A. Note that EDS analysis of the blank filter used as a reference shows the occurrence of C N and O, as expected.
Figure 5. EDX spectrum (left) corresponding to the overall integration of the signals shown in the
chemical mapping(right) from particles collected in the stage A (cut-off 2.5 µm). Scale bar’s length in the chemical maps is 50 µm.
Energy filtered images were also collected in order to gain insights on the distribution of the detected elements within the sample. Figure 5 shows the SEM image of a selected area of sample A and the corresponding energy filtered images which show in false colours the distribution of the detected elements. The so obtained elemental maps show that there is a correlation between the distribution of Na and Cl suggesting the occurrence of sodium chloride particles. The distribution of Mg, Al, Si and O also show some correlation, suggesting the presence of silico-aluminates. Traces of iron were also detected in the energy dispersive spectrum but due to the low amount the corresponding distribution could not be obtained. Overall, no significant difference in chemical composition was observed in the particles collected at the stages B, C and D, being Na, Cl, Si and O the most abundant elements also in those cases.
3.3.Noise Exposure Assessment
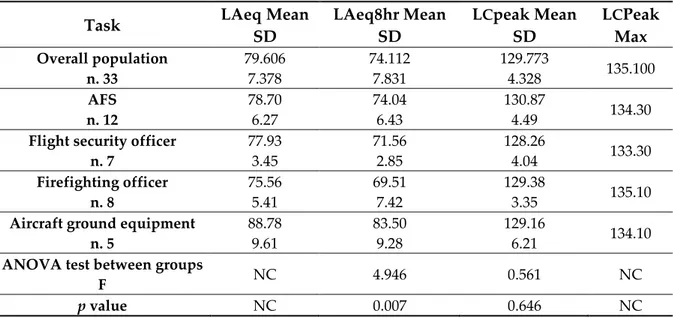
A-weighted noise exposure level (LAeq), A-weighted noise exposure level normalized to an 8 h working day (LAeq8hr) and Peak Sound C-weighted Pressure Level (LC peak) have been calculated for single participant. LAeq ranged from 63.8 to 93.7 dBA (mean 79.6, SD 7.4), while LAeq8hr ranged
from 54.6 to 91.5 dBA. LC peak maximum level reached 135 dBC (mean 129.7, SD 4.3). Noise exposure levels by homogeneous group are reported in Table 4. Considering LAeq8hr, the most exposed group appears to be the Aircraft ground equipment personnel (mean 83.5 dBA, SD 9.28), while the less exposed was the firefighting officers (mean 69.51, SD 7.42). All subgroups were exposed to pick levels over 133 dBC, with the maximum pick reached by Aircraft ground equipment (135.1 dBC). Laeq8hr and LC peak comparisons between task groups by means of ANOVA test and post hoc test showed a LAeq8hr significantly higher in AGE officers with respect to flight security (Tukey’s post hoc p=0.023) and firefighting (Tukey’s post hoc p=0.005) while did not show significant differences between groups for LCpeak.
Table 4. Noise exposure levels in the overall study population and stratified by job task. ANOVA
test comparing noise exposure levels by job tasks. NC= not calculated.
Task LAeq Mean
SD LAeq8hr Mean SD LCpeak Mean SD LCPeak Max Overall population n. 33 79.606 7.378 74.112 7.831 129.773 4.328 135.100 AFS n. 12 78.70 6.27 74.04 6.43 130.87 4.49 134.30 Flight security officer
n. 7 77.93 3.45 71.56 2.85 128.26 4.04 133.30 Firefighting officer n. 8 75.56 5.41 69.51 7.42 129.38 3.35 135.10 Aircraft ground equipment
n. 5 88.78 9.61 83.50 9.28 129.16 6.21 134.10 ANOVA test between groups
F NC 4.946 0.561 NC
p value NC 0.007 0.646 NC
Figure 6 shows an example of the time variations of LAeq and LC peak (dB) measured during of the personal sampling carried out on an AGE operator during standard working condition. Furthermore, Figure 6 shows a summary table with the main activities carried out by worker during the sampling.
Figure 6. An example of the time variations of LAeq and LC peak (dB) measured during of the
personal sampling carried out on an AGE operator.
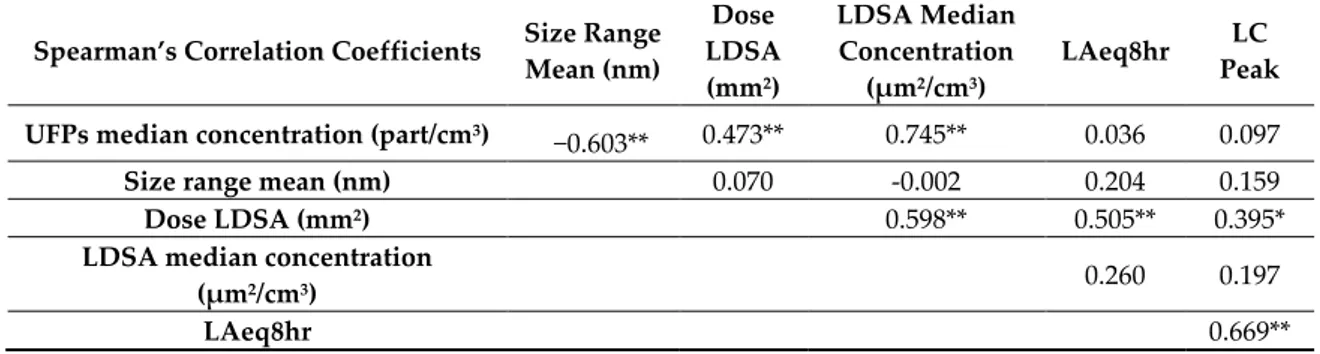
Spearman’s Rho correlation test between exposure levels (Table 5) to UFP and noise showed an inverse correlation between UFPs number concentration and particle size range (Rho= −0.603) and a positive correlation between UFPs number concentration and Dose LDSA (mm2) (Rho= 0.473) and
LDSA median concentration (µm2/cm3) (Rho = 0.745), while no correlation was appreciable with
noise exposure levels. On the other hand, total dose LDSA (mm2) had a good positive correlation
with noise exposure (Rho=0.505; Rho=0.395, for Laeq8hr and LC peak respectively), while median LDSA did not show any significant correlation with Laeq8hr and LC Peak (p>0.05). Compete matrix correlation are reported in Table 5.
Table 5. Spearman’s Rho correlation coefficients between UFPs median concentration (part/cm3),
particle size range (nm), Dose LDSA (mm2), LDSA median concentration (µm2/cm3), LAeq8hr and LC
Peak. * p < 0.05; ** p < 0.01.
Spearman’s Correlation Coefficients Size Range Mean (nm) Dose LDSA (mm2) LDSA Median Concentration (µm2/cm3) LAeq8hr LC Peak UFPs median concentration (part/cm3)
−0.603** 0.473** 0.745** 0.036 0.097
Size range mean (nm) 0.070 -0.002 0.204 0.159
Dose LDSA (mm2) 0.598** 0.505** 0.395* LDSA median concentration
(µm2/cm3) 0.260 0.197
LAeq8hr 0.669**
* Correlation is significant at the 0.05 level. ** Correlation is significant at the 0.01 level.
4. Discussion
Simultaneous sampling of personal exposure to fine/ultrafine particulate and noise were performed during standard working activity in an airport environment.
A significant difference in mean size distribution and median Dose LDSA (mm2) between
different job tasks was found: flight security officer had a mean size significantly lower than aircraft ground equipment and AFS operators were exposed to a LDSA (mm2) significantly higher than
Firefighting officers. These tasks are characterized by a different source of emission: diesel fumes derived from engines used by flight security officer and Firefighting officers, while AGE personnel are principally exposed to aircraft fumes. Median UFPs number concentration measured by environmental sampling were comparable to those measured inside the military airport located downwind to the take-off and taxiing area, where the median UFP count ranged between 3.7 × 10³
and 2.9 × 10⁴ particles/cm3[1,2]. UFPs peak values are quite comparable to UFPs concentration
measured by previous studies in others airport during taxing, take-off and landing of different aircraft [43–46]. The chemical characterization has shown a substantially overlapping composition. Chemical composition of the collected particles was comparable with other studies [47,48]. Cheng et al.[47] showed little metals were present on particles emitted from military aircraft engines, while most of the materials on the exhaust particles were carbon and sulphate based. Mazaheri et al. [48] showed that the EDX analysis on particle emitted by aircraft showed the main elements in the nucleation particles were C, O, S and Cl and the particle-induced X-ray emission (PIXE) analysis of the airfield samples was generally in agreement with the EDX in detecting S, Cl, K, Fe and Si in the particles. Further research is needed to carry out an analysis focused on the chemical composition of the airborne particulate collected in the different scenarios exhibited, which could provide further information that would help to identify possible differences in exposure by source.
Noise exposure assessment showed a LAeq8hr significantly higher in AGE subgroup, with respect to flight security and firefighting. LAeq8hr by job task exceeded recommended exposure limit (REL) of 85 dBA only for AGE subgroup. Exposures at or above this level are considered as
hazardous [49]. Instead, LC peak showed similar values on several job tasks, below the threshold level of 140 dB for peak sound pressure level [49].
Spearman’s Rho correlation test between exposure levels (Table 5) to UFPs and noise shows a weak correlation between Dose LDSA (mm2) LAeq8hr and LC peak which could indicate an
exposure to UFP and noise are in partially contemporary, supported by the absence of correlation with noise exposure levels and UFP concentration in terms of number and LDSA concentration.
Several studies took into consideration road traffic as a source of UFP [50], highlighting that an interquartile range increase in UFP levels (18,200 part/cm3) was associated with a significant
decrease in high-frequency power 4 h after the start of cycling. Meier et al.[51] have investigated short-term health effects related to particle and noise exposure in highway maintenance workers and suggest that exposure to particles and noise during highway maintenance work might pose a cardiovascular health risk.
Although further studies are needed in order to investigate more and other job tasks, results can help to clarify the different exposure scenarios in the airport environment. Through an assessment of the contribution of the different risk factors or the possible contribution of the different components of the pollutant, it is possible to provide exposure matrices based on the work. The latter could be useful for future epidemiological studies aimed at the observation of early biological effects that could clarify the presence of an additive or a synergistic mechanism of the two risk factors.
5. Conclusions
To the best of our knowledge, this is the first study conducted during standard working activity, in a real exposure scenario, involving healthy workers exposed simultaneously to UFPs and noise inside an airport environment. Although exposure to UFPs and noise appears to not be critical when compared with other occupational scenarios, the coincidence in the timing of high peaks of exposure to UFPs and noise suggests that further investigations are warranted in order to assess possible subclinical and clinical adverse health effects in exposed workers, especially for cardiovascular apparatus.
Author Contributions: Conceptualization, G.M., F.M., M.C. and L.I.L.; Formal analysis, G.M., M.F.C., M.U.,
A.F., E.M., E.S., S.P., I.P., D.F., F.M., M.P., A.M.S. and L.I.L.; Investigation, G.M., M.F.C., M.U., A.F., E.M., E.S., S.P., I.P., D.F., M.P., A.M.S., J.F. and L.I.L.; Methodology, G.M., M.F.C., A.F., E.S. and L.I.L.; Project administration, G.M. and L.I.L.; Supervision, J.F., G.M., E.D., F.L.F., M.C. and L.I.L.; Validation, M.F.C., A.F., E.S., F.M., J.F., G.M., E.D., F.L.F. and M.C.; Visualization, G.M., M.F.C., M.U., A.F., E.M., E.S., S.P., I.P., D.F., M.P., A.M.S., J.F. and L.I.L.; Writing–original draft, G.M., M.F.C., M.U., A.F., M.C. and L.I.L.; Writing–review & editing, G.M., M.F.C., G.M., E.D., F.L.F., M.C. and L.I.L.
Funding: This research received no external funding.
Conflicts of Interest: The authors declare no conflict of interest. References
1. Campagna, M.; Frattolillo, A.; Pili, S.; Marcias, G.; Angius, N.; Mastino, C.C.; Cocco, P.; Buonanno, G. Environmental exposure to ultrafine particles inside and nearby a military airport. Atmosphere 2016, 7, 138, doi:10.3390/atmos7100138.
2. Buonanno, G.; Bernabei, M.; Avino, P.; Stabile, L. Occupational exposure to airborne particles and other pollutants in an aviation base. Environ. Pollut.2012, 170, 78–87, doi:10.1016/j.envpol.2012.05.027.
3. Hu, S.; Fruin, S.; Kozawa, K.; Mara, S.; Winer, A.M.; Paulson, S.E. Aircraft emission impacts in a neighborhood adjacent to a general aviation airport in southern California. Environ. Sci. Technol.2009, 43, 8039–8045, doi:10.1021/es900975f.
4. Hsu, H.H.; Adamkiewicz, G.; Andres Houseman, E.; Vallarino, J.; Melly, S.J.; Wayson, R.L.; Spengler, J.D.; Levy, J.I. The relationship between aviation activities and ultrafine particulate matter concentrations near a mid-sized airport. Atmos. Environ.2012, 50, 328–337, doi:10.1016/j.atmosenv.2011.12.002.
5. Westerdahl, D.; Fruin, S.A.; Fine, P.L.; Sioutas, C. The Los Angeles International Airport as a source of ultrafine particles and other pollutants to nearby communities. Atmos. Environ.2008, 42, 3143–3155, doi:10.1016/j.atmosenv.2007.09.006.
6. Hsu, H.H.; Adamkiewicz, G.; Houseman, E.A.; Zarubiak, D.; Spengler, J.D.; Levy, J.I. Contributions of aircraft arrivals and departures to ultrafine particle counts near Los Angeles International Airport. Sci.
Total Environ.2013, 444, 347–355, doi:10.1016/j.scitotenv.2012.12.010.
7. Riley, E.A.; Gould, T.; Hartin, K.; Fruin, S.A.; Simpson, C.D.; Yost, M.G.; Larson, T. Ultrafine particle size as a tracer for aircraft turbine emissions. Atmos. Environ.2016, 139, 20–29, doi:10.1016/j.atmosenv.2016.05.016.
8. Cattani, G.; Di Menno di Bucchianico, A.; Gaeta, A.; Romani, D.; Fontana, L.; Iavicoli, I. Airports and air quality: A critical synthesis of the literature. Epidemiol. Prev.2014,38, 254–261.
9. Keuken, M.P.; Moerman, M.; Zandveld, P.; Henzing, J.S. Total and size-resolved particle number and black carbon concentrations near an industrial area. Atmos. Environ.2015, 122, 196–205, doi:10.1016/j.atmosenv.2015.09.047.
10. Ren, J.; Liu, J.; Li, F.; Cao, X.; Ren, S.; Xu, B.; Zhu, Y. A study of ambient fine particles at Tianjin International Airport, China. Sci. Total Environ.2016, 556, 126–135, doi:10.1016/j.scitotenv.2016.02.186. 11. Hudda, N.; Simon, M.C.; Zamore, W.; Durant, J.L. Aviation-Related Impacts on Ultrafine Particle Number
Concentrations Outside and Inside Residences near an Airport. Environ. Sci. Technol.2018, 52, 1765–1772, doi:10.1021/acs.est.7b05593.
12. Stacey, B. Measurement of ultrafine particles at airports: A review. Atmos. Environ. 2019, 198, 463–477, doi:10.1016/j.atmosenv.2018.10.041.
13. Brouwer, D.H.; Lurvink, M.W.M. Personal Exposure to Ultrafine Particles in the Workplace: Exploring Sampling Techniques and Strategies.Ann. Occup. Hyg. 2004, 48, 439–453, doi:10.1093/annhyg/meh040. 14. Buonanno, G.; Marks, G.B.; Morawska, L. Health effects of daily airborne particle dose in children: Direct
association between personal dose and respiratory health effects. Environ. Pollut.2013, 180, 246–250, doi:10.1016/j.envpol.2013.05.039.
15. Marcias, G.; Fostinelli, J.; Sanna, A.M.; Uras, M.; Catalani, S.; Pili, S.; Fabbri, D.; Pilia, I.; Meloni, F.; Lecca, L.I.; et al. Occupational Exposure to Fine Particles and Ultrafine Particles in a Steelmaking Foundry.
Metals2019, 9, 163, doi:10.3390/met9020163.
16. Habre, R.; Zhou, H.; Eckel, S.P.; Enebish, T.; Fruin, S.; Bastain, T.; Rappaport, E.; Gilliland, F. Short-term e ff ects of airport-associated ultra fi ne particle exposure on lung function and in fl ammation in adults with asthma. Environ. Int. 2018, 118, 48–59, doi:10.1016/j.envint.2018.05.031.
17. Kumar, P.; Morawska, L.; Birmili, W.; Paasonen, P.; Hu, M.; Kulmala, M.; Harrison, R.M.; Norford, L.; Britter, R. Ultrafine particles in cities. Environ. Int.2014, 66, 1–10, doi:10.1016/J.ENVINT.2014.01.013. 18. Viitanen, A.-K.; Uuksulainen, S.; Koivisto, A.J.; Hämeri, K.; Kauppinen, T. Workplace Measurements of
Ultrafine Particles—A Literature Review. Ann. Work Expo. Heal.2017, 61, 749–758, doi:10.1093/annweh/wxx049.
19. Møller, K.L.; Thygesen, L.C.; Schipperijn, J.; Loft, S.; Bonde, J.P.; Mikkelsen, S.; Brauer, C. Occupational exposure to ultrafine particles among airport employees-combining personal monitoring and global positioning system. PLoS ONE2014, 9, e106671, doi:10.1371/journal.pone.0106671.
20. Boldo, E.; Medina, S.; Le Tertre, A.; Hurley, F.; Mücke, H.-G.; Ballester, F.; Aguilera, I.; Eilstein, D.; Apheis Group Apheis: Health Impact Assessment of Long-term Exposure to PM2.5 in 23 European Cities. Eur. J.
Epidemiol.2006, 21, 449–458, doi:10.1007/s10654-006-9014-0.
21. Bostan, H.B.; Rezaee, R.; Valokala, M.G.; Tsarouhas, K.; Golokhvast, K.; Tsatsakis, A.M.; Karimi, G. Cardiotoxicity of nano-particles. Life Sci.2016, 165, 91–99, doi:10.1016/j.lfs.2016.09.017.
22. Loomis, D.; Grosse, Y.; Lauby-Secretan, B.; Ghissassi, F. El; Bouvard, V.; Benbrahim-Tallaa, L.; Guha, N.; Baan, R.; Mattock, H.; Straif, K. The carcinogenicity of outdoor air pollution. Lancet Oncol.2013, 14, 1262–1263, doi:10.1016/S1470-2045(13)70487-X.
23. Cho, W.-S.; Duffin, R.; Poland, C.A.; Howie, S.E.M.; MacNee, W.; Bradley, M.; Megson, I.L.; Donaldson, K. Metal Oxide Nanoparticles Induce Unique Inflammatory Footprints in the Lung: Important Implications for Nanoparticle Testing. Environ. Health Perspect.2010, 118, 1699–1706, doi:10.1289/ehp.1002201.
24. Pietroiusti, A. Health implications of engineered nanomaterials. Nanoscale2012, 4, 1231, doi:10.1039/c2nr11688j.
25. Manke, A.; Wang, L.; Rojanasakul, Y. Mechanisms of nanoparticle-induced oxidative stress and toxicity.
Biomed Res. Int.2013, 2013, 942916, doi:10.1155/2013/942916.
26. Jia, X.; Hao, Y.; Guo, X. Ultrafine carbon black disturbs heart rate variability in mice. Toxicol. Lett.2012, 211, 274–280, doi:10.1016/j.toxlet.2012.04.007.
27. Tobaldini, E.; Bollati, V.; Prado, M.; Fiorelli, E.M.; Pecis, M.; Bissolotti, G.; Albetti, B.; Cantone, L.; Favero, C.; Cogliati, C.; et al.Acute particulate matter affects cardiovascular autonomic modulation and IFN-γ methylation in healthy volunteers. Environ. Res.2018, 161, 97–103, doi:10.1016/j.envres.2017.10.036. 28. Shutt, R.H.; Kauri, L.M.; Weichenthal, S.; Kumarathasan, P.; Vincent, R.; Thomson, E.M.; Liu, L.; Mahmud,
M.; Cakmak, S.; Dales, R. Exposure to air pollution near a steel plant is associated with reduced heart rate variability: A randomised crossover study. Environ. Heal.2017, 16, 4, doi:10.1186/s12940-016-0206-0. 29. Basner, M.; Babisch, W.; Davis, A.; Brink, M.; Clark, C.; Janssen, S.; Stansfeld, S. Auditory and
non-auditory effects of noise on health. Lancet2014, 383, 1325–1332, doi:10.1016/S0140-6736(13)61613-X. 30. Gerolymatou, G.; Nicolas, R.; Vogiatzis, K.; Zafiropoulou, V. Assessing Health Effects and Soundscape
Analysis as New Mitigation Actions Concerning the Aircraft Noise Impact in Small- and Middle-Size Urban Areas in Greece.Environments2019, 6, 4, doi:10.3390/environments6010004.
31. Correia, A.W.; Peters, J.L.; Levy, J.I.; Melly, S.; Dominici, F. Residential exposure to aircraft noise and hospital admissions for cardiovascular diseases: Multi-airport retrospective study. BMJ2013, 347, f5561, doi:10.1136/bmj.f5561.
32. Hansell, A.L.; Blangiardo, M.; Fortunato, L.; Floud, S.; de Hoogh, K.; Fecht, D.; Ghosh, R.E.; Laszlo, H.E.; Pearson, C.; Beale, L.; et al. Aircraft noise and cardiovascular disease near Heathrow airport in London: Small area study. BMJ2013, 347, f5432, doi:10.1136/bmj.f5432.
33. Sørensen, M.; Andersen, Z.J.; Nordsborg, R.B.; Jensen, S.S.; Lillelund, K.G.; Beelen, R.; Schmidt, E.B.; Tjønneland, A.; Overvad, K.; Raaschou-Nielsen, O. Road Traffic Noise and Incident Myocardial Infarction: A Prospective Cohort Study. PLoS ONE2012, 7, e39283, doi:10.1371/journal.pone.0039283.
34. Huss, A.; Spoerri, A.; Egger, M.; Röösli, M.; Swiss National Cohort Study Group Aircraft Noise, Air Pollution, and Mortality From Myocardial Infarction. Epidemiology2010, 21, 829–836, doi:10.1097/EDE.0b013e3181f4e634.
35. Gan, W.Q.; Davies, H.W.; Koehoorn, M.; Brauer, M. Association of Long-term Exposure to Community Noise and Traffic-related Air Pollution With Coronary Heart Disease Mortality. Am. J. Epidemiol.2012, 175, 898–906, doi:10.1093/aje/kwr424.
36. Corbin, J.C. PM0.1 particles from aircraft may increase risk of vascular disease. BMJ2013, 347, f6783, doi:10.1136/BMJ.F6783.
37. Leaffer, D.; Wolfe, C.; Doroff, S.; Gute, D.; Wang, G.; Ryan, P. Wearable Ultrafine Particle and Noise Monitoring Sensors Jointly Measure Personal Co-Exposures in a Pediatric Population.Int. J. Environ. Res.
Public Health2019, 16, 308,doi:10.3390/ijerph16030308.
38. D.lgs. 9 aprile 2008, n. 81 Testo coordinato con il D.Lgs. 3 agosto 2009, n. 106; Italy, 2008;Available online:http://www.gazzettaufficiale.it/eli/id/2008/04/30/008G0104/sg (accessed on 30 December 2018). 39. Fierz, M.; Meier, D.; Steigmeier, P.; Burtscher, H. Miniature nanoparticle sensors for exposure
measurement and TEM sampling. J. Phys. Conf. Ser.2015, 617,012034,doi:10.1088/1742-6596/617/1/012034. 40. Marjamäki, M.; Keskinen, J.; Chen, D.R.; Pui, D.Y. Performance evaluation of the Electrical Low-Pressure
Impactor (ELPI). J. Aerosol Sci.2000, 31, 249–261.
41. Dekati Ltd. ELPIVI Software Manual version 4.1 0.; Dekati Ltd.: Kangasala, Finland, 2008.
42. Tumolva, L.; Park, J.-Y.; Kim, J.; Miller, A.L.; Chow, J.C.; Watson, J.G.; Park, K. Morphological and Elemental Classification of Freshly Emitted Soot Particles and Atmospheric Ultrafine Particles using the TEM/EDS. Aerosol Sci. Technol.2010, 44, 202–215, doi:10.1080/02786820903518907.
43. Campagna, M.; Pilia, I.; Marcias, G.; Frattolillo, A.; Pili, S.; Bernabei, M.; d’Aloja, E.; Cocco, P.; Buonanno, G. Ultrafine Particle Distribution and Chemical Composition Assessment during Military Operative Trainings. Int. J. Environ. Res. Public Health2017, 14, 579, doi:10.3390/ijerph14060579.
44. Herndon, S.C.; Onasch, T.B.; Frank, B.P.; Marr, L.C.; Jayne, J.T.; Canagaratna, M.R.; Grygas, J.; Lanni, T.; Anderson, B.E.; Worsnop, D.; et al. Particulate emissions from in-use commercial aircraft. Aerosol Sci.
Technol.2005, 39, 799–809, doi:10.1080/02786820500247363.
45. Zhu, Y.; Fanning, E.; Yu, R.C.; Zhang, Q.; Froines, J.R. Aircraft emissions and local air quality impacts from takeoff activities at a large International Airport. Atmos. Environ.2011, 45, 6526–6533, doi:10.1016/j.atmosenv.2011.08.062.
46. Psanis, C.; Triantafyllou, E.; Giamarelou, M.; Manousakas, M.; Eleftheriadis, K.; Biskos, G. Particulate matter pollution from aviation-related activity at a small airport of the Aegean Sea Insular Region. Sci.
Total Environ.2017, 596–597, 187–193, doi:10.1016/j.scitotenv.2017.04.078.
47. Cheng, M.D.; Corporan, E. A study of extractive and remote-sensing sampling and measurement of emissions from military aircraft engines. Atmos. Environ.2010, 44, 4867–4878, doi:10.1016/j.atmosenv.2010.08.033.
48. Mazaheri, M.; Bostrom, T.E.; Johnson, G.R.; Morawska, L. Composition and morphology of particle emissions from in-use aircraft during takeoff and landing. Environ. Sci. Technol.2013, 47, 5235–5242, doi:10.1021/es3046058.
49. Criteria for a recommended standard: Occupational noise exposure: Revised criteria, U.S. Department of Health and Human Services, Public Health Service, Centers for Disease Control and Prevention, National Institute for Occupational Safety and Health; NIOSH: Cincinnati, OH, USA, 1998.
50. Weichenthal, S.; Kulka, R.; Dubeau, A.; Martin, C.; Wang, D.; Dales, R. Traffic-Related Air Pollution and Acute Changes in Heart Rate Variability and Respiratory Function in Urban Cyclists. Environ. Health
Perspect.2011, 119, 1373–1378, doi:10.1289/ehp.1003321.
51. Meier, R.; Cascio, W.E.; Ghio, A.J.; Wild, P.; Danuser, B.; Riediker, M. Associations of short-term particle and noise exposures with markers of cardiovascular and respiratory health among highway maintenance workers. Environ. Health Perspect. 2014, 726, 726–732.
© 2019 by the authors. Licensee MDPI, Basel, Switzerland. This article is an open access article distributed under the terms and conditions of the Creative Commons Attribution (CC BY) license (http://creativecommons.org/licenses/by/4.0/).