TABLE OF CONTENTS
1-Introduction………..……… ………..3
2- Method of analysis………..……… ……….. 4
3-Reference reactor model……….…… …..……… 4
4-Neutron flux ……….……… 9
5-Gamma flux ……….………… ……… 17
6-In operation doses distribution 26
7- Conclusion ………..…. ……….… ….. 34
1. Introduction
This report is the completion of the former document FPN-P9LU-039 [1] with the following improvements:
increase of the reactor geometrical description in the z and r directions (cylindrical geometry);
addition of the whole concrete structures up to the control room (included in the model);
addition of several main components, such as the LGMS (Long Term Gravity Makeup System), main pipes, SG (steam generators) supports, etc;
inclusion of relevant details in geometry, such as openings, stiffening structures and Steam Generators (SG) in particle shielding.
2. Method of Analysis
Deterministic methods, coupled to certified and experimentally validated cross section libraries, may be used both for design and for licensing purposes, since the associated uncertainties are well known.
On the other hand, these models, based on the discrete ordinate transport theory, have difficulties to create and to tune the geometrical model. The recent development by ENEA Bologna of the BOT3P pre-post processor code system [2, 3, 4] makes it possible for the TORT code [5] to be fully suitable to perform this kind of calculation in the best framework. A parametric study has been carried out by using the broad-group coupled n-γ working cross section library (47 energy groups for neutrons + 20 for γ rays) BUGLE-96 [6], with the thermal up-scattering cross sections retained in the thermal region for groups below 5 eV (designated as library BUGLE-96T). Fixed source calculations with one source iteration were performed in the P3 S8 approximation, order of the expansion in Legendre polynomials of the scattering cross-sections and order of the flux angular discretization, respectively. The self-shielded cross-sections have been processed for typical LWR materials and temperatures. The atomic weights and isotopic abundances are based on [7]; the atomic densities for the different materials were calculated by the ADEFTA program [8].
3. Reference Reactor Model
The IRIS geometry used in the present analysis is slightly different from the MCNP [9] model developed by K.W. Burn [10]: The TORT model is based on ENSA drawings [11] and has been continuously refined during the work, adding stuff that plays a role in the overall particle distribution with particular attention to objects having an effect in shielding particle towards the control room during operation.
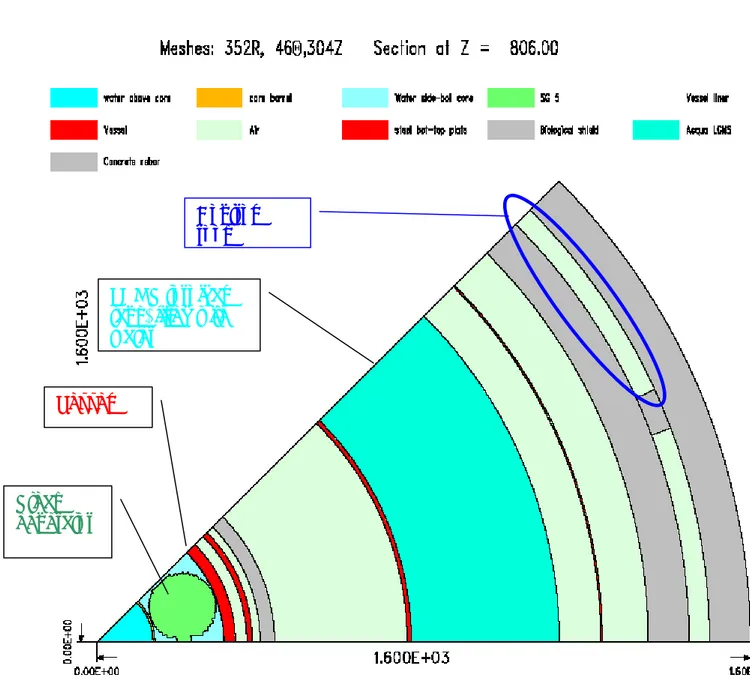
The huge number of meshes forces to reduce the azimuthal extension to 45°, limiting in this way the number of cells to less than 6M. This schematization assures in any case a good description of the whole model, due to the reactor in vessel symmetry based on the presence of 8 steam generators (45° each). The SG inlet pipes that are placed at the centre of each octant can be fully represented in this model (centred at 22.5°). Due to the large opening across the pipe (see Fig. 2), the largest amount of particles travelling towards the Control Room (CR) outflows from this area. On the other hand only half azimuthal extension of the control room is modelled but this is not relevant due to obvious symmetry. Moreover, to limit the cell number, the radial extension of the CR has been reduced to only 50 cm, instead of the real 4 m. This results in a slightly conservative description.
Rebar inside concrete was assumed 3% in volume. This was an arbitrary assumption due to the lack of this information in ENSA drawings. The real situation should consist of a specific rebar percentage in each concrete wall according to its task. Much higher rebar percentage could be used so that also this assumption can be considered conservative. All the concrete walls have 1 m thickness and are composed of a mixture of 97% (vol.) Portland Concrete and 3% steel.
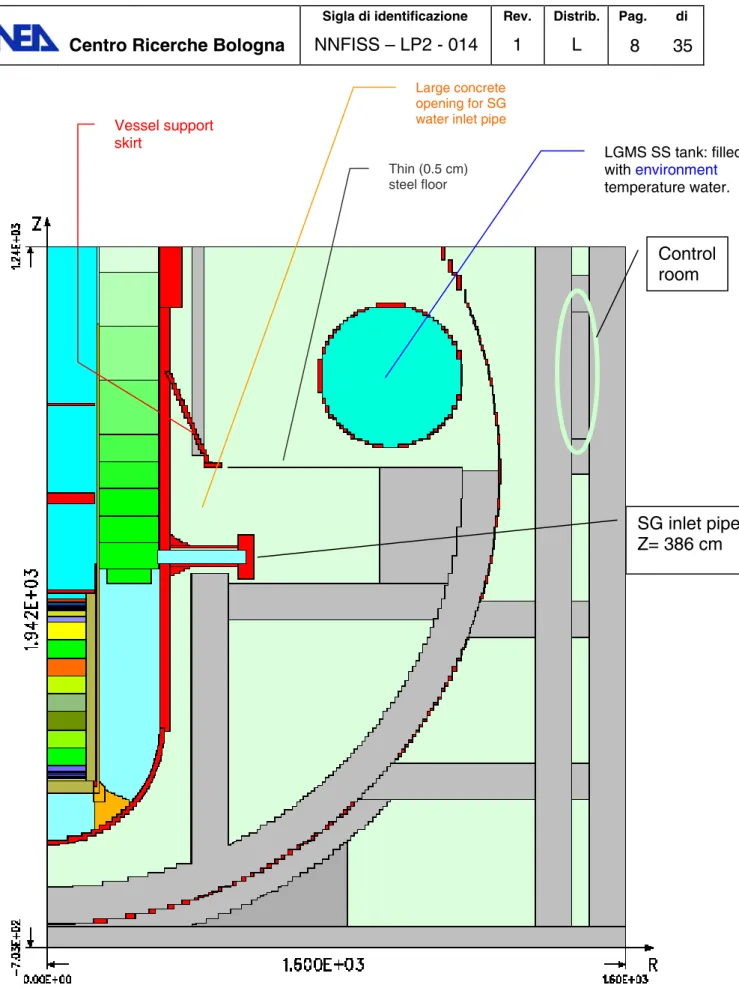
The LGMS tank has a toroidal shape, is made of steel (2 cm thickness) filled with natural water at room temperature. The floor between the LGMS and the first concrete wall (see Fig. 3) is arbitrary assumed as a thin (0.5 cm) steel grid since this information is not available in the ENSA drawings. Also this assumption is probably conservative.
The SG inlet pipe has been described according to the drawings, even if the large flange at its end could be removed during operation. In this case additional pipes have to be positioned in place of it, having probably at least a similar effect on shielding efficiency.
The SG support has been initially modelled as a parallelepiped made of a water and steel mixtures. This approximation has been kept because the possibility of changes in the overall project makes not fruitful a further refinement in the model.
Once fixed the main design solutions of interest, the calculation options and the suitable library to adopt in TORT, the model has been step by step improved by adding more details on the basis of the Ansaldo Drawings [12].
The spatial mesh refinement of the ¼ (r,θ,z) geometry shown in Figs. 1, 2, 3 and 4 consists of 352 (r) x 46 (θ) x 304 (z) = 4922368 cells. By this preliminary model a convergence at 5 10-3 has been reached, with the exception of the 19th gamma energy group(where 10-2 was the best results, § 5). This situation seems to be typical also for other geometrical models and has been checked that it does not affect the overall results being the contribution of the 19th gamma group negligible.
Fig. 1 r-θ cross section at z=806 cm (Control room , 1m from the floor). The CR radial
extension has been shrinked to 50 cm to reduce the cell number. The back wall has been positioned closer to the front one, increasing the contribution of reflected particles.
Control room
LGMS toroidal tank, filled with water
Vessel
Steam generator
Fig. 2 r-θ cross section at z=386 cm, Steam Generator bottom header. The cut allows to see
the SG inlet pipe and the opening through the first concrete to let it in. SG Water
inlet pipe
Concrete blocks
Fig. 3 r-z cross section at θ=22.5°, in the mid of the 45° azimuthal model. The Control room
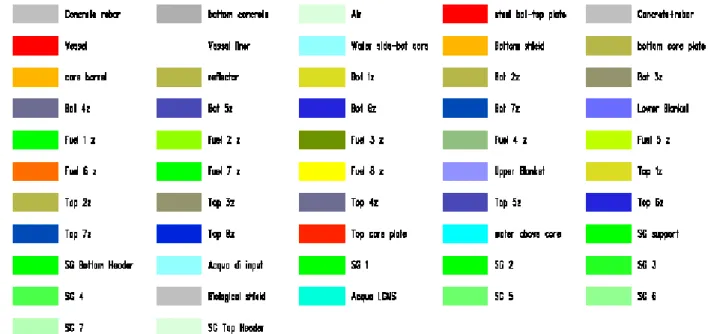
is closed from this side by the wall dividing it from its neighbouring room. See the colour legend in Fig. 3a.
LGMS SS tank: filled with environment temperature water. Large concrete
opening for SG water inlet pipe
Vessel support skirt SG inlet pipe Z= 386 cm Control room Thin (0.5 cm) steel floor
Fig. 3a Colour legend of Fig. 3.
4. Neutron Flux
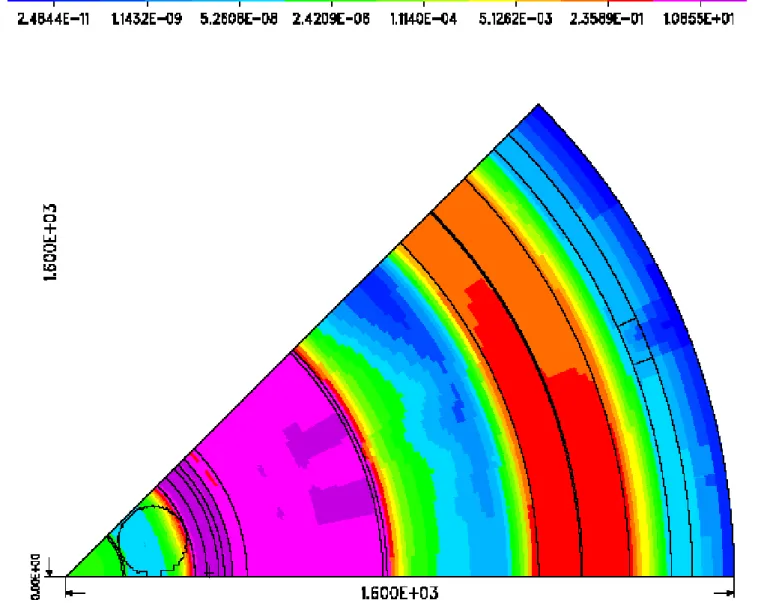
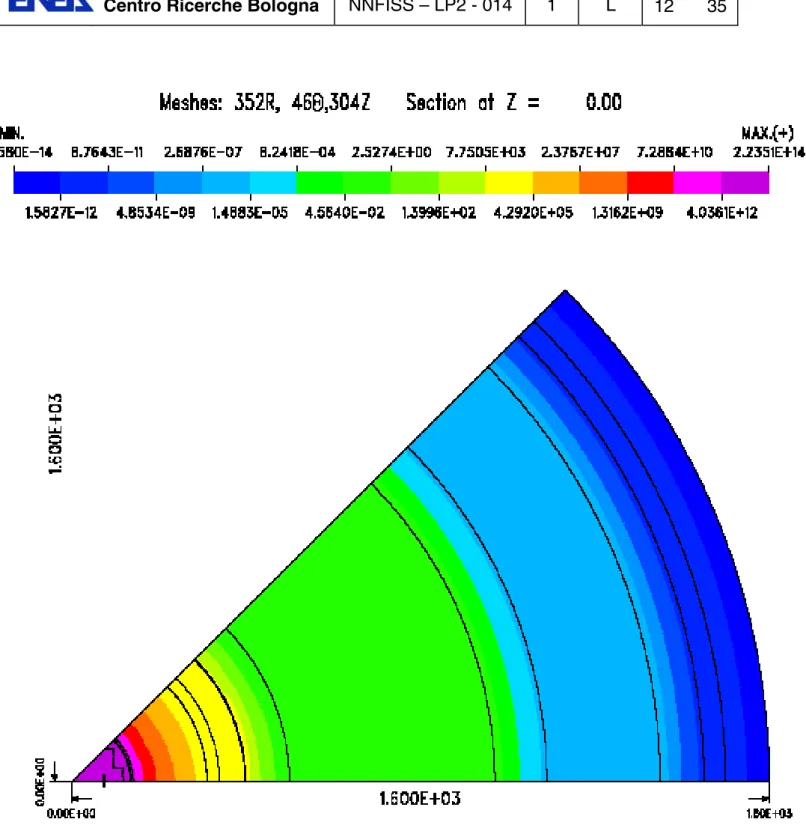
The neutron flux (N/(cm2 s) is plotted in Figs. 4÷10. Different r-θ and r-z cross sections are showed for sake of clarity. Each distribution has its own colour scale. Where not present the colour scale is the same of the preceding figure.
This reactor has the characteristic to host the steam generators inside the vessel, according to the “safe by design” concepts. This solution rule out the possibility of an accident due to the break of the SG-Vessel connection. The result is an increased water volume inside the reactor vessel and consequently a much weaker neutron outflowing quantity with respect to gammas. Its contribution to the overall dose is completely negligible.
Fig. 4 Neutron flux N/(cm2 s) , r-θ overall view at z=806 cm, control room lower part. The
Fig. 5 Neutron flux N/(cm2 s), r-θ overall view at z=380 cm, SG inlet pipe centre. Most of the
flux is outflowing from the concrete opening for the bottom header inlet pipe, showed in the figure.
Fig. 6 Neutron flux N/(cm2 s), r-θ overall view at z=0 cm, reactor core middle. The
Fig. 9 Neutron flux N/(cm**2 s), r-z overall view at θ=22.5°, SG inlet pipe middle. The
colours scale has been chosen in order to outline the neutron flux outcoming from the concrete opening planned for the SG inlet pipe. White zones are overflow if located close to the reactor core or underflow, if located far from it.
Fig. 10 Neutron flux N/(cm**2 s), r-z overall view at Ө=35°, CR middle. The colours scale
has been chosen in order to outline the neutron flux outcoming from the concrete opening planned for the SG inlet pipe. The effect of the opening is still large even at different azimuthal positions.The shielding effect of the LGMS tank is clearly visible, while some particles are slipping in between the floor and the tank.
5. Gamma Flux
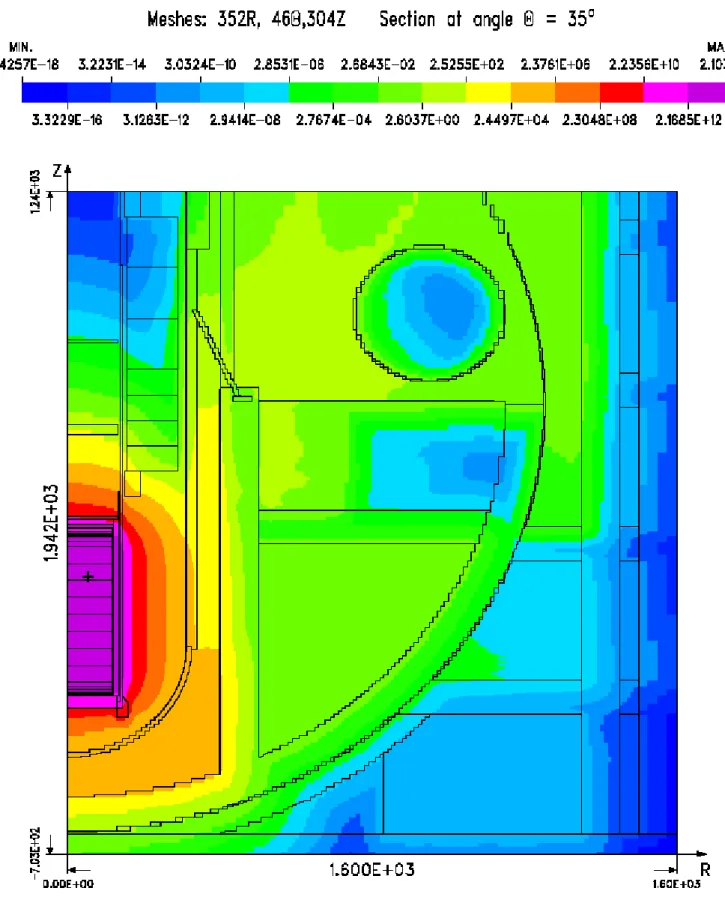
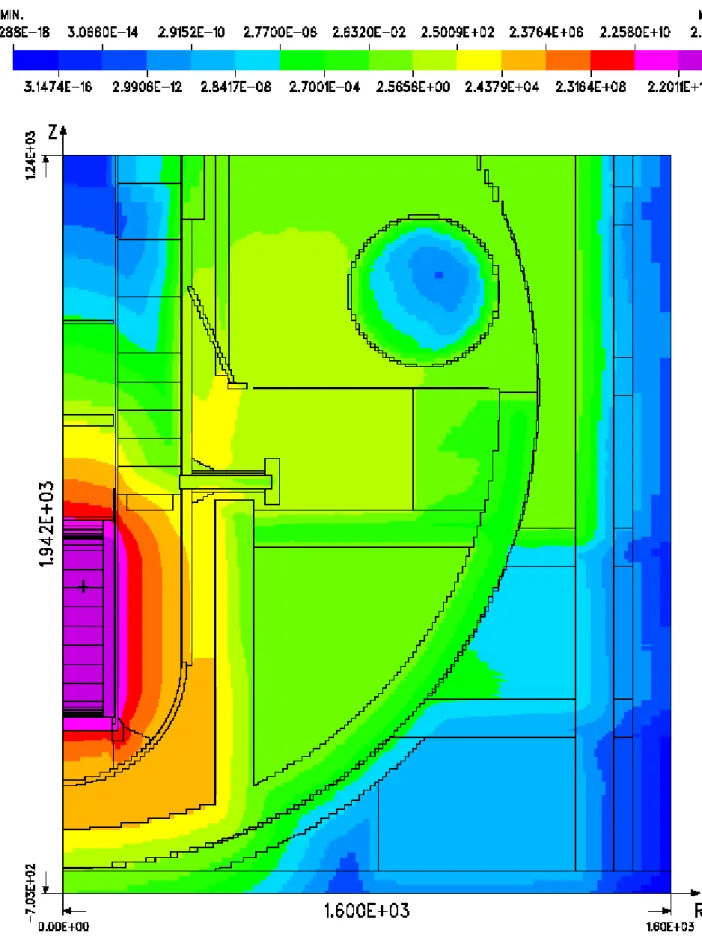
The gamma flux is the leading radiation source and its distribution is more relevant than the neutron’s one. The flux distribution is shown in Figs. 11÷16, with different colour scale, with the aim to outline either the overall distribution or local effects. Figs. 17÷21 show the gamma ray distribution for energy > 4 MeV. Fig. 22 shows the gamma ray spectrum and its evolution while moving through the reactor structures.
Fig. 11 Gamma flux γ/(cm**2 s), r-θ overall view at z=806 cm, control room lower part. The
same colour scale is used in next figures in order to enhance the different value of the gamma flux in the reactor regions.
Fig. 12 Gamma flux γ/(cm**2 s), r-θ overall view at z=386 cm, SG inlet pipe centre. Same
colour scale as in the previous figure.
Fig. 13 Gamma flux γ/(cm**2 s), r-θ overall view at z=0 cm, core middle. Same colour scale
Fig. 14 Gamma flux γ/(cm**2 s), r-z overall view at θ=35°, CR middle. The colours scale has
been chosen in order to outline the gamma flux out coming from the concrete opening planned for the SG inlet pipe. The effect is still large even at different azimuthal positions. The shielding effect of the LGMS tank is clearly visible, while some particles are slipping in between the floor and the tank. Same colour scale as in the previous figure.
Fig. 15 Overall gamma fux. The colour scale is chosen in order to cover all the flux range.
Fig. 16 Gamma flux γ/(cm**2 s), r-z overall view at θ=22.5°, SG inlet pipe middle. The
colour scale has been chosen in order to outline the gamma flux outcoming from the concrete opening planned for the SG inlet pipe.
Fig. 17 Gamma flux γ/(cm**2 s) with energy Eγ>4 MeV. r-θ overall view at z=806 cm, control room lower part. The same colour scale is used in next figures.
Fig. 18 Gamma flux γ/(cm**2 s) with Eγ>4 MeV, r-θ overall view at z=380 cm, SG inlet pipe.
Fig. 21 Gamma flux with Eγ >4 MeV. r-z cross section at θ=22.5°. Same scale as in the previous figure.
Fig. 22 The Gamma spectra at different places along the radial direction on the core
mid-plane. Gamma energy is divided into 20 energy groups, from 100 KeV to 14 MeV
6. In Operation Dose Distribution
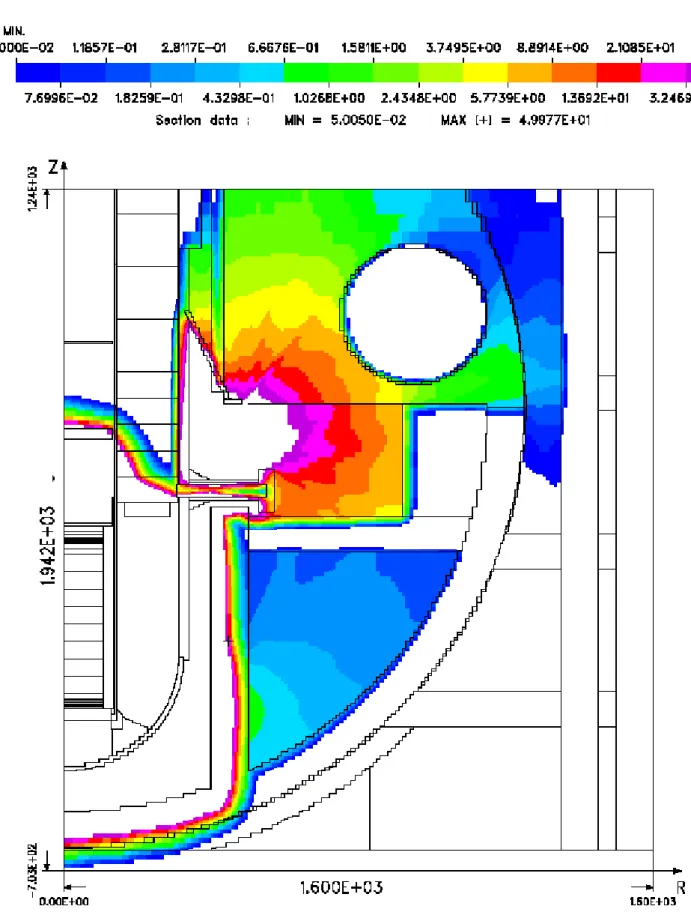
The final aim of this work is to obtain the dose value during operation primarily in the control room. Figs. 23÷26 give the overall dose distribution. In Figs. 27 and 28 only the geometry around the Control rooms is shown in order to have a better quantification of the dose values in that zone. The calculation has been performed using standard tables conversion for the BUGLE96T energy discretization. The maximum value in the control room results to be well below 10-3 μSv/h, with large improvement with respect to both the maximum allowed dose and the project goal.
1,0E-05 1,0E-04 1,0E-03 1,0E-02 1,0E-01 1,0E+00 1,0E+01 1,0E+02 1,0E+03 1,0E+04 1,0E+05 1,0E+06 1,0E+07
1,0E-02 1,0E-01 1,0E+00 1,0E+01 1,0E+02
E (MeV)
cm
-2
s
-1
vessel out first concrete_out containment sphere Building wall
Fig. 29 Dose overall distribution, μSv/h, r-θ section at z=750 cm, control room floor.
Control room, floor heigh
Fig. 30 Enlarged r-z section at θ=30°.
7. Conclusion
The geometrical description of the IRIS reactor is complete including all the main structures and additional stuff. The 45 degrees azimuthal extension is not influencing the results analysis due to intrinsic reactor symmetries.
The limitation on number of meshes, as a consequence of limited computer performances, is again not relevant as geometrical description of fine structures is satisfactory.
The full map of neutron and gamma fluxes has been produced as well the full map of doses during operation, demonstrating the very low dose level expected in control room during operation. Doses in any part of the reactor building can be easily inferred from this work. Even if the IRIS project seems to undergo a deep revision, documentation of the work already done will continue, and modification to the project that will be decided will be included in the model. Next steps will be the comparison with an “optimized” model, i.e. a model with small and no cost effective shielding modification in order to obtain a further decrease of doses in the reactor building and especially in the control room.
8. References
1 M. Ciotti , M. Sarotto, R. Orsi, Deterministic shielding calculations for the IRIS reactor, ENEA(I), ENEA-Bologna/FPN-P9LU-039.
2 R. Orsi, “A General Method to Conserve Mass in Complex Geometry Simulation on Mesh Grids and Its Implementation in BOT3P5.0”, Nuclear Science and Engineering, n. 154, pages 247-259, American Nuclear Society, USA, 2006. 3 R. Orsi, “Potential Enhanced Performances in Radiation Transport Analysis on
Structured Mesh Grids Made Available by BOT3P”, Nuclear Science and Engineering, n.157, pages 110-116, American Nuclear Society, USA, 2007.
4 R. Orsi, “BOT3P Version 5.3: A Pre/Post-Processor System for Transport Analysis”, ENEA (I), ENEA-Bologna/FPN-P9H6-11, Oct.22, 2008 (package available from OECD/NEA Data Bank as NEA-1678/09 BOT3P5.3).
5 W.A. Rhoades, D.B. Simpson, “The TORT Three-dimensional Discrete Ordinate Transport Code”, ORNL/TM-13221, Oak Ridge National Laboratory, Oak Ridge, Tennessee, USA, 1997.
6 J.E. White, D.T. Ingersoll, R.Q. Wright, H.T. Hunter, C.O. Slater, N.M. Greene, R.E. MacFarlane, R.W. Roussin, “Production and Testing of the Revised VITAMIN-B6 Fine-Group and the BUGLE-96 Broad-Group Neutron/Photon Cross-Sections Libraries Derived from ENDF/B-VI.3 Nuclear Data”, ORNL (USA), NUREG/CR-6214, Revision 1, ORNL-6795/R1, (1996).
7 J. K. Tuli, “Nuclear Wallet Cards (6th edition)”, National Nuclear Data Centre, Brookhaven National Library, Upton, New York 11973-5000, USA, 2000.
8 R. Orsi, “ADEFTA Version 4.1: a Program to Calculate the Atomic Densities of a Compositional Model for Transport Analysis”, ENEA (I), ENEA-Bologna/FPN-P9H6-010, May 2008.
9 “MCNPTM – A General Monte Carlo N-Particle transport code”, LA-1309-M, Los Alamos National Laboratory, Los Alamos, New Mexico, 2000.
10 K.W.Burn, “IRIS: Monte Carlo Results for Selected Ex-Core Radiation Responses” , Enea Internal report to be published.
11 ENSA I9219CRQ01, I9219CRQ02, I9219CRQ03, I9219CRQ04, I9219CRQ05, I9219CRQ06, I9219CRQ07, I9219CRQ08, I9219CRQ09, I9219CRQ10, rev.1
12 ANSALDO-IR-DWF-00-000 rev.2 (9th May 2006) ANSALDO IR-DWF-00-001
