Chapter 1
Air Quality in Europe: Today
and Tomorrow
G. Guariso and M. Volta
The last “Air quality in Europe” report by the European Environmental Agency (EEA2015) foresees almostfive millions of years of life lost (YOLL) in the 28 EU Member States due to the high concentrations of PM2.5. YOLLs are an estimate of the average years that a person would have lived if he or she had not died pre-maturely, giving greater weight to deaths at a younger age and lower weight to deaths at an older age. For the 507.4 million inhabitants of EU, this means an average loss of more than 3 days each year.
Furthermore, speaking about the average conditions, for air quality has a limited meaning. The situation is normally worse in highly populated areas where most population lives and, for the same reason, emission of pollutant are higher.
Indeed, the same report, referring to 990 urban monitoring stations in 736 European cities, shows that 202 of them (27.4 %) have exceeded the limit of 35 days above 50lg/m3for PM10 average daily concentrations.
The situation is quite different in different EU Member States (MS) and within each MS. Figure1.1shows for instance the 36-th highest daily mean and the 25 and 75 % percentiles (box limits) in each MS compared to the European limit of 50lg/m3. As we will see in the following chapters, exact links between pollutant concentrations and health impacts are not completely known and thus the limits proposed by the World Health Organization are even stricter than those adopted by EU regulations.
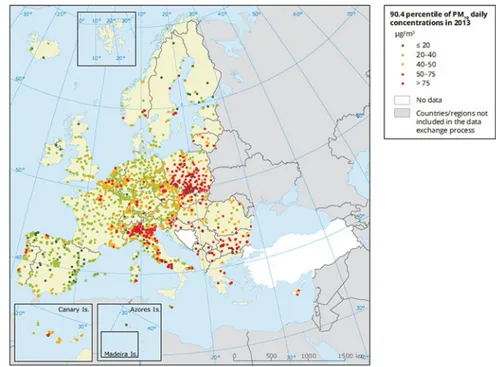
Figure1.2 expresses this situation in geographical terms, showing where the exceedance of the EU limit for PM10 is reported.
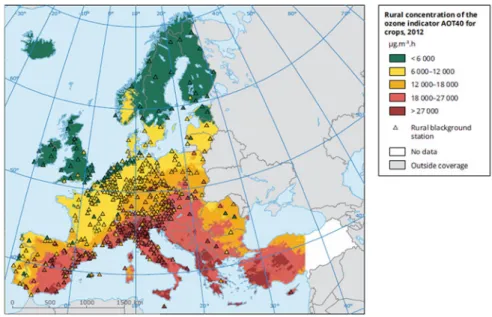
The situation is quite similar for other traditional pollutant such as NOx and only slightly more complex for Ozone, as shown in Fig.1.3.
G. Guariso
Politecnico di Milano, Milan, Italy M. Volta (&)
Università degli Studi di Brescia, Brescia, Italy e-mail: [email protected]
© The Author(s) 2017
G. Guariso and M. Volta (eds.), Air Quality Integrated Assessment, PoliMI SpringerBriefs, DOI 10.1007/978-3-319-33349-6_1
Fig. 1.1 Distributions of the 36-th highest PM10 daily value in EU MS (source EEA2015)
Fig. 1.2 Geographical distribution of the 36-th highest PM10 daily value (source EEA2015)
Ozone forms in the atmosphere due to the interaction of other gases (such as NOx and VOC) and of ultraviolet solar radiation. This process takes time and is therefore naturally distributed by the movement of air masses. This tends to spread high ozone concentrations more evenly (and limits them to southern European countries where solar radiation is stronger).
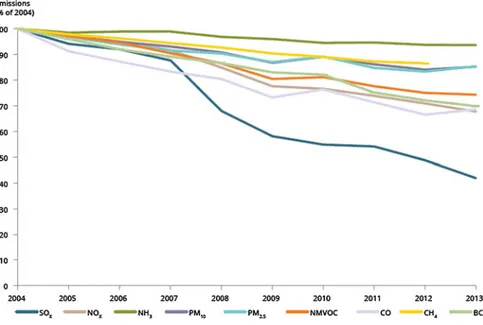
Where this pollution comes from is slightly easier to explain. Many countries have now emission inventories with different level of details that can be aggregated to show the pattern of emission evolution across Europe. A graph showing this evolution for the most common pollutant is shown in Fig.1.4, assuming 2004 emission as 100 %. It clearly appears that sulphur oxides (SOx) have more than halved in ten years and all the other species have also reduced in different per-centages, being black carbon (BC) the least reduced (5 %). This results from a complex set of actions going from the progressive abandonment of coal and oil as fuels to turn to gas, as well as, in the recent years, to the effect of the economic crisis that reduced industrial activities.
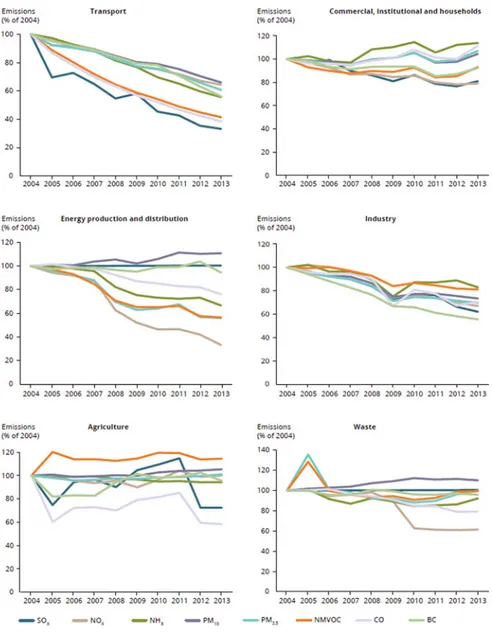
The above emissions decrease has not been uniformly distributed across activity sectors. Figure1.5shows in fact that, while transport and industry have contributed a lot (the emission reduction has reached more than 50 % for transport in 10 years and that of industry is between 20 and 40 % for the different pollutants), households and agriculture have been stationary, if not increasing. The same is true for waste treatment, even if the contribution of this sector to the total emission budget is small, except for CH4. Finally, the contribution of the energy sector is somehow mixed: most pollutants have decreased (NOx, for instance, by more than 70 %)
Fig. 1.3 Geographical distribution of AOT40, an indicator of air quality impacts on crops (source EEA2015)
while others, like primary PM, have slightly increased, possibly because of the increased use of biomass burning.
When talking of a large territory (Europe, a country, a region within a country) the link between the perceived pollution (the concentration, that causes adverse effects) and its causes (the emission) is not straightforward. Two aspects must in fact be considered and play an essential role in defining such a link: the meteo-rology and the chemistry of the atmosphere. Meteometeo-rology obviously determines if a certain emission remains more or less confined in the air above the emission source or is dispersed far away from it. In thefirst case, the concentration may reach very high values, in the second the source contribution may become negligible. Whether in thefirst or in the second case (and in all intermediate situations), it depends on the climate and orography of each specific area. Along the seashores or at the foot of the mountains, there are always breezes that may move the air masses, while there areflat areas where wind speed is always extremely low.
The second aspect is the chemistry of the atmosphere. Most pollutants are indeed reactive and, when entering the atmosphere, they start combining with other components and producing different substances. While for some pollutants, say for instance SO2, such processes can be so slow to be negligible in most cases, for other substances, like NOx or VOC, they take place in time of hours and thus must be accurately considered. For instance, a component more or less relevant of PM (it depends on the local chemistry of the atmosphere) and tropospheric ozone are secondary pollutants, meaning that they are not directly emitted, but formed in the atmosphere due to the specific conditions and the presence of other gases, called
Fig. 1.4 Evolution of EU pollutant emissions through time (2004 = 100 %) (source EEA2015)
“precursors”. Since they represent by far the most dangerous pollutant in EU today, working for their reduction is extremely complex since the problem must be tackled considering a large area and not a single source and that one has to operate on the precursors, knowing that meteorology may alter the picture in different ways.
Given this complex situation, EU has issued a number of directives to define limits concentration on ambient air and indications on how to attain such results. As is apparent from the preamble to Air Quality Directive 2008/50/EC (AQD),
Fig. 1.5 Evolution of pollutant emissions in different sectors (2004 = 100 %) (source EEA2015) 1 Air Quality in Europe: Today and Tomorrow 5
European air quality legislation puts the main emphasis on protecting human health and the environment as a whole and stresses that “it is particularly important to combat emissions of pollutants at source and to identify and implement the most effective emission reduction measures at local, national and Community level.” These basic principles have already been formulated in the former so-called air quality framework directive (96/62/EC) and its daughter directives (1999/30/EC, 2000/69/EC, 2002/3/EC, 2004/1 007/EC).
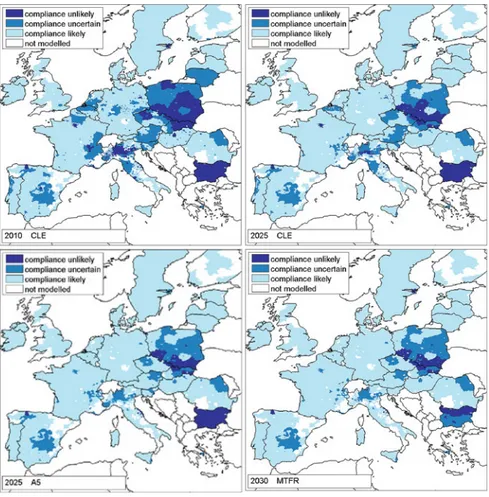
The set of actions foreseen by the current legislation (CLE) is expected to continue the reduction of emissions of the past decade and thus to bring a general improvement for the decade to come. Despite this, some urban areas and some regions will still struggle with severe air quality problems and related health effects. These areas are often characterized by specific environmental and anthropogenic factors and will require ad hoc additional local actions to complement medium and long term national and EU-wide strategies to reach EU air quality objectives. At the same time, these urban areas are among the territories where most energy is con-sumed and most greenhouse gases (GHGs) are emitted. The reviews of the Thematic Strategy on Air Pollution (Amann et al.2011; Kiesewetter et al.2013) have used the European air pollution model GAINS to study the trends of com-pliance evolution from the base year 2010–2025 (assuming current legislation only), the improvement for a 2025 scenario and the further compliance achieved in 2030 by implementing all technical measures (Maximum Technically Feasible emission Reductions, MTFR). The assessment of compliance of the daily PM10 exceedances limit value with respect to the current Ambient Air Quality Directive is shown in Fig.1.6.
Some important observations can be derived from thesefigures.
Comparing the 2010 map with the 2025 CLE case, it clearly appears the move away from a general picture of non-compliance (2010) to few limited remaining areas of non-compliance. European wide measures (already mandated) will deter-mine a significant improvement in compliance especially in the old EU-15 Member States. What is also clear by comparing the 2025 CLE with the 2025 A5 (defined as ‘central policy scenario’) is the limited potential of further EU-wide measures to improve compliance; this is further underlined by the 2030 MTFR scenario, that shows still various areas of uncertain or unlikely compliance even when adopting all the available abatement technologies.
Introducing tougher European-wide measures to address residual non-compliance confined to 10 % of the urban zones in Europe would likely be sig-nificantly more costly than directly addressing these areas with specifically designed measures based on bottom-up Integrated Assessment (IA) approach using regional/local data. In this regard, regional IA software tools such as RIAT (Carnevale et al. 2012), LEAQ (Zachary et al. 2011), etc. with their ability to identify cost-optimised local strategies are already available to quantify the cost-effective split between further European wide measures and regional/local measures. They will inevitablyfind wider application and play an increasing role in these emerging‘discrete islands of non-compliance’.
These observations motivate the growing interest in IA models and tools for local and regional scale. Their importance became apparent again in connection with Article 22 of AQD 2008 “Postponement of attainment deadlines and exemption from the obligation to apply certain limit values” commonly called “notification for time extension”. For both air quality plans and time extension, more elaborated requirements are formulated in Annex XV compared to former regulations. The implementing decision of December 2011 (201 1/850/EU) reflects this, clearly looking at the reporting obligations laid down there (Article 13, Annex II, Section H, I, J and especially K) and looking at the amount of infor-mation that has to be provided regularly (e-reporting has entered full operation mode from January 2014). Finally, “Air quality plans” according to AQD Art. 23 are the strategic element to be developed, with the aim to reliably meet ambient air quality standards in a cost-effective way.
Fig. 1.6 Evolution of PM10 compliance according to GAINS results (source Amann2013) 1 Air Quality in Europe: Today and Tomorrow 7
This growing set of developments and activities required to be framed and organized to allow better understanding of the different approaches in use, to be able to compare their characteristics, and ultimately to suggest how to diffuse best practices and in which direction to move additional research and new software implementations. The ultimate scope of such effort that is briefly summarized in the following chapters is to provide decision-makers in charge of air pollution man-agement with a view of the current European situation and a way of improving their current policies.
Acknowledgments This chapter is partly taken from APPRAISAL Deliverable D2.2 (down-loadable from the project website http://www.appraisal-fp7.eu/site/documentation/deliverables. html).
References
Amann M (ed) (2013) Policy scenarios for the revision of the thematic strategy on air pollution, TSAP Report #10, Version 1.2, IIASA, Laxenburg
Amann M (ed) (2014) Thefinal policy scenarios of the EU Clean Air Policy Package, TSAP Report #11. IIASA, Laxenburg
Amann M, Bertok I, Borken-Kleefeld J, Cofala J, Heyes C, Höglund-Isaksson L, Klimont Z, Nguyen B, Posch M, Rafaj P, Sandler R, Schöpp W, Wagner F, Winiwarter W (2011) Cost-effective control of air quality and greenhouse gases in Europe: modelling and policy applications. Environ Model Softw 26:1489–1501
Carnevale C, Finzi G, Pisoni E, Volta M, Guariso G, Gianfreda R, Maffeis G, Thunis P, White L, Triacchini G (2012) An integrated assessment tool to define effective air quality policies at regional scale. Environ Model Softw 38:306–315
EEA (2015) Air quality in Europe—2015 report. Publications Office of the European Union, Luxembourg
Kiesewetter G, Borken-Kleefeld J, Schöpp W, Heyes C, Bertok I, Thunis P, Bessagnet B, Terrenoire E, Amann M (2013) Modelling compliance with NO2and PM10 air quality limit
values in the GAINS model. TSAP Report #9, IIASA, Laxenburg
Zachary DS, Drouet L, Leopold U, Aleluia Reis L (2011) Trade-offs between energy cost and health impact in a regional coupled energy–air quality model: the LEAQ model. Environ Res Lett 6:1–9
Open AccessThis chapter is distributed under the terms of the Creative Commons Attribution 4.0 International License (http://creativecommons.org/licenses/by/4.0/), which permits use, duplica-tion, adaptaduplica-tion, distribution and reproduction in any medium or format, as long as you give appropriate credit to the original author(s) and the source, provide a link to the Creative Commons license and indicate if changes were made.
The images or other third party material in this chapter are included in the work’s Creative Commons license, unless indicated otherwise in the credit line; if such material is not included in the work’s Creative Commons license and the respective action is not permitted by statutory regulation, users will need to obtain permission from the license holder to duplicate, adapt or reproduce the material.