L
IST OFR
EVISIONSRevision Date Scope of revision Page
TABLE OF CONTENTS
LIST OF REVISIONS ... 2
1 INTRODUCTION ... 4
2 THE TAPIRO REACTOR AND THE EXPERIMENTAL CAMPAIGN ... 5
3 THE TAPIRO MODELS ... 8
3.1 The SERPENT Monte Carlo model ... 9
3.2 The ERANOS deterministic model ... 13
3.3 The MCNP model ... 15
4 RESULTS ... 18
4.1 The SERPENT results ... 18
4.2 The ERANOS results ... 23
4.3 Preliminary sensitivity analysis ... 26
4.4 Reactivity Insertion Results ... 29
5 CONCLUSIONS ... 32
1 Introduction
Among the foundations of a sustainable use of nuclear fission energy certainly there are a reliable fuel cycle and a safe management of radioactive waste. The spent fuel discharged from nuclear power plants constitutes the main contribution to nuclear waste. Most of the hazard from the spent fuel stems from only a few chemical elements such as plutonium and some Minor Actinides (MAs) such as neptunium, americium and curium, plus some long-lived fission products such as iodine and technetium. In this frame, one of the key aspects is the appropriate management of MAs. A technological route to reduce the risks associated with MAs is to transmute them in nuclear systems. However, due to a lack of experimental data, which has meant an absence of precision in MAs nuclear data, it remains difficult to establish a detailed design of transmutation systems with reliable accuracy and the capacity to precisely predict the composition of spent fuel. Several NEA and IAEA Working Groups addressed these issues, in particular recommending integral measurements, complementary to parallel efforts for differential measurements, for the following nuclides of MAs from viewpoints of design of transmutation systems and of fuel cycles: 237Np, 241Am, 242mAm, 243Am, 242Cm, 243Cm, 244Cm and 245Cm.
In the frame of the NEA Expert Group on Integral Experiments for Minor Actinide Management [1] a joint collaboration between ENEA (Italian National Agency for New Technologies, Energy and Sustainable Economic Development) and CEA (French Alternative Energies and Atomic Energy Commission) was established with the aim to study the feasibility of a MAs irradiation campaign in the TAPIRO fast neutron source research reactor, located at the ENEA Casaccia center near Rome [2]. In particular, during the 80’s, in the frame of an agreement between ENEA and SCK/CEN Mol (Belgium), an extensive experimental neutronic characterization of the TAPIRO source reactor was carried-out, and it was found that TAPIRO is able to provide a family of neutron spectra of extremely variable hardness (about pure fission spectrum near the core centre).
In previous works [3, 4] the irradiation, in different TAPIRO irradiation channels, of some CEA samples loaded with different contents of MAs, coming from the French experimental campaigns OSMOSE and AMSTRAMGRAM, was modeled by two different codes (ERANOS, Serpent and MCNP). In parallel, a preliminary analysis of some MAs capture reaction rates sensitivity due to a 2% copper density reduction in the whole TAPIRO reflector was carried out.
Considering that in the evaluation of the approaches to the simulation of nuclear fission systems, integral measurements are of fundamental importance, as they allow to assess the various components adopted in the analysis, like physical models, numerical methods and nuclear data, it was established to launch a new interpretation campaign of the integral measurements obtained during the 80’s TAPIRO experimental characterization above mentioned. The final objective of the activity is to employ the data acquired through the experiments in a nuclear data adjustment procedure [5]; this objective is foreseen to be achieved in two phases. First, the TAPIRO reactor is to be simulated by the Monte Carlo method and by a deterministic approach. The neutronic simulation allows to calculate the reaction rates and therefore, by direct comparison with the measured values, to verify the
suitability of the TAPIRO modelling approach, regarding both the codes and the data libraries. Second, an investigation on the effect of the cross section data used in the prediction of the quantities measured in the experiments is to be performed, as the sensitivity of integral parameters to cross section data is essential to the adjustment formalism.
The present work describes the first part of the activity and focuses on the simulation of the TAPIRO reactor and the experimental campaign using the Monte Carlo and deterministic methods. First, the basic features of the TAPIRO reactor and the nature and scopes of the experimental campaign are summarized. Next, the modelling approach is described, both in relation to the model of the reactor and as regards the representation of the experiment, and some computational results of the model are compared and discussed, using different cross section data libraries. Due to the relevant contribution of copper to the neutronics of this system, the effects of its properties are also preliminarily analyzed. Finally, to complement the preliminary analyses on the irradiation in TAPIRO of some CEA samples, additional evaluations about the reactivity associated with the insertion of some OSMOSE and IRMM samples into different TAPIRO channels are provided.
2 The TAPIRO reactor and the experimental campaign
The TAPIRO (TAratura PIla Rapida Potenza ZerO) reactor (Figure 1) is a fast spectrum research reactor of the Italian National Agency for New Technologies, Energy and Sustainable Economic Development (ENEA) laboratories, located in Casaccia, Italy [2]. The core of the TAPIRO reactor is a square cylinder (diameter about 12 cm). The fuel is made of a highly-enriched uranium-molybdenum alloy (98.5 wt.% U-1.5 wt.% Mo). The maximum operating power is 5 kW, producing a flux of about 41012 n/(cm2s) at the core center. Additional design characteristics are summarised in Table 1.
The irradiation channels (Figure 2) allow to insert devices also in high flux regions. They are enclosed in a metallic jacket and have a reducing section going toward the core to limit the gamma streaming effect. Each channel plug is constituted by a casing filled with shielding material and it is provided with a copper extension placed in the reflector zone. This extension may be modified to host the sample container [2].
All the control rods are made of copper: the shim rods are used to control the nominal power, the regulation rod movement ensures the fine adjustment of the criticality and the safety rods allow the scram. During normal operation, all control rods are inserted. When extracted, they are hosted in a sort of plenum of air in the inner reflector and the remaining void is replaced by about 15 cm of air [6]. The thermal column provides an epithermal flux [2].
In the framework of a collaborative agreement between ENEA and the Studiecentrum voor Kernenergie / Centre d'Etude de l'Energie Nucléaire (SCK•CEN) of Belgium, an experimental campaign was carried out on the TAPIRO reactor from 1980 to 1986
[7]. The objective of the irradiation campaign was to provide a neutronic characterisation of the TAPIRO reactor, which revealed several interesting features of the neutron flux distribution (both spatial and energetic) of the reactor, among which includes a spherical symmetry of the flux with respect to the core centre. As part of the experimental campaign, the reaction rates of different isotopes were measured in all irradiation channels existing in TAPIRO. In this work, we focus on the fission rates of 237Np, 238U and 235U measured along the radial channel 1 by miniature fission chambers (diameter 1.5 mm, length 0.4 mm [7]). The count rates recorded by these devices are compared with the computed results, taking into account the uncertainties of both experimental and computed results.
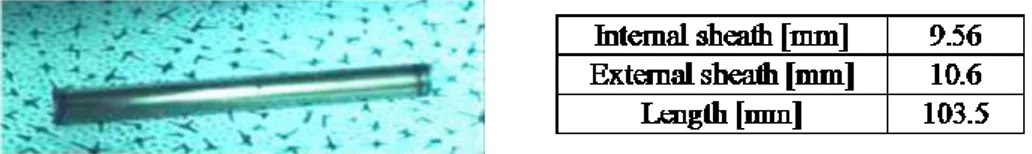
Concerning the subsequent AOSTA irradiation program, two different irradiation devices are intended to be irradiated in TAPIRO: OSMOSE and IRRM [8]. OSMOSE is a cylinder made of a zircaloy sheath ( Fig. 3), containing a pellet formed by a natural uranium dioxide matrix (49.153 g natural UO2), inside which an actinide fraction of 241Am is dispersed (0.2 g of 241Am). IRRM (Fig. 4) is an 241Am oxide pellet in the chemical form of Al2O3, it is inserted in an aluminum cladding 0.3 mm thick. The device is quite small, it is about 1 cm height and it has an external diameter of 8 mm.
Figure 1 - Irradiation facilities of TAPIRO [2]: 1) diametral channel; 2) tangential channel; 3) radial channel 1; 4) radial channel 2; 5) detector channels; 6) paraffin; 7) thermal column.
Table 1 - Characteristics of the TAPIRO reactor [2].
CORE Cylindrical: diameter about 12 cm
Diameter/height: about 1
FUEL Uranium-molybdenum alloy (98.5 wt. % U - 1.5
wt. % Mo)
Density: 18.5 g cm-3 Enrichment: 93.5 % 235U
CLADDING Stainless steel: thickness 0.5 mm
REFLECTOR Cylindrical Inner Reflector: diameter 34.8 cm
Outer Reflector: diameter 80 cm Overall Height: 70 cm
Material: Copper Mass: 2600 kg
COOLING SYSTEM Forced He: 100 g/s @ 7.5 ata
Heat Exchanger \ + Cooling
Core inlet / outlet temperature: 25 °C / 35 °C
BIOLOGICAL SHIELD Shape: near spherical
Thickness: 175 cm
Material: high density borate concrete Density: 3.7 g cm-3
IRRADIATION CHANNELS 3 channels at the reactor mid-plane
1 tangential (to the top edge of the core)
Figure 2 - Section of the reactor parallel to the floor of the reactor room at 100 cm height [1]: 1) source channel; 2) tangential channel; 3) diametral channel; 4) horizontal channel thermal column 1; 5) horizontal channel thermal column 2; 6) thermal column; 7) safety rod 1; 8) regulation rod; 9) shim rod 1; 10) shim rod 2; 11) safety rod 2; 12) radial channel 1; 13) grand horizontal channel; 14) radial channel 2.
Figure 3– OMOSE irradiation device and dimensions
Figure 4- IRRM AmO2 samples for the AOSTA program.
3 The TAPIRO models
In this section, the models adopted to describe the system are presented, together with the approximations introduced to implement them into the computational codes.
3.1 The SERPENT Monte Carlo model
A previously developed model of the TAPIRO reactor [6] that was implemented in the SERPENT Monte Carlo code (version 1.1.19) [9] has been modified in order to describe the configuration of the reactor during the experimental campaign.
The geometry of TAPIRO implemented in the SERPENT model includes: the core, the primary circuit for the core cooling, the inner and outer reflectors (Figure 5) and the diametral channel, the tangential channel and the radial channel 1. The core center corresponds to the center of the frame of reference used in the model. The radial channel 1 is parallel to the x-axis, instead the tangential and diametral channel to the y-axis.
The radial channel 2 and the source channel are not considered, since the work presented does not involve a neutronic characterization of those regions. Instead, within the reflector, these regions are assumed to contain the reflector material, which is the same as that of the plug in the same region. Outside of the reflector, these channels are considered to be part of the biological shield in the model. These approximations are necessary due to limitations of geometry capabilities of the version of the code in use, but are not foreseen to introduce a large error in the representation of the reactor for the experiments, as these regions are neutronically far from the channels in which the measurements are carried out and the channels not involved in the measurements are filled with the plug. The material compositions have been provided by ENEA.
The concrete shield that surrounds the thermal column is simplified in the model with respect to the reality: it consists of a regular parallelepiped. This approximation is acceptable since the region has a negligible neutronic relevance with regard to the experiments [6].
In Table 2, the positions of the control rods during the experiment are reported. Control rod positions are measured relative to the top of the core. The control rod level equal to 15 cm for the shim and regulation rods corresponds to the full insertion of the rod at the height of the top of the core (z 5.55 cm in the reference frame of
the model). The safety rods are inserted at z 4 cm in the reference frame of the
model.
Table 2 - Control rods level in the reference frame of the control rods [7].
Rods type position [cm]
Shim rods 10.0
Regulation rod 9.5
Safety rods 13.4
In Figure 5, an axial section of the model is shown at the position z=1 cm. At that height, the shim rods and the regulation rod are extracted (Table 2), so the channels contain air. The other rods are inserted at that height.
The radial channel 1 (Figure 6) penetrates in the inner reflector and reaches the limit of the biological shielding (220 cm from the core center). To obtain the fission rates
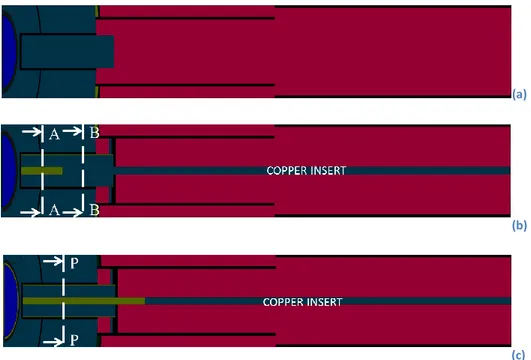
traverse of this channel, a square access groove (0.5 mm side) was bored in the center of the plug for the whole length of the radial channel 1 [7]. In the model (Figure 7a)), the form of the access groove is cylindrical. The fission chamber is placed on a copper insert (Figure 7b)) that covers the half of the access groove cross section: moving the copper insert along the access groove length, the fission chamber can record the fission rate in selected points of measurement.
Figure 5 - A xy-section extended to the outer reflector radius at z=1 cm at the same orientation as in Figure 2 (IR: inner reflector, OR: outer reflector).
(a)
(b)
(c)
Figure 6 - A xy-section of the radial channel 1 at z=0: a) the channel is entirely closed by plug; b) the copper insert is partially extracted in the reflector zone (the detectors are placed in the preceding access groove region); c) the copper insert is extracted to the farthest point of measurement (the detectors are placed in the preceding access groove region starting from plane P). The plane P is at the same position in which the copper insert is placed in b). The materials to which the colors correspond are the same as those labelled in Figure 5.
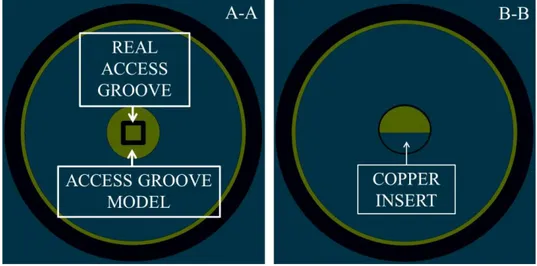
Figure 7 – a) A yz-section of the radial channel 1 at x=18 cm (the position of the plane A in the Figure 6 b)), in which the model of the access groove and the real one are compared. b) A yz-section of the radial channel 1 at x=36 cm (the position of the plane B in the Figure 6 b)), in which the model of the copper insert is shown.
Since the measurement points are different for different isotopes, a simplified approach is adopted (avoiding different Monte Carlo simulations for each point of measurement for all nuclides): the copper insert is placed in a certain position in the radial channel 1, and the detectors are positioned in the preceding void part of the access groove.
The copper insert is moved in two positions: one in the reflector zone and one in the shielding zone. The point in which the copper insert is placed in the reflector zone is decided by examining the results of an exploratory simulation in which the copper insert is placed in the furthest point of measurement among all the nuclides (about 61.5 cm, in the shielding zone, see Figure 6c)). A second simulation is performed moving the copper insert in the place in which the experimental and simulated fission rates start to diverge (about 26.45 cm). Thanks to the displacement of the copper insert, the experimental and simulated results in the first part of the traverse show a better agreement than in the exploratory simulation [9].
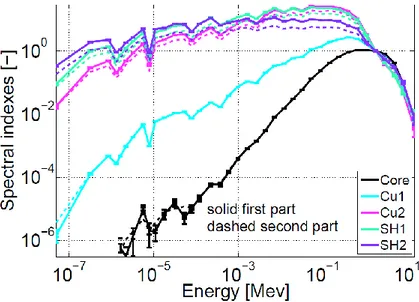
Indeed, the spectrum in the two parts of the traverse (the simulations set-up in Figure 6b) and Figure 6c)) is different, so to approximate the whole traverse with a single simulation introduces a greater error with respect to the approach of splitting the traverse. In Figure 8, the spectral indexes in the different regions of radial channel 1 (Figure 9) are shown. For the purpose of this analysis, the spectral index is defined as 𝐼𝑘𝑓(𝐸𝑔)= 1 Ψ𝑘𝑓 ∫ 𝑑𝑟⃗ 𝑟⃗∈𝑉𝑘 ∫ 𝑑𝐸Φ(𝑟⃗, 𝐸), 𝐸𝑔−1 𝐸𝑔 (1)
which is the scalar flux integrated in space in the region k and in the energy range [Eg; Eg-1], divided by
Ψ𝑘𝑓 = ∫ 𝑑𝑟⃗ 𝑟⃗∈𝑉𝑘 ∫ 𝑑𝐸Φ(𝑟⃗, 𝐸), 𝐸𝑓−1 𝐸𝑓 (2)
which represents the flux integrated in space in the same region k and in a reference energy range [Ef; Ef-1]. A logical choice of the reference energy range for a system in
which the core material is highly-enriched 235U is around the most probable energy at which a neutron is born from fission of that isotope. The energy discretisation adopted for analysis of the spectral indexes in the SERPENT model is consistent with that used by the ERANOS model of TAPIRO.
The simulation mode is the criticality source method: the inactive cycles are 30, the active ones are 2000 to simulate the fission rates distribution in the first part of the traverse, 3500 for the second part: more cycles are necessary since the statistics gets poorer moving away from the core. The number of source neutrons per cycle has been set equal to 2107
. The calculations are performed for the reference simulations employing the JEFF-3.1.1 cross section library [10]; all cross sections are evaluated at 293 K.
Figure 8 - Comparison of the spectral indexes in the different regions between the first and the second part of the traverse.
Figure 9 - Radial discretisation of radial channel 1 in zones on which the flux is integrated.
3.2 The ERANOS deterministic model
The code version used is ERANOS 2.0 [11]. The energy grid is constituted by 38 groups. The model [12] is based on axial-symmetric cylindrical geometry in order to describe accurately the shape of the core and of the reflector (Figure 10). Owing to this choice, the polar asymmetries, such as the radial channel 1, the diametral channel or the different displacement of the control rods, cannot be described.
For the generation of cross sections in the module ECCO, the radial domain is divided into different sections (those indicated in Figure 9) to preserve the spectrum at the height of the center of the core zcore, in correspondence to the radial channel 1.
The spectrum in the core is calculated with the standard cell calculation approach adopted for fissile media, while the surrounding regions are source-injected with a spectrum characteristic of the inner-adjacent region. Materials placed in different sections are considered in different cells. All the materials are treated in the cell definition as homogeneous infinite media. The 237Np, 235U and 238U cross sections are computed as for the other non-fissile materials in the reactor, even if they are not considered in the geometry construction: the fission chambers are so small that no self-shielding is present. As a consequence, it is useless to model exactly the fission chamber in the geometry, since practically no spatial phenomenon is present. Moreover, the fission chambers cannot be modelled in the exact position of the measurements in the radial channel 1, owing to the cylindrical model adopted.
The spectral indexes (Eq. (1)) are presented in Figure 11 in the different regions considered in the ECCO module for the source definition: the spectrum softens gradually moving away from the core (due to the interaction with matter and the greater leakage of fast neutrons with respect to thermal neutrons), as the value of the flux in the thermal and epithermal energy groups becomes of the same order of the source and overcomes it in the region Cu2, SH1 and SH2.
Figure 10 - TAPIRO geometry implemented in ERANOS.
Figure 11 - Spectral indexes in different regions computed in ERANOS.
An analysis of the structure of the energy discretisation is performed, considering the value of the fission rates for the different isotopes. The energy grids are constructed adding to the reference 33-group energy discretisation, usually employed for fast
reactor analysis, a finer discretisation of the lower groups. This is done because the thermal contribution may be relevant for the simulation of the experimental measurements. The 38-group structure is adopted once it is verified that the reaction rates cease to vary by adding further groups.
The dimension of the biological shielding, in particular in the radial direction, is very large with respect to the furthest point of measurements for all the nuclides, therefore it is not necessary to model the real shielding dimension. To select the shielding dimension in the model, an analysis of the dependence of the fission rates of each isotope on the shielding dimension is carried out, identifying an optimal radial and axial thickness of the shielding as 30 cm.
The discretisation of the solid angle is performed applying an S16 approximation. The
tolerance on the flux is set to 10-4, instead the convergence on the effective multiplication eigenvalue keff is reached setting a tolerance of 10-6. The P0 order
approximation is chosen for describing the anisotropy of the scattering. On the upper, lower and outer limits of the biological shielding, the void boundary condition is imposed. Consistent with the SERPENT model, the cross sections are calculated at 293 K. The libraries used are those from JECCOLIB2 [8] (whose data are derived from JEF-2.2 [13]) and are structured according to the ECCO 1968-group, XMAS 172-group and ECCO 33-group configurations. Not all nuclides, in particular copper, are present in the library with finest energy discretisation, which has consequences on the accuracy of the condensation process.
3.3 The MCNP model
The calculations to determine the reactivity variation due to the insertion of OSMOSE and IRRM samples in TAPIRO are performed by means of the MCNP6.1 [15] Monte Carlo transport code.
The model utilized for the analyses is the standard reference model, provided by the reactor management group and exploited also for previous investigations [16]. The research reactor is represented through the possibility of defining geometric regions by user-defined surfaces. Reactor core, reflector and shielding parts are described, as well as all experimental channels of interest: diametrical channel, tangential channel, radial-1 channel. The frame of reference is coherent with the SERPENT model, diametrical channel is along the y axis – being the origin on the axis of the core cylinder – while radial-1 channel is along the positive x axis. Tangential channel is a cylinder parallel to the y axis but its center lays on the first quadrant of the z-x plane (see Fig. 12).
The configuration of the control rods is different from the cases considered in SERPENT and ERANOS simulations. Adopted pattern is the following:
Regulation Rod: 7.5 cm insertion (over total 15 cm) Control Rod 1 and 2: 11 cm insertion (over total 15 cm) Safety Rod 1 and 2: complete insertion (total 15 cm)
An evaluation concerning the reactivity associated with the insertion of some OSMOSE and IRRM samples in the TAPIRO channels has then been performed,
considering the following positions in the standard TAPIRO core configuration (see channels in Fig. 13 and sample locations in Fig. 14 and Fig. 15).
The samples are inserted in the center of the relative channels and the radial space around is filled with air (light blue in Fig. 14 and Fig. 15). The remaining portion of the channel is still the copper of the plug. In fact, the latter is considered inserted up to the sample.
The dimension of the OSMOSE sample allows to host it only in tangential and radial-1 channel (Fig. radial-14) Conversely, IRRM is small enough to be placed also in central part of the diametrical channel (Fig. 15).
The samples are placed as close as possible to the core center:
- OSMOSE samples in Tangential and Radial-1 channels (see Fig. 14) (red circles in Fig. 13);
- IRRM samples in Diametrical, Tangential and Radial-1 channels (see Fig. 15) (blue circles in Fig.13).
(a) Section on z-x plane (b) Section on x-y plane (c) Section on x-y plane (z= 10 cm)
Figure 12: TAPIRO standard configuration
Tangenti al Channel Radial -1 Channel Tangentia l Channel Diametrical Channel Tangenti al Channel
Figure 13: Irradiation channels for reactivity evaluation.
(a) OSMOSE in tangential (b) OSMOSE in radial-1
Figure 14: OSMOSE sample modeling in MCNP.
(a) IRRM in radial-1 (b) IRRM in tangential (c) IRRM in diametrical
(center)
Figure 15: IRRM sample modeling in MCNP.
In particular, the selected samples are the following:
- OSMOSE case: the sample used contains 0.2 grams of 241Am in oxide matrix
4 Results
In this section, computational results are presented and are compared to the measurements obtained from the experiments. The results shown include those of the SERPENT Monte Carlo model, those of the ERANOS deterministic model and, finally, those of a preliminary sensitivity study on the nuclear data libraries and on the effect of the properties of copper.
4.1 The SERPENT results
The experimental fission rates traverses of 237Np, 238U and 235U, measured along the radial channel 1, are compared with the ones computed by the model previously explained adopting some “virtual” detectors: the reactions (whose type has to be selected for a “virtual” material assumed to be the active part of the detector) are scored in a defined volume. This approach does not influence the random walk of the neutrons, since streaming and collisions are determined on the basis of the background material. Therefore, it is possible to compute a fission rate traverse in multiple positions in one simulation, since the virtual detectors do not affect each other. To not model the presence of the fission chamber is not expected to affect the results, since the true dimension of the fission chamber is quite small. The virtual detectors are placed in the exact position of the points of measurement of each isotope.
The dimension of the virtual detectors (Table 3) is much larger than that of the miniature fission chambers in order to obtain acceptable statistics in reasonable computational time. Nevertheless, the geometrical form of the detector is such that the total volume remains contained within the access groove, maximizing the cross section and maintaining the dimension along the axis of the radial channel small relative to the distances over which the greatest variation of the reaction rate occurs. In addition, the access groove has a very small cross section: for the reasons of statistics and computational time, the modelled access groove is larger than the real one. To explore this approximation effect, two access groove models are investigated, varying its dimension. As a consequence, the detector cross section is limited by the access groove dimension, while the dimension along the axis of radial channel 1 (the x-axis) is unchanged. As the approximation of the access groove dimension is rather strong, the effect of modelling the access groove as a cylindrical channel (Figure 7a)) is expected to be negligible with respect to the dimension approximation.
The fission rate distributions of some isotopes are shown to evidence the difference of the results obtained by the two access groove models and comparing them to the experiments. The comparison is made between simulations that adopt the same simulation parameters. In this situation, the relative standard deviation obtained with the large access groove model is lower than with the small access groove model, as the former permits a larger detector volume and therefore better statistics. Data are presented as normalised to the integral along the traverse. The normalisation is necessary, since experimental values are given as count rates, depending on the efficiency of the detection system. Moreover, the normalisation overcomes the problem of selecting the exact power of the reactor maintained during the experiment
and of knowing the exact amount of fissile material in the fission chambers. The uncertainties of all quantities presented, both experimental and computed (regardless of the model of the access groove), are very small.
Table 3 - Characteristics of the virtual detectors and the modelled access groove.
Access groove model Small Large
Detector volume [cm3] 0.10 0.24
x-dimension [cm] 0.12 0.12
y-dimension [cm] 0.91 1.41
z-dimension [cm] 0.91 1.41
Access groove radius [cm] 0.66 1.065
Figure 16 - Comparison of the normalised experimental and computed fission rates of 235U in the first part of the traverse (Fig.4 b)): a) Large Access Groove model (L.A.G.); b) Small Access Groove model (S.A.G.). The zoom shows the error bar (otherwise too small). The radius is along the x-axis.
From the comparison presented in Figure 16 it can been seen that the fission rate distribution of the U-235 in the first part of the traverse does not change so much between the two access groove models. This behaviour is verified also in the second part of the traverse. The agreement of the simulations with the measurements is quite good.
In the second part of the traverse, the 237Np fission rates (Figure 17) computed using the small access groove model decrease faster than those obtained by the large access groove model, departing from the experimental curve. The results of the latter model show good agreement with the measurements in the copper reflector region. It is seen that the experiment shows a different behaviour at great radial distances from the core, where the configuration of the experiment may change, leading to a discrepancy between the results and the experiment in this region. However, outside of the reflector, the results are less relevant for the characterisation of the reactor.
Figure 17 - Comparison of the normalised experimental and computed fission rates of 237Np in the second part of the traverse (Fig.4 c)): a) Large Access Groove model (L.A.G.); b) Small Access Groove model (S.A.G.). The zoom shows the error bar (otherwise too small). The radius is along the x-axis.
Regarding the results of the small access groove model, decreasing the dimension of the access groove implies increasing the quantity of absorbing material around the detector: copper in the reflector region (x<41 cm) and concrete in the shielding region (x>41 cm). As a consequence, more neutrons are absorbed in the energy range in which the 237Np fission cross section is quite high and the fission rate decreases rapidly along the radial channel 1. The 237Np fission rate distribution in the first part of the traverse computed by the small access groove model has a better agreement with the experiments than the results obtained by the large access groove model: since the dimension of the access groove in the former model is closer to the reality, the role of the captures in copper is better described. Instead, the inability to represent the change in behaviour of the fission rate distribution in the second part of the traverse renders more difficult to evaluate the adequacy of the two access groove models on the basis of this comparison.
The 238U fission rate in the second part of the traverse (Figure 18), like in the first part, is a good example in which there is a net improvement through the use of the small access groove model in comparison to the large access groove model. As for 237Np, in the former model there is a relatively larger quantity of absorbing material than in the large access groove model, which leads to a faster decrease of the fission rate along the axis of the channel and a better agreement with the experimental curve.
In general, it is possible to state that the access groove approximation has a greater impact on the fission rates of the isotopes 237Np and 238U, hence the small access groove model is the preferred choice to correctly describe their fission rates. Instead, it may be appropriate to utilise the large access groove model to compute the U-235 fission rates, as the large and small access groove models yield similar results; this allows to save computational time.
In Figure 19, the relative standard deviations of the computed reaction rates obtained by the small access groove model (which is characterised by the worst statistics) are illustrated, comparing them with the relative error on the experimental measurements. It is possible to observe that the magnitudes of the experimental and computed relative standard deviations are comparable, indicating that the input parameters that regulate the statistics are appropriate.
Figure 18 - Comparison of the normalised experimental and computed fission rates of 238U in the second part of the traverse (Fig.4 c)): a) Large Access Groove model (L.A.G.); b) Small Access Groove model (S.A.G.). The zoom shows the error bar (otherwise too small). The radius is along the x-axis.
Figure 19 - Comparison between the relative standard deviation of the computed ( a) and c) ) and measured fission rates ( b) and d) ) in the two parts in which the radial channel 1 has been divided in the simulations: a) and b) refer to the first part of the traverse, c) and d) to the second part.
4.2 The ERANOS results
In this section, the fission rates distribution in the radial channel 1 obtained by the deterministic model are compared with the experiments and the Monte Carlo results. The comparison is among these integral responses normalised to their integral along the traverse, for the same reasons reported in the previous section.
The choice of the spatial grid in the deterministic simulation does not correspond to the measurement points, since it must guarantee a good quality of the results. The normalisation is carried out by a fitting procedure: this is particularly needed for the experimental and SERPENT results.
The fission rate distribution Rf for nuclide i along the traverse is calculated as follows: 𝑅𝑓,𝑖(𝑟𝑗, 𝑧𝑐𝑜𝑟𝑒)= ∑Σ𝑓,𝑖,𝑔(𝑟𝑗)Φ
𝑁𝐺
𝑔=1
(𝑟𝑗, 𝑧𝑐𝑜𝑟𝑒). (1)
The fission cross section f is spatially dependent along the traverse owing to the fact that the neutron spectrum used for the its evaluation may change.
In Figure 20, the agreement between the experimental and computed fission rates by the ERANOS model of the 237Np is good in the first part of the traverse. Approaching the boundary between the shielding and the outer reflector the discrepancy between the two results increases: the slope of the computed results changes near the OR-SH interface, while for the experimental ones the change of slope occurs at a greater distance. Moreover, the deterministic curve decreases faster than the experimental one. A possible cause of the discrepancy could be the limited energy refinement of the library used by ECCO for the condensation process.
A good refinement is necessary for 237Np in the epithermal energy range, owing to the large number of resonances of the fission cross section, which is shown in Figure 21: the difference in the resonance region is apparent between the continuous energy and the discrete energy libraries. A similar explanation can be applied for the comparison on the 238U fission rate distribution (Figure 22), since the energy dependence of the 238U and 237Np fission cross sections is similar.
The 235U fission rate ERANOS-computed curve (Figure 23) decreases faster in the copper reflector region than the experiments. This dissimilarity does not arise in SERPENT simulations. Therefore, it is reasonable to investigate on the different libraries used in SERPENT and ERANOS simulations and, in particular, on the cross section of copper.
As it is possible to see from Figure 24, the treatment of the resonances of the capture cross section in JEF-2.2 is quite inaccurate with respect to JEFF-3.1.1. The overestimation of the resonance values of the capture cross section could lead to more capture of the epithermal neutrons, and then to a lower number of neutrons that slow down to the thermal energy, where the fission cross sections of 235U is quite high. Moreover, the most refined energy library provided as starting library for the energy condensation of natural copper is the XMAS 172-group structure. This leads to a poor treatment of the resonance region of the copper cross section in the ERANOS model, which is already limited by the inaccuracies of the JEF-2.2 library in comparison to the JEFF-3.1.1 library.
Figure 21 - Fission cross section of 237Np, comparing the continuous energy cross section of the JEF-2.2 library [10] and the condensed cross section of the JECCOLIB2 library [8].
Figure 23 - Comparison among the normalised 235U fission rates measured and computed by SERPENT and by ERANOS.
Figure 24 - Capture cross section of copper in JEFF-3.1.1 pointwise library [7] (used in SERPENT simulation), in JEF-2.2 pointwise library [10] (used by JECCOLIB2 library) and in JECCOLIB2 library [8] (used in ECCO). Also shown are the spectral indexes of the flux in the Cu1 and Cu2 zones computed with ERANOS.
4.3 Preliminary sensitivity analysis
The effect of adopting different libraries is explored by the use of the SERPENT model of TAPIRO, in conjunction with two different nuclear data libraries, JEF-2.2 and JEFF-3.1.1. A negligible effect on the neutron spectrum is seen in Figure 25; this is also true when considering the reaction rates. On the other hand, the value of keff
simulations performed using the two libraries in the configuration illustrated in Figure 6c).
Figure 25 - Comparison of the spectral indexes in the different regions obtained from the use of two different libraries in SERPENT: JEFF-3.1.1 and JEF-2.2. The set-up of the two simulations is that illustrated in Fig. 4 c).
Table 4 - The keff values obtained by the SERPENT simulations with two different libraries: JEFF-3.1.1 and JEF-2.2.
JEFF-3.1.1 JEF-2.2
keff 1.00787 1.00874
Relative on keff 4.9E-06 4.9E-06
Relative variation [pcm] - -86.3207
In order to explore the effect of the variation of the copper cross section on the integral responses analysed, a preliminary sensitivity analysis is performed in ERANOS, varying the atomic density in the neighbourhood of its reference value. The response on the fission rate distributions is observed at selected positions, chosen to show the variation of the response behaviour to the modification.
The relative variation of the 238U fission rate as a function of the relative variation of the atomic density of copper (Figure 26) shows a monotonic decreasing trend. Moving away from the core the response is no longer linear, but shows a positive concavity that increases at larger radii (where the fission rates of the two nuclides are smaller): the effect is larger in the negative range of variation of the copper atomic density. The behaviour for 237Np is similar to 238U.
Figure 26 - Relative variation of the 238U fission rate as a function of the relative variation of the atomic density of copper with respect to the reference value at different radii along the radial channel 1.
At the beginning of the traverse, where the neutrons have a higher energy, the 235U fission rate increases if the atomic density of copper increases (Figure 27). In the hard spectrum region the scattering-capture ratio for copper is higher than in the lower part of the spectrum, leading in an increase in the 235U fission rate. Indeed, in this first part of the traverse, the sensitivity of the fission rates to the variation of the atomic density of copper is not very relevant. Gradually the trend reverses and, at radii larger than about 17 cm, the curves begin to decrease: as the spectrum is more thermalised, the copper captures become more important, which leads to a decrease of the 235U fission rate.
In general, the response of the fission rates of the isotopes considered to the copper cross section variation is linear just at the beginning of the radial channel 1, where the spectrum is fast. Consequently, an analysis based on perturbation theory would have a very limited range of validity.
Figure 27 - Relative variation of the 235U fission rate as a function of the relative variation of the atomic density of copper with respect to the reference value at different radii along the radial channel 1.
4.4 Reactivity Insertion Results
The Monte Carlo code MCNP6.1 [15] was employed with JEFF3.1 cross-sections [17]. MCNP6.1 allows three ways of estimating reactivity perturbations:
- In a direct fashion (i.e. the difference between the responses from two calculations, one with the reference configuration, the other with the perturbed configuration).
- In a single calculation with the “PERT” card (employs the first and second order differential operator technique) [18].
- In a single calculation with the “KPERT” card (employs the adjoint flux in a bilinear functional) [19].
Note that in both perturbation approaches, we generated histories in a reference tracking configuration which was halfway (in terms of material atomic densities) between the reference TAPIRO configuration (Tangential and Radial-1 channels filled with copper and Diametrical channel filled with helium) and OSMOSE or IRRM inserted in one of the channels. Simultaneous perturbations were then made one way to the reference TAPIRO configuration and the other way to TAPIRO with OSMOSE or IRRM.
Each approach embodies some difficulties:
- The direct approach is limited by the size of the perturbation – in the AOSTA context it turns out that the change of reactivity when inserting OSMOSE could be calculated in this way whilst the change of reactivity when inserting IRRM could not.
- The differential operator technique assumes that the fundamental mode is not perturbed. It turns out that this assumption is valid for both OSMOSE and IRRM.
- The bilinear weighting method introduces an approximation in the handling of the scattering, although it seems in this problem not to be an issue. More importantly here, statistics are far worse than with the differential operator technique.
The reference value of keff for the TAPIRO configuration was 0.99928 ± 0.00001 (one standard deviation).
OSMOSE
We employed the direct approach for OSMOSE in both the Tangential and Radial-1 channels. In the Tangential channel we verified the direct results with both the “PERT” and “KPERT” algorithms. The results (in terms of keff in pcm with one standard deviation statistical error) are in Table 5:
Table 5: OSMOSE Results for keff in pcm (“Track Ref.” = reference tracking configuration)
Case Tangential channel Radial-1 channel Track Ref. TAPIRO Track Ref. OSMOSE TAPIRO OSMOSE Track Ref. TAPIRO Track Ref. OSMOSE TAPIRO OSMOSE Direct -68 ± 2 -33 ± 1 PERT +33 ± 0 -38 ± 0 -71 ± ~0 KPER T +35.1 ± 1.7 -35.1 ± 1.7 -70.2 ± ~3.4 Note that:
- the results validate the three approaches – OSMOSE is small enough not to alter the fundamental mode (result confirmed also by the KPERT results) and the scattering approximation in KPERT looks to have no impact.
- the errors on the total perturbations are not given by the code and are therefore estimates.
- nearly all (PERT: >99%; KPERT: 98%) of the reactivity change, TAPIRO Changing this copper to air introduces nearly all the negative reactivity.
IRRM
As already mentioned IRRM is too small for the difference between the keff’s of two calculations not to be swamped by the noise. This holds for both the Tangential, Radial-1 and Diametrical channels. Therefore, a perturbation approach is required. Furthermore, it turned out that also the KPERT results were too noisy to give any
the only possibility was with the PERT card:
Firstly, the default output with the PERT card, employed above for OSMOSE, listing the value of keff after applying each perturbation defined in the input, only gives the value of the perturbed keff to the nearest pcm. This is not fine enough for IRRM. Therefore, as an alternative the fission production rate was tallied with the track length estimator in each of the five fuel zones of the TAPIRO core plus in the single americium oxide zone of IRRM. Then the PERT option allows the differential change in the unperturbed tally to be output.
Although each TAPIRO fuel zone consists of a number of geometric cells, the total was requested over all the cells containing the same material. Thus a total of 6 results (5 TAPIRO fuel zones + IRRM AmO2) were output for each of the 3 cell perturbations of IRRM in the Tangential and Radial-1 channels (Am/Cu, clad/Cu and void/Cu cells) or for each of the 2 cell perturbations of IRRM in the Diametrical channel (Am/He and clad/He cells), for each of the 2 perturbations: reference
gives a total of 36 results, each with their correctly estimated error, for IRRM in the Tangential and Radial-1 channels and 24 results, each with their correctly estimated error, for IRRM in the Diametrical channel. The results must then be summed for each channel to provide the final perturbation result. The estimated error was not available on these sums.
The small size of IRRM meant that the statistical error remained non-negligible, even after using substantial computer resources (see acknowledgement). Therefore, it was desired to provide a correctly estimated error on all the sums so as to have the final results with their proper error. To this end, MCNP6 was patched in an ad hoc fashion. error) in Table 6 were generated with this patched MCNP6.1 version.
Table 6: IRRM Results for keff in pcm (“Track Ref.” = reference tracking configuration)
Case Tangential channel Radial-1 channel Track Ref. TAPIRO Track Ref. IRRM TAPIRO IRRM Track Ref. TAPIRO Track Ref. IRRM TAPIRO IRRM PER T +0.323 ± 3.3% -0.341 ± 3.1% -0.664 ± 3.1% +0.463 ± 2.5% -0.472 ± 2.5% -0.935 ± 2.4%
Case Diametrical channel Track Ref. TAPIRO Track Ref. IRRM TAPIRO IRRM PER T -0.0398 ± 16.1% +0.0387 ± 16.5% +0.0785 ± 16.2% Note that:
- we assume that IRRM in the diametrical channel, due to its very small size, does not perturb the fundamental mode.
- for the Tangential and Radial-1 channels, > 98% and ~95% respectively of the reactivity change is due to the air around IRRM. (Changing this copper to air introduces nearly all the negative reactivity.) Instead in the Diametrical channel, this zone remains unperturbed (there is helium in TAPIRO in the Diametrical channel at the reactor centre). Instead the americium oxide of IRRM is responsible for approximately 10 times the reactivity change compared with the cladding (and of course the two perturbations have a different sign).
- the greater reactivity perturbation of IRRM in the Radial-1 channel compared with the Tangential channel, reversing the OSMOSE results, is due to geometrical effects (length of OSMOSE compared to IRRM and geometry of the two channels).
In view of the low reactivity levels obtained in these preliminary evaluations for the IRMM sample, the possibility could be considered to stack several sample together to increase the total Am mass.
5 Conclusions
The Monte Carlo SERPENT code and the deterministic code ERANOS are adopted for the simulation of the TAPIRO reactor and the reconstruction of some measured quantities. The reaction rates measured in one experimental channel are compared to simulation results. The analysis allows to evidence the effects connected to the adoption of different modelling approaches and different nuclear data libraries.
The discrepancies in the results indicate that nuclear data should be improved. In particular, the copper properties have a relevant effect on the neutronics of this system. The improvement of the knowledge of the properties of copper is of relevance also in other fields where this element plays an important role, such as applications in fusion technology. The same applies for actinides data, the relevance of which is highly important in advanced nuclear systems.
Concerning calculations aimed at determining the reactivity effect related to the insertion of the OSMOSE and IRRM samples inside the TAPIRO reactor for the AOSTA experimental campaign, the results provide results that confirm no impact on multiplication characteristic of the system, the only impact is a slight reduction in reactivity caused by the absence of a portion of the copper reflector, substituted by the sample in which the absorption contribution is more relevant than the multiplication.
In the prosecution of the work, a thorough sensitivity analysis will be performed and a proposal for new measurements for the improvement of cross section data are foreseen.
Acknowledgements
The authors wish to acknowledge Kenneth W. Burn for his collaboration in production of the results and for the guidance and experience in MCNP and Monte Carlo methods.
The computing resources and the related technical support used for the MCNP calculations have been provided by CRESCO/ENEAGRID High Performance Computing infrastructure and its staff [20]. CRESCO/ENEAGRID High Performance Computing infrastructure is funded by ENEA, the Italian National Agency for New Technologies, Energy and Sustainable Economic Development and by Italian and European research programs, see http://www.cresco.enea.it/english for information.
6 List of References
1. Nuclear Energy Agency website, Expert Group on Integral Experiments for Minor Actinide Management section: https://www.oecd-nea.org/science/ma/ 2. ENEA, Italian National Agency for New Technology, Energy and Sustainable
Economic Development website, TAPIRO Research Reactor section:
http://www.enea.it/en/research-development/documents/nuclear-fission/tapiro-eng-pdf 3. C. Bethaz, F. Boccia, M. Carta, P. Console Camprini, V. Fabrizio, O. Fiorani, A.
Gandini, A. Grossi, V. Peluso, P. Ravetto, A. Santagata, “TAPIRO: feasibility study of minor actinides irradiation campaign.”, ENEA Report ADPFISS-LP2-083 (September 2015).
4. D. Caron, M. Carta, S. Dulla, V. Fabrizio, A. Grossi, V. Peluso, P. Ravetto, “Assessment of a cross section adjustment formalism using experimental data from the TAPIRO reactor”, ENEA Report ADPFISS-LP2-116 (September 2016). 5. Y. Ronen, Uncertainty analysis, CRC Press, Boca Raton (2000).
6. C. Bethaz, “Feasibility analysis on irradiation of actinides in TAPIRO fast reactor with Monte Carlo methods”, Master's thesis, Politecnico di Torino, Italy (2015). 7. A. Fabry, P. Moioli, M. Angelone, M. Carta, G. Rosi, A. Di Modugno, R. Scafe,
D. Antonini, E. D. Mcgarry, P. D'Hondt, F. Cops, G. Minsart, J. Lacroix, H. Aït Abderrahim, G. Deleeuw, and D. Langela, “Neutronic characterization of the TAPIRO fast-neutron source reactor,” Final report, SCK-CEN, Mol (1986). 8. M. Carta et al., “Feasibility study of the AOSTA experimental campaign”,
WONDER 2015: Fourth International Workshop on Nuclear Data Evaluation for Reactor Applications, 5-8 October 2015, Aix-en-Provence (France). EPJ Web of Conferences 111, 07003 (2016). ISBN: 978-2-7598-1970
9. J. Leppänen, “Development of a new Monte Carlo reactor physics code”, Ph.D. thesis, VTT Technical Research Centre of Finland, Finland (2007).
10. O. Dicuonzo, V. Fabrizio, D. Caron, S. Dulla, M. Carta, P. Ravetto, “Computational Analysis of TAPIRO Experiments by the SERPENT and ERANOS Codes”, M&C 2017 - International Conference on Mathematics & Computational Methods Applied to Nuclear Science & Engineering, Jeju, Korea, April 16-20, 2017.
11. A. Santamarina, D. Bernard, P. Blaise, M. Coste, A. Courcelle, T. Huynh, C. Jouanne, P. Leconte, O. Litaize, S. Mengelle, G. Noguère, J.-M. Ruggiéri, O. Sérot, J. Tommasi, C. Vaglio, and J.-F. Vidal, “The JEFF-3.1.1 nuclear data library (JEFF report 22)”, Tech. Rep. NEA No. 6807, Nuclear Energy Agency, Paris (2009).
12. G. Rimpault, D. Plisson, J. Tommasi, R. Jacqmin, J.-M. Rieunier, D. Verrier, and D. Biron, “The ERANOS code and data system for fast reactor neutronic analyses”, International Conference PHYSOR 2002, Seoul, Korea (2002). 13. P. Blaise, M. Carta, S. Dulla, V. Fabrizio, A. Gandini, B. Geslot, A. Grossi, V.
improve minor actinides nuclear data”, 14th Information Exchange Meeting on Actinide and Fission Product Partitioning and Transmutation, San Diego, CA (2016).
14. OECD/NEA, “The JEF-2.2 nuclear data library (JEFF report 17)”, Tech. rep., Nuclear Energy Agency, Paris (2000).
15. “MCNP6TM User’s Manual, Version 1.0”, Denise B. Pelowitz (ed.), LA-CP-13-00634, Rev. 0, May 2013
16. M. Carta, P. Console Camprini, V. Fabrizio, O. Fiorani, A. Grossi, V. Peluso, A. Santagata, F. Boccia, A. Gandini, C. Bethaz, P. Ravetto, “TAPIRO: feasibility study of minor actinides irradiation campaign”, ENEA Technical Report, ADPFISS-LP2-083, PAR2015, (2016)
17. “The JEFF-3.1 Nuclear Data Library, JEFF Report 21”, Arjan Koning, Robin Forrest, Mark Kellett, Robert Mills, Hans Henriksson, Yolanda Rugama (eds.), NEA No. 6190, OECD 2006 (ISBN 92-64-02314-3)
18. J. A. Favorite , “On the Accuracy of the Differential Operator Monte Carlo Perturbation Method for Eigenvalue Problems,” Trans. of the American Nuclear Society, 101, 460-462, LA-UR-09-4207 (2009)
19. B. C. Kiedrowski, F. B. Brown, P. P.H. Wilson, “Adjoint-Weighted Tallies for k-Eigenvalue Calculations with Continuous-Energy Monte Carlo”, Nucl. Sci. Eng. 168, 38-50, 2011, LA-UR-10-01824, (2010)
20. G. Ponti et al., Proc. of the 2014 International Conference on High Performance Computing and Simulation, HPCS 2014, 1030
![Figure 1 - Irradiation facilities of TAPIRO [2]: 1) diametral channel; 2) tangential channel; 3) radial channel 1; 4) radial channel 2; 5) detector channels; 6) paraffin; 7) thermal column](https://thumb-eu.123doks.com/thumbv2/123dokorg/5608321.68045/6.892.248.643.586.912/figure-irradiation-facilities-diametral-tangential-detector-channels-paraffin.webp)
![Table 1 - Characteristics of the TAPIRO reactor [2].](https://thumb-eu.123doks.com/thumbv2/123dokorg/5608321.68045/7.892.98.796.170.958/table-characteristics-tapiro-reactor.webp)