University of Calabria
Ph.D. in Molecular Bio-pathology
(Disciplinary Field BIO18-Genetics)
Nuclear and Mitochondrial Genetic Risk Factors
in Frontotemporal Dementia
Candidate Supervisors
Teresa Longo Prof. Giuseppina Rose
Prof. Amalia C. Bruni
Co-ordinator
TABLE OF CONTENTS
SOMMARIO ... ....I SUMMARY ...III LIST OF ABBREVIATIONS ...V -1- INTRODUCTION ...1 1.1. Frontotemporal Dementia (FTD) ...1 1.2. Pathological hallmarks...4 1.3. Genetics Factors...6 1.3.1. TAU gene ...6 1.3.2. APOE gene ...111.3.3. MtDNA and neurodegenerative disorders...13
-2- AIMS OF THE STUDY ...23
-3- MtDNA inherited variability in FTD ...25
3.1. Subjects and methods...25
3.1.1 Sample...25
3.1.2 Analysis of mtDNA variability...29
3.1.3. Statistical analysis...33
-4- RESULTS AND DISCUSSION...35
4.1. Comment to the published paper ...35
4.2. Haplogroups analysis ...36
4.3. HVS-I analysis...37
4.4. Sub-haplogroups analysis...38
-5- CONCLUDING REMARKS...42
SOMMARIO
La Demenza Frontotemporale (FTD) rappresenta, dopo la Malattia di Alzheimer, la forma più comune di demenza degenerativa primaria e costituisce pertanto un importante problema a livello sociale ed economico. Le caratteristiche cliniche salienti della FTD sono le alterazioni del comportamento e/o i disturbi del linguaggio determinati da una degenerazione focale del SNC a livello dei lobi frontale e/o temporale. La patologia può presentarsi in forma sporadica oppure può mostrare aggregazione familiare, o, raramente, si può osservare un modello di eredità autosomico dominante.
La FTD, è una sindrome complessa che presenta quadri clinici e neuropatologici estremamente eterogenei che spesso si sovrappongono ad altri disordini neurodegenerativi. Tale eterogeneità fenotipica, dovuta in parte ad una eterogeneità genetica, costituisce uno dei maggiori problemi nella identificazione dei fattori genetici coinvolti nella sua patogenesi.
Obiettivo del presente studio è stato quello di analizzare la possibile associazione tra la FTD e la variabilità di due geni nucleari, TAU e APOE e del genoma mitocondriale (mtDNA).
Per superare le difficoltà relative alla eterogeneità della FTD, il nostro studio si è incentrato su una attenta selezione dei casi (pazienti FTD) e dei controlli , reclutati in una popolazione geneticamente omogenea (Calabria) e su una rigorosa applicazione di criteri diagnostici internazionali.
Sono stati dunque analizzati 114 pazienti con FTD, di cui 68 sporadici and 46 familiari, e un gruppo di 180 controlli.
I dati ottenuti dalla nostra analisi hanno dimostrato l’assenza di associazione significativa fra aplotipi H1/H2 del gene TAU e la FTD. Al contrario, lo studio della variabilità del gene APOE nella suscettibilità alla FTD ha stabilito che l’allele ε4 costituisce fattore genetico di rischio per la FTD (O.R.= 2.68 with 95% CI=1.51–4.76; p=0.001), mentre l’allele ε2 costituisce fattore di protezione (O.R.= 0.28 with 95% CI =0.12–0.66; p=0.003). Inoltre, è risultato che l’aplotipo H1 del gene TAU può aumentare l’effetto protettivo conferito dall’allele ε2 (O.R.= 0.31 with 95% CI = 0.13–0.73; p=0.007). I risultati di questo studio sono già stati oggetto di pubblicazione (Bernardi et al., 2006). Un breve
commento al lavoro pubblicato è stato inserito nella sezione “Results and Discussion” a pag. 35. Copia del lavoro è stata inserita nella “End Section” del presente manoscritto. Nella seconda parte del nostro studio, abbiamo voluto investigare se la variabilità ereditaria del DNA mitocondriale (aplogruppi/sotto-aplogruppi) fosse associata alla FTD.
Dalla suddetta analisi non è emersa nessuna differenza statisticamente significativa nella distribuzione delle frequenze degli aplogruppi/sotto-aplogruppi del mtDNA tra pazienti FTD sporadici o familiari e controlli.
Tuttavia, questi risultati non escludono che un aplotipo del mtDNA possa influenzare la suscettibilità alla FTD. Infatti, sebbene il nostro campione sia, a nostra conoscenza, il più numeroso finora analizzato, non possiamo comunque escludere che la dimensione del campione sia insufficiente nel rivelare un aplotipo raro responsabile delle ipotetiche differenze.
Nel complesso, i risultati conseguiti nel presente studio possono essere riassunti come segue:
i) La variabilità del gene APOE è associata alla FTD, confermando un ruolo generale di tale variabilità nelle patologie neurodegenerative;
ii) La FTD, sia nella forma sporadica che in quella familiare, si presenta senza un coinvolgimento della variabilità del gene TAU.
iii) La variabilità ereditaria del mtDNA non risulta associata alla FTD, per lo meno nella popolazione Calabrese.
SUMMARY
Frontotemporal dementia (FTD) is the second most common form of degenerative dementia after Alzheimer’s Disease (AD) thus having an important impact on socio-economic level. The clinical hallmarks of FTD are behaviour and/or language dysfunction caused by a focal degeneration mainly affecting the frontal and temporal brain regions. The disease can be sporadic or showing a familial aggregation, or, more rarely, presenting with an autosomal dominant pattern of inheritance. Characteristic of the disease is a phenotypic complexity which often shows overlapping features with other neurodegenerative diseases. The phenotypic heterogeneity, which is at least in part due to genetic heterogeneity, is the major cause of the difficulties in disentangling genetic factors affecting susceptibility to FTD.
Aim of the present study was to explore the association between FTD and variability of two nuclear genes, TAU and APOE, and of the mitochondrial genome. To overcome the problems of FTD heterogeneity, we paid a special attention to the recruitment of the cases (as well as of the controls) who were collected in a genetically homogeneous population (Calabria, southern Italy) and with a strict application of international diagnostic criteria. A total of 114 FTD cases (68 sporadic and 46 familial) plus 180 controls were analysed The study failed to reveal association between TAU haplotypes (H1 and H2) and FTD. On the contrary, we found that APOE ε4 allele increased FTD risk (O.R.= 2.68 with 95% CI=1.51–4.76; p=0.001), while a protective effect was associated with the APOE ε2 allele (O.R.= 0.28 with 95% CI =0.12–0.66; p=0.003). Moreover, the protective effect of ε2 was increased by the H1 haplotype (O.R.= 0.31 with 95% CI = 0.13–0.73; p=0.007). Results of this part of the study have been already published (Bernardi et al., 2006). A brief comment to the paper is shown in the “Results and Discussion” section at page 35 and the reprint is annexed in the “End Section” of the present manuscript.
In the second part of the study, we evaluated whether mtDNA inherited variability (haplogroups/sub-haplogroups) was associated with FTD. No statistically significant difference in the frequency distributions of mtDNA haplogroups/sub-haplogroups was found between sporadic or familial FTD patients and controls. However, the results do not exclude that a rare haplotype could affect susceptibility to FTD. Really, although the
sample we analyzed is, at our knowledge, one of the greatest screened till now, we cannot exclude that the sample size could be unable to reveal a rare mtDNA type responsible for hypothetical differences.
On the whole, results we pursued in the present study can be summarized as follows. i) APOE variability is associated with FTD, and this confirms a general role of APOE
variability in neurodegenerative diseases;
ii) Both sporadic and familial FTD can occur without involvement of TAU variability; iii) MtDNA inherited variability is not associated with FTD, at least in the Calabrian
LIST OF ABBREVIATIONS
AD Alzheimer’s Disease
APOE Apolipoprotein-E gene
ApoE Apolipoprotein-E gene product
ATP Adenosine Triphosphate
bp base pair
CR Control Region
D-loop Displacement loop
FTD Frontotemporal Dementia
FTD-MND Frontotemporal lobar degeneration with motor neuron disease
FTDP-17 Frontotemporal dementia with parkinsonism linked to chromosome 17
Hg haplogroup
HVS hypervariable segment
MAPT Microtubule-Associated Protein tau gene
mtDNA mitochondrial DNA
nDNA nuclear DNA
NFTS Neurofibrillary Tangles
NINCDS-ADRDA
National Institute of Neurological and Communicative Disorders and Stroke and Alzheimer’s Disease and Related Disorders Association Work Group
nt nucleotide
OXPHOS Oxidative Phosphorylation
PCR Polymerase Chain Reaction
PD Parkinson’s disease
rCRS revised Cambridge Reference Sequence
RFLP Restriction fragment lenght polymorphism
ROS Reactive Oxygen Species
SE Standard Error
1.INTRODUCTION
Advances in medicine and improvements in nutrition have contributed to increase lifespan of human populations across the world, but a consistent prevalence of age-related cognitive disorders and dementing illnesses paralleled such an increase. Indeed, common neurodegenerative disorders affect million of people and represent a considerable drain of health-care resources (Mayeux , 2003).
The most common cause of dementia is Alzheimer’s Disease (AD) which involves deterioration of cognitive functioning with prominent impairment in memory. Frontotemporal Dementia (FTD) is another frequent cause of dementia, which is characterized by behavioural disorders as well as cognition.
1.1 Frontotemporal Dementia (FTD)
Frontotemporal dementia (FTD) is a primary neurodegenerative dementia, meaning that a gradual loss of neurons is responsible for the progressive brain dysfunction. FTD is the second most common form of presenile dementia after AD (Dermaut et al., 2005), accounting for approximatively 20% of cases (Knopman et al., 1990; Talbot, 1997).
The hallmark of FTD is a gradual, progressive decline in behavior and/or language caused by a focal degeneration mainly affecting the frontal and temporal brain regions, (Lund & Manchester Groups, 1994; Neary et al., 1998; McKhann et al., 2001; Lee et al., 2001), (Fig. 1).
Fig.1. Brain of a patient with frontotemporal dementia showing atrophy of the frontal and anterior temporal lobes (Neary et al., 2005).
From a clinical point of view there is an early change in personal and social behaviour with relatively preservation of memory often associated with disinhibition. FTD patients also display a language deterioration that progresses to mutism.
The clinical features can be complicated by neurological signs, such as motor neuron signs and/or parkinsonism (Sjogren & Wallin, 2001).
The onset of FTD symptoms typically occurs in the middle years of life (45–65 years); nevertheless it has been seen before 30 and later than 80 years of age (Snowden et al., 1996; Ratnavalli et al., 2002; Rosso et al., 2003). FTD occurs equally in men and women and the average duration of the disease has been estimated in about 8 years (Snowden et al., 2002).
The majority of FTD cases are sporadic, however, a positive family history is present in approximately 10%-50% of patients (Knopman et al., 1990; Stevens et al., 1998; Houlden et al., 1999; Rizzu et al., 1999; Morris et al., 2001; Poorkaj et al., 2001). Only a subset of familial cases exhibits an autosomal dominant pattern of inheritance (Chow et al., 1999; Poorkaj et al., 2001).
Diagnosis is generally made according to international criteria that allow to differentiate among different types of dementia and is based on clinicopathological features, namely, peculiar clinical profiles in combination with characteristic brain lesions (Graeber et al., 1997; Forstl, 1999; Duckett & Stern, 1999; McKhann et al., 2001).
Due to a great variability in the clinical phenotype, FTD often mimics other dementing disorders; as a result, FTD has been frequently misdiagnosed primarily with Alzheimer’s Disease (AD) (Neary et al., 1988; Brun & Gustafson, 1999).
The distinction between AD and FTD can be difficult, especially in presenile cases, which often have an atypical presentation; moreover, the NINCDS-ADRDA criteria (McKhann et al., 1984), widely utilized for Alzheimer Disease (AD), do not accurately differentiate FTD. Clinical diagnostic criteria, introduced by the Lund-Manchester group (Brun et al., 1994), and following revisions (Foster et al., 1997; McKhann et al., 2001) have been established for FTD; consequently, starting from the past decade, FTD has been increasingly recognized.
The combination of clinical observations, neurological examination, neuropsychological tests, information gained from laboratory investigations and morphological and functional brain imaging (e.g.CT, MRI, SPECT) are necessary to achieve accuracy of clinical
diagnosis. Finally, the diagnosis of FTD should be based on neuropathological examination, that only definitively differentiates from other types of dementia.
Several classification systems for FTD have been proposed and an increasing number of disorders and phenotypes has been included into FTD. Based on recent criteria (McKhann et al., 2001), FTD corresponds to a broad dementing syndrome comprising a group of related conditions sharing many clinical features and resulting from progressive degeneration of the temporal and frontal lobes of the brain.
These related phenotypes include Pick’s disease (PiD), frontotemporal lobar degeneration (FTLD), frontotemporal lobar degeneration with motor neuron disease (FTD-MND), corticobasal degeneration (CBD), progressive supranuclear palsy (PSP), frontotemporal dementia with parkinsonism linked to chromosome 17 (FTDP-17), and neurofibrillary tangle dementia (Brun et al., 1994; McKhann et al., 2001).
1.2 Pathological hallmarks
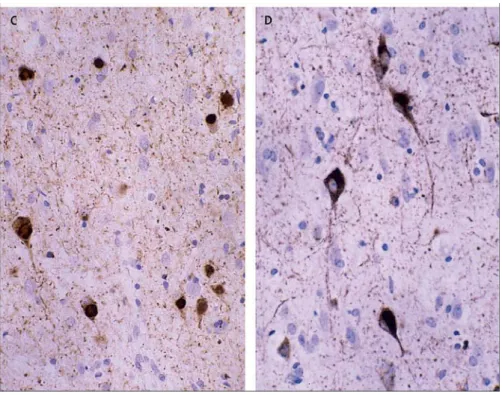
FTD presents with different neuropathological abnormalities (Lund & Manchester Group, 1994; McKhann et al., 2001). Although some findings are specific to one or two of the FTD subtypes, there is a general profile of FTD brain pathology that includes macroscopically atrophy or shrinkage of the frontal and temporal lobes. At microscopic level neuronal loss, gliosis, spongiosis and cellular inclusions are present. For instance, affected neurons frequently display intracellular inclusions, named neurofibrillary tangles (NFTs), primarily composed of hyperphosphorylated tau protein (Spillantini et al., 2000) (Fig. 2).
Fig 2. Neurofibrillary tangles in patient with frontotemporal dementia and parkinsonism associated with chromosome 17 (FTDP-17) (Neary et al., 2005)
However, based on immunohistochemical staining and the pattern of intracellular inclusions, three predominant patterns of histopathological changes have been recognized (Brun, 1987; Mann et al., 1993; Neary et al., 1993; Hodges et al., 2004) and can be summarized as follows:
¾ Tau-immunopositive neuronal inclusions sometimes associated with balloned neurons and/or argentophilic Pick bodies.
¾ Tau-negative, ubiquitin-positive inclusions and evidence of motor neuron disease (MND-type)
¾ No tau- or ubiquitin-positive intraneuronal inclusions or pathology (Dementia lacking distinctive histology, DLDH)
Furthermore, a very recent study showed that, in absence of tau pathology, neuronal inclusions can be composed of hyperphosphorylated, ubiquitinated and cleaved form of TAR DNA binding protein (TDP43) (Neumann et al., 2006).
Nevertheless, there is no correlation between a particular clinical phenotype and the underlying histological changes (Hodges et al., 2004; Taniguchi et al., 2004). As an example, Grimes et al (1999) described a patient with the typical clinical features of Cortico Basal Degeneration (CBD) and the histological features of FTD-MND.
In addition, a significant heterogeneity among clinical and neuropathological patterns exists and a coexistence of Pick’s disease and CBD has also been reported within the same family (Bugiani et al., 1999).
The great clinical and neuropathological heterogeneity suggests the existence of several genetic factors underlying or modifying the pathogenesis of this prevalent and untreatable disorder.
1.3 Genetic factors
The occurrence of a family history of FTD in about 10%-50% of cases suggests a genetic background underlying the aetiology of this disease.
However, the genetic contribution to FTD has been identified only in a small fraction of the cases. A subset of autosomal dominant FTD cases presenting with parkinsonism has been linked to chromosome 17 (FTDP-17) (Wilhelmsen et al., 1994) and pathogenic mutations in the gene coding for microtubule-associated-protein tau (TAU gene) have been identified segregating with FTDP-17 (Clark et al 1998; Hutton et al., 1998; Poorkaj et al., 1998; Spillantini et al., 1998)
1.3.1 TAU gene
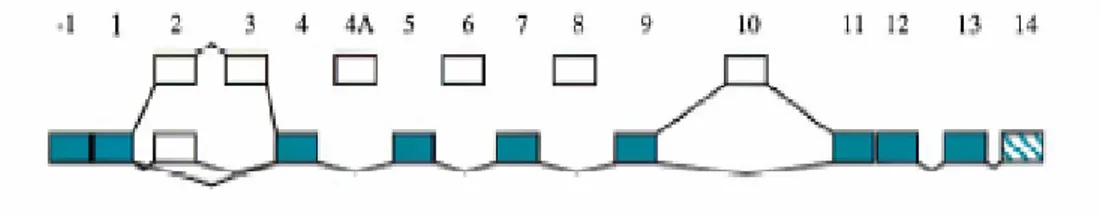
The human TAU gene or Microtubule-Associated-Protein tau gene (MAPT) (OMIM, NM 016841) is located at chromosome 17q21-22 (Hutton et al., 1998) where it spans over 100 kb and contains 16 exons (Andreadis et al., 1992) (Fig.3).
Fig. 3. Schematic representation of the TAU gene. Alternatively spliced exons 2,3 and 10 are shown above
the constitutive exons. Exons 4A, 6 and 8 are generally not spliced into human tau mRNA and most transcripts retain the intron between exons 13 and 14 (van Slegtenhorst et al., 2000).
Tau protein
Tau is one of the most abundant axonal microtubule (MT)-associated proteins having a major role in both assembly of tubulin into microtubules and stability of microtubules (Garcia & Cleveland, 2001).
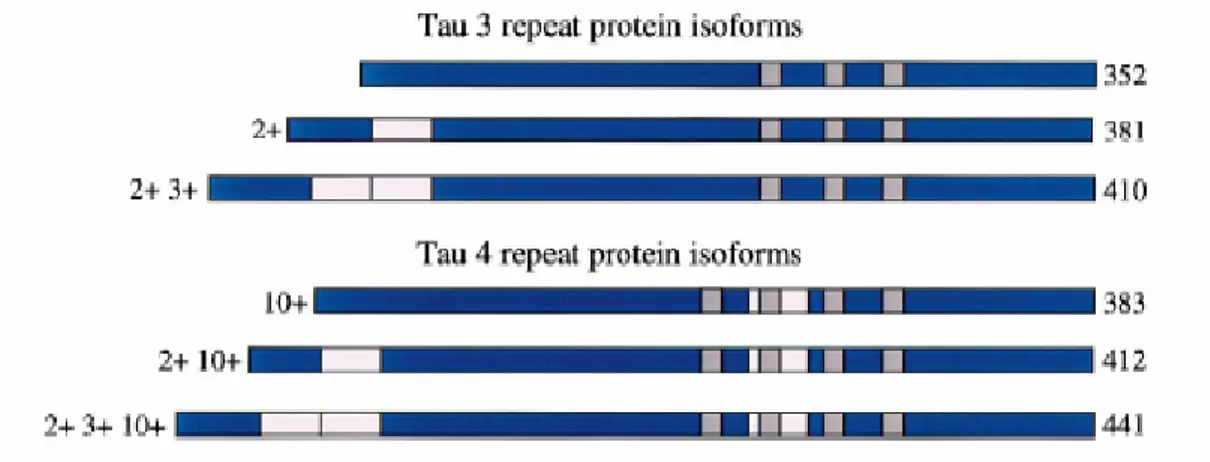
Exons 2, 3 and 10 of the TAU gene are alternatively spliced yielding to six different tau mRNAs corresponding to six different protein isoforms ranging from 48 to 67 kDa (Goedert et al., 1989; van Slegtenhorst et al., 2000). In particular, the alternative splicing of exon 10 generates tau isoforms containing either threebinding repeat domains (3R; exon
10-) or four binding repeat domains (4R; exon 10+) of 31 or 32 amino acids at the C-terminus (Goedert & Jakes, 1990; van Slegtenhorst et al., 2000). These repeats constitute the microtubule binding domains of the protein (Goedert et al., 1989) (Fig.4). TAU exon 10 splicing is also developmentally regulated, so that only 3R tau is present in human fetal brain, while the 3R/4R ratio is approximately 1/1 in adult brain (Goedert et al., 1989). Moreover, alternative splicing of exons 2 and 3 leads to the absence (0N) or presence(1N and 2N) of inserts of 29 residues or 58 residues close to the N-terminus of tau proteins (van Slegtenhorst et al., 2000). Thus the longest tau isoform of 441 residues has four repeats and two inserts, while the shortest isoform of 352 residues has three repeats and no insert (Fig. 4). Finally, TAU exon 4A is alternatively spliced yielding to other tau isoforms in peripheral neurons, as well as in other non-brain tissues (Goedert et al., 1992; Ingelsson et al., 1996).
Fig. 4. The six tau protein isoforms in human brain. Alternatively spliced exons 2, 3 and 10 (pink boxes).
Exon 9–12 encode microtubule binding repeats (grey boxes). Alternative splicing of exon 10 gives rise to Tau isoforms with 4 binding repeats (4R; exon 10 +) or 3 binding repeats (3R; exon 10-) (van Slegtenhorst et. al., 2000).
All six tau protein isoforms are required for normal axonal function, with microtubule binding being regulated by a number of binding repeats and phosphorylation state of the protein (Buée et al., 2000; Forman et al., 2000; Lee et al., 2001).
TAU gene mutations
To date, two categories of TAU gene mutations have been described (Lee et al., 2001; Ingram & Spillantini, 2002).
• Splice site mutations (intron 10 close to the 5’ splice site) altering the alternative splicing.
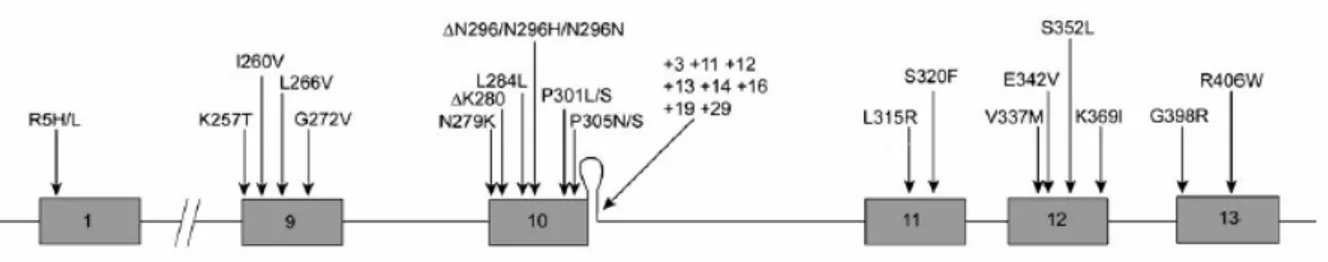
Missense mutations, located within or around the microtubule binding domains, alter binding properties of the tau protein leading to microtubule destabilization and increase of cytosolic tau. Splice site mutations alter the splicing of exon 10 thus producing an increase in the levels of 4R tau isoforms and affecting the 3R:4R ratio (Fig. 5).
Fig. 5 Mutations in the TAU gene associated with FTDP-17. Exons 1 and 9–13 of the TAU gene are
shown with their mutations. A predicted stem-loop structure in the pre-mRNA, found at the boundary between exon 10 and the following intron, is also shown. Twenty missense mutations, two deletion mutations, two silent mutations, and eight intronic mutations are shown (Brandt et al., 2005).
Potential pathogenic mechanisms of TAU mutations
Analysis of TAU gene mutations showed a variety of effects on the biology and function of the protein, and several molecular mechanisms might explain tau-mediated neuronal cell death (Hutton et al., 1998; Spillantini et al., 1998b; Lee et al., 2001).
Interestingly, almost all mutations are clustered in the known functional region or the C-terminus of the protein (exon 9-13) (Goedert et al. 1998) and can affect both the affinity of tau for microtubules and the binding capacity (Hong et al., 1998).
One potential pathogenic mechanism is a “loss-of-function” effect: tau regulates microtubule dynamics improperly, leading to under- or overstabilized microtubules that cannot perform their normal essential cellular functions thus leading to cell death. A second potential pathogenic effect of these mutations is a “gain-of-toxic function”: tau dissociates from microtubles and aggregates into abnormal, cytotoxic neurofibrillary tangles.
Furthermore, some TAU gene mutations may have a double pathogenic mechanism: tau dissociates from microtubules and aggregates into abnormal neurofibrillary tangles. The
sequestration of tau into these aggregates results in tau decrease, leading to over-active microtubles that cannot perform their essential functions, thus leading to cell death (Fig. 6).
Fig. 6. Three possible pathways of tau-mediated neuronal cell death.
Pathway 1— Loss-of-function model: tau misfunction, yielding to microtubules misregulation and destabilization,
severely impinges the intraneuronal transport system leading to cell death.
Pathway 2— Gain-of-function model: tau dissociates from microtubules and tends to polymerise into insoluble,
cytotoxic neurofibrillary tangles (NFT).
Pathway 3—This model incorporates elements of Pathways 1 and 2: This double pathogenic mechanism involves
initially a reduction of tau to bind microtubules and subsequently an increasing tendency of the unbound tau to form insoluble filaments (Feinstein et al., 2005).
The presence of various mutations and different pathogenic mechanisms might explain the existence of the wide range of clinical and neuropathological features observed in FTD. Nevertheless, although some TAU mutations show similar phenotypes, in many cases clinical heterogeneity is observed also when the same TAU mutation occurs, suggesting that additional genetic or epigenetic factors influence the phenotypic manifestations of FTD (van Swieten et al., 1999; Reed et al., 2001; Bird et al., 1999; Bugiani et al., 1999).
Thus, although alteration in TAU are sufficient to cause neurodegeneration, the causal link between tau molecule and clinical symptoms is not yet clear.
On the whole, the discovery of mutations in TAU gene has been helpful to shed light on FTD and other neurodegenerative diseases named “tauopathies” (e.g. AD; PSP; CBD). However, although TAU gene likely represents the first and most obvious candidate in the puzzle of FTD genetics, the frequency of TAU-gene mutations is low in the whole FTD case records (Houlden et al., 1999a; Froelich Fabre et al., 2001). Furthermore, in FTD cases with autosomal dominant inheritance patterns, TAU mutations account for 7%-50% of the cases (Rosso et al., 2002; Hutton et al., 1998; Morris et al. 2001). The absence of
TAU mutations or abnormality in the tau protein in many familial FTD and in the majority
of sporadic FTD cases clearly indicates that other causes exist for the development of FTD (Tolnay et al., 2002).
Currently, efforts are focused on identifying other genes and risk factors implicated in FTD pathological phenotypes.
TAU Haplotypes
In addition to mutations, a series of polymorphisms, which are in complete linkage disequilibrium, have been described in the TAU gene, mostly inherited as two distinct haplotypes designated H1 and H2 (Baker et al., 1999).
Genetic association studies showed that the H1H1 TAU genotype has a greater frequency in patients showing corticobasal degeneration (CBD) or progressive supranuclear palsy (PSP) than in control subjects, thus suggesting that this genotype may increase susceptibility to these neurodegenerative disorders (Baker et al., 1999; Verpillat et al., 2002). The mechanism for this association is not clear because TAU risk haplotype (H1) is also common in the general population. In fact, association studies in different populations showed conflicting results (Hughes et al., 2003; Morris et al., 2002; Verpillat et al., 2002a; Sobrido et al., 2003).
Furthermore, a recent meta-analysis showed that H1 haplotype is also frequently associated with Parkinson’s Disease (PD) (Healy et al., 2004) thus suggesting common and uncharacterized tau-related pathogenic mechanisms shared by PD and FTD.
Other genetic factors involved in FTD.
FTD is a genetically heterogeneous disease and genetic linkage to other chromosomes have been described in addition to linkage to chromosome 17.
In particular, a syndrome of FTD coupled with familial amyotrophic lateral sclerosis (ALS) has been linked to chromosomes 9, even if no gene mutation in this candidate region has been identified yet (Hosler et al., 2000; Wilhelmsen et al., 2004).
Moreover, linkage to chromosome 3p11–12 has been reported in a Danish family showing FTD with frontotemporal atrophy, neuronal loss, and gliosis (Brown et al., 1995). Unexpectedly, the recent finding that mutations in the gene coding for Charged Multivesicular Body Protein 2B (CHMBP2B) on chromosome 3 cause FTD (Skibinski et al., 2005) provides a link between dysfunction in endosomal trafficking or lysosomal activity and neuronal degeneration.
Interestingly, recent reports (Baker et al., 2006; Cruts et al., 2006) showed that some cases of FTD are caused by mutations in progranulin (PGRN) gene on chromosome 17, which encodes for a widely expressed secreted glycoprotein involved in development, wound repair, inflammation and neuronal survival. FTD patients lacking tau-pathology and with
PGRN gene mutations showed neuronal inclusions of ubiquitinated TDP43 (Neumann et
al., 2006).
In a large Italian kindred segregating FTD, in which ambiguous linkage to the 17q21 locus and absence of TAU gene mutations were reported (Curcio et al., 2002), a PGRN gene mutation has been recently identified as cause of FTD (personal communication).
1.3.2 APOE gene
Following the identification of TAU gene mutations in familial forms of FTD, there was an increasing interest on genetic factors that may predispose to the disease.
The human Apolipoprotein E gene (APOE) emerged as the major genetic susceptibility factor for AD in many populations (Kamboh, 2004) accounting for approximately half of late onset familial and sporadic AD cases (Corder et al., 1993; Kehoe et al., 1999). Furthermore, it has been suggested that the APOE polymorphism may contribute, with different alleles, to increase the risk of other neurodegenerative disorders such as PD and FTD (Smith J.D., 2000; Verpillat et al., 2002a).
The APOE gene (OMIM, NM 107741) is located on the long arm of chromosome 19, in the 19q13.2 region, where it spans over 3.7 kb. The gene contains 4 exons and encodes for a 34 kDa glycoprotein (apoE) of 299 amino acid. The major function of the protein is to redistribute lipids and to participate to cholesterol homeostasis.
The three common alleles of APOE locus, termed ε2, ε3 and ε4, have frequencies of 7-8%, 77-78% and 14-16%, in the Caucasian population, respectively. These alleles encode the apoE protein isoforms E2, E3, E4.
ApoE protein
ApoE plays a fundamental role in lipid binding and transport function for normal lipid homeostasis, in the maintenance and repair of injured neurons, maintaining synapto-dendritic connections, and scavenging toxins (Rocchi et al., 2003). It is synthesized mainly by liver, neurons and astrocytes in the brain, and also by macrophages and monocytes (Siest et al., 1995). ApoE synthesis in the Central Nervous System (CNS) increases dramatically after injury (Weisgraber & Mahley, 1996).
The three apoE protein isoforms differ for aminoacids in position 112 or 158, where E3 contains cysteine and arginine (Cys-112 and Arg-158), E2 contains cysteine (Cys-112 and Cys-158) and E4 arginine in both positions (Arg-112 and Arg-158). These small differences cause significant differences in the three dimensional structure and functional properties of the protein (Mahley, 2000).
The three apoE isoforms have specific properties and differ in their ability to carry out critical functions of the apoE: E3 and E2 are effective in maintaining and repairing neuronal cells; conversely, E4 is less efficient in this process (Michikawa et al., 2000). Additionally, the amino acid substitutions in E4, result in a structure that causes this isoform to bind preferentially very low density lipoproteins (VLDL), while E3 and E2 bind preferentially high-density lipoproteins (HDL) (Beffert et al., 1998).
On the whole, the differences among the three apoE isoforms have special relevance in several diseases, such as cardiovascular disease, and in a variety of neurodegenerative disorders including AD, Lewy Body Disease and frontal lobe dementia (for a review: Kamboh et al., 2004). Insights on the role of apoE isoforms in neuropathology came from
in vitro studies demonstrating that the E2 and E3 isoforms bind more readily tau, as
decreases neuronal extension and branching, and inhibits the ability of tau to stabilize microtubules thus inducing their collapse in vitro (DeMattos, 1998). However, the molecular interaction between apoE and tau molecules, and consequent damage to the neuronal cytoskeleton, remains to be clarified.
The APOE gene has been proposed as possible risk factor also for FTD. However, contrastant results have been presented for association between APOE and FTD. Some studies showed an increase of ε4 allele frequency in FTD and dose effect on age at onset (Farrer et al., 1995; Stevens et al., 1997), whereas other studies failed to replicate the results (Minthon et al., 1997; Geschwind et al., 1998; Houlden et al., 1999b).
A meta-analysis on all published data detected a significant increase of ε2-allele frequency in FTD patients (Verpillat et al. 2002b).
Moreover, few studies reported an interaction between TAU haplotypes and APOE gene in FTD. Ingelson and colleagues demonstrated, in a group of FTD sporadic patients, that H1 haplotype in combination with APOE ε4 allele increased the risk of FTD (Ingelson et al., 2001). Also the interactive effect between H1 haplotype and APOE ε2 allele has been reported to increase the risk of FTD (Verpillat et al., 2002b).
1.3.3 MtDNA and neurodegenerative disorders.
Several lines of evidence suggest that mitochondrial dysfunction may play an important role in the pathogenesis of common neurodegenerative diseases with multifactorial aetiology. It is indeed recognized that mitochondrial defects contribute to the pathogenesis of both AD and PD (Bonilla et al., 1999; Leonard et al., 2000). Mitochondria, which are cytoplasmic and semi-autonomously functioning organelles, have a fundamental role in cellular energy metabolism. This includes, among others, the fatty acid β-oxidation, the citric acid cycle and the oxidative phosphorylation (OXPHOS), the essential respiratory pathway for adenosine triphosphate (ATP) production.
As mitochondria are the major site of energy production in the cell, generating approximately 90% of cellular ATP (Wallace, 1997), it is not surprising that an energy dependant tissue such as brain may be affected by mitochondrial dysfunction.
OXPHOS
The mitochondrial respiratory chain involves a group of five enzyme complexes (I–V) situated on the inner mitochondrial membrane. Each complex is composed by multiple subunits, the largest being complex I with 46 polypeptide components. The function of complexes I–IV is the electron (e-) transfer that generates the proton gradient across the inner mitochondrial membrane; this proton flow is harnessed by complex V to synthesise ATP from adenosine diphosphate (ADP) and inorganic phosphate (Fig.7).
Fig. 7: Schematic diagram of the respiratory chain.
Electrons are passed down the chain and protons are pumped from the matrix to the space between the inner and outer mitochondrial membranes. This creates an electrochemical gradient (membrane potential) which drives ATP production via ATPase (complex V) (Chinnery & Schon, 2003).
mtDNA
Mitochondria have their own DNA and the respiratory chain subunits of the OXPHOS system are encoded both by nuclear and mitochondrial genome (mtDNA) which is present in hundreds to thousands of copies in every cell.
Human mtDNA is a small circular double-stranded molecule, 16,569 base pairs (bp) in length, that codes for 13 subunits of the oxidative phosphorylation system and includes 7 of the 46 polypeptides of complex I (NADH dehydrogenase), 1 of the 11 polypeptides of
complex III, 3 of the 13 polypeptides of complex IV (cytochrome c oxidase), and 2 of the 16 proteins of complex V (ATP-synthetase).
Furthermore, mtDNA also codes for 2 ribosomal RNAs (16S and 23S rRNA), and 22 transfer RNAs (tRNAs) that are needed for intramitochondrial protein synthesis (Anderson S., et al., 1981), (Fig. 8).
Fig 8: Map of the human mitochondrial genome (mtDNA)
ND1, 2, 3, 4L, 4, 5, 6 are NADH dehydrogenase subunits of the of complex I; CYB is Cytochrome B of
complex III. CO1, 2, 3 are cytochrome c oxidase polypeptides of complex IVand ATP-synthetase, ATPase 6 and 8, are proteins of complex V.
MtDNA consists of coding DNA, with the exception of a 1121 bp long fragment, named displacement loop (D-Loop), that has mainly regulatory functions and is therefore also termed control region (CR). The D-loop is the most variable region of mtDNA and contains the replication origin of the heavy H-strand (OH) and the promoter positions for the transcription of both H-strand ( PH) and light L-strand (PL). Transcription is initiated at PH or PL and progresses around the mtDNA, generating a polycistronic message.
ROS production
Althought mtDNA codes for only a small portion of all proteins forming the subunits of the mitochondrial respiratory chain, all of them are essential for OXPHOS. What is more, the same mitochondrial machinery that carries out respiration is also a major source of endogenous toxic free radicals, namely reactive oxygen species (ROS), including hydrogen peroxide (H2O2), hydroxyl radical (•OH) and superoxide radical (O2-•) (Wallace, 1999).
ROS are physiologically significant byproducts of normal cellular respiration and are potentially toxic (Melov, 2004). In fact, when ROS levels exceed the cellular antioxidant defenses, a deleterious condition known as oxidative stress occurs that results in substantial damage to various cellular costituents, including mtDNA (Beckman & Ames, 1998). Mitochondria are essential for neuronal function because neurons are highly dependent on OXPHOS for their energetic needs, and oxidative damage has been found in all classes of organic molecules (proteins, lipids, nucleic acids and sugars) that are critical for neuronal structural and functional integrity (Perry et al., 2002). High lipid content, relatively high oxidative metabolism and low level of antioxidant defenses make the brain very susceptible to oxidative stress (Emerit et al., 2004). Additionally, neurons are terminally differentiated cells and damaged cells do not have the possibility to be replaced.
The free radical injury and disruption of mitochondrial function have been implicated in the initiation and/or progression of neurodegenerative disease such as AD and PD. Mitochondrial dysfunction has been described in AD patients, especially in carriers of
APOE-ε4 genotype (Gibson et al., 2000) as the ε4 allele is associated with increased
oxidative stress (Ramassamy et al., 2001).Excessive lipid peroxidation, protein oxidation, DNA and RNA oxidation and glyco-oxidation have all been documented in AD brains (Bonilla et al., 1999). Furthermore, reduced complex IV activity has been found in the brain and platelets of AD patients, but the pathologic relevance of this mitochondrial defect is not known (Kish et al., 1992; Parker et al., 1994; Mutisya et al., 1994). However, no direct cause-effect relationship has yet been established between oxidative damage, mtDNA defects and AD, so that more work is required in this area.
Besides the key role of mitochondria in cell energy production, these organelles are also involved in cell death pathways accomplished via the mitochondrial permeability transition pore (mtPTP) (Kokoszka et al., 2004). ROS generated during respiration may induce mutations in mitochondrial DNA (Beckman & Ames, 1998) and any damage to mtDNA,
by inhibiting mitochondrial respiratory function, may increase the propensity for mtPTP activation that finally drives cell death by apoptosis and, consequently, loss of tissue function (Emerit et al., 2004).
In AD and PD the neural cell death occurs predominantly by apoptosis (Emerit et al., 2004) and the brains of AD patients have increased caspase activity, a classical apoptotic marker (Coskun et al., 2003). Because of these reasons, mitochondrial dysfunction is an attractive candidate for an executioner’s role in neuronal degeneration.
Overall, a clear involvement of oxidative stress, mitochondria dysfunction and neuronal damage/death in the pathogenesis of neurodegenerative disease is indicated by several studies. The hypothesis that mitochondrial abnormalities have a role in neuronal diseases suggests also the existence of selective defects for both AD and PD (Howell et al., 2005; Shapira, 2002). The relevant genetic factors still remain elusive and somatic mutations as well as inherited mtDNA variations, might be involved in neurodegenerative diseases.
MtDNA variability
While most of human cells contain two copies of nuclear DNA (nDNA), they contain many more copies of mtDNA (from 1000 to 100 000, depending on the cell type). Unlike nuclear DNA which replicates only once during each cell cycle, mtDNA replication is independent of the cell cycle and may occur even in non-dividing cells (Birky, 2001). In addition to high copy number, mtDNA has a mutation rate higher than that of nDNA due to lack of histones and inefficient repair systems. Moreover, mtDNA is more exposed to mutagenic events than nDNA because of its localization close to the mitochondrial respiratory chain, a source of DNA damaging free radicals. The D-loop region, especially, is more susceptible to mutagenesis (Chinnery et al., 1999) resulting the most variable region in the mitochondrial genome with the most polymorphic nucleotide sites concentrated in the hypervariable segments HVS-I and HVS-II (Wilkinson-Herbots et al., 1996).
Due to these particular features, mtDNA has a high level of variability. Specifically, a somatic or intra-individual variability and a hereditary or inter-individual variability of mtDNA exist.
When a new mtDNA mutation arises in a cell, a mixed intracellular population of mutant and normal mtDNA molecules is generated, which can coexist in the same cell, tissue or
organ, a state known as heteroplasmy. Cell containing only wild-type DNA or only mutated DNA are called homoplasmic (Wallace et al., 1999b). A very low level of heteroplasmy does not impair the respiratory chain function of cell or tissue, but if mutant mtDNA exceeds a certain level, OXPHOS dysfunction occurs and symptoms arise. This is known as threshold effect (DiMauro & Schon, 2003). Heteroplasmy can be observed in post-mitotic tissues such as central nervous system characterized by high energy demand (Chomyn & Attardi G., 2003).MtDNA mutations may accumulate in the brain; moreover, the rate of accumulation seems to be faster in brain of patients with dementia than in normal ones (Chinnery et al., 1999).
A dissertation on the literature on mtDNA heteroplasmy in neurodegenerative diseases would be out of the aims of this PhD thesis, which is instead focussed on mtDNA inherited variability.
MtDNA inherited variability: haplogroups and sub-haplogroups
Several unique properties of human mtDNA, including high copy number, maternal inheritance, lack of recombination, and high mutation rate have made mtDNA very appropriate in studies of human evolution, migration, and population history (Ingman et al., 2000). In fact, selectively neutral or almost neutral variants accumulate sequentially along radiating maternal lineages, becoming prevalent through genetic drift. Consequently, mutations which occurred ten thousands of years ago are nowadays present in high frequency, and are population- and continent-specific, creating groups of related mtDNA haplotypes, or haplogroups, sharing a specific set of stable polymorphic restriction sites (Torroni & Wallace, 1994; Wallace, 1994; Wallace, 1995).
The classification of mtDNA haplogroups is based on information obtained from RFLP analysis of the coding region and from the nucleotide sequence of the control-region (Torroni et al., 1996). Haplogroups are coded with capital letters and subclusters with a running number (Ballinger et al., 1992; Torroni et al., 1996). The three major ethnic groups (Africans, Asians and Native Americans, and Europeans) show different patterns of haplogroups. Three African (L1, L2, L3), seven Asian (C, D, G, E, A, B, F) and nine European (H, T, U, V, W, X, J, I ) main mtDNA haplogroups have been identified (Torroni et al., 1994; Torroni et al., 1996) (Fig. 9).
Fig. 9: Simplified network of major mtDNA haplogroups.The African haplogroups and superclades M and N that
descend from subSaharan L3 are shown in yellow. Asian/Native Americans haplogroups are shown in light blue while European haplogroups are shown in pink-colored boxes. Empty boxes indicate additional subgroups that are not displayed (Herrnstadt & Howell, 2004).
The phylogenetics of haplogroups is complex and multiple subclades exist. For example, haplogroup U comprises phylogeographically different subhaplogroups such as U1, U2, U3, U4, U5, the oldest subclade, U6, U7, U8, U9 and K (Achilli et al., 2005).
The most prevalent European haplogroup H comprises numerous sub-haplogroups identifiable by characteristic mutations (Achilli et al., 2004) (Fig.10).
Fig. 10:Phylogenetic tree of mtDNA haplogroup H. It encompasses 62 entire mtDNA sequences, all
mutations relative to the root of R, and the 15 sub-haplogroups (H1-H15) identified by Achilli et al.,2004.
Most of these H sub-haplogroups likely arose/expanded about 10,000-12,000 years ago. In contrast to haplogroup H as a whole, which harbors a rather uniform and elevated frequency within Europe (30%–50%), their spatial frequency patterns are very different in European regions (Achilli et al., 2004). For example, among the H-sub-haplogroups, H1 and H2 have been defined in a sample of Finns (Finnilä et al., 2001). Based on mtDNA complete sequences, two further sub-groups were described by Herrnstadt and coworkers (Herrnstadt et al., 2002) : H3, the next most common sub-haplogroup after H1, and the rare H4. Moreover, Quintáns and colleagues (Quintáns et al., 2004) further identified H5, H6, and H7. Additional sub-haplogroups (H16-H21) have been recently proposed by Roostalu et al (2006).
Haplogroup and sub-haplogroups in association studies
Population genetic studies are based on the assumption that mtDNA polymorphisms are neutral from an evolutionary point of view. However, it has been suggested that some mtDNA types have been selected on the basis of their effect on mitochondrial function (Moilanen & Majamaa, 2003).
Therefore, the geographical variation seen in mtDNA haplogroups may reflect the action of natural selection on specific mtDNA lineages in different climatic conditions (Mishmar et al., 2003;Ruiz-Pesini et al., 2004).
The presumed “neutral” variation that defines haplogroups and subhaplogroups has also been associated to a wide range of common complex diseases and phenotypes (Wallace D.C., 2005). In particular, the role of mtDNA variation in the pathogenesis of neurodegenerative diseases has been the focus of several studies (Howell et al., 2005). The first study reporting haplogroup effects in modulating the penetrance of mutations showed that specific pathogenic mutations of the Leber Hereditary Optic Neuropathy (LHON) were preferentially associated with the haplogroup J ( Torroni et al., 1997). Following these results, association studies became a current approach to disentangle the role of mtDNA variations in a variety of disorders and phenotypes.
Examples of associations studies are showed in the Table 1.
Trait Haplogroups
significantly associated with the trait References
Longevity Haplogroup J DeBenedictis et al. 1999; Ross et al.
2001; Niemi et al. 2003. Lewy body dementia Haplogroup H Chinnery et al. 2000 Occipital stroke in migraine Haplogroup U Majamaa et al. 1998
Asthenozoospermia Alzheimer’s Disease Haplogroup T Haplogroups U and K Ruiz-Pesini et al. 2000 Carrieri et al., 2001 Sprint athletic performances Haplogroups J and K Niemi & Majamaa
2005 Migraine without aura and
cyclic vomiting syndrome Haplogroup H Wang et al. 2004 Bipolar disorder Haplogroup D Munakata et al. 2004
Table 1 : Examples of haplogroup-associations studies.
superhaplogroup JT (Ross et al., 2003) and the supercluster JTIWX (Autere et al., 2004); on the contrary, in other studies, a reduced risk of PD was associated with haplogroups J and K (van der Walt et al., 2003), the supercluster UKJT (Pyle et al., 2005), or haplogroup K alone (Ghezzi et al., 2005). To explain the lack of reproducibility Samuels et al. (2006), examining the problem of the statistical power in mtDNA association analyses, established that very large sample sizes are required to detect differences in haplogroup frequencies between cases an controls (Samuels et al., 2006).
Moreover, inconsistent results may also be explained by the low resolution of the mtDNA haplogroup structure currently used in such association studies (Carelli et al., 2006; Saxena et al., 2006).
Haplogroups have been defined on the basis of evolutionarily ancient, stable polymorphisms deeply rooted in the world mtDNA phylogeny, and therefore almost all the association studies have ignored the majority of more recent sequence variations.
The molecular dissection of major mtDNA haplogroups into the “younger” sub-haplogroups with more restricted geographic and ethnical distributions can be extremely informative in disease studies. For example, Achilli and coworkers showed that the previously reported excess of H among Spanish families affected by nonsyndromic sensorineural deafness was caused entirely by H3 sub-haplogroup (Achilli et al., 2004).
2. AIMS OF THE STUDY
Data emerging from clinical and genetic studies on FTD provide evidence of a complex and multifactorial neurodegenerative disease. We collected a sample of unrelated subjects recruited in Calabria (southern Italy) and including 114 FTD patients and 180 controls matched for age, gender, ethnic origin and geographical area with the cases.
In my PhD, the focus was on following topics:
1. TAU gene variability in FTD . The TAU gene encodes for tau protein, the axonal
microtubule (MT)-associated proteins that have a major role in the assembly and stability of microtubules. Since conflicting results have been obtained as it regard
TAU gene variability (H1 haplotype) in FTD risk in different populations, aim of
the study was to investigated the role of H1/H2 haplotypes of TAU gene in a large sample carefully selected as for clinical and neuropsychological features.
2. APOE gene variability in FTD. ApoE plays a fundamental role in lipid
homeostasis, maintaining synapto-dendritic connections and scavenging toxins.
APOE-ε4 allele has been consistently associated with AD and other types of
dementia, but a possible role in FTD is still controversial. Aim of the study was to investigate the role of APOE gene variability in FTD. Furthermore, since studies suggested that the interaction between ε2/ε4 APOE alleles and H1 haplotype is a risk factor for FTD, we also explored this aspect of the problem.
The results relevant to points 1 and 2 have been already published (Bernardi et al., 2006). A brief comment to the paper is shown in the “Results and Discussion” section at page 35 and the reprint is annexed in the “End Section” of the present manuscript.
3. MtDNA inherited variability in FTD. The analysis of mtDNA has been the
focus of numerous studies investigating its role as a contributing factor to the pathogenesis of neurodegenerative diseases, but the possibility that mtDNA variability is a significant factor in FTD has not been explored yet. Therefore, aim of the work was to investigate the patterns of mtDNA haplogroups and sub-haplogroups in our samples.
3. MtDNA inherited variability in FTD
3.1 Subjects and Methods
3.1.1
Sample
We analyzed a sample of 294 subjects that comprised 114 unrelated FTD patients and 180 ethnically, age and sex matched healthy Controls. All individuals were recruited in a genetically homogeneous population (Calabria, southern Italy) and their Calabrian ancestry had been ascertained up to the grandparents generation.
Patients and Controls
All the FTD patients were collected and diagnosed at the Regional Neurogenetics Centre of Calabria (Director: A.C. Bruni). Here, thanks to a team of neurologists, psychologists, biologists, etc.; each patient was tested, visited and then subjected to blood withdrawal by venipuncture. Thereafter, blood samples were processed for both haematological and DNA analyses.
The differential diagnosis of FTD was made following stringent international criteria, among others Lund-Manchester group criteria and NINCDS-ADRDA (Brun A., et al., 1994; McKhann G, et al., 1984), in combination with clinical observations, neuropsychological evaluation (e.g. by MMSE), information gained from laboratory investigations, morphological and functional brain imaging (e.g.CT, MRI, SPECT). A detailed description of diagnosis and neuropsychological procedures is reported in the “Materials and Methods” section of the annexed reprint (Bernardi et al., 2006).
The FTD sample was further subdivided into sporadic and familial cases: if FTD was diagnosed in one patient without further members of the family affected, the case was defined as “sporadic”. On the contrary, if FTD was diagnosed in a subject who had a positive family history for FTD, the case was defined as “familial”. In such a case, a sole affected subject per family was randomly selected for the genetic study. Patients whose family history was compatible with the hypothesis of monogenic FTD were not included in our study. The distribution of our FTD sample across the Calabrian region is shown in Fig.11.
Fig.11: Distribution of FTD patients across the Calabrian region. Red circles denote the place of origin
Table 2 reports the number of examined sporadic and familial FTD patients (a) and controls (b) stratified by sex.
a)
Sporadic FTD
Familial FTD
Total
Men
30 (44.1%) 23 (50.0%) 53 (46.5%)Women
38 (55.9%) 23 (50.0%) 61 (53.5%)Total
68 (100%) 46 (100%) 114 (100%)Median age
68.0 years 64.5 yearsb)
CONTROLS
Men
84 (46.7%)Women
96 (53.3%)Total
180 (100%)Median age
66.5 yearsTable 2: Number of subjects in FTD (a) and controls (b) stratified by sex.
Age frequency distributions of sporadic FTD patients (a), familial FTD patients (b) and and control sample (c) are shown in Figures 12.
Fig. 12: Age frequency distribution in sporadic FTD patients (a) familial FTD patients (b) and in the control group (c). Homogeneity between samples was verified by Mann-Whitney test.
The same complete set of clinical-laboratory procedures and neurological assessment of cognitive status we used for patients, was performed also in the control group.
Written informed consent was obtained from all the persons participating to the study; for disabled FTD patients the agreement was given by their legal tutors.
Blood samples
DNA from blood buffy coats was isolated in the recruitment center above mentioned by using standard procedures.
3.1.2 Analysis of mtDNA variability
Haplogroups
Haplogroup typing was performed by PCR combined with restriction analysis (RFLP) (Torroni et al., 1996). MtDNA fragments, containing the polymorphic restriction sites that characterize each European haplogroup (Table 3), were amplified from each individual and submitted to restriction analyses.
Hg Polymorphic restriction sites
G1719Ac G4580Aq C7028Ta G8251Ab G9055An A10398Gc A12308Gg G13368Am G13708Ap H I J K T U V W X 1 0# 1 1 1 1 1 1 0# 1 1 1 1 1 1 0# 1 1 0# 1# 1# 1# 1# 1# 1# 1# 1# 0 1# 0 0 0 0 0 1# 0 1 1 1 0# 1 1 1 1 1 0# 1# 1# 1# 0# 0# 0# 0# 0# 0 0 0 1# 0 1# 0 0 0 0 0 0 0 1# 0 0 0 0 1 1 0# 1 1 1 1 1 1
Table 3: Identification of mtDNA haplogroups by restriction analysis (a: AluI, b: AvaII, c: DdeI, g:
HinfI, m: BamHI, n: HaeII, q: NlaIII, p: BstoI; 1/0 presence/absence of restriction site, # associations of sites that characterize each haplogroup) of the specific target sequence (Torroni et al., 1996).
Total DNA was amplified in 25 µl reaction mixtures containing 200 ng of genomic DNA, 1U of Taq DNA polymerase (Eppendorf AG, Germany), 0.3 µM of each primer, 0.2 mM dNTPs, 1.5 mM Mg(OAc) and 1X reaction buffer. Amplifications were performed in an
Eppendorf thermal cycler. Cycling conditions were the same for all the fragments, but with different specific annealing temperature. Specifically, the initial denaturation at 93°C for 30s was followed by 35 cycles at 93°C for 15s, specific primers annealing temperature for 20s, 72°C for 1’ and a final extension of 72°C for 12’. Details on mtDNA amplification, specific primers and corresponding annealing temperatures are shown in Table 4.
Hg PRIMERS SEQUENCE Annealing
T. °C Fragment length bp Fragment positions nt H FOR:5’AAGCAATATGAAATGATCTG-3’ REV: 5’-CGTAGGTTTGGTCTAGG-3’ 47 242 6890-7131 M FOR:5’-TCCTTTTACCCCTACCATGAG-3’ REV:5’-ATTATTCCTTCTAGGCATAGTAG-3’ 57 309 10270-10579 T FOR:5’-GCTTAGGCGCTATCACCAC-3’ REV:5’-ATATCTTGTTCATTGTAAG-3’ 50 232 13172-13403 U FOR:5’-CTCAACCCCGACATCATTACC-3’ REV:5’-ATTACTTTTATTTGGAGTTGCACCAAGAT-3’ 59 234 12104-12338 V FOR:5’-GGAGCTTAAACCCCCTTA-3’ REV:5’-GGTAGTATTGGTTATGGTTC-3’ 50 432 4308-4739 X FOR:5’-AACACAAAGCACCCAACTTACACTTAGGA-3’ REV:5’-CTTTGGCTCTCCTTGCAAAGT-3’ 62 273 1615-1894 I, W FOR:5’-AGCAAACCACAGTTTCATGC-3’ REV:5’-TTTCACTGTAAAGAGGTGTTGG-3’ 53 179 8188-8366 J FOR:5’-CCTCCCTGACAAGCGCCTATAGC-3’ REV:5’-CTAGGGCTGTTAGAAGTCCT-3’ 60 261 13583-13843 K FOR:5’-CCTAGCCATGGCCATCC-3’ REV:5’-GGCTTACTAGAAGTGTGAAAAC-3’ 53 356 8829-9184
Table 4: Sequence of each couple of primers and annealing temperature used in PCR for mtDNA haplogroups (Hg) detection.
The amplified fragments, after digestion by appropriate restriction enzymes (Table 4), were separeted by 2% agarose gel electrophoresis. By this procedure, each mtDNA was ascribed to one of the nine haplogroups (H, I, J, K, T, U, V, W, X) specific to Europeans. MtDNA that were non-classifiable within a haplogroup were grouped as “Others” (Torroni et al., 1996).
HVS-I analysis PCR
The HVS-I target region was a fragment of 405 bp spanning from nt 15996 to nt 16401. This fragment was amplified by using by 5’-CACCATTAGCACCCAAAGCT-3’ forward primer and 5’-TGATTTCACGGAGGATGGTG -3’ reverse primer (0.3 µM each) in a final volume reaction mixture of 25 µl, containing 200 ng DNA, 1.5 mM Mg(OAc)2, 0.2 mM dNTPs, and 1 U Taq DNA polymerase and 1X reaction buffer (Eppendorf AG, Germany). Amplification was performed in an Eppendorf thermal cycler at the following conditions: pre-denaturation at 93°C for 30s, followed by 35 cycles at 93°C for 15s, 60°C for 20s, 72°C for 1’ and a final extension of 72°C for 12’.
PCR fragments were then checked by an 2% agarose gel electrophoresis in TBE buffer and stained with ethidium bromide.
Sequencing
The amplified fragments were purified by QIAquick PCR purification Kit (Qiagen) and sequenced by using the BigDye Terminator Cycle Sequencing Ready Reaction Kit (Perkin Elmer) on an ABI 310 automated sequencer (Applied Biosystems). Sequencing reaction mixtures contained 4 µl of Terminator Ready Reaction Mix, 200 ng of template, 3.2 pmol of each primer, 4 µl of 5X reaction buffer in a total volume of 20 µl. Cycle sequencing was performed for 25 cycles at 96°C for 10s, 50°C for 5s, 60°C for 4’ in an Eppendorf thermal cycler. The extension products were purified by using Amersham spin columns (Amersham Biosciences).
Sequences were aligned by using Genalys 2.0 beta software and compared to revised Cambridge Reference Sequence (rCRS).
HVS-II analysis
PCR
For HVS-II analysis, a fragment of 732 bp spanning from nt 16411 to nt 580 was amplified by CGTGAAATCAATATCCCGCAC-3’ forward primer and 5’-TTGAGGAGGTAAGCTACATA -3’ reverse primer (0.4 µM each) in a final volume reaction mixture of 25 µl, containing 200 ng DNA, 1.5 mM Mg(OAc)2, 0.2 mM dNTPs, and 1.5 U Taq DNA polymerase and 1X reaction buffer (Eppendorf AG, Germany). PCR conditions were the following: pre-denaturation at 94°C for 30s, followed by 35 cycles at 94°C for 15s, 52°C for 20s, 72°C for 1’ and a final extension of 72°C for 12’. Amplification was performed in an Eppendorf thermal cycler and products were visualized by 2% agarose gel electrophoresis in TBE buffer with ethidium bromide staining.
Sequencing
HVS-II sequence analysis was performed as previously described for HVS-I, in a reaction mixture containing 2 µl of Terminator Ready Reaction Mix, 200 ng of template, 3.2 pmol of each primer, 2 µl of 5X reaction buffer in a total volume of 10 µl. Cycle sequencing was performed as follows: pre-denaturation at 96°C for 2’, and 25 cycles at 96°C for 30s, 50°C for 5s, 60°C for 4’ in an Eppendorf thermal cycler. The extension products were purified and sequenced as above described.
H Sub-haplogroups
Coding-region diagnostic markers used to define some H sub-haplogroups are reported in Table 5.
SubHg Coding-regions diagnostic
markers
PRIMERS SEQUENCE Annealin
g T. °C PCR fragment length bp Fragment positions nt
H1 G3010A FOR: 5’ TTCGAGCAGTACATGCTAAGA-3’
REV: 5’- AACCCTGTTCTTGGGTGGGTG-3’ 51 387 2841-3228 H2 H7 H13 4769A A4793G A4745G FOR: 5’- TAGGCCTAGAAATAAACATGC-3’ REV: 5’- CGTTTAGTGAGGGAGAGATTT-3’ 51 359 4561-4920 H3 T6776C FOR: 5’- AATAATCTCCCATATTGTAAC-3’ REV: 5’-GGCCACCTACGGTGAAAAGAA-3’ 51 301 6659-6960
Table 5: Coding-region diagnostic markers relevant to H sub-haplogroups (subHg) together with sequence and annealing temperature of each couple of primers.
PCR
The specific mtDNA target regions were amplified by using the primers (0.3 µM each) shown in Table 5 at the same conditions above reported for HVS-I, in a final volume reaction mixture of 25 µl, containing 200 ng DNA, 1.5 mM Mg(OAc)2, 0.2 mM dNTPs, and 1 U Taq DNA polymerase and 1X reaction buffer (Eppendorf AG, Germany). All amplifications were performed in an Eppendorf thermal cycler at the conditions already described for HVS-I amplification, except for the annealing temperature as reported in Table 6. PCR products were checked by 2% agarose gel electrophoresis in TBE buffer with ethidium bromide. Then, amplified fragments were sequenced by using the same procedure and conditions above described for HVS-I sequencing.
3.1.3 Statistical analyses.
Non-parametric Mann-Whitney-U test was used to verify if age frequency distribution was different between samples.
The null hypothesis of homogeneity between haplogroup (Hg)/subhaplogroup (subHg) frequency distributions in pair of samples was tested by permutation tests (Weir 1996).
Standard Errors (SE) for Hg/subHg were computed according to the hypothesis of a binomial distribution of random resampling. The formula for the binomial SE is given by:
(
)
N p p
SE= i× 1− i ;
Where pi is the frequency of the i-th mitochondrial Hg/subHg in the sample and N is the total number of the haplogroups/subhaplogroups in the same sample.
4. RESULTS and DISCUSSION
4.1 Comment to the published paper: Bernardi L., et al., 2006.
We collected a sample of 100 unrelated FTD patients (cases) and 180 ethnically, age and sex matched healthy controls. Both cases and controls was carefully recruited and selected in a genetically homogeneous population (Calabria, southern Italy).
Diagnosis of FTD in affected subjects was made using multiple diagnostic operational criteria and was based on specific clinico-neuropsychological features and neuroradiological profiles.
We investigated TAU and APOE gene variability in order to verify possible associations of FTD with TAU haplotypes (H1/H2) and/or APOE alleles (ε2/ε3/ε4).
By applying a logistic regression analysis we found that both H1 and H2 haplotypes do not affect the risk of FTD in our population. This finding, in agreement with previous studies performed in other populations, revealed that TAU gene variability is not involved in FTD. The analysis of APOE gene variability showed a rather important effect of this gene in the susceptibility to FTD. In particular, the APOE-ε4 allele was found to increase the risk to develop FTD (O.R.= 2.68 with 95% CI=1.51–4.76; p=0.001) while, APOE-ε2 allele was found to decrease it (O.R.= 0.28 with 95% CI =0.12–0.66; p=0.003). The association of the ε4/ε2 alleles with FTD is in accord with the well established allele-specific anti-oxidant effects exerted by the three ApoE isoforms and confirms the significant role played by
APOE variability in common dementing disorders.
The analysis of the interactions between APOE and TAU variability showed a small but significant effect exerted by the H1 haplotype in increasing the protective effect of the ε2 allele (O.R.= 0.31 with 95% CI = 0.13–0.73; p=0.007), thus demostrating an interaction between nuclear genetic factors on the risk to develop FTD.
4.2 Haplogroups analysis.
Sporadic FTD (n=68)and familial FTD (n=46) patients, and healthy controls (n=180) were screened for mtDNA haplogroups.
First, haplogroup analysis was carried out according to sex in each sample. Since significant differences were not found between men and women, men and women samples were pooled to increased the power of the analysis.
Data are reported in Table 6.
MtDNA HAPLOGROUPS
Sporadic FTD Familial FTD CONTROLS
N (% ± SE) N (% ± SE) N (% ± SE)
H 30 (44.1 ± 6.0) 16 (34.8 ± 7.0) 49 (27.2 ± 3.3) I 1 (1.5 ± 1.5) 2 (4.3 ± 3.0) 8 (4.4 ± 1.5) J 4 (5.9 ± 2.9) 3 (6.5 ± 3.6) 24 (13.3 ± 2.5) K 10 (14.7 ± 4.3) 4 (8.7 ± 4.2) 22 (12.2 ± 2.4) T 5 (7.4 ± 3.2) 7 (15.2 ± 5.3) 21 (11.7 ± 2.4) U 7 (10.3 ± 3.7) 8 (17.4 ± 5.6) 18 (10.0 ± 2.2) V 3 (4.4 ± 2.5) 1 (2.2 ± 2.2) 2 (1.1 ± 0.8) W 1 (1.5 ± 1.5) 1 (2.2 ± 2.2) 4 (2.2 ± 1.1) X 4 (5.9 ± 2.9) 0 (0.0 ± 0.0) 9 (5.0 ± 1.6) OTHERS 3 (4.4 ± 2.5) 4 (8.7 ± 4.2) 23 (12.8 ± 2.5) Total 68 100 46 100 180 100
Table 6: MtDNA haplogroups frequencies distributions in sporadic FTD/familial FTD patients and controls: Absolute (N), relative frequencies (%) and their standard errors (SE) are shown. MtDNAs that
All nine haplogroups characteristic of Europeans were found in the three sample groups. They included 95,6%, 91,3% and 87,2% of the mtDNAs in sporadic FTD, familial FTD and controls, respectively.
By applying permutation tests, no difference was found in the distribution of haplogroups between sporadic FTD patients and controls (p=0.078) or familial FTD patients and controls (p=0.508).
Therefore, the apparent difference relevant to single haplogroups (for example H) is probably only caused by random phenomena due to the sample size.
4.3. HVS-I analysis.
In the next step of our study we analyzed the mtDNA HVS-I region (nt16024-nt16383) of the D-Loop. The target region was PCR amplified and sequenced in the whole sample. Sequences were aligned and compared to revised the Cambridge Reference Sequence (rCRS) by using Genalys 2.0 beta software. Sequences without ambiguities were obtained between positions 16014 and 16399.
On the whole, we observed 649 positions which differed from the rCRS for a total of 186 sequence variant sites. In particular, we found 96 variants sites in FTD patients and 90 in controls.
By using the variant sites, we constructed a total of 174 different haplotypes, 24 of which were exclusive of familial FTD, 27 of sporadic FTD and 99 were exclusive of controls; the remaining 8 were shared between FTD patients and controls.
Table 7 (see annexed sheet) reports all mtDNA sequence variants found in the HVS-I, with haplotype absolute frequencies in each sample.
By applying permutation tests to data in Table 8 no difference was found between sporadic FTD patients and controls (p=0.99) or familial FTD patients and controls (p=1).
Therefore, by HVS-I sequencing and haplotype analysis we did not evidence statistically significant association between FTD and HVS-I variability.
4.4. Sub-haplogroups analysis
The study of mtDNA inherited variability was further extended by dissecting major haplogroups, into sub-haplogroups.
The data on HVS-I sequences enabled us not only to verify diagnostic haplogroup markers, but also provided some information for sub-haplogroup assignment. Then, to accomplish sub-haplogroups analysis, the samples were analyzed by HVS-II (nt57-nt576) sequencing and screened for a few additional coding-region diagnostic markers relevant to H sub-haplogroups (G3010A ; 4769A ; A4745G ; A4793G ; T6776C).