The selection of investment subsidy beneficiaries. An estimate of the differences between national and regional policymakers priorities1
Leonardo Becchetti
Università Tor Vergata, Roma, Facoltà di Economia, Dipartimento di Economia e Istituzioni, Via di Tor Vergata snc, 00133 Roma. E-Mail : [email protected]
David Andrés Londoño Bedoya
Università Tor Vergata, Roma, Facoltà di Economia, Dipartimento di Economia e Istituzioni, Via di Tor Vergata snc, 00133 Roma. E-Mail : [email protected]
We evaluate the effects of the partial delegation of the right to select of subsidy recipients from national to regional policymakers in Italy on a sample of more than 10,000 projects. We do so by comparing actual eligibility rankings with those simulated without considering the impact of newly introduced regional criteria.
Our main results show that regional policymakers attach higher value to job creation by paying significantly more, in terms of disbursed subsidy, for any additional worker employed by financed projects. “Regional winners” are also smaller and younger, with their projects lasting longer and creating relatively more jobs than “national winners”. We also show that the relatively higher emphasis of regional policymakers on the creation of new plants contributes to the determination of part but not all these effects.
1 This paper is part of a research commissioned by the Italian Ministry of Industry to investigate the effects
of fiscal federalism and, more specifically, of changes in the selection process of subsidy beneficiaries. We thank L. Baione, F. Morgia, M. Bagella, F. Mattesini and two anonymous referees for their useful comments and suggestions. The usual disclaimer applies.
1. Introduction
The decentralization of industrial policy at the regional level in the framework of EU rules poses an interesting question: do regional policymakers have the same priorities or the same objective function as national policymakers ?
Our empirical analysis provides a unique opportunity to respond to it by measuring the effects of the partial delegation of the power to select subsidy recipients from national too regional policymakers. We dispose of information on eligibility rankings and characteristics for more than 10,000 projects under the 8th call of the Italian investment subsidy law 488/92 which allows for a significant delegation of the definition of priorities from national to regional policymakers. We compare effective
rankings with simulated rankings based on the criteria adopted in the 7th call in which
eligibility criteria were almost exclusively established by national policymakers and identify differences in significance of various determinants of project eligibility under the two scenarios.
The literature on fiscal federalism suggests us that a result we may expect from this change is the willingness of regional policymakers to pay more for local job creation. In a recent survey of this literature Oates (2005) emphasizes that a standard assumption in the field is that any government maximizes the social welfare of its respective constituency. Within this framework the well known “decentralization theorem” establishes that local governments are more likely to provide levels of public output for local public goods that meet the demand of local residents. These assumptions are shared by all the more recent models of fiscal federalism which judge the relative performance of local versus national administrations in terms of trade off between local accountability and coordination of policies to internalize regional spillovers (Seabright, 1996).
Given the relatively reduced degree of workers mobility in the Italian regions we argue that support for local employment is more likely to create positive effects on future elections at the local than at the national level where the beneficiaries/voters ratio is significantly lower and spillover externalities among different regions are taken into account.
Our assumption hinges on the well known effect that decentralization has in strengthening the link between policy choices and re-election chances (Seabright, 1996; Persson and Tabellini, 2000). Hindriks and Lockwood (2006) define it as pivot
probability effect (or as the increased pivot probability effect of decentralization)
referring to the higher probability that the voters in any one region are pivotal in determining the outcome of the election.
Another branch of studies partially relevant to our work is the one evaluating the effects of unemployment on happiness. These recent empirical contributions confirm that unemployment matters not only as a “private bad” (i.e. the negative effect of the
unemployment status on the happiness of the unemployed individuals) 2 but also for
2 Clark & Oswald (1994), using data from the British Household Panel, show that unemployed
its negative externalities (i.e. the negative impact of the overall level of
unemployment also on those employed3) (Di Tella et al., 2001 and 2003). Hence,
changes in unemployment levels should significantly affect consensus of the entire local constituency.
Very few papers share our focus on the empirical test on the behaviour of national and regional policymakers in the project selection literature. However, this literature acknowledges that the analysis of project selection is a fundamental preliminary step to evaluate effects of subsidies since these effects must be corrected for the selection bias. In other words we need to know more about characteristics of project selection if we want to know whether differences in performance between subsidized and non subsidized firms are due to the effect of the subsidy or to differences in characteristics generated by the same selection process.
This is the reason why Blanes and Busom (2004) analyse the determinants of selection for R&D investment subsidies in a sample of Spanish firm. The authors show that the participation patterns are significantly different between national and
regional policymakers.4
In their conclusions the authors correctly observe that a serious limit of their analysis is in the lack of information on applicants which were not financed. Our database on the universe of (accepted or rejected) allows us to avoid this limitation.
We test for the existence of differences in project selection between national and regional policymakers by comparing “would be winners” from a simulated selection
based on the old national criteria with actual winners of the 8th project call in which
criteria have been partially delegated to regions. In order to do so we divide applicants into four groups (according to participation/non participation to the group of winners in the actual and simulated selection) and we compare factors affecting the probability of being part of these different groups with different probit specifications. We finally control whether the obtained findings are robust to the selection bias generated by the higher priority given by the new project call to new settlements.
The paper is divided into five sections (including introduction and conclusions). In the second section we explain the institutional background in which the power of selecting subsidy recipients has been partially transferred from the national to the regional level in two ways i) special shortlists and ii) additional grades provided by regional indicators in the traditional shortlists. In the same section we also describe our simulation design. In the third section we present descriptive findings for four subgroups of firms defined according to their winner/loser status in
& Goldsmith (1996) provide an excellent review of the studies which have most contributed to theorize the relation between unemployment and psychological well-being.
3 The main candidates to explain this indirect effect are a higher risk of falling unemployed, the
likelihood that family members are into this condition and the risk to pay higher taxes to support the unemployed.
4 For other related studies on project selection see Feldman and Kelley (2001) analysis on the
survey on 1998 Advanced Technology Program in the US, Lichtemberg (1999) for the allocation of public grants for biomedical R&D and Svensson (1988) for the relative weight of political versus economic factors in explaining the magnitude of R&D subsidies to different industries.
the effective or simulated rankings. In the fourth section we present econometric results on the determinants of participation to one of the four subgroups in order to identify the driving selection factors which discriminate between regional and national intervention.
2. National and regional criteria: institutional background and the simulation design
Subsidised credit programs5 which support investment still account for a large
share of total credit in Western countries in the last decades (more than 1/3 in the US in the eighties (Gale, 1989)). In the same period investment subsidies were by far more widespread than employment subsidies (OECD, 1990) and their management in Italy in the last decade is increasingly being delegated to regional authorities according to a principle of fiscal federalism.
The regulatory framework for investment and export subsidies in Italy has substantially changed in the last thirty years, in parallel with the dramatic changes in domestic macroeconomic conditions. From 1989 to 1997 Italy moved from an expansionary fiscal policy to a restrictive fiscal and monetary policy after the severe 1992 financial crisis which led to a sharp devaluation of the domestic currency. After the crisis the government significantly reshaped its intervention in support of the
industrial system.6 Until 1992 access to financial support was regulated on the basis
of an automatic "first in, first served" criterion (Cafiero, 1998; Chiri-Pellegrini, 1995; Chiri-Pellegrini-Sappino, 1995).
The procedure for obtaining the subsidy involved several institutions (Dipartimento per il Mezzogiorno, Presidenza del Consiglio, CIPI, Ministro per gli
Interventi Straordinari), was extremely complex and often caused delays in the
provision of subsidies. In many cases subsidy winners had to anticipate the amount of subsidized investment, financing it with ordinary bank debt. Local banks with high bargaining power anticipated that credit to going-to-be-subsidised firms would be
5 Several forms of market failures in real and financial markets provide, in principle, scope and
justification for this kind of public intervention. The most relevant cases are those of the: i) divergence between privately and socially optimal investment in public or quasi-public goods, such as monitoring (Stiglitz, 1993) and technological knowledge (Grossman-Helpman, 1991); ii) informational asymmetries generating financial constraints and credit rationing (Fazzari-Hubbard-Petersen 1988, Hoshi-Kashyap-Sharfstein 1992, Devereux-Schiantarelli 1990, Bagella-Becchetti-Caggese 2001, Schiantarelli-Georgoutsos, 1992; Bond-Meghir, 1994); iii) learning-by-doing externalities in equipment investment (De Long and Summers, 1991, 1992, 1993 and 1994). Government intervention is also advocated to promote job creation, especially in sectors or areas which suffer from a decline in economic activity. In spite of some relevant exceptions (Vittas-Cho, 1995; Gale, 1989; Flam and Staiger, 1989), mainstream theoretical models suggest that soft loans or grants, even though widely diffused in the reality, are not likely to be the optimal response of policymakers to these market failures (Schwartz-Clements, 1999).
6 In 1992, the year of the currency crisis, Italy had the worst debt sustainability conditions of the last
two decades with an average real cost of debt of 5.4 percent against a real rate of GDP growth of 0.7 percent.
relatively less risky. They lent money to these firms at higher rates than those paid
by non subsidized, thereby almost eliminating the financial advantage of subsidies.7
After the 1992 crisis new subsidy laws such as the L.488/92 significantly reduced delays and established a set of eligibility criteria aimed at selecting as beneficiaries the most efficient and less financially dependent firms. Law 488/92 is currently the most important Italian regional aid scheme. It is expressly addressed to favor productive initiatives related to: i) new settlement; ii) modernisation; iii) restructuring, iv) widening; v) reconversion; vi) delocalisations and vii) reactivations. All enterprises included in “Areas ob. 1 structural Funds” and SMEs responding to
the Structural Funds definition for “areas Ob. 2 structural Funds” are eligible.8 The
contribution is calculated in Gross Subsidy Equivalent (GSE)9 with respect to the
investment cost and the beneficiaries may choose among the following: i) grant contribution; ii) interest loan contributions; iii) payments of leasing rents; iv) payments of social taxes.
Selection of applicants and grant awarding were determined after an appraisal of business plans by approved banks which are responsible for project evaluation on behalf of the Ministry of Industry. Available funds are granted on the base of a mix of national and regional shortlists (also called “special shortlists”). Projects ranking
depends on three specific indicators fixed at the national level and related to
"financial independence" (the ratio of subsidy required from beneficiaries to the maximum amount of disbursable subsidy), "employment impact" (the number of new workers hired per currency unit of subsidised investment) and "investment independence" (the share of non subsidised investment).
7 Bagella and Becchetti (1998) show that the paradoxical result of this system was that subsidised
firms resulted to have an average cost of debt not significantly lower than that of non subsidised.
8 According to the EU definition objective 1 aims to promote the development and structural
adjustment of regions whose economic development is lagging behind. Objective 1 funds are usually directed to those regions whose per capita GDP is less than or close to 75% of the Community average. Objective 2 aims to convert the areas hardest hit by industrial decline, in which traditional industries such as coal and steel, textiles and shipbuilding can no longer compete successfully, causing major social and economic hardship and dislocation for the local workforce. Objective 2 funds are usually directed to areas where the average rate of unemployment and the percentage of industrial employment is higher than the Community average.
9 The Subsidy Equivalent is a unit of measure used to calculate the amount of aid allowable. In
order to determine the amount of funding in GSE (Gross Subsidy Equivalent), it is first necessary to translate the aid, of whatever nature (capital account funding or facilitated interest rate, tax benefits, exchange rate risk guarantee, etc.) into capital funding. The gift element of the subsidy must be calculated taking into account, for example in the case of a soft loan, the size of the loan as a percentage of the investment, the duration of the loan, the amount of the remittance and the agreed discounting rate. Once this amount has been calculated, the sum levied by the State by way of taxes is detracted. The result of this operation gives the Net Subsidy Equivalent or the final benefit to the subsidized initiative after payment of taxes on the operating profits which the aid is presumed to produce.
In most recent project calls, the selection of beneficiaries has been increasingly delegated to regional administrations.
More in detail, and from a chronological perspective, the introduction of regional criteria occurred progressively in two different steps. With the 7th call, a fourth
indicator was added indicating specific regional priorities with additional grades attributed on the basis of project inclusion in given areas, industries or investment typologies. With the 8th call, a special shortlist was introduced on which 20 to 40
percent of total regional applicants had to be selected. Criteria for this list were entirely determined by regional authorities and referred again to areas, industries or investment typologies which deserve preferential treatment according to their
evaluation (Tables A.1-A.2 in the Appendix).10
Given this short presentation and chronological description of the law, our experiment consists of identifying selection effects of the introduction of regional criteria (fourth indicator and special shortlist). We do so by simulating the ranking and the winners without the inclusion of regional criteria.
The sections which follow present descriptive and econometric findings on the features of the four different subgroups of firms in order to highlight differences between regional and national priorities and their related significance.
3. Descriptive findings on sample subgroups
Our empirical research is carried on the database of the Universe of firm/projects
admitted to apply for the 8th call for Law 488/92. The source is the Ministero
dell’Industria which is in charge of administering the law and has collected detailed
information on all applicants. Summary characteristics of our database are shown in Table 1. Accepted applications cover 10,315 projects, 8,804 of them to be realized in the Italian Mezzogiorno. The share of small (below 50 employees) firms is largely predominant (84.68 percent), while 73.17 of applicants belong to the manufacturing sector. Around 90 percent of the projects has EU cofinancing and about 43 percent of them obtains the subsidy. The age of applying firms is on average 12 years while their size is around 20 employees.
Tables 2.1-2.2 illustrate results from the comparison of the effective and simulated rankings, where the latter are derived from the simulation which rules out regional criteria (special shortlist and fourth indicator in the ordinary shortlist) from the selection.
From these general findings we find that, based on effective rankings, 3,367 projects were financed for a total investment of 76.425 billion euros, obtaining government aid for about one third of the total. These projects created 71,785 additional jobs corresponding to around 20 new employees per project. On average, any financed project invested more than 2,250 million euros and obtained on average 774 million euros of government aid. Any new employee did cost on average 115,000 euros in
10 Full information on regional grades attributed to selected industries areas and investment types in
terms of the amount of money invested and almost 38,000 euros in terms of subsidies.
Results from our simulation show that rankings of beneficiaries obtained without the inclusion of regional criteria would reward on average smaller and less subsidised projects (1,819 million euros of investment with 613,000 euros of government aid) with reduced effects on employment (more than 67 thousands new jobs corresponding to about 17 new employees per project). The cost of new employment would have been smaller in terms of both the amount invested and subsidised (respectively 104,000 and 35,000 euros).
Are these differences between effective beneficiaries - and beneficiaries simulated without considering criteria introduced by regional policymakers - consistent with the new criteria formally established by regional policymakers in the definition of the special shortlist and in the fourth indicator of the ordinary shortlist ? In Tables
3.1-3.2 we analyse the consistency of ex post financing choices with the declared regional priorities on selected areas and industries. We classify as positive all cases in which the industry or area indicated as a priority by regional policymakers has a higher number of financed projects than those that would be financed in the simulated selection which excludes the special shortlist. We classify as paradoxes all cases in which the inequality is reverted and the number of financed projects is lower than under the simulated ranking. Under the reasonable assumption of a not too unequal distribution of project size, a high share of paradoxes indicates weak consistency between ex post financing choices and ex ante declared regional priorities. Consistently with what expected, the share of paradoxes is lower for industries and areas with top rankings than for those with intermediate rankings in the new regional priorities. Campania, the region with the weakest consistency between actual choices and declared priorities, exhibits an extremely high share of paradoxes for selected areas with top rankings (27.4 percent) in the special shortlist. A similar result is found in Basilicata with 20 percent paradoxes for top priority areas defined by the regional administration in the fourth indicator of the ordinary shortlist. Paradoxes for selected areas or industries with intermediate rankings are extremely high and only partially justified by the relative preference shown for industries or areas with top rankings. The observed difference between ex ante declared priorities and ex post choices of regional policymakers leads us investigate which are the factors driving regional selection beyond formally established criteria.
To do so we decompose applicants into four subsets (see Figure 1): i) “regional winners” (firms/projects which are subsidy recipients but would not be winners in the simulation without regional criteria); ii) “nonetheless winners” (firms/projects which are subsidy recipients and would be winners also in the simulation without regional criteria); iii) “regional losers” (firms/projects which are not subsidy recipients but would be winners in the simulation without regional criteria); iv) “nonetheless losers” (firms/projects which are not subsidy recipients and would not be winners also in the simulation without regional criteria).
A first preliminary inspection shows that “nonetheless losers” are by far the largest subgroup (almost 60 percent of the sample), while the overlap of actual and
simulation winners (the subgroup of nonetheless winners) covers slightly more than 15 percent of the sample. Regional winners are almost 15 percent as well, while regional losers are less than 10 percent (Tables 4.1-4.3).
These descriptive statistics give us important insights on the relative preferences of regional policymakers. We can read the tables as follows. A difference between nonetheless losers and winners indicates that a given factor matters for the selection of beneficiaries. A difference among regional winners, nonetheless winners and regional losers implies that a given factor discriminates between the priorities of regional and national policymakers.
The obvious caveat of this analysis is that we do not observe the counterfactual situation. Simulation results do not coincide with what would have happened in the reality in a selection without regional criteria, since it may be reasonable to argue that the applicant’s behaviour is not invariant to changes in the selection process. We nonetheless assume that this source of bias is negligible. Given the large pool of applicants, their project features should well represent the universe of investment projects which is assumed to be invariant to the selection criteria.
By looking at features of these four subgroups we find that environmental certification (EMAS, ECOAUDIT) is a discriminating criterion for effective selection (almost 98 percent of winners have certification against 80 percent of nonetheless losers). Regional authorities seem to care relatively more about environment than national authorities since the share of certified projects is 6 percent points higher among regional winners than among regional losers.
The most relevant differences among subgroups are registered for the investment type and employment variables. The share of new settlements is 58 percent among regional winners, 32 percent among nonetheless losers and only 11 percent among regional losers. Regional winners register a 79 percent average employment growth against 51 percent of regional losers and 59 percent of nonetheless losers.
Age also seems to be a discriminating factor since regional losers are on average 14 year old against average 9.5 year old regional winners. Size, project length and European Cofinancing also matter with regional losers being on average larger and having shorter and less Eu cofinanced projects than regional winners.
The decomposition of the impact of the introduction of regional criteria into two different effects (special shortlist only and fourth indicator only) does not seem to change the picture, even though the new settlements effect seems to be stronger with the fourth indicator in the ordinary shortlist than with the introduction of the special shortlist (Tables 4.2-4.3).
4.1 The econometric approach
To evaluate econometrically the determinants of participation to any of the four subgroups of subsidy applicants (Tables 5.1-5.3) we define the following probit model
i i
i x u
y* =β' +
where y*i is our latent variable and xi is a vector of observable characteristics of the i-th project.
Under the probit model y = 1 if y*i > 0 or y = 0 otherwise, and Prob(yi = 1) = Prob(ui
> - ’xi) or Prob(yi = 1) = 1 - F(- ’xi), where F is the cumulative distribution function
of the standard normal distribution.
More specifically, our latent variable model is
0 1 2 3 4 5 6 7 5 8 9 10 11 12 1 13 14 15 16 17 18 * cos i i i i
Y b bArtis b Nplant b Dsmall b Dmedium b Age b Plength b Envqual
b Job t b Padoccup Dindustry b Invleas b Invord b EUcofin
b Nborn b Occupre b Bindml b Gsag b Gsatt b Rgrspec
α
= = + + + + + + + + + + + + + + + + + + + + + +wi (1)which we estimate under three alternative specifications.
Under the first specification the dependent variable takes the value of one if the firm is subsidy recipient and zero otherwise. The specification identifies factors significantly affecting the probability of obtaining the subsidy.
Under the second (third) specification the dependent variable takes the value of one if the firm belongs to the subset of regional winners (regional losers) and zero otherwise. Nonetheless losers are excluded from the sample. These specifications aim to identify factors discriminating between regional and national preferences.
The exclusion of “nonetheless losers” from these last two specifications depends on the fact that this group of firms is rejected both in the actual and in the simulated rankings. Therefore it does not help in identifying differences between selection criteria of regional and national policymakers.
Regressors in (1) are defined as follows.
Artis is a dummy for artisan firms.11 Nplant is a dummy which takes the value of one
if the investment leads to the creation of a new settlements.12 Dsmall (Dmedium) is a
dummy which takes the value of one if the firm is classified as small (medium) sized
and zero otherwise.13 Age is the logarithm of firm age. Plength is the logarithm of the
11 L. 443/85, establishes that an artisan firm is a firm subject to limits of size and limits of activity
in which the owner is primarily a craftman and not an organiser of production factors.
12Allowed typologies are: 1) New settlement: construction of a new productive settlement. 2)
Widening: investment that increases the productive capacity of existing products or add a relative one to new products (horizontal widening); ii) to create in the same plant a new productive capacity (vertical widening). 3) Modernization: program that tries to spur innovation with the intention of obtaining an increase in the productivity and/or an improvement of the bequeathed environmental conditions to the productive processes. 4) Restructuring: investment that regards the reorganization, the technological modernization of the firm. 5) Reconversion: investment that regards the introduction of productions that belong to different product sectors through modification from the cycles of the production of the establishments. 6) Reactivation: initiatives aiming to the reuse of inactive productive establishments through new subjects which have active participation in the management of the company, excluding from the facilities the purchase of the establishments.
13 In the manufacturing industry a firm is classified as small sized when it has less than 50
employees and less than 7 million euros net sales. In the service industry it is small when it has less than 20 employees and less than 2.7 million euro net sales. It is classified as medium sized when it has between 51 and 250 employees and between 7 and 40 million euro net sales. In the service
project length in months, where project length is calculated as the difference between the starting date and the completion date of the plan. Envqual is a dummy which takes value of one if the enterprise has obtained ECOAUDIT or EMAS certification.14 Jobcost is the cost of job creation measured as the average subsidy
cost of any additional worker employed by the project (total subsidy/additional
workers employed). Jobchange is (ET-E0)/ET, where ET is total expected employees
after the realization of the plan and E0 is total employees before the realization of the
plan. The use of ex post total employees at the denominator is necessary because some companies are born with the project and therefore have no employees before the investment.
Dindustry are industry dummies which take the value of one if the firm belongs to the
given industry and zero otherwise.15 Invleas, Invord and Eucofin are dummies which
takes the value of one respectively when i) the investment is of the ordinary type (purchase of capital assets); ii) the investment is financed in leasing;16 iii) the
enterprise obtained European co-financing and zero otherwise. 17 Nborn is a dummy
which takes the value of one if the enterprise is born with the project and zero otherwise. Occupre are total employees before the realization of the project. The variable is the employees’ monthly average during the 12 months before the presentation of the project. We use this variable together with the Small and Medium variables to test for the marginal effect of size separately from dummy variables based on the legal definitions of small and medium firms.
industry a firm is medium when it has between 21 and 95 employees and between 2.7 and 15 million euro net sales.
14 ECOAUDIT norms are fixed by the ISO (an international agency fixing certification standards)
and represent a voluntary certification instrument aimed to improve firm environmental sustainability. EMAS is an environment and industrial certification instrument aimed to promote improvements of the environment efficiency of the industrial activities.
15 The following industries are considered: i) Constructions (section F of the ISTAT’91
classification); ii) Energy: activity of production and distribution of electric power, steam and warm water (classes 40.10 and 40.30 of the ISTAT’91 Classification); iii) Mineral extraction (section C of the ISTAT’91 classification); iv) Manufacturing: manufacturing activities aiming at working of raw materials and/or semi finished products (section D of the ISTAT’91 classification); v) Services: firms that exercise activity of real services, constituted as society, whose activity is directed to influence positively the development of facilitated productive activities (D.M 8 may 2000, All. 2). Real services to the companies re-entering in the following directory: computer science and connected services of professional formation, technological transfer and intermediation of the information, technical-economic advising.
16 The investment can be of the ordinary type, in leasing or it can be a mix of the two.
17 Remember that some of the projects can only compete for national resources, because not
operating in Objective 1 areas. They are those related to: i) artisan firms operating in Objective 2 areas; ii) large firms operating in regions Objective 2 not admitted to the exception 87.3 of the Treaty of Rome; iii) productive initiatives located in the following regions: Valle d’Aosta, Friuli Venezia Giulia and Trentino Alto Adige. Others projects are excluded from EU funds by the sector in which they operate. They concern firms operating: i) in the agricultural and food sector; ii) in sectors subject to prohibition and limitations deriving from the enforced norms of the EU.
Bindml, Gsag, Gsatt and Rgrspec are dummies which take the value of one
respectively when i) long term debt is one of the project financing sources; ii) the project is included in the special shortlist by regional policymakers due to its geographic location; iii) the project is included in the special shortlist by regional policymakers due to its field of activity; iv) the project re-enters in the special shortlist for other reasons.
The estimation of a single equation model may lead to incorrect inference if one of the regressors is particularly relevant and has strong covariance with others. More specifically, the inspection of Tables A.1-A.2 (in Appendix) resuming regional criteria in the special shortlist and in the fourth indicator of the ordinary shortlist clearly shows a strong regional preference for new settlements. The choice of a new settlement implies the introduction of a new vintage of physical capital which is
likely to have features which are significantly different with respect to the old ones.18
Moreover, if changes in regulation have been occurred in the meanwhile, new rules apply to new plants with respect to the old ones. We therefore expect new settlements to have features which are different from all other types of investment (i.e. stricter environmental regulation, the adoption of new technologies which increase labour productivity, etc.). As a consequence, it is essential to verify whether factors which are likely to discriminate between regional and national choices, do so even beyond the selection bias generated by the regional revealed preferences for new settlements. To test this hypothesis we perform a SUR two-equation estimate in which, to the first equation, a second equation measuring characteristics of new settlements is added. The model therefore turns into
i i i i i u Rgrspec b Gsatt b Gsag b Bindml b Occupre b Nborn b EUcofin b Invord b Invleas b Dindustry Jobchange b t Job b Envqual b Plength b Age b Dmedium b Dsmall b Nplant b Artis b b Y + + + + + + + + + + + + + + + + + + + + + + = = 18 17 16 15 14 13 12 11 10 5 1 9 8 7 6 5 4 3 2 1 0 cos
α
(2.1)18 The theoretical literature on firm entry and firm growth through the creation of new plants
follows four main alternative approaches to explain the phenomenon: technical and allocational efficiency, transaction costs efficiency, market power and stochastic and evolutionary models of firm growth (Cabral, 1995; Jovanovic, 1982; You, 1995). A point which is relevant to our approach is that new plants in new firms are generally of small scale with respect to existing firms or plants since entrepreneurs do not have prior knowledge about their true ability and the new plant involves sunk costs. The subsidy should however increase their size by reducing the above mentioned sunk costs and, in any case, the creation of a new productive settlement should involve a higher investment with respect to the other forms (i.e. widening, restructuring, etc.) of investment financed by the law.
i i i i i w Rgrspec c Gsatt c Gsag c Bindml c Occupre c Nborn c EUcofin c Invord c Invleas c Dindustry Jobchange c t Job c Envqual c Plength c Age c Dmedium c Dsmall c Artis c c Nplant + + + + + + + + + + + + + + + + + + + + + = = 17 16 15 14 13 12 11 10 9 5 1 8 7 6 5 4 3 2 1 0 cos β (2.2)
where E(ui)=0,E(wi)=0 and E(ui,wi)≠0.
4.2 Econometric results
A synthesis of our econometric results is presented in Table 5.19
In interpreting them consider that variables with positive and significant sign in the second specification (and negative and significant sign in the third specification) can be regarded as selection factors discriminating between national and regional intervention. Variables which are significant in the first specification (where the dependent variable is admission to financial support) but not in the other two can be interpreted as relevant for the effective selection, but not for discriminating between national and regional criteria.
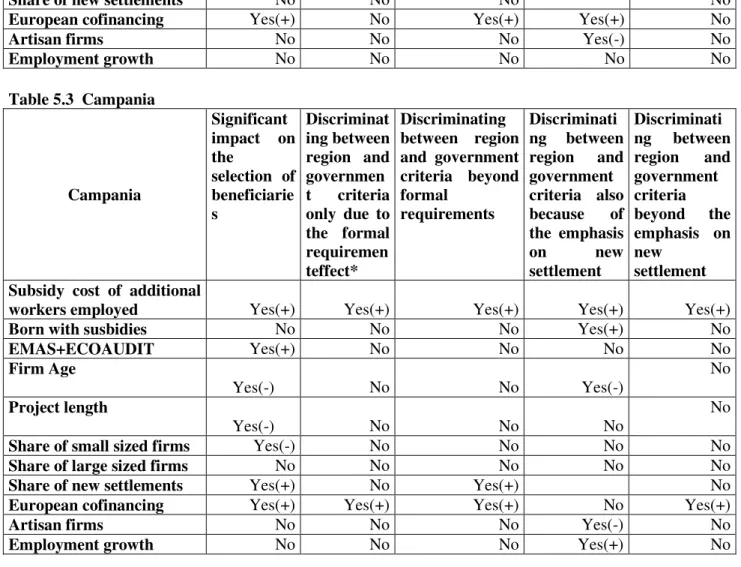
Table 5 provides an interpretation of our empirical results for the most relevant variables. The subsidy cost of additional workers employed is positive and significant in all table columns. The variable is positive and significant in the models in which the dependent variables are respectively regional winners and actual winners and negative and significant in the model in which the dependent variable is regional losers. Moreover, it is positive and significant in the SUR model both in the new settlement and in the regional winner equation.
This means that: i) additional employment is significantly more expensive for projects selected than for projects excluded by financial support; ii) projects selected by regional policymakers have a significantly higher subsidy cost of job creation than those selected by national policymakers in the simulated choice; iii) the effect goes beyond “declared” regional priorities and therefore does not disappear when we introduce controls for areas and regions selected in the special shortlist or in the fourth indicator (where regional preferences are expressed); iii) it partly depends from the regional preference for new settlements (which are significantly more costly in terms of job creation)20 but it goes beyond it.
These findings support the hypothesis that the higher subsidy cost of job creation for aid beneficiaries reflects the availability of regional policymakers to pay more for job creation than national policymakers. This relative preference goes beyond the effect of the declared criteria on selected industries or areas, and also beyond the effect of
19 Full estimate details are omitted for reasons of space and collected in an Appendix available upon
request.
20 An obvious interpretation for this result is that new plants introduce new vintages of capital stock
the relative preferences for new settlements expressed by regional criteria established in the special shortlist or in the fourth indicator (of the ordinary shortlist).
Among other significant regressors only the EU cofinancing dummy exhibits the same pattern of significance as the subsidy cost of job creation. This variable is in fact always significant and it represents therefore another factor discriminating between regional and national preferences beyond the effect of the declared regional criteria on preferential areas, industries and investment types.
The synthetic description of our results in Table 6 also shows that the status of artisan firms significantly and positively affects the probability of selection. Regional administrations seem to attach higher priority than national administrations to the artisan corporate form of ownership given the significance of the variable in both the regional winner and regional losers estimates. The strength of this result goes beyond the effect of the priority given to new settlements which are negatively correlated with the artisan status.
Evidence on the remaining regressors considered in the estimates is more mixed. Age seems to be a discriminating factor both for the effective and simulated selection. Younger firms have, coeteris paribus, a higher probability of being financed and a preferential treatment in regional criteria. Results from SUR estimates show that this effect vanishes once we incorporate the impact of new settlement characteristics in the model. The clear interpretation is that the age effect is driven by the priority on new settlements (Tables A.1-A.2 in the Appendix) which are realized by younger or new firms in much higher proportion.
Project length has a negative and significant impact on the probability of being selected, even though it positively discriminates between regional and national criteria (regional policymakers seem to have relatively stronger preferences for longer projects). Again, the relative regional/national effect disappears once new settlement characteristics are taken into account and therefore we interpret this result
as driven by the investment type effect.
It is important to verify if our overall sample findings are robust when evaluated in each region. The same description of how the power of selection has been delegated to regional policymakers (Tables A.1-A.2) documents that each region has his own decision power and behaves differently from the others. The inclusion of intercept dummies is not enough to capture such differences. This is why, given the large number of observations, we replicate the analysis at regional level to see in how many regions our aggregate results are confirmed.
The regional breakdown confirms that the willingness to pay more to create additional employment is our strongest result (Tables 5.1-5.6), being confirmed in all regions but Sardinia.
Results on the impact of environmental certification are controversial as expected. In most regions the variable does not discriminate between regional and national criteria, whereas it discriminates negatively in Basilicata and positively in Calabria. Basilicata is the only region which presents the same pattern of significance of our aggregate estimate with regard to firm age, (significance in the selection and in the discrimination between regional and governmental criteria but not after controlling
for the new settlement effect). In Puglia the impact is stronger and goes beyond the new settlement effect. In all other regions the effect is not significant.
Sicilia and Sardinia exhibit the closest pattern of significance to the aggregate estimate for the project length variable, which is often not significant in regional estimates.
All regions give preferential treatment to new settlements in the fourth indicator of the ordinary shortlist, but Basilicata, Sicilia and Sardinia do not in the special shortlist. Consistently, the new settlement effect is not significant in Basilicata and Sardinia, but it is so in Sicilia. The effect is not significant also in Calabria even though the region clearly expresses its priority for this type of investment. Finally, the EU cofinancing effect is significant in all regions with the exception of Basilicata and Sardinia
Conclusions
The availability of detailed information on the selection criteria and on the characteristics of the universe of (accepted and rejected) projects applying for
investment subsidies under the 8th call of the Italian Law 488/92, which delegates a
significant part of decision power from national to regional authorities, provides us with a unique opportunity for testing differences in priorities between national and regional policymakers.
A simple consideration stemming from the fiscal federalism literature suggests that regional policymakers should be willing to pay more for local job creation. A likely rationale for this result is that support for local employment is more likely to create positive effects on future elections at the local than at the national level where the beneficiaries/voters ratio is significantly lower.
More ambiguous is the interpretation of the differences between regional and national priorities over environmental action. Recent theoretical models suggest that, according to the level of environmental regional externalities, and to preferences of local constituencies, regional policymakers may either choose a policy of stricter environmental rules, to avoid location of polluters in their area, or a policy of attracting new firms by competing with neighboring regions through the lower quality of their environmental regulation (Markusen et al., 1995).
We try to test these propositions by comparising the rankings of the effective beneficiaries with those simulated without the inclusion of the new regional criteria. Our results appear consistent with indications from theoretical literature. We do not identify any significant difference between regional and national policymakers in terms of environmental features, while we find a strong and significant difference in terms of job creation.
Regional policymakers pay significantly more to create new jobs and attach higher priority to new settlements which, in turns, imply stricter environmental rules and preference for newly born firms.
After controlling for the new settlement effect, we show that the relative preference of regional policymakers for job creation, EU cofinancing and artisan firms goes
beyond what formally established in ranking criteria and beyond the effects incorporated in the priority given to new settlements.
References
BAGELLA M. - BECCHETTI, L., “Gli effetti di breve periodo delle agevolazioni : il
costo del debito, l’offerta di credito, gli investimenti e l’effetto del ciclo” in BAGELLA M. (ed.) Gli incentivi di politica industriale: presupposti teorici e
valutazioni empiriche, Quaderni di Politica Industriale Mediocredito Centrale,
1988, pp. 34-100.
BAGELLA M. - BECCHETTI L. - CAGGESE C., “Financial constraints on investment: a
Three Pillars Approach”, Research in Economics Vol. 55, No. 2, 2001, pp. 219-254.
BEGG D.-PORTES R., “Eastern Germany since Unification: Wage Subsidies Remain a
Better Way”, Economics of Transition Vol. 1, No. 4, 1993, pp. 383-400.
BERGSTROM F., “Characteristics of government supported firms”, Working Paper
Series in Economics and Finance from Stockholm School of Economics, No. 283,
1998.
BOND S.-MEGHIR C., “Dynamic Investment Models and the Firm’s Financial Policy”,
Review of Economic Studies, Vol. 61, No. 2, 1994, pp. 197-222.
CAFIERO S., “L'efficacia degli incentivi all'investimento disposti dalla legge 488 del
1992”, Rivista Economica del Mezzogiorno, Vol. 12, No. 2, 1998, pp. 243-257. CABRAL L., “Sunk Costs, Firm Size and Firm Growth”, Journal of Industrial
Economics, Vol. 43, 1995, pp. 161–172.
CHIRI A. - PELLEGRINI G., “Gli aiuti alle imprese nelle aree depresse”, Rivista
Economica del Mezzogiorno, Vol. 9, No. 3, 1995, pp. 481-518.
CHIRI A. - PELLEGRINI G., “L'attuazione dell'intervento per lo sviluppo degli
investimenti delle aree depresse”, Rassegna Economica, Vol. 62, No. 1, 1995, pp. 157-212.
CLARK A. – OSWALD A., “Unhappiness and Unemployment”, Economic Journal,
Vol. 104, No. 424, 1994, pp. 648-659.
DARITY W. - GOLDSMITH A., “Social Psychology, Unemployment and
Macroeconomics”, Journal of Economic Perspectives, Vol. 10, No. 1, 1996, pp. 121-140.
DE LONG J. B. - SUMMERS L. H., “Equipment Investment and Economic Growth”,
Quarterly Journal of Economics, Vol. 106, No. 2, 1991, pp. 445-502.
DE LONG J. B. - SUMMERS L. H., “Equipment Investment and Economic Growth:
How Strong Is the Nexus?”, Brookings Papers on Economic Activity, Vol. 0, No. 2, 1992, pp. 157-99.
DE LONG J.B. -SUMMERS L. H., “How Strongly Do Developing Economies Benefit
from Equipment Investment?”, Journal of Monetary Economics, Vol. 32, No. 3, 1993, pp. 395-415.
DE LONG J. B. - SUMMERS L. H., “Equipment Investment and Economic Growth:
DEVEREUX M. - SCHIANTARELLI F., "Investment, financial factors, and cash flow:
evidence from UK panel data", NBER Working Paper, No. 3116, 1989.
DI TELLA R. - MACCULLOCH R. (2003). “The Macroeconomics of Happiness”,
Review of Economics and Statistics, Vol. 85, No. 4, 2003, pp. 809–827.
DI TELLA R. - MACCULLOCH R. - OSWALD A., “Preferences over Inflation and
Unemployment: Evidence from Surveys of Happiness”, American Economic
Review, Vol. 91, No. 1, 2001, pp. 335-341.
FAZZARI S.M.-HUBBARD G.R.-PETERSEN B.C., "Financing constraints and corporate
investment", Brooking Papers on Economic Activity, Vol 0, No. 1, 1998, pp. 141-195.
FEATHER N., The Psychological Impact of Unemployment, New York:
Springer-Verlag, 1990.
FELDMAN M.P. – KELLEY M.R., “Winning an award from the advanced technology
program: pursuingR&Dstrategies in the public interest and benefiting from a Halo effect”, U.S. Department of Commerce Technology Administration, National
Institute of Standards and Technology, Economic Assessment Office Advanced Technology Program, 2001, No. 6577.
FLAM H. - STAIGER R.W., “Adverse Selection in credit market and infant industry
protection”, NBER Working Paper, No. 2864, 1989.
GALE W.G., “Collateral, rationing and government intervention in credit markets”,
NBER Working Paper, No. 3024, 1989.
GALE W.G., “Economic Effects of Federal Credit Programs”, American Economic
Review, Vol. 81, No. 1, 1991, pp. 133-152.
GROSSMAN G.M. - HELPMAN, E., Innovation and Growth in the Global Economy,
Cambridge, MA, MIT Press, 1991.
HINDRIKS J. - LOCKWOOD B., “Decentralization and Electoral Accountability:
Incentives, Separation, and Voter Welfare”, Universite catholique de Louvain,
Departement des Sciences Economiques Working Paper, No. 2005038, 2005.
HOSHI T. - KASHYAP A. - SCHARFSTEIN D., "Corporate structure, liquidity and
investment: evidence from Japanese industrial groups", Quarterly Journal of
Economics, Vol. 106, No. 1, 1991, pp. 33-60.
JOVANOVIC, B., “Selection and Evolution of Industry”, Econometrica Vol. 50, 1982,
pp. 649–670.
LICHTENBERG F., “The Allocation of Publically-Funded Biomedical Research”,
NBER Working Paper, No. 6601, 1998.
MARKUSEN J.R. - MOREY E.R. - OLEWILER N., “Competition in regional
environmental policies when plant locations are endogenous”, Journal of Public
Economics, Vol. 56, No. 1, 1995, pp. 55-77.
OATES, W., “An Essay on Fiscal Federalism”, Journal of Economic Literature, Vol.
37, No. 3, 1999, pp. 1120-1149.
PERSSON T. - G. TABELLINI, Political Economics: Explaining Economic Policy,
Zeuthen Lecture Book Series, Cambridge and London: MIT Press, 2000.
SEABRIGHT P., “Accountability and Decentralization in Government:an Incomplete
SCHIANTARELLI F.-GEORGOUTSOS D., “Monopolistic Competition and the Q Theory
of Investment”, European Economic Review, Vol. 34, No. 5, 1990, pp. 1061-1078. SCHWARTS, G. - CLEMENTS B., “Government Subsidies”, Journal of Economic
Surveys, Vol. 13, No. 2, 1999, 119-147.
STIGLITZ J.E., The role of the state in financial markets, Proceedings of the World
Bank Annual Conference on Development Economics, 1993, pp. 19-56.
SVENSSON P., “Strategic trade policy and endogenous R&D subsidies: An empirical
study”, Kyklos, Vol. 51, No. 2, 1998, pp. 259-275.
VITTAS D. - CHO Y.I., “Credit policies: lessons from East-Asia”, World Bank Policy
Research Working Paper, 1989, No. 1548.
WOSSMANN L., “Specifying human capital”, Journal of Economic Surveys, Vol. 17,
No. 3, 2003, pp. 239-270.
YOU, J. I., “Small Firms in Economic Theory”, Cambridge Journal of Economics
Table 1 Summary characteristics of our data (source: database of the Universe of firm/projects admitted to compete for subsidies under the 8th call of the Law 488/92, IPI-Ministero dell’Industria)
Variable Percent Values
Region Campani
a Puglia Basilicata Calabria Sicilia Sardegna Italy
Total number of firm/projects # 2,735 1,854 469 1,541 1,736 469 10,315 Size Small 87.64 89.16 84.22 94.48 88.02 78.04 84.68 Medium 6.36 6.42 5.76 3.37 6.45 10.66 8.88 Large 6 4.42 10.02 2.14 5.53 11.3 6.44 Subsidised 43.58 44.66 33.9 31.8 44.76 52.88 42.89 Sector of activity Building 10.79 11.33 15.99 12.85 9.79 8.1 10.19 Energy 0.84 0.76 1.28 1.23 0.46 0.85 0.89 Mining 0.69 1.67 1.71 0.71 2.13 6.82 1.57 Manufacturing 70.53 73.73 69.94 71.32 69.12 65.03 73.17 Services 17.15 12.51 11.09 13.89 18.49 19.19 14.18 Investment type Leasing 0.55 0.38 0.64 0.13 0.23 1.07 1.13 Standard 93.86 93.69 94.24 99.35 95.85 89.77 90 Mixed 5.59 5.93 5.12 0.52 3.92 9.17 8.87 EU cofinancing 93.78 93.15 95.52 90.27 87.85 93.82 90.03 Employees at the moment of the application 20.36 24.43 35.53 7.2 22.38 23.29 27.78 Age** 10.8 10.98 12.87 10.38 11.86 12.2 12.08
# 1,511 projects are not realised in the South of Italy . * Average number of employees.
Table 2.1 - Law 488\92 (8th call). Descriptive features of investment aid beneficiaries
REGIONS Financed projects
Investment (billions of euros) Subsidies (billions of euros) Employment impact of the program Investment per financed project (millions of euros) Subsidies per financed project (millions of euros) Employment impact per financed project Average investment cost per additional worker employed (millions of euros) Average subsidy cost per additional worker employed (millions of euros) CAMPANIA 1,051 2.1 0.7 21,297 2,083 647 20.264 0.102 0.031 PUGLIA 906 1.6 0.5 18,104 1,795 532 19.983 0.089 0.026 BASILICATA 182 0.6 0.1 3,735 3,139 855 20.519 0.152 0.041 CALABRIA 476 1.0 0.4 9,765 2,127 817 20.515 0.103 0.039 SICILIA 789 2.0 0.7 13,639 2,597 884 17.286 0.150 0.051 SARDEGNA 263 0.8 0.3 5,245 3,060 1,236 19.942 0.153 0.062 TOTAL 3,667 8.3 2.7 71,785 2,251 744 19.576 0.115 0.038
Source: authors evaluation on the IPI-Ministero delle Attività Produttive database of the Universe of firm/projects admitted to compete for subsidies under the 8th call of the Law 488/92.
Table 2.2 - Law 488\92 (8th call). Descriptive features of investment aid beneficiaries in the simulation without regional criteria
Table 2.2 provides information at regional level on financed projects under the simulation which rules out criteria formulated by regional policymakers from the evaluation (special shortlists and fourth indicator in the ordinary shortlist, see section 2 for details). Results can be compared with those from Table 2.1 to have an indication of the effects of regional criteria in the selection process.
REGIONS Financed projects (billions of Investment euros) Subsidies (billions of euros) Employment impact of the program Investment per financed project (millions of euros) Subsidies per financed project (millions of euros) Employment impact per financed project Average investment cost per additional worker employed (millions of euros) Average subsidy cost per additional worker employed (millions of euros) CAMPANIA 1,219 1.91 0.60 20,341 1,570 497 16.687 0.093 0.029 PUGLIA 862 1.27 0.41 16,734 1,643 481 19.413 0.084 0.024 BASILICATA 199 0.40 0.11 3,590 2,030 574 18.042 0.112 0.032 CALABRIA 499 0.81 0.30 8,569 1,635 608 17.172 0.095 0.035 SICILIA 806 1.70 0.61 13,064 2,112 764 16.209 0.130 0.046 SARDEGNA 276 0.77 0.31 5,187 2,793 1,134 18.794 0.148 0.060 TOTAL 3,861 7.02 2.36 67,486 1,819 613 17.479 0.104 0.035
Source: authors evaluation on the IPI-Ministero delle Attività Produttive database of the Universe of firm/projects admitted to compete for subsidies under the 8th call of the Law 488/92.
Tables 3.1-3.2 Consistency of ex post financing choices with formal regional priorities on selected areas and industries
Regional policymakers formalize their priorities for the selection of beneficiaries ex Law 488/92 by creating special shortlists or by attributing more points for selected industries or areas in the ordinary shortlist (under the appositely created fourth indicator which is added to the three traditional ones of "financial independence" (the ratio of subsidy required from beneficiaries to the maximum amount of disbursable subsidy), "employment impact" (the number of new workers hired per currency unit of subsidised investment) and "investment independence", see section 2 for details). In these tables we analyse consistency of ex post financing choices with ex ante formally declared regional priorities on selected areas and industries (see Tables A.1-A.2 in Appendix). We classify as positive all cases in which the industry or area selected as regional priority has a higher number of financed projects than those that would be financed in the simulated selection which excludes one of the two regional criteria (fourth indicator in the ordinary shortlist or the special shortlist). We classify as paradoxes all cases in which the inequality is reverted. A high share of paradoxes indicates weak consistency between ex post financing choices and ex ante declared regional priorities
Table 3.1 Simulation which excludes the special shortlists
TOP RANKING SELECTED INDUSTRIES
TOP RANKING SELECTED AREAS INTERMEDIATE RANKING SELECTED INDUSTRIES
INTERMEDIATE RANKING SELECTED AREAS
N. OF CASES
POSITIVE PARADOXES N. OF CASES
POSITIVE PARADOXES N. OF CASES POSITIVE PARADOXES N.OF CASES POSITIVE PARADOXES
CAMPANIA - - - 135 3% 27.4% 35 8.6% 65.7% - - - PUGLIA 8 75% 25% - - - 187 26.7% 29.4% BASILICATA 17 64.7% 5.9% 17 100% 0 12 25% 16.7% - - - CALABRIA 8 62.5% 25% - - - 183 27.3% 10.4% SICILIA 7 71.4% 0 12 75% 0 24 70.9% 8.3% - - - SARDEGNA - - - 9 66.7% 0 32 9.4% 31.2% - - -
Table 3.2 Simulation which excludes the fourth indicator of the ordinary shortlist
TOP RANKING SELECTED INDUSTRIES
TOP RANKING SELECTED AREAS INTERMEDIATE RANKING SELECTED INDUSTRIES
INTERMEDIATE RANKING SELECTED AREAS
N. OF CASES
POSITIVE PARADOXES N. OF CASES
POSITIVE PARADOXES N. OF CASES POSITIVE PARADOXES N.OF CASES POSITIVE PARADOXES
CAMPANIA - - - 35 14.3% 65.7% 294 16% 40.5% PUGLIA 12 66.7% 16.7% - - - 22 13.6% 68.2% 187 24.6% 15.5% BASILICATA 17 35.3% 5.9% 5 20% 20% 12 0 50% 58 8.6% 29.3% CALABRIA 22 40.9% 4.5% - - - 8 0 87.5% 183 12.6% 24.6% SICILIA 16 87.5% 0 - - - 15 20% 73.3% 197 18.8% 20.8% SARDEGNA - - - 25 32% 16% 32 15.6% 25% 65 3.1% 27.7%
Figure 1 The four subgrgoups of applicants for subsidies from L.488/92 (8° call)
Our empirical analysis is based on the comparison of features of two subsets of applicants : those of winners with those of would be winners in the simulation without considering regional criteria (fourth indicator in ordinary and special shortlist and criteria of the special shortlist, see section 2 and Tables A.1-A.2 for details). The intersection of these two sets generates four subsets: i) “regional winners” (firms/projects which are subsidy recipients but would not be winners in the simulation without regional criteria); ii)
“nonetheless winners” (firms/projects which are subsidy recipients and would be winners also in the simulation without regional criteria); iii) “regional losers” (firms/projects
which are not subsidy recipients but would be winners in the simulation without regional criteria); iv) “nonetheless losers” (firms/projects which are not subsidy recipients and
would not be winners also in the simulation without regional criteria).
Subsidy recipients ex 8° call
“nonetheless winners” (n. of obs. 1836)
Subsidy recipients in the simulation without regional criteria
“regional winners” (n. of obs. 1762)
“regional losers”
(n. of obs. 728) “nonetheless losers”
(n. of obs.5989)
Tables 4.1-4.3 Descriptive features of the four subgroups
Our empirical analysis is based on the comparison of features of two subsets of applicants (those of winners with those of “would be winners” in the simulation which excludes regional criteria (fourth indicator in the ordinary and in the special shortlist and criteria of the special shortlist, see section 2 and Tables A.1-A.2 for details). The intersection of these two groups generates four subsets: i) “regional winners” (firms/projects which are subsidy recipients but would not be winners in the simulation without regional criteria); ii)
“nonetheless winners” (firms/projects which are subsidy recipients and would be winners also in the
simulation without regional criteria); iii) “regional losers” (firms/projects which are not subsidy recipients
but would be winners in the simulation without regional criteria); iv) “nonetheless losers” (firms/projects
which are not subsidy recipients and would not be winners also in the simulation without regional criteria).
Variable legend: employment growth is (ET-E0)/ET where ET is total expected employees after the realization
of the plan and E0 is total employees before the realization of the plan. Project length is calculated as the
difference between the starting date and the (expected) completion date of the plan
Table 4.1 Total effect (Simulated shortlists abstracting from regional criteria are calculated withouth special shortlist and fourth indicator from the ordinary shortlist)
Regional
winners Nonetheless winners Regional losers Nonetheless losers
EMAS 86.32% 84.58% 78.43% 45.88%
ECOAUDIT 11.80% 13.61% 13.61% 34.46%
EMAS+ECOAUDIT 98.12% 98.19% 92.04 80.34%
Firm Age 9.54 10.66 14.20 12.99
Project length 2.11 1.94 1.94 1.91
Share of small sized firms 92.05% 88.12% 88.14% 81.76%
Share of large sized firms 4.71% 5.82% 8.92% 11.03%
Share of new settlements 58.62% 50.05% 11.26% 32.76%
European cofinancing 93.53% 92.53% 91.48% 88.06%
Artisan firms 20.43% 18.40% 15.79% 17.23%
Employment growth 79.65% 73.53% 51.39% 59.59%
Table 4.2 Special shortlist effect only (Simulated shortlists which eliminate regional criteria are calculated withouth special shortlist)
Regional
winners Nonetheless winners Regional losers Nonetheless losers
EMAS 76.48% 86.68% 86.51% 47.20%
ECOAUDIT 17.81% 12.03% 12.43% 33.98%
EMAS+ECOAUDIT 94.29% 98.71% 98.94% 81.18%
Firm Age 10.20 10.11 12.38 13.17
Project length 2.07 2.02 2.14 1.90
Share of small sized firms 90.41% 90.00% 85.19% 81.61%
Share of large sized firms 6.16% 5.16% 6.08% 11.09%
Share of new settlements 41.32% 56.04% 42.06% 29.74%
European cofinancing 99.32% 92.15% 74.34% 89.27%
Artisan firms 27.40% 18.29% 9.52% 17.53%
Employment growth 72.14% 77.15% 67.94% 58.16%
Table 4.3 Fourth indicator only (Simulated shortlists which eliminate regional criteria are calculated withouth fourth indicator)
Regional
winners Nonetheless winners Regional losers Nonetheless losers
EMAS 79.96% 86.25% 78.43% 45.88%
ECOAUDIT 19.18% 11.77% 18.82% 34.46%
EMAS+ECOAUDIT 99.14% 98.02% 87.25% 80.34%
Firm Age 9.14 10.26 14.20 12.99
Project length 2.14 2.01 1.95 1.91
Share of small sized firms 93.32% 89.57% 82.14% 81.77%
Share of large sized firms 5.17% 5.30% 8.93% 11.04%
European cofinancing 93.32% 92.98% 91.48% 88.06%
Artisan firms 17.67% 19.66% 15.80% 17.23%
Table 5 Synthesis of econometric findings on differences between priorities of regional and national policymakers
The Table documents whether the row header regressor is significant in i) the probit model in which the dependent variable is one if the project has been financed and zero otherwise (column one); ii) the probit model in which the dependent variable is one if the project is regional winner and zero otherwise, but its significance disappears when dummies for inclusion in special shortlist are added in the regression (column two); iii) the probit model in which the dependent variable is one if the project is regional winner and zero otherwise and its significance does not disappear when dummies for inclusion in special shortlist are added in the regression (column three); iv) the second equation of the SUR model described in section 4.1 in which the dependent variable is a dummy for new settlements; v) the first equation of the SUR model described in section 4.1 in which the dependent variable is one if the project is regional winner and zero otherwise. Variable legend: employment growth is (ET-E0)/ET where ET is total expected employees after the realization
of the plan and E0 is total employees before the realization of the plan. Project length is calculated as the
difference between the starting date and the completion date of the plan.
Significant impact on the selection of beneficiarie s Discriminat ing between region and governmen t criteria only due to the formal requiremen teffect* Discriminating between region and government criteria beyond formal requirements Discriminati ng between region and government criteria (also) because of the emphasis on new settlement Discriminati ng between region and government criteria beyond the emphasis on new settlement Strong evidence
Subsidy cost of additional
workers employed Yes(+) No Yes(+) Yes(+) Yes(+)
Born with susbidies Yes(-) Yes(-) No Yes(+) Yes(-)
Mixed evidence
EMAS+ECOAUDIT Yes(+) No No No No
Firm Age Yes(-) No Yes(-) Yes(-) No
Project length Yes(-) No Yes(+) Yes(+) No
Share of small sized firms No No Yes(+) Yes(-) Yes(+)
Share of large sized firms Yes(-) No Yes(+) No Yes(+)
Share of new settlements Yes(+) No Yes(+)
European cofinancing Yes(+) No Yes(+) Yes(+) Yes(+)
Artisan firms Yes(+) No Yes(+) Yes(-) No