2020-12-17T17:45:44Z
Acceptance in OA@INAF
Are long gamma-ray bursts biased tracers of star formation? Clues from the host
galaxies of the Swift/BAT6 complete sample of bright LGRBs. III. Stellar masses,
star formation rates, and metallicities at z > 1
Title
Palmerio, J. T.; Vergani, S. D.; SALVATERRA, Ruben; Sanders, R. L.; Japelj, J.; et
al.
Authors
10.1051/0004-6361/201834179
DOI
http://hdl.handle.net/20.500.12386/28956
Handle
ASTRONOMY & ASTROPHYSICS
Journal
623
Number
https://doi.org/10.1051/0004-6361/201834179 c J. T. Palmerio et al. 2019
Astronomy
&
Astrophysics
Are long gamma-ray bursts biased tracers of star formation? Clues
from the host galaxies of the Swift/BAT6 complete sample
of bright LGRBs
III. Stellar masses, star formation rates, and metallicities at
z
> 1
J. T. Palmerio
1,2, S. D. Vergani
2,1,3, R. Salvaterra
4, R. L. Sanders
5, J. Japelj
6, A. Vidal-García
1,7, P. D’Avanzo
3,
D. Corre
8, D. A. Perley
9, A. E. Shapley
5, S. Boissier
8, J. Greiner
10, E. Le Floc’h
11, and P. Wiseman
12,10 1 Sorbonne Université, CNRS, UMR7095, Institut d’Astrophysique de Paris, 75014 Paris, Francee-mail: [email protected]
2 GEPI, Observatoire de Paris, PSL University, CNRS, 5 Place Jules Janssen, 92190 Meudon, France 3 INAF – Osservatorio Astronomico di Brera, Via E. Bianchi 46, 23807 Merate, Italy
4 INAF – IASF Milano, Via E. Bassini 15, 20133 Milano, Italy
5 Department of Physics & Astronomy, University of California, Los Angeles, 430 Portola Plaza, Los Angeles, CA 90095, USA 6 Anton Pannekoek Institute for Astronomy, University of Amsterdam, Science Park 904, 1098 XH Amsterdam, The Netherlands 7 LERMA/LRA, École Normale Supérieure, PSL University, Observatoire de Paris, CNRS, Sorbonne Universités, UPMC Univ.
Paris 06, 75005 Paris, France
8 Aix-Marseille Univ., CNRS, CNES, LAM, Marseille, France
9 Astrophysics Research Institute, Liverpool John Moores University, 146 Brownlow Hill, Liverpool L3 5RF, UK 10 Max-Planck-Institute für Extraterrestrische Physik (MPE), Giessenbachstrasse 1, 85748 Garching, Germany
11 Laboratoire AIM-Paris-Saclay, CEA/DSM/Irfu - CNRS - Université Paris Diderot, CEA-Saclay, 91191 Gif-sur-Yvette, France 12 School of Physics and Astronomy, University of Southampton, Southampton SO17 1BJ, UK
Received 3 September 2018/ Accepted 8 January 2019
ABSTRACT
Aims. Long gamma-ray bursts (LGRB) have been proposed as promising tracers of star formation owing to their association with the core-collapse of massive stars. Nonetheless, previous studies we carried out at z < 1 support the hypothesis that the conditions necessary for the progenitor star to produce an LGRB (e.g. low metallicity), were challenging the use of LGRBs as star-formation tracers, at least at low redshift. The goal of this work is to characterise the population of host galaxies of LGRBs at 1 < z < 2, investigate the conditions in which LGRBs form at these redshifts and assess their use as tracers of star formation.
Methods. We performed a spectro-photometric analysis to determine the stellar mass, star formation rate, specific star formation rate and metallicity of the complete, unbiased host galaxy sample of the Swift/BAT6 LGRB sample at 1 < z < 2. We compared the distribution of these properties to the ones of typical star-forming galaxies from the MOSDEF and COSMOS2015 Ultra Deep surveys, within the same redshift range.
Results. We find that, similarly to z < 1, LGRBs do not directly trace star formation at 1 < z < 2, and they tend to avoid high-mass, high-metallicity host galaxies. We also find evidence for an enhanced fraction of starbursts among the LGRB host sample with respect to the star-forming population of galaxies. Nonetheless we demonstrate that the driving factor ruling the LGRB efficiency is metallicity. The LGRB host distributions can be reconciled with the ones expected from galaxy surveys by imposing a metallicity upper limit of log OH ∼ 8.55. We can determine upper limits on the fraction of super-solar metallicity LGRB host galaxies of ∼20%, 10% at z < 1, 1 < z < 2, respectively.
Conclusions. Metallicity rules the LGRB production efficiency, which is stifled at Z & 0.7 Z . Under this hypothesis we can expect LGRBs to trace star formation at z > 3, once the bulk of the star forming galaxy population are characterised by metallicities below this limit. The role played by metallicity can be explained by the conditions necessary for the progenitor star to produce an LGRB. The moderately high metallicity threshold found is in agreement with the conditions necessary to rapidly produce a fast-rotating Wolf-Rayet stars in close binary systems, and could be accommodated by single star models under chemically homogeneous mixing with very rapid rotation and weak magnetic coupling.
Key words. gamma-ray burst: general – galaxies: star formation – galaxies: abundances
1. Introduction
Long duration gamma-ray bursts (LGRBs, prompt emission duration longer than 2s) have been shown to be connected to the end of life of massive stars (Woosley 1993;Woosley & Bloom 2006) from their association with core-collapse supernovae (CCSNe; Hjorth et al. 2003). Due to the short-lived nature of
massive stars, LGRBs are thus linked to recent (∼10 Myr) star formation (SF) and it has been suggested that their rate is linked to the global star formation rate (SFR;Porciani & Madau 2001). Complementary to existing methods such as rest-frame UV mea-surements, LGRBs offer therefore a promising method of trac-ing SF up to high redshifts (z ∼ 9 and beyond,Salvaterra et al. 2009, 2013; Tanvir et al. 2009). Indeed, in addition to their
Open Access article,published by EDP Sciences, under the terms of the Creative Commons Attribution License (http://creativecommons.org/licenses/by/4.0),
bright afterglows, even at high redshift (Lamb & Reichart 2000), the detection of LGRBs in the soft γ-ray domain of the elec-tromagnetic spectrum is largely unaffected by dust. Various authors have tried to use LGRBs to estimate the SFR density at high redshift (e.g.Kistler et al. 2008;Robertson & Ellis 2012), however these studies used intrinsically biased and incomplete samples. The importance of using a carefully selected, unbi-ased and complete sample of LGRBs and their host galax-ies has since been recognised and various samples have been designed to address this issue, such as TOUGH (Hjorth et al. 2012), Swift/BAT6 (Salvaterra et al. 2012) and SHOALS (Perley et al. 2016a).
Different studies using the host galaxies of these samples have tried to obtain information on the LGRB efficiency, that is the relation between the LGRB rate and the SFR, fundamen-tal for using LGRBs as tracers of the SFR density. Factors that can impact this relation can be related to the conditions needed for the progenitor star to produce an LGRB. Metallicity is the most commonly invoked factor, as most single-star progenitor models of LGRBs require low metallicity to expel the hydro-gen envelope while keeping enough angular momentum, neces-sary for the production of the GRB jet (e.g. Woosley & Heger 2006; Yoon et al. 2006). Due to the cosmological origin of the majority of LGRBs it is not possible to study directly the progenitor stars, their environment and their remnants. There-fore current studies focus on the properties of the LGRB host galaxies to gather information on the LGRB efficiency. The results obtained to date using complete unbiased samples of LGRB host galaxies (Vergani et al. 2015; Perley et al. 2016b;
Japelj et al. 2016a), agree on the fact that there is a prefer-ence for LGRBs to explode in sub-solar metallicity host galax-ies (see also Bignone et al. 2017 on results using the Illustris simulation). Nonetheless extremely low metallicities are not required, and host galaxies having super-solar metallicities are not excluded (see e.g.Savaglio et al. 2012), even if much rarer than expected from a direct relation between LGRB rate and SFR.
The results obtained from the studies above are based on the comparison of the properties of LGRB host galaxies with those of representative star-forming galaxies sampled through galaxy surveys. Due to the faintness of a considerable fraction of the LGRB host galaxies, to date such a comparison, especially when involving spectroscopically-derived properties (SFR, metallic-ity), has been performed in detail only at z < 1 (Krühler et al. 2015; Japelj et al. 2016a). Improvements of existing photo-metric surveys (e.g. COSMOS2015, Laigle et al. 2016), and the emergence of deep spectroscopic surveys (e.g. VUDS,
Le Fèvre et al. 2015) with access to the near-infrared (e.g. MOS-FIRE Deep Evolution Field, i.e., MOSDEF survey,Kriek et al. 2015) allow us now to investigate the LGRB efficiency by comparing the properties of complete samples of LGRB hosts to samples of typical star-forming field galaxies in detail also at z > 1.
This paper is organised as follows. In Sect.2we present our sample selection, the observations and analysis of our LGRB hosts, and characterise their properties and the evolution of these properties with redshift. In Sect.3we compare our sample with surveys of field galaxies. We discuss our results in more detail in Sect.4and our conclusions are summarised in Sect.5.
All errors are reported at 1σ confidence unless stated other-wise. We use a standard cosmology (Planck Collaboration XVI 2014):Ωm= 0.315, ΩΛ= 0.685, H0 = 67.3 km s−1Mpc−1. The
stellar masses (M∗) and SFRs are determined using the Chabrier
initial mass function (IMF,Chabrier 2003).
2. The Swift/BAT6 sample of LGRB host galaxies at
z
>
12.1. Selection
Our sample is composed of the hsosts of the Swift/BAT6 sam-ple (Salvaterra et al. 2012) of bright (peak flux P15−150 keV ≥
2.6 ph cm−2s−1) LGRBs with favourable observing conditions
for optical follow-up (Jakobsson et al. 2006). This selection results in 58 LGRBs with a 97% redshift completeness, extend-ing up to z ∼ 6. No correlations have been found between the prompt emission properties (peak energy, luminosity) of LGRBs and their host galaxies’ properties (see Levesque et al. 2010;
Japelj et al. 2016a, and Fig.A.1 for our sample up to z = 2). Therefore, by construction, our sample is statistically represen-tative of the whole LGRB host galaxy population (including dark LGRBs,Greiner et al. 2011;Melandri et al. 2012). For the pur-pose of this paper, we restrict ourselves to the redshift range 1 < z < 2 (see Table 1), building on the previous papers of
Vergani et al.(2015) andJapelj et al.(2016a) that considered the z< 1 range.
2.2. Stellar mass
To determine the host galaxy stellar masses we used photomet-ric measurements (typically covering the visible to near-infrared wavelength range) from the literature, complemented with new values that we measured from archival data for GRB 061007, GRB 100615A and GRB 090201. All of the values and refer-ences are reported in TablesA.1andA.2.
We fit the available observational constraints (excluding non-detections1) on the emission-line fluxes and broad-band photometry of the galaxies in our sample using the Bayesian spectral interpretation tool beagle (Chevallard & Charlot 2016; version 11.3). The version of beagle we use relies on the models ofGutkin et al. (2016), who follow the prescription of
Charlot & Longhetti(2001) to describe the emission from stars and the interstellar gas. In particular, the models are computed combining the latest version of the Bruzual & Charlot (2003) stellar population synthesis model with the standard photoioni-sation code cloudy (Ferland et al. 2013). We use three parametri-sations for the star formation histories of model galaxies in beagle constant star-formation, an exponentially declining func-tion ψ(t) ∝ exp(−t/τSFR) and an exponentially delayed
func-tion ψ(t) ∝ t exp(−t/τSFR). For the exponentially declining
and exponentially delayed functions, we let the star formation timescale and the star-formation freely vary in the ranges 7 ≤ log(τSFR/yr) ≤ 11.5 and −4 ≤ log(SFR/M yr−1) ≤ 4. Finally,
we superpose on the exponentially delayed function a current burst with a variable duration of 6 ≤ log(tcurrent/yr) ≤ 9. For the
three star formation histories, we let the age of the galaxy vary in the range 6.0 ≤ log(age/yr) ≤ 10.15 and we adopt a standard
Chabrier(2003) initial mass function. We further adopt the same metallicity for stars and star-forming gas (Z= ZISM) and assume
that all stars in a galaxy have the same metallicity, in the range −2.2 ≤ log(Z/Z ) ≤ 0.25. Finally, we let the stellar mass vary in
the range 4 ≤ log(M∗/M ) ≤ 12.
The stellar mass values reported in Table1 are the median of the probability distribution functions from the best-fitting SFH/attenuation prescription which were chosen as having the lowest χ2 while also having predicted SFRs and metallicities
1However we verified that the results from the SED fitting do not violate the limits imposed by the photometric non-detectrions.
Table 1. Stellar mass, star formation rate and metallicity for the hosts of the BAT6 LGRB sample at 1 < z < 2.
Name Redshift log(M∗/M ) SFR (M /yr) 12+log(O/H) (M08) Mref SFRref Zref
091208B 1.0633 <8.3∗ 3 080413B 1.1012 9.5+0.2−0.2 2.1+3.1−1.2 8.35+0.17−0.29 2 1 2 090926B 1.2427 9.9+0.1−0.1 12.1+23.0−6.5 8.48+0.09−0.16 2 2 2 061007 1.2623 8.9+0.4−0.5 4.4+6.2−2.1 8.13+0.11−0.23 2 2 2 061121 1.3160 9.4+0.1−0.1 58.5+33.8−17.6 8.51+0.03−0.04 2 2 2 071117 1.3293 <9.8† >2.8 8.54+0.13−0.25 2 2 2 100615A 1.3979 8.6+0.2−0.2 8.6+13.9−4.4 8.16+0.18−0.36 2 1 2 050318 1.4436 <8.6∗ 3 070306 1.4965 9.7+0.1−0.1 90.6+49.0−31.0 8.43+0.03−0.04 2 2 2 060306 1.5597 10.4+0.1−0.1 12.4+47.0−7.8 8.91+0.16−0.41 2 2 2 080605 1.6408 9.6+0.1−0.1 42.5+30.5−18.2 8.47+0.04−0.04 2 2 2 050802 1.7117 9.0∗ >1.6 3 2 080602 1.8204 9.4+0.1−0.1 >48 8.69+0.12−0.21 2 2 2 060908 1.8836 9.2∗ 3 060814 1.9223 10.0+0.1−0.1 47.5+72.5−15.6 8.46+0.10−0.16 2 2 2
Notes.∗These galaxies’ stellar mass is computed only from the NIR Spitzer/IRAC1 magnitudes or limits (Perley et al. 2016b; see Sect.2.2).†This galaxy is blended with another source in the IRAC1 observations and partially in the Ksband, therefore we conservatively report is stellar mass as an upper limit.
References. (1)Krühler et al.(2015); (2) this work; (3)Perley et al.(2016b). consistent with the ones measured from spectroscopy. The best fit SED for each fitted host are shown in AppendixA.
In general, the stellar masses found are consistent within errors independently of the SFH or dust attenuation chosen (the only debated case is GRB 061121 for which the stellar mass spans values from 7 × 10⁸ to 2 × 10¹⁰M
, we chose
the stellar mass corresponding to the SFH prescription that yields SFR and metallicity values consistent with the ones derived by spectroscopy; we note that using the stellar mass value of log(M∗/M ) ∼ 10 would not change the results of
our study). The largest dispersion between the stellar mass val-ues obtained from the different SFH and dust attenuation pre-scriptions is ∼0.5 dex. We cross-checked the stellar mass values with the CIGALE SED code (Noll et al. 2009), and values from
Kruehler & Schady (2017), derived using the LePhare SED code (Arnouts et al. 1999;Ilbert et al. 2006). Even if a detailed analysis on the different SED codes to determine stellar masses is far beyond the scope of this paper, we stress that the stellar mass values found are consistent within the errors, and that the overall results of this study would remain unchanged indepen-dently of the choice of the aforementioned codes.
We noticed a discrepancy (see also Corre et al. 2018;
Arabsalmani et al. 2017; Heintz et al. 2017) when computing stellar masses from SED fitting compared to values based on the rest-frame near-infrared (NIR) magnitude only (e.g. from
Perley et al. 2016b, used also inVergani et al. 2017). These stel-lar mass values are mostly overestimated compared to the val-ues derived by SED fitting. This effect is known, especially at lower stellar masses due to the variations in the mass-to-light ratio as a function of stellar mass (Ilbert et al. 2010). It should be noted however thatPerley et al.(2016b) tried to correct for this effect by using a mass-to-light conversion factor that is not simply a linear factor but is a function of z and galaxy lumi-nosity, fitted based on a template model of galaxy evolution. Due to the lack of wide photometric coverage, for 4 of our 15 hosts at 1 < z < 2 (GRB 091208B, GRB 050318, GRB 050802,
GRB 060908) it was not possible to perform a SED fitting, there-fore the stellar masses are computed with the method described inPerley et al.(2016b), with the aforementioned caveats. These values are considered as upper limits in the analysis. However, as explained later (see Sect.3), they are discarded when performing the statistical test of Sect.3as they do not comply with the limits of the surveys.
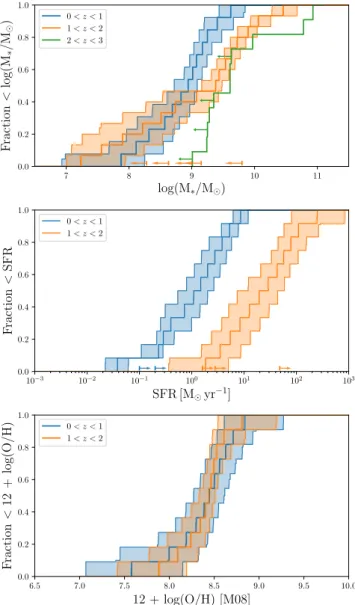
The resulting stellar mass cumulative distribution for the hosts of the BAT6 sample is shown in Fig.1, in the top panel. There is an evolution towards higher median mass between z < 1 and 1 < z < 2. As LGRB host galaxies are selected only by the fact that they host an LGRB explosions, and as we are consid-ering an unbiased and complete sample of LGRB host galax-ies, the stellar mass evolution we find is not a selection effect and is intrinsic to the properties of LGRB host galaxies. Never-theless, we anticipate that higher stellar mass values would be expected considering the SFR determined in Sect.2.3and the relation found between stellar mass and SFR in SF galaxies (e.g.
Shivaei et al. 2015).
We also plot the distribution of the stellar masses or lim-its for the BAT6 LGRB host galaxies at 2 < z < 3 (see TableA.3). Those were determined from rest-frame NIR obser-vations only, and (with the exception of GRB 090201) published byPerley et al.(2016b). The distribution at 2 < z < 3 is riddled with upper limits, and given the different methodology used for the stellar mass determination (and its caveats), we can only ten-tatively conclude that the median stellar mass does not seem to increase significantly with respect to the one at 1 < z < 2.
2.3. Star formation rate and metallicity
SFRs and metallicities were determined using the host galaxy spectra. The data at z > 1 come from the VLT/X-Shooter spec-trograph (Vernet et al. 2011), and the spectra have already been presented inKrühler et al.(2015) andVergani et al.(2017). The large wavelength coverage (3000–25000 Å) and sensitivity of
7 8 9 10 11 log(M∗/M ) 0.0 0.2 0.4 0.6 0.8 1.0 F raction < log(M ∗ /M ) 0 < z < 11 < z < 2 2 < z < 3 10−3 10−2 10−1 100 101 102 103 SFR [M yr−1] 0.0 0.2 0.4 0.6 0.8 1.0 F raction < SFR 0 < z < 1 1 < z < 2 6.5 7.0 7.5 8.0 8.5 9.0 9.5 10.0 12 + log(O/H) [M08] 0.0 0.2 0.4 0.6 0.8 1.0 F raction < 12 + log(O /H) 0 < z < 1 1 < z < 2
Fig. 1. Cumulative distributions of stellar mass (upper panel), SFR
(middle panel) and metallicity (bottom panel) for the hosts of the BAT6 sample at different redshift ranges. Upper and lower limits are repre-sented as arrows at the bottom of the plots. The shaded area represents the 95% confidence interval around the CDFs. The methodology to cre-ate these CDFs is presented in Sect.3.2.
X-Shooter allow us to detect the strongest rest-frame optical emis-sion lines up to z= 2, ensuring a homogeneous methodology for the determination of star formation rates and metallicities.
We performed a new data reduction and analysis of the data, with the standard Esoreflex pipeline (version 2.7.3,
Modigliani et al. 2010) using the nodding recipe. The spatial width of the 2D to 1D spectrum extraction was scaled according to the spatial width of the detected emission lines to maximise the signal to noise ratio. The flux calibration was cross-checked with the host photometry when available, or otherwise with a telluric standard star taken at similar airmass and seeing, to account for any slit loss or absolute calibration inconsistencies (see Japelj et al. 2016a). Emission lines were measured using IRAF2 by fitting a one (or more when relevant) component
2IRAF is distributed by the National Optical Astronomy Observato-ries, which are operated by the Association of Universities for Research in Astronomy, Inc., under cooperative agreement with the National Sci-ence Foundation.
Gaussian function and cross-checked by comparing to the flux resulting from direct integration under the line profile. The resulting fluxes are compiled in Table A.4. In case of a non-detection, a 3σ upper limit is quoted. The measurements are con-sistent within the errors with the values reported byKrühler et al.
(2015) andVergani et al.(2017).
The measured emission line fluxes were corrected for Galac-tic extinction using the extinction curve of Pei(1992) and the extinction map of Schlafly & Finkbeiner (2011). The Balmer line fluxes were not corrected for Balmer absorption due to the absence of a detectable continuum in most hosts and its weak-ness in LGRB hosts as expected from their low stellar masses (Zahid et al. 2011). The fluxes were also corrected for the host intrinsic extinction, with the AV measured using the Balmer
decrement (assuming case B recombination,Osterbrock 1989) and an SMC extinction curve following the findings of for exam-ple (Japelj et al. 2015).
SFRs were determined using the dust-corrected Hα lumi-nosities, following Kennicutt (1998) scaled to the IMF of
Chabrier(2003). In the few cases where it was not possible to correct for dust extinction, the SFRs are reported as lower limits. As shown in Fig.1, panel (b), the median SFR increases from ∼1.3+0.9−0.7M yr−1 at z < 1, to ∼24+24−14M yr−1at 1 < z < 2, in
agreement withKrühler et al.(2015).
Gas phase metallicities are notoriously hard to determine at high redshift by direct electron temperature methods due to the weakness of the [OIII]λ4363 line. Instead, alternative methods based on the calibration of strong line ratios are commonly used. Each calibrator has its own relative scale (seeKewley & Ellison 2008for more details). It is therefore important to use the same method to determine metallicity for all the host galaxy in our sample. Here we infer the metallicity from the method devel-oped byMaiolino et al.(2008; referred to as M08) which relies on multiple calibrators simultaneously, taking advantage of all the emission lines detected. The bottom panel of Fig.1indicates that, contrary to stellar mass and star formation, the metallic-ity distribution of LGRB hosts does not seem to evolve (see also Krühler et al. 2015). This provides a first clue suggest-ing that metallicity is a regulatory factor in the production of LGRBs, which is in line with previous studies (Vergani et al. 2015;Perley et al. 2016b).
3. Comparison with the star-forming galaxy population
If we assume that LGRBs are direct tracers of SF, then more SF equates to a higher chance of producing an LGRB (for a fixed stellar IMF). Hence from a statistical point of view we expect the various distributions of the properties of LGRB hosts to follow the ones of the general population of star-forming galaxies weighted by their SFR. The lack of agree-ment between these distributions can be an indication of a factor regulating the production of LGRBs. Vergani et al.
(2015) and Japelj et al. (2016a) have already shown discrep-ancies between the distributions of the Swift/BAT6 LGRB hosts properties and the SFR-weighted ones of star-forming galaxies at z < 1, (see also Krühler et al. 2015, Perley et al. 2016b and Schulze et al. 2015 tackling the same issue using other samples). Here we aim to extend this analysis to higher redshift. Owing to a low number of objects and, in some cases, limits or large errors, we employ a Bayesian approach to provide robust statistical estimates, which we describe in Sect.3.2.
8.5 9.0 9.5 10.0 10.5 11.0 11.5 12.0 log(M∗/M ) 0.0 0.2 0.4 0.6 0.8 1.0 F raction < log(M ∗ /M ) COSMOS BAT6 0.2 0.4 0.6 0.8 1.0 D-statistic 0.0 2.5 5.0 7.5 10.0 Normalized densit y −3 −2 −1 log(p-value) 0.0 0.5 1.0 1.6%≥ 0.05 8.5 9.0 9.5 10.0 10.5 11.0 11.5 12.0 log(M∗/M ) 0.0 0.2 0.4 0.6 0.8 1.0 F raction < log(M ∗ /M ) MOSDEF BAT6 0.2 0.4 0.6 0.8 1.0 D-statistic 0 2 4 6 Normalized densit y −5 −4 −3 −2 −1 log(p-value) 0.0 0.2 0.4 0.6 0.8 0.0%≥ 0.05
Fig. 2.Top panels: cumulative stellar mass distribution for the hosts of the BAT6 sample (orange) and the star-forming galaxies from the
COS-MOS2015 Ultra Deep catalogue (blue, left panel) and MOSDEF (blue, right panel) at 1 < z < 2. The COSCOS-MOS2015 Ultra Deep and MOSDEF CDFs are weighted by SFR. Limits are indicated by arrows at the bottom of the plot. Bottom panels: normalised histogram of the maximum distance between the BAT6 and the survey CDFs for each Monte Carlo realisation and of the p-value from the two-sample K–S test computed for each Monte Carlo realisation. The black curve represents the Gaussian kernel density estimation. The vertical dashed line indicates a p-value of 0.05, above which it is no longer possible to reject the null hypothesis that the two samples are drawn from the same distribution at a 95% confidence level.
3.1. Comparison samples 3.1.1. COSMOS 2015 Ultra Deep
The COSMOS2015 (Laigle et al. 2016) is a deep (Ks ≤ 24.7)
photometric survey of half a million galaxies at z < 6, with wavelength coverage from the near-UV to the infrared. Within this catalogue we selected the star-forming galaxies of the COS-MOS2015 Ultra Deep stripes (COSCOS-MOS2015UD) from the ESO phase 3 archive system3. The advantage of COSMOS2015UD relies in the large number of objects (∼104−5) with available
stellar masses and accurate photometric redshifts. These stellar masses were determined by SED fitting with the LePhare code using a Chabrier (2003) IMF (see Ilbert et al. 2015 for more details). While comparing the properties of the BAT6 LGRB host galaxies with COSMOS2015UD, we take into account its redshift-dependent mass completeness and remove the LGRB hosts with stellar masses below this limit, resulting in a compari-son sub-sample of ten hosts at 1 < z < 2. The COSMOS2015UD SFR are dust-corrected and obtained from SED fitting without the Infrared photometry4.
3.1.2. The MOSDEF survey
The MOSDEF survey (Kriek et al. 2015) is a deep near-infrared spectroscopic survey of galaxies at 1.37 ≤ z ≤ 3.80 that was carried out using the Multi-Object Spectrometer for Infra-Red Exploration (MOSFIRE,McLean et al. 2012) on the 10 m Keck I telescope. Targets were selected in three redshift ranges (1.37 ≤ z ≤ 1.70, 2.09 ≤ z ≤ 2.61, and 2.95 ≤ z ≤ 3.80) in which strong rest-frame optical emission lines fall in bands of atmospheric transmission in the near-infrared. For comparison to the Swift/BAT6 LGRB hosts at 1 < z < 2, we make use of MOSDEF galaxies in the lowest of these three redshift ranges, at z ∼ 1.5. Galaxies were targeted down to fixed rest-optical
3http://www.eso.org/qi/ 4http://www.eso.org/rm/api/v1/public/ releaseDescriptions/100 9.0 9.5 10.0 10.5 11.0 log(M∗/M ) 10−2 10−1 100 Normalized efficiency 100 101 102 103 SFR [M yr−1] 10−2 10−1 100 Normalized efficiency −11 −10 −9 −8 −7 −6 log(sSFR [yr−1]) 10−2 10−1 100 Normalized efficiency 8.0 8.2 8.4 8.6 8.8 9.0 12 + log(O/H) [M08] 10−2 10−1 100 Normalized efficiency
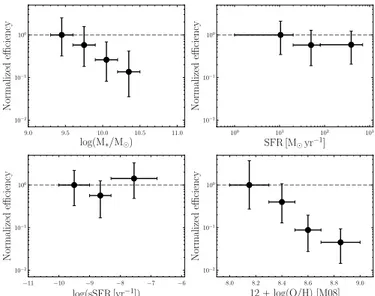
Fig. 3.Normalised efficiency of LGRB hosts compared to the MOSDEF
sample at 1 < z < 2 as a function of stellar mass (top left panel), SFR (top right panel), sSFR (bottom left panel) and metallicity (bottom right panel). The values are normalised to the first bin. The horizontal grey dashed line indicates a value of 1 to guide the eye.
(observed H-band) magnitudes (HAB ≤ 24.0 at z ∼ 1.5). We
select galaxies with detections of both Hα and Hβ at S /N ≥ 3 such that reddening-corrected SFR can be determined. Requir-ing detections of both Hα and Hβ does not significantly bias the MOSDEF sample above log(M∗/M ) ∼ 9.5 (Shivaei et al.
2015; Sanders et al. 2018). AGN were excluded following the prescriptions described in Shivaei et al. (2015) and references therein. This selection results in a MOSDEF comparison sam-ple of 133 galaxies ranging in redshift from 1.37 to 1.73 with zmed= 1.53.
SFRs were calculated based on reddening-corrected Hα luminosity using the Kennicutt (1998) calibration with the
Chabrier(2003) IMF, the measured Balmer decrement (Hα/Hβ), and theCardelli et al.(1989) Milky Way extinction curve. The MOSDEF stellar masses (see Sanders et al. 2018) were esti-mated by fitting flexible stellar population synthesis models (Conroy et al. 2009) to photometry spanning the observed opti-cal to mid-infrared using the SED fitting code FAST (Kriek et al. 2009). Solar metallicity, delayed star formation histories, the
Calzetti et al. (2000) dust reddening curve, and the Chabrier
(2003) IMF were assumed for the SED fitting. For comparison with the LGRB host galaxies, SFR(Hα) and stellar mass values were calculated assuming thePlanck Collaboration XVI(2014) cosmology5, the same as for the BAT6 host sample.
The MOSDEF metallicities used in this paper were deter-mined using the M08 method, in the same way as for the hosts of the BAT6 sample (see Sect.2.3). Of the 133 galaxies in the MOSDEF comparison sample, 127 have sufficient emission line information to calculate metallicities using the M08 method. When comparing this MOSDEF sample with the BAT6 LGRB host galaxies, we excluded from the comparison 6 LGRB hosts with log(M∗/M ) < 9.3 because they fall in a stellar mass range
in which the MOSDEF sample is significantly incomplete. This results in a BAT6 comparison sub-sample of 9 LGRB hosts. We note that the SFRs of the LGRB host galaxies in the BAT6 com-parison sub-sample fall within the SFR range of the MOSDEF comparison sample.
3.2. Bayesian framework
Our calculations rely on the assumption that the probability dis-tribution function (PDF) for our data can be reasonably well described by an asymmetric Gaussian distribution for which the scale parameter is given by the asymmetric errors and the loca-tion parameter is given by the value quoted in our table. For example, the PDF of a quantity µ+σp
−σm is given by: PDF(x)= A exp(−(x−µ)2 2 σ2 p ) if x ≥ µ, exp(−(x−µ)2 σ22 m ) if x < µ, (1)
where A is the normalisation given by:
1= Z +∞
−∞
PDF(x) dx. (2)
In the event of upper limits on the stellar mass of our galax-ies, we use a uniform distribution (uninformative prior) between log(M∗/M )= 7 and the upper limit for the comparison of BAT6
sample at different redshifts; when comparing with the COS-MOS2015UD and MOSDEF surveys, the lower stellar mass limit is set to the mass completeness of the survey6. For lower limits on the SFR or the specific SFR (sSFR; objects for which no extinction could be derived), we use a uniform distribution between the limit and a maximum SFR calculated by assum-ing an AV of 4. We then estimate the median and 95%
confi-dence bounds on our cumulative distribution functions (CDFs), by computing 10 000 Monte Carlo realisations of our data sam-pling from the aforementioned PDFs, this confidence interval is represented as a shaded area in the figures showing CDFs. In a similar fashion, we computed 10 000 realisations of the K–S test
5The papers published previously in the MOSDEF collaboration used a different cosmology.
6The mass completeness of the COSMOS2015UD survey varies with redshift; the value used as lower limit is the mass completeness at the redshift of the host.
7.5 8.0 8.5 9.0 9.5 10.0 10.5 11.0 log(M ∗ /M ) COSMOS2015UD median BAT6 median 0.0 0.5 1.0 1.5 2.0 2.5 3.0 Redshfit (z) 0 1 Residuals
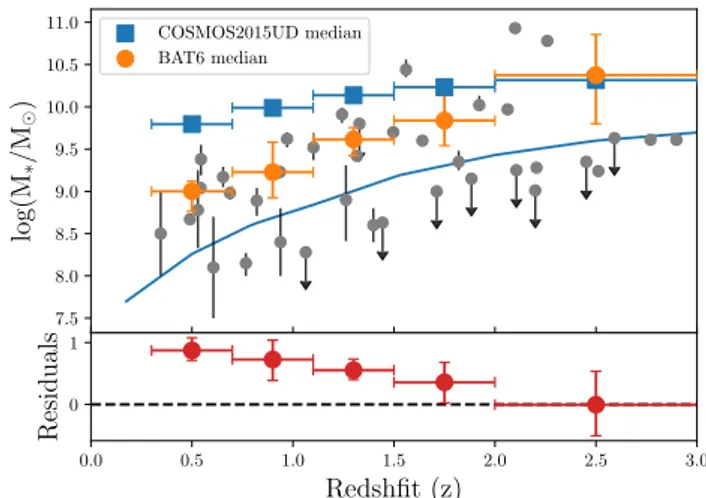
Fig. 4.Top panel: stellar mass as a function of redshift. The grey circles
are the individual host galaxies of the BAT6 sample; the orange circles represent the median stellar mass at each redshift bin for hosts above the COSMOS2015UD mass completeness. The blue squares represent the median of the SFR-weighted stellar mass distribution of the COS-MOS2015UD sample at each redshift bin. The blue line is the mass completeness of the COSMOS2015UD sample. Bottom panel: residu-als of the difference between the blue and orange points. The errors are computed using Monte Carlo propagation and bootstrapping.
for each individual CDF when comparing with the MOSDEF and COSMOS2015UD samples7.
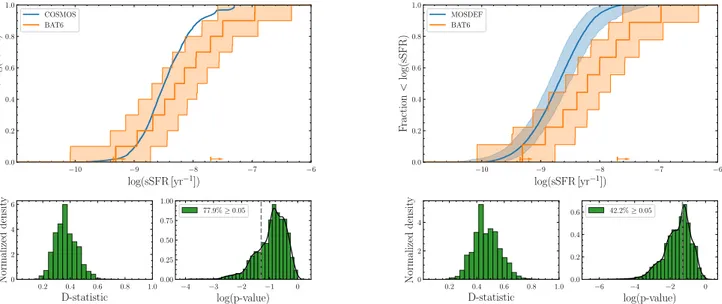
3.3. Stellar mass
The top left panel of Fig. 2 shows the stellar mass cumula-tive distribution of the hosts of the BAT6 sample compared to the SFR-weighted distribution of the star-forming field galax-ies of the COSMOS2015UD at 1 < z < 2. The distribution of D-statistic and p-values from 10 000 Monte Carlo realisa-tions of the 2 sample K–S test are shown in the bottom panels, indicating that the vast majority of realisations exclude the null hypothesis that the two samples are drawn from the same dis-tribution at the 95% confidence level. It should be noted (see Sect.3.1.1) that the SFR used to weight the COSMOS2015UD distribution are obtained from SED fitting. It has been shown that SFRs determined in such way can be underestimated at SFRs higher than ∼50 M yr−1(e.g.Reddy et al. 2015;Lee et al.
2015). This corresponds to ∼12% of the COSMOS2015UD SF galaxies. Considering that high SFR values are normally associ-ated with high stellar mass galaxies, this underestimation would have the effect of increasing the discrepancy between the two distributions. However, we note also that there is a good consis-tency between the COSMOS2015UD and MOSDEF (see below) SFR-weighted distributions. These considerations are also valid for the SFR-weighted SFR and sSFR distributions presented in the following sections.
In the right panels of Fig. 2, the same comparison is performed with the star-forming galaxies of the MOSDEF survey. In this case the SFR used is that determined from the dust-corrected Hα luminosities. We computed 10 000 MC realisations of both the BAT6 and the MOSDEF sample with the assumptions described in Sect.3.2, with the difference that each galaxy in the MOSDEF sample is weighted by the
realisa-7For the COSMOS2015UD sample, the CDF built from the median values reported in the catalogue was used due to the size of the sample which makes this method statistically less relevant and computationally expensive.
10−1 100 101 102 103 104 SFR [M yr−1] 0.0 0.2 0.4 0.6 0.8 1.0 F raction < SFR COSMOS BAT6 0.2 0.4 0.6 0.8 1.0 D-statistic 0 2 4 6 Normalized densit y −2.0 −1.5 −1.0 −0.5 0.0 log(p-value) 0.0 0.5 1.0 1.5 2.0 99.5%≥ 0.05 10−1 100 101 102 103 104 SFR [M yr−1] 0.0 0.2 0.4 0.6 0.8 1.0 F raction < SFR MOSDEF BAT6 0.2 0.4 0.6 0.8 1.0 D-statistic 0 1 2 3 4 Normalized densit y −4 −2 0 log(p-value) 0.0 0.2 0.4 0.6 0.8 79.7%≥ 0.05
Fig. 5.Top panels: cumulative SFR distribution for the hosts of the BAT6 sample (orange) and the star-forming galaxies from the COSMOS2015
Ultra Deep catalogue (blue, left panel) and MOSDEF (blue, right panel) at 1 < z < 2. The COSMOS2015 Ultra Deep and MOSDEF CDFs are weighted by SFR. Limits are indicated by arrows at the bottom of the plot. Bottom panels: see Fig.2.
−10 −9 −8 −7 −6 log(sSFR [yr−1]) 0.0 0.2 0.4 0.6 0.8 1.0 F raction < log(sSFR) COSMOS BAT6 0.2 0.4 0.6 0.8 1.0 D-statistic 0 2 4 6 Normalized densit y −4 −3 −2 −1 0 log(p-value) 0.00 0.25 0.50 0.75 1.00 77.9%≥ 0.05 −10 −9 −8 −7 −6 log(sSFR [yr−1]) 0.0 0.2 0.4 0.6 0.8 1.0 F raction < log(sSFR) MOSDEF BAT6 0.2 0.4 0.6 0.8 1.0 D-statistic 0 2 4 Normalized densit y −6 −4 −2 0 log(p-value) 0.0 0.2 0.4 0.6 42.2%≥ 0.05
Fig. 6.Top panels: cumulative sSFR distribution for the hosts of the BAT6 sample (orange) and the star-forming galaxies from the COSMOS2015
Ultra Deep catalogue (blue, left panel) and MOSDEF (blue, right panel) at 1 < z < 2. The COSMOS2015 Ultra Deep and MOSDEF CDFs are weighted by SFR. Limits are indicated by arrows at the bottom of the plot. Bottom panels: see Fig.2.
tion of its SFR. For each realisation, we compute the 2 sample K–S test which yields a distribution of p-values firmly excluding the possibility that LGRB hosts are drawn from the same stel-lar mass distribution as that of MOSDEF galaxies weighted by their SFR.
Another way to look at the discrepancy of the distributions and have some information on the behaviour of the LGRB e ffi-ciency as a function of the stellar mass is to use the method pre-sented by Boissier et al.(2013), and used also inVergani et al.
(2015). In the present work, instead of using galaxy mod-els, in Fig. 3 we compare the LGRB host galaxies directly with the MOSDEF star-forming galaxies. The efficiency here is defined as the fraction of LGRB hosts divided by the fraction of MOSDEF galaxies in a given stellar mass or metallicity bin. The results are normalised to the first bin value. We apply this method also for the galaxy properties presented in the following sections (SFR, sSFR, and metallicity; see Fig.3).
We also investigated the evolution of the median stellar mass with redshift for the BAT6 hosts compared to the SFR-weighted COSMOS2015UD sample, presented in Fig.4. The discrepancy between the BAT6 hosts and the SFR-weighted field galaxies is most notable at low redshift and decreases up to z = 3 as is shown in the bottom panel, although the last redshift bin is to be taken cautiously due the low number of hosts within it. Addi-tionally, the stellar masses of the LGRB hosts in the last redshift bin (2 < z < 3) are derived using a different methodology (see Sect. 2.2). With these caveats in mind, this trend is consistent with the observations ofPerley et al. 2016b(see alsoHunt et al. 2014).
3.4. Star formation rate
The top panels of Fig. 5 show the SFR cumulative distribu-tion of hosts of the BAT6 sample compared to SFR-weighted
8.0 8.5 9.0 9.5 10.0 10.5 11.0 11.5 log(M∗/M⊙) −0.5 0.0 0.5 1.0 1.5 2.0 2.5 3.0 lo g( S F R /M ⊙ y r − 1) no metallicity 1≤ z ≤ 2 MOSDEF 1≤ z ≤ 2 GRB hosts 7.8 8.0 8.2 8.4 8.6 8.8 9.0 9.2 12 + lo g( O /H )
Fig. 7.SFR versus stellar mass plot for the BAT6 sample at 1 < z < 2
(squares). The circles are from the MOSDEF sample at 1 < z < 2. The red line is the best fit to the MOSDEF data and the dotted lines represent the intrinsic scatter, following the method ofShivaei et al.(2015). The points are coloured by metallicity in the M08 calibrator. Galaxies where no metallicity could be measured are coloured in grey with a cross. distribution of star-forming field galaxies of COSMOS2015UD and MOSDEF at 1 < z < 2. As confirmed by the p-value distri-bution, there is good agreement between the two distributions.
The top panels of Fig. 6 show the specific SFR (sSFR, defined as SFR/M∗) cumulative distribution of hosts of the
BAT6 sample compared to the SFR-weighted distribution of star-forming field galaxies of COSMOS2015UD and MOSDEF at 1 < z < 2. The p-value distribution in the bottom panels indi-cates that in the majority of cases we cannot exclude the null hypothesis that the two samples are drawn from the same dis-tribution for the COSMOS2015UD sample, while for the MOS-DEF sample, it is less definitive since the p-value distribution peaks around 0.05. In ∼40% of cases, we cannot discard the null hypothesis at the 95% confidence.
We note that we could not determine the SFR for three host galaxies. Nonetheless their stellar masses were lower than the stellar mass completeness of the surveys. Therefore, when com-paring with surveys our sample is still complete.
In Figs. 7 and8 we plot the BAT6 host galaxies and the MOSDEF star-forming galaxies in the SFR, sSFR vs stellar mass plane, respectively. We fit the SFR vs stellar mass relation (so-called Main Sequence, e.g.Whitaker et al. 2012) for the MOS-DEF sample of star-forming galaxies at 1 < z < 2 following
Shivaei et al.(2015). We derived the fraction of galaxies above the 1σ intrinsic scatter (see Japelj et al. 2016b) of the relation within the MOSDEF sample to be 27±5%. Excluding the 3 hosts falling in the low mass region, sparsely populated by the MOS-DEF sample, the fraction of LGRB host galaxies showing such an enhancement of SFR, with respect to the MOSDEF 1 < z < 2 relation, is 66 ± 22%.
3.5. Metallicity
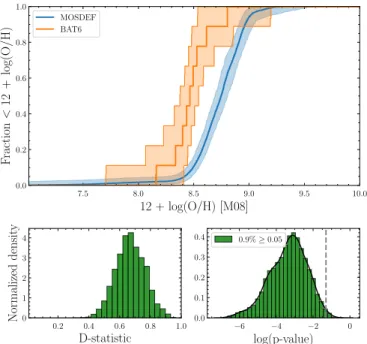
The MOSDEF survey allows us also to perform the comparison of the metallicity distribution, within the same redshift range and using the same calibrator (M08). Figure9shows the cumulative distribution of the metallicity of hosts of the BAT6 sample com-pared to the SFR-weighted distribution of star-forming galaxies of the MOSDEF at 1 < z < 2. The distribution of p-values in the bottom right panel indicates we can reject the hypothesis that
8.0 8.5 9.0 9.5 10.0 10.5 11.0 11.5 log(M∗/M⊙) −10.5 −10.0 −9.5 −9.0 −8.5 −8.0 −7.5 −7.0 lo g( sS F R /y r − 1) no metallicity 1≤ z ≤ 2 MOSDEF 1≤ z ≤ 2 GRB hosts
Fig. 8.sSFR versus stellar mass plot for the BAT6 sample at 1 < z < 2.
The grey circles are from the MOSDEF sample at 1 < z < 2.
7.5 8.0 8.5 9.0 9.5 10.0 12 + log(O/H) [M08] 0.0 0.2 0.4 0.6 0.8 1.0 F raction < 12 + log(O /H) MOSDEF BAT6 0.2 0.4 0.6 0.8 1.0 D-statistic 0 1 2 3 4 Normalized densit y −6 −4 −2 0 log(p-value) 0.0 0.1 0.2 0.3 0.4 0.9%≥ 0.05
Fig. 9.Top panel: cumulative metallicity distribution for the hosts of the
BAT6 sample (orange) and the star-forming galaxies from the MOSDEF sample (blue) at 1 < z < 2. The MOSDEF CDF is weighted by SFR. Bottom panels: see Fig.2.
the MOSDEF star-forming galaxy sample weighted by SFR and the BAT6 sample are drawn from the same distribution at the 95% confidence level.
We note that we could not determine the metallicity for four host galaxies. Nonetheless their stellar masses were lower than the stellar mass completeness of the MOSDEF sample. There-fore, our sample is still complete with respect to the comparison with the MOSDEF galaxies.
Figure10shows the mass-metallicity relation (MZR) for the BAT6 hosts and the MOSDEF sample, using the M08 calibra-tor. We see that the LGRB hosts are consistent with the star-forming field galaxies at low mass and low metallicity but there is a clear dearth of high mass and high metallicity LGRB host galaxies8. Indeed there is only one host (which has very large errors) above 12 + log(O/H) ∼ 8.7, whereas the area of stellar
8InVergani et al.(2017) the authors also present the MZR based on
the same BAT6 sample but the stellar masses are revised in this work (see Sect.2.2).
7.5 8.0 8.5 9.0 9.5 10.0 10.5 11.0 11.5 log(M∗/M⊙) 7.0 7.5 8.0 8.5 9.0 9.5 12 + lo g( O /H ) z = 0.07 z = 0.7 z = 2.2 z = 3− 4 1≤ z ≤ 2 MOSDEF 1≤ z ≤ 2 GRB hosts
Fig. 10.MZR in the M08 calibrator for the BAT6 sample at 1 < z < 2
(squares). The grey points are from the MOSDEF sample at 1 < z < 2, with their average uncertainty shown on the bottom right. The curves represent the MZR relation ofMannucci et al.(2009) from z= 0.07 to z ∼3.5, with the extrapolation below the mass completeness indicated in dashed. 8.0 8.5 9.0 9.5 10.0 10.5 11.0 log(M∗/M⊙) - 0.32×log(SFR/M⊙yr−1) 8.0 8.5 9.0 12 + lo g( O /H ) 1≤ z ≤ 2 MOSDEF 1≤ z ≤ 2 GRB hosts
Fig. 11.FMR for the BAT6 sample at 1 < z < 2 (squares). The grey
points are from the MOSDEF sample at 1 < z < 2, with their average uncertainty shown on the bottom right. The grey line is the FMR from
Mannucci et al.(2011).
masses above ∼1010M
and 12 + log(O/H) ∼ 8.6 is well
popu-lated by the star-forming galaxies of MOSDEF.
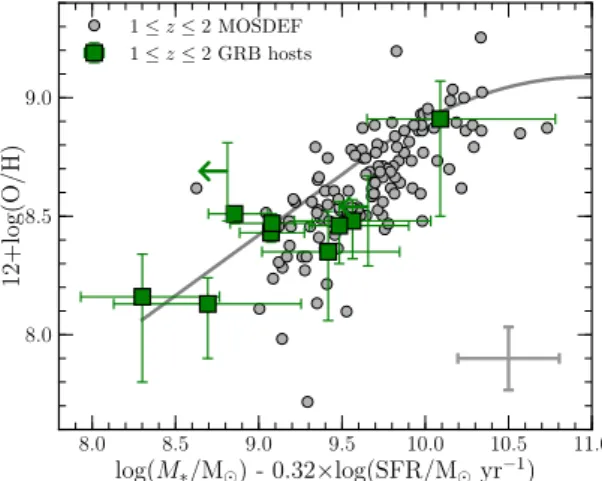
We also computed the Fundamental Metallicity Relation (FMR) as defined by Mannucci et al. (2011), represented in Fig. 11. This relation is supposed to be redshift independent. Nonetheless, asSanders et al.(2015,2018) find a redshift depen-dence of the FMR built with the MOSDEF sample, we prefer to plot here only the BAT6 hosts at 1 < z < 2, omitting hosts at z< 1.
In Vergani et al. (2017) the authors noted a discrepancy between the region occupied by the LGRB hosts and the FMR (explained by a metallicity threshold for LGRB production). Here, it appears the LGRB hosts occupy mostly the low µ9area
(whereas roughly half of the MOSDEF sample lies at µ > 9.7), and, in this region, they are consistent with the MOSDEF points. However, at those µ values, both the MOSDEF sample and the LGRB hosts seem to have lower metallicities with respect to the FMR predictions. A complete analysis of this discrep-ancy is beyond the scope of this paper. Here we can point
9where µ= log(M∗/M ) − 0.32 log(SFR/M yr−1).
out that this could be due to an underestimation of the FMR slope at low µ, or to an evolution of the relation in redshift (as found bySanders et al. 2018), as we are comparing galax-ies at 1 < z < 2 (our LGRB and MOSDEF samples) with the FMR built mainly with low-redshift galaxies. Indeed, di ffer-ent works showed that evolving physical conditions of ionised gas in HII regions may lead to evolution in the relationships between emission-line ratios and metallicity (e.g.Steidel et al. 2014; Shapley et al. 2015; Sanders et al. 2016). This is not an issue when comparing the metallicities of the BAT6 sample and the MOSDEF one as we selected the same redshift range 1 < z < 2, unless the physical conditions in LGRB hosts are sig-nificantly different from those in typical SF MOSDEF galaxies. 4. Discussion
The analysis presented in the previous sections clearly shows that the stellar mass and metallicity CDFs of the LGRB hosts do not follow those of typical star-forming galaxies weighted by SFR. This implies that, due to some factors affecting the LGRB production efficiency, at 1 < z < 2 the LGRB rate cannot be used to directly trace star formation. As found in previous work (Vergani et al. 2015, 2017; Perley et al. 2016a;
Japelj et al. 2016a), it seems that metallicity is the main factor involved: LGRBs explode preferentially in sub-solar metallicity environments. Indeed, as we will discuss in more detail later in this section, in the commonly used LGRB collapsar progenitor model (Woosley 1993) a dependence of the LGRB production on metallicity is expected. In this context, the discrepancies in the stellar mass distribution are a direct consequence of the relation between stellar mass and metallicity (lower metallicities corre-spond to lower stellar masses).
Nonetheless, in our analysis there seems to be evidence also for an enhancement of sSFR among LGRB host galaxies com-pared to star-forming galaxies found in galaxy surveys. In the literature there are indications that starburst galaxies are gener-ally characterised by lower metallicity than non-starburst ones (e.g.Sanders et al. 2018). It is therefore necessary to investigate which is the real driving factor affecting the LGRB efficiency, i.e. if it is the preference for galaxies with enhanced SFR that has as a consequence the preference for sub-solar metallicities, or the opposite.
Figure 12 shows that MOSDEF host galaxies with high sSFR have on average lower metallicity than those with lower sSFR values. Nonetheless, within the sSFR range covered by the MOSDEF galaxies considered in this work, for a fixed sSFR the fraction of MOSDEF star-forming galaxies having metallicities larger than 12 + log(O/H) ∼ 8.5 is much higher than that of LGRB hosts. Stronger evidence that a possible preference for enhanced SFR would not be the only factor at play comes from the lack of LGRB host galaxies in the high stellar mass – high SFR region of Fig.7, compared to MOSDEF galaxies. Indeed, if enhanced SFR is the driving factor, we should find LGRB host galaxies with enhanced SFR also at stellar masses larger than ∼1010M
.
All the results point towards metallicity as the main driv-ing factor. In order to further test this hypothesis, we apply a step-function metallicity cut on the MOSDEF sample and per-form the comparison with our LGRB hosts again. We impose different metallicity thresholds. As the metallicity threshold value decreases the BAT6 and MOSDEF CDFs become more and more consistent until the majority of the p-values indicate we cannot confidently discard the null hypothesis that LGRB hosts and MOSDEF star-forming galaxies are drawn form the same
−10.5 −10.0 −9.5 −9.0 −8.5 −8.0 −7.5 −7.0 log(sSFR/yr−1) 8.0 8.5 9.0 12 + lo g( O /H ) 1≤ z ≤ 2 MOSDEF 1≤ z ≤ 2 GRB hosts
Fig. 12.Metallicity-sSFR relation for the BAT6 sample at 1 < z < 2
(squares). The grey points are from the MOSDEF sample at 1 < z < 2, with their average uncertainty shown on the upper right.
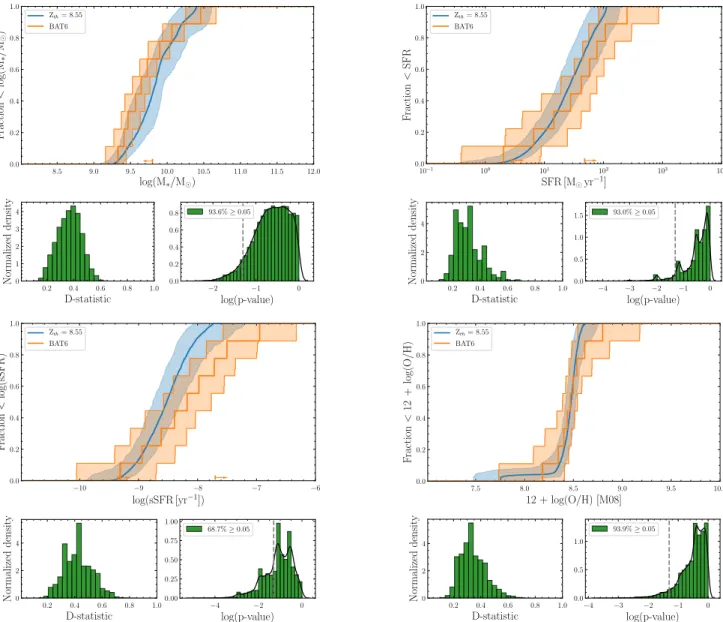
population. Using a metallicity cut of 12 + log(O/H) = 8.55, the SFR-weighted CDFs of MOSDEF come into agreement with the ones of the BAT6 sample, as is shown in Fig.13. The two-sample K–S test results in a distribution of p-values consistent with the null hypothesis that the two samples are drawn from the same underlying distribution in the majority of MC realisations. This implies that the discrepancies observed for the stellar mass and metallicity CDFs can be explained by a simple threshold on the metallicity, without the need for a contribution from a prefer-ence for starburst galaxies. This also naturally explains the trend observed in Fig.4. Following the redshift evolution of the MZR, as the redshift increases, to a given stellar mass corresponds a lower metallicity. The metallicity threshold is therefore fulfilled by galaxies more and more massive. This explains the evolution of the median stellar mass of the LGRB host galaxies reaching the agreement with that of SF galaxies at z ∼ 3 (see also Sect.5). To verify that enhanced star formation is not the main driv-ing factor affecting the LGRB efficiency, we perform the same analysis above, but applying a cut only on the sSFR this time. As shown in Fig.14, even a sSFR cut of MOSDEF galaxies at log(sSFR) ≥ −8.7, (comparable with the sSFR of LGRB host galaxies) is not able to reconcile the stellar mass and metallicity distributions.
In general, we cannot exclude that a preference for galaxies with enhanced star formation (or starbursts) is also at play, but we can affirm that this is not the major factor driving the LGRB efficiency (see alsoGraham & Fruchter 2017). We tested also the effect of various sSFR cuts on top of a metallicity cut. The impact is very mild and results in a slightly better agreement of the dis-tributions for a metallicity cut between 12 + log(O/H) = 8.55 and 12 + log(O/H) = 8.7. InKelly et al.(2014) a preference for LGRB to explode in more compact galaxies (smaller half-light radii, higher SFR density and stellar mass density) compared to the SDSS star-forming galaxies is found, in addition to the pref-erence for low-metallicities. However, considering the redshift range and low stellar-masses of our study, a morphological anal-ysis cannot be performed.
The results obtained can be interpreted in terms of the con-ditions necessary for a massive star undergoing a collapse to form an LGRB. A high metallicity would create too much wind-loss in the final stages of the progenitor’s life, causing a wind-loss of angular momentum that is necessary for the formation of an ultra-relativistic jet. However, the threshold we find (correspond-ing to 0.7 Z in the M08 scale) is higher than the 0.1−0.3 Z
metallicity upper limit values predicted by most single-star
pro-genitor models (e.g.Yoon et al. 2006;Woosley & Heger 2006). Some studies pointed out that theKewley & Dopita(2002) pho-toionization models on which the M08 method is based may overestimate oxygen abundances by 0.2–0.5 dex compared to the metallicity derived using the so-called direct Temethod (see
e.g., Kennicutt et al. 2003;Yin et al. 2007). On the other hand it should also be noted that the oxygen abundances determined using temperatures derived from collisional-excited lines could be underestimated by 0.2–0.3 dex (see e.g.López-Sánchez et al. 2012;Nicholls et al. 2012). A way to accommodate single star pro-genitors models with environments characterised by the higher metallicity values found in our works is to invoke chemically homogeneous mixing with very rapid rotation (Brott et al. 2011) and weak magnetic coupling (Georgy et al. 2012;Martins et al. 2013). In such cases LGRB could be produced also up to solar metallicities, but it is still not clear whether their rates would cor-respond to the LGRB observed rates.
Another possibility to be considered is an enhancement of the [O/Fe] in LGRB host galaxies. Indeed oxygen overabun-dances have been found in young and/or starburst galaxies (e.g.
Vink et al. 2000and references therein;Izotov et al. 2006) due to the longer time scale needed to produce type Ia SNe, that are the main producer of iron, compared to type II SNe where oxygen is produced. This was also pointed out bySteidel et al.(2016) as an explanation of the higher stellar metallicity compared to the neb-ular one found for galaxies at z > 2. Indications of low iron abun-dances compared to oxygen have been found byHashimoto et al.
(2018) in the host galaxies of two very low-redshift LGRBs: GRB 980425 and GRB 080517. At the Z values we find, iron is the main driver of the wind mass-loss of WR stars (Vink & de Koter 2005). If the LGRB environment is characterised by oxygen over-abundance, a [O/Fe] & 0.5 would imply iron metallicities in agree-ment with most single star LGRB models.
Binary channels where the progenitor star is tidally spun-up by its companion (de Mink et al. 2009;Podsiadlowski et al. 2010) must also be considered. The evolution of massive stars in binaries is more complex to model than as single stars (e.g.
Fryer & Heger 2005;Yoon 2015). A few studies on evolutionary models of binary stars have started to investigate the effects of rotation and metallicity (e.g.de Mink et al. 2009;Eldridge et al. 2017). In Song et al.(2016) the evolution of single and close binary stellar models (before any mass transfer) with strong core-envelope coupling is compared. Rotating massive stars in binary systems do not significantly lose their surface velocity, independent of the metallicity. Interestingly, the surface veloc-ity increases with the initial stellar mass and the metallicveloc-ity, and homogeneous evolution is more favoured at metallicities Z & 0.5 Z than at lower metallicities. The avoidance of the
Roche lobe overflow phase during the main sequence phase is favoured in high-mass star models at metallicities Z. 0.5 Z . In
the proposed scenario the primary star can enter the WR phase at an early stage of its evolution keeping fast rotation and high angular momentum. Even if the final stages of this evolution still need to be studied, this could be a channel for the formation of LGRBs also at moderately high metallicity.
More in general, it must be pointed out that the effect of metallicity goes beyond the final stages of the progenitor’s life, and could also possibly affect the IMF of stars. The universality of the IMF is still debated, and different works pointed out the possibility of a metallicity dependence of the IMF, where a larger fraction of massive stars is produced at lower metallicity (e.g.
Marks et al. 2012;Martín-Navarro et al. 2015).
It is worth noting that the metallicities derived in this paper are integrated over the entire galaxy. The possibility that the
8.5 9.0 9.5 10.0 10.5 11.0 11.5 12.0 log(M∗/M ) 0.0 0.2 0.4 0.6 0.8 1.0 F raction < log(M ∗ /M ) Zth= 8.55 BAT6 0.2 0.4 0.6 0.8 1.0 D-statistic 0 1 2 3 4 Normalized densit y −2 −1 0 log(p-value) 0.0 0.2 0.4 0.6 0.8 93.6%≥ 0.05 10−1 100 101 102 103 104 SFR [M yr−1] 0.0 0.2 0.4 0.6 0.8 1.0 F raction < SFR Zth= 8.55 BAT6 0.2 0.4 0.6 0.8 1.0 D-statistic 0 2 4 Normalized densit y −4 −3 −2 −1 0 log(p-value) 0.0 0.5 1.0 1.5 93.0%≥ 0.05 −10 −9 −8 −7 −6 log(sSFR [yr−1]) 0.0 0.2 0.4 0.6 0.8 1.0 F raction < log(sSFR) Zth= 8.55 BAT6 0.2 0.4 0.6 0.8 1.0 D-statistic 0 2 4 Normalized densit y −4 −2 0 log(p-value) 0.00 0.25 0.50 0.75 1.00 68.7%≥ 0.05 7.5 8.0 8.5 9.0 9.5 10.0 12 + log(O/H) [M08] 0.0 0.2 0.4 0.6 0.8 1.0 F raction < 12 + log(O /H) Zth= 8.55 BAT6 0.2 0.4 0.6 0.8 1.0 D-statistic 0 2 4 Normalized densit y −4 −3 −2 −1 0 log(p-value) 0.0 0.5 1.0 93.9%≥ 0.05
Fig. 13.Result of the same analysis as presented in Sect.3except using a metallicity cut on the MOSDEF sample of 12+ log(O/H) = 8.55. The
CDFs match more closely, and the 2 sample K–S tests suggest we can not discard the null hypothesis in the majority of realisations. LGRB production site is situated in a low-metallicity pocket of a
higher metallicity host should be considered. While this can not be excluded, various authors have shown that LGRB hosts are small and compact (Lyman et al. 2017), and when possible to resolve, little metallicity variation is found throughout the hosts (Levesque et al. 2011; Krühler et al. 2017;Izzo et al. 2017; see however Niino et al. 2017; Bignone et al. 2017 for considera-tions on metallicity variaconsidera-tions). We stress also that we used a simple step-function for the metallicity threshold because our small statistics do not allow us to constrain the shape of this func-tion, however, in reality, it is more likely to be a smooth function of decreasing probability of hosting an LGRB with increasing metallicity.
Based on the fact that the hosts of the BAT6 LGRB sam-ple represent a statistically comsam-plete samsam-ple of LGRB hosts, we can estimate the fraction of super-solar metallicity hosts (in the M08 scale). With the conservative assumption that hosts without a metallicity measurement are super-solar (very unlikely, as they are mostly low mass galaxies), that fraction is less than 31 ± 15% at z < 1 and 33 ± 13% at 1 < z < 2 (15 ± 15% and 13 ± 13%, respectively, if the host without metallicity measurement are sub-solar).
5. Conclusions
Using a complete and unbiased sample, we showed that the prop-erties of LGRB host galaxies evolve between z < 1 and 1 < z< 2. Their median stellar mass increases from hlog(M∗/M )i=
9.0+0.1−0.2to 9.4+0.2−0.3, their median star formation rate increases from hSFRi = 1.3+0.9−0.7 to 24+24−14M yr−1, while their median
metallic-ity remains constant at h12 + log(O/H)i ∼ 8.45+0.1−0.1. Based on the SF galaxy relation between SFR and stellar mass, the stel-lar mass evolution we found for LGRB host galaxies is weaker than that expected following their SFR evolution. If LGRB pre-fer to explode in environments for which the metallicity is below a certain threshold, such a (weaker) evolution is expected. In fact a fixed metallicity threshold would stifle LGRBs from explod-ing in high stellar mass galaxies, and at the same time would correspond to a higher stellar mass at higher redshift as the mass-metallicity relation evolves towards lower metallicities at fixed mass, or equivalently higher mass at fixed metallicity.
While performing the analysis of LGRB host galaxy proper-ties, we revised some stellar mass values reported in the literature with proper SED fitting, confirming that the use of NIR photom-etry only can lead to overestimations of the stellar masses. We
8.5 9.0 9.5 10.0 10.5 11.0 11.5 12.0 log(M∗/M ) 0.0 0.2 0.4 0.6 0.8 1.0 F raction < log(M ∗ /M ) sSFRth= -8.7 BAT6 0.2 0.4 0.6 0.8 1.0 D-statistic 0 2 4 Normalized densit y −4 −3 −2 −1 0 log(p-value) 0.0 0.2 0.4 0.6 0.8 20.4%≥ 0.05 10−1 100 101 102 103 104 SFR [M yr−1] 0.0 0.2 0.4 0.6 0.8 1.0 F raction < SFR sSFRth= -8.7 BAT6 0.2 0.4 0.6 0.8 1.0 D-statistic 0 1 2 3 Normalized densit y −6 −4 −2 0 log(p-value) 0.0 0.2 0.4 45.4%≥ 0.05 −10 −9 −8 −7 −6 log(sSFR [yr−1]) 0.0 0.2 0.4 0.6 0.8 1.0 F raction < log(sSFR) sSFRth= -8.7 BAT6 0.2 0.4 0.6 0.8 1.0 D-statistic 0 2 4 Normalized densit y −5 −4 −3 −2 −1 0 log(p-value) 0.00 0.25 0.50 0.75 1.00 77.9% ≥ 0.05 7.5 8.0 8.5 9.0 9.5 10.0 12 + log(O/H) [M08] 0.0 0.2 0.4 0.6 0.8 1.0 F raction < 12 + log(O /H) sSFRth= -8.7 BAT6 0.2 0.4 0.6 0.8 1.0 D-statistic 0 1 2 3 Normalized densit y −6 −4 −2 0 log(p-value) 0.0 0.1 0.2 0.3 0.4 7.7%≥ 0.05
Fig. 14.Result of the same analysis as presented in Sect.3except using a sSFR cut on the MOSDEF sample of log(sSFR [yr−1])= −8.7.
looked at the LGRB FMR with the revised stellar masses, show-ing that there is still a shift with respect to the relation found by
Mannucci et al.(2011), at lower µ, but that our sample is consis-tent with the MOSDEF star-forming galaxy sample. This could be due to an underestimation of the FMR slope at low µ or to the current systematic uncertainties regarding evolution of metallic-ity calibrations with redshift.
We tested the hypothesis that LGRBs are pure tracers of star formation (i.e., the probability of forming an LGRB is pro-portional to the SFR) by comparing the cumulative distribu-tions of stellar mass, SFR, sSFR and metallicity of our sample with the ones of the COSOMOS2015UD (excluding metallicity) and MOSDEF representative surveys of star-forming galaxies at 1 < z < 2. Even if there is evidence for a preference of LGRB to explode in galaxies with enhanced star formation, we demon-strated that the major factor explaining the discrepancy between the mass and metallicity CDFs is a decrease of LGRB production in galaxies with metallicities above 12 + log(O/H) ∼ 8.55 in the M08 calibrator, although this threshold is to be cautiously treated as an indication rather than an absolute value due to statistics and calibrator robustness. A lower LGRB production efficiency in higher metallicity environments can be understood in terms of the conditions necessary for the progenitor star to form a LGRB. The values found in this study invoke peculiar conditions of
mas-sive single star evolutionary models, and may be in better agree-ment with evolution in binary systems.
If this metallicity threshold is the only factor regulating the LGRB production efficiency, we expect LGRB to trace star for-mation in an unbiased manner once the bulk of the star-forming population of field galaxies is below this threshold. Assuming a threshold value of Zth = 0.7 Z , following the prescription of
Langer & Norman (2006), and assuming that the LGRB lumi-nosity function and density do not vary with redshift, this will happen for z > 3. This scenario is in agreement with the findings ofGreiner et al.(2015) andPerley et al.(2016b). It is also sup-ported by the decrease towards z ∼ 3 of the discrepancy of the stellar mass of the LGRB hosts and that of star-forming galaxies in surveys weighted by SFR. The collection of larger sample of high-z GRBs with future dedicated satellites as the THESEUS mission (Amati et al. 2018) will provide a viable way to probe the star formation history up to z= 10 and beyond.
Acknowledgements. This work is part of the BEaPro project (P.I.: SDV), funded
by the French National Research Agency (ANR) under contract ANR-16-CE31-0003. JTP, SDV, RS, SB and ELF acknowledge the ANR support. This work benefits also of the support of the Programme National de Cosmologie et Galax-ies (PNCG). JTP wishes to thank J.K Krogager and T. Charnock for fruitful discussions and C. Laigle for providing the mass completeness of the COS-MOS2015 Ultra Deep survey. SDV thanks Fabrice Martins, George Meynet and Fabian Schneider for very useful discussions. We thank T. Krühler for the
data reduction of GROND observations and more in general for his openness in collaborating. R.L.S. was supported by a UCLA Graduate Division Disser-tation Year Fellowship, and also acknowledges a NASA contract supporting the “WFIRST Extragalactic Potential Observations (EXPO) Science Investi-gation Team” (15-WFIRST15-0004), administered by GSFC. JJ acknowledges support from NOVA and NWO-FAPESP grant for advanced instrumentation in astronomy. AVG acknowledges support from the ERC via two Advanced Grants under grant agreements number 321323-NEOGAL and number 742719-MIST. DC acknowledges support by the Centre National d’Etudes Spatiales and sup-port by the Région Provence-Alpes-Côte d’Azur for the funding of his PhD. This work is based in part on observations made with the Spitzer Space Tele-scope, which is operated by the Jet Propulsion Laboratory, California Institute of Technology under a contract with NASA. Support for this work was pro-vided by NASA through an award issued by JPL/Caltech. Part of the fund-ing for GROND (both hardware as well as personnel) was generously granted
from the Leibniz-Prize to Prof. G. Hasinger (DFG grant HA 1850/28-1). This
research has made use of Astropy, a community-developed core Python pack-age for Astronomy. We acknowledge the use of Jochen Greiner’s GRB website
(http://www.mpe.mpg.de/~jcg/grbgen.html).
References
Amati, L., O’Brien, P., Götz, D., et al. 2018,Adv. Space Res., 62, 191
Arabsalmani, M., Møller, P., Perley, D. A., et al. 2017,MNRAS, 473, 3312
Arnouts, S., Cristiani, S., Moscardini, L., et al. 1999,MNRAS, 310, 540
Bertin, E., & Arnouts, S. 1996,A&AS, 117, 393
Bignone, L. A., Tissera, P. B., & Pellizza, L. J. 2017,MNRAS, 469, 4921
Blanchard, P. K., Berger, E., & Fong, W.-F. 2016,ApJ, 817, 144
Boissier, S., Salvaterra, R., Le Floc’h, E., et al. 2013,A&A, 557, A34
Brott, I., Evans, C. J., Hunter, I., et al. 2011,A&A, 530, A116
Bruzual, G., & Charlot, S. 2003,MNRAS, 344, 1000
Calzetti, D., Armus, L., Bohlin, R. C., et al. 2000,ApJ, 533, 682
Cardelli, J. A., Clayton, G. C., & Mathis, J. S. 1989,ApJ, 345, 245
Chabrier, G. 2003,PASP, 115, 763
Charlot, S., & Longhetti, M. 2001,MNRAS, 323, 887
Chevallard, J., & Charlot, S. 2016,MNRAS, 462, 1415
Conroy, C., Gunn, J. E., & White, M. 2009,ApJ, 699, 486
Corre, D., Buat, V., Basa, S., et al. 2018,A&A, 617, A141
de Mink, S. E., Cantiello, M., Langer, N., et al. 2009,A&A, 497, 243
Eldridge, J. J., Stanway, E. R., Xiao, L., et al. 2017,PASA, 34, e058
Fazio, G. G., Hora, J. L., Allen, L. E., et al. 2004,ApJS, 154, 10
Ferland, G. J., Porter, R. L., van Hoof, P. A. M., et al. 2013,Rev. Mex. Astron.
Astrofis., 49, 137
Filgas, R., Krühler, T., Greiner, J., et al. 2011,A&A, 526, A113
Fryer, C. L., & Heger, A. 2005,ApJ, 623, 302
Georgy, C., Ekström, S., Meynet, G., et al. 2012,A&A, 542, A29
Graham, J. F., & Fruchter, A. S. 2017,ApJ, 834, 170
Greiner, J., Bornemann, W., Clemens, C., et al. 2008,PASP, 120, 405
Greiner, J., Krühler, T., Klose, S., et al. 2011,A&A, 526, A30
Greiner, J., Fox, D. B., Schady, P., et al. 2015,ApJ, 809, 76
Gutkin, J., Charlot, S., & Bruzual, G. 2016,MNRAS, 462, 1757
Hashimoto, T., Chaudhary, R., Ohta, K., et al. 2018,ApJ, 863, 95
Heintz, K. E., Malesani, D., Wiersema, K., et al. 2017,MNRAS, 474, 2738
Hjorth, J., Sollerman, J., Møller, P., et al. 2003,Nature, 423, 847
Hjorth, J., Malesani, D., Jakobsson, P., et al. 2012,ApJ, 756, 187
Hunt, L. K., Palazzi, E., Michałowski, M. J., et al. 2014,A&A, 565, A112
Ilbert, O., Arnouts, S., McCracken, H. J., et al. 2006,A&A, 457, 841
Ilbert, O., Salvato, M., Le Floc’h, E., et al. 2010,ApJ, 709, 644
Ilbert, O., Arnouts, S., Le Floc’h, E., et al. 2015,A&A, 579, A2
Izotov, Y. I., Stasi´nska, G., Meynet, G., Guseva, N. G., & Thuan, T. X. 2006,
A&A, 448, 955
Izzo, L., Thöne, C. C., Schulze, S., et al. 2017,MNRAS, 472, 4480
Jakobsson, P., Levan, A., Fynbo, J. P. U., et al. 2006,A&A, 447, 897
Japelj, J., Covino, S., Gomboc, A., et al. 2015,A&A, 579, A74
Japelj, J., Vergani, S. D., Salvaterra, R., et al. 2016a,A&A, 590, A129
Japelj, J., Vergani, S. D., Salvaterra, R., Hunt, L. K., & Mannucci, F. 2016b,
A&A, 593, A115
Kelly, P. L., Filippenko, A. V., Modjaz, M., & Kocevski, D. 2014,ApJ, 789, 23
Kennicutt, Jr., R. C. 1998,ARA&A, 36, 189
Kennicutt, Jr., R. C., Bresolin, F., & Garnett, D. R. 2003,ApJ, 591, 801
Kewley, L. J., & Dopita, M. A. 2002,ApJS, 142, 35
Kewley, L. J., & Ellison, S. L. 2008,ApJ, 681, 1183
Kistler, M. D., Yüksel, H., Beacom, J. F., & Stanek, K. Z. 2008,ApJ, 673, L119
Kriek, M., van Dokkum, P. G., Labbé, I., et al. 2009,ApJ, 700, 221
Kriek, M., Shapley, A. E., Reddy, N. A., et al. 2015,ApJS, 218, 15
Kruehler, T., & Schady, P. 2017,Photometry and Stellar Masses for GRB Host
Galaxies with Emission-line Spectra (Figshare)
Krühler, T., Küpcü Yolda¸s, A., Greiner, J., et al. 2008,ApJ, 685, 376
Krühler, T., Greiner, J., Schady, P., et al. 2011,A&A, 534, A108
Krühler, T., Malesani, D., Fynbo, J. P. U., et al. 2015,A&A, 581, A125
Krühler, T., Kuncarayakti, H., Schady, P., et al. 2017,A&A, 602, A85
Laigle, C., McCracken, H. J., Ilbert, O., et al. 2016,ApJS, 224, 24
Lamb, D. Q., & Reichart, D. E. 2000,ApJ, 536, 1
Langer, N., & Norman, C. A. 2006,ApJ, 638, L63
Lee, N., Sanders, D. B., Casey, C. M., et al. 2015,ApJ, 801, 80
Le Fèvre, O., Tasca, L. A. M., Cassata, P., et al. 2015,A&A, 576, A79
Levesque, E. M., Soderberg, A. M., Kewley, L. J., & Berger, E. 2010,ApJ, 725,
1337
Levesque, E. M., Berger, E., Soderberg, A. M., & Chornock, R. 2011,ApJ, 739,
23
López-Sánchez, Á. R., Dopita, M. A., Kewley, L. J., et al. 2012,MNRAS, 426,
2630
Lyman, J. D., Levan, A. J., Tanvir, N. R., et al. 2017,MNRAS, 467, 1795
Maiolino, R., Nagao, T., Grazian, A., et al. 2008,A&A, 488, 463
Mannucci, F., Cresci, G., Maiolino, R., et al. 2009,MNRAS, 398, 1915
Mannucci, F., Salvaterra, R., & Campisi, M. A. 2011,MNRAS, 414, 1263
Marks, M., Kroupa, P., Dabringhausen, J., & Pawlowski, M. S. 2012,MNRAS,
422, 2246
Martín-Navarro, I., Vazdekis, A., La Barbera, F., et al. 2015,ApJ, 806, L31
Martins, F., Depagne, E., Russeil, D., & Mahy, L. 2013,A&A, 554, A23
McLean, I. S., Steidel, C. C., Epps, H. W., et al. 2012,Ground-based Airborne
Instrum. Astron. IV, 8446, 84460J
Melandri, A., Sbarufatti, B., D’Avanzo, P., et al. 2012,MNRAS, 421, 1265
Modigliani, A., Goldoni, P., & Royer, F. 2010,Proc. SPIE, 7737, 773728
Nicholls, D. C., Dopita, M. A., & Sutherland, R. S. 2012,ApJ, 752, 148
Niino, Y., Aoki, K., Hashimoto, T., et al. 2017,PASJ, 69, 00
Noll, S., Burgarella, D., Giovannoli, E., et al. 2009,A&A, 507, 1793
Osterbrock, D. E. 1989,Astrophysics of Gaseous Nebulae and Active Galactic
Nuclei(Mill Valley: CA, University Science Books)
Pei, Y. C. 1992,ApJ, 395, 130
Perley, D. A., Levan, A. J., Tanvir, N. R., et al. 2013,ApJ, 778, 128
Perley, D. A., Perley, R. A., Hjorth, J., et al. 2015,ApJ, 801, 102
Perley, D. A., Krühler, T., Schulze, S., et al. 2016a,ApJ, 817, 7
Perley, D. A., Tanvir, N. R., Hjorth, J., et al. 2016b,ApJ, 817, 8
Pescalli, A., Ghirlanda, G., Salvaterra, R., et al. 2016,A&A, 587, A40
Planck Collaboration XVI. 2014,A&A, 571, A16
Podsiadlowski, P., Ivanova, N., Justham, S., & Rappaport, S. 2010,MNRAS,
406, 840
Porciani, C., & Madau, P. 2001,ApJ, 548, 522
Reddy, N. A., Kriek, M., Shapley, A. E., et al. 2015,ApJ, 806, 259
Robertson, B. E., & Ellis, R. S. 2012,ApJ, 744, 95
Rossi, A., Klose, S., Ferrero, P., et al. 2012,A&A, 545, A77
Salvaterra, R., Della Valle, M., Campana, S., et al. 2009,Nature, 461, 1258
Salvaterra, R., Campana, S., Vergani, S. D., et al. 2012,ApJ, 749, 68
Salvaterra, R., Maio, U., Ciardi, B., & Campisi, M. A. 2013,MNRAS, 429,
2718
Sanders, R. L., Shapley, A. E., Kriek, M., et al. 2015,ApJ, 799, 138
Sanders, R. L., Shapley, A. E., Kriek, M., et al. 2016,ApJ, 816, 23
Sanders, R. L., Shapley, A. E., Kriek, M., et al. 2018,ApJ, 858, 99
Savaglio, S., Rau, A., Greiner, J., et al. 2012,MNRAS, 420, 627
Schlafly, E. F., & Finkbeiner, D. P. 2011,ApJ, 737, 103
Schulze, S., Chapman, R., Hjorth, J., et al. 2015,ApJ, 808, 73
Shapley, A. E., Reddy, N. A., Kriek, M., et al. 2015,ApJ, 801, 88
Shivaei, I., Reddy, N. A., Shapley, A. E., et al. 2015,ApJ, 815, 98
Song, H. F., Meynet, G., Maeder, A., Ekström, S., & Eggenberger, P. 2016,A&A,
585, A120
Steidel, C. C., Rudie, G. C., Strom, A. L., et al. 2014,ApJ, 795, 165
Steidel, C. C., Strom, A. L., Pettini, M., et al. 2016,ApJ, 826, 159
Tanvir, N. R., Fox, D. B., Levan, A. J., et al. 2009,Nature, 461, 1254
Vergani, S. D., Salvaterra, R., Japelj, J., et al. 2015,A&A, 581, A102
Vergani, S. D., Palmerio, J., Salvaterra, R., et al. 2017,A&A, 599, A120
Vernet, J., Dekker, H., D’Odorico, S., et al. 2011,A&A, 536, A105
Vink, J. S., & de Koter, A. 2005,A&A, 442, 587
Vink, J. S., de Koter, A., & Lamers, H. J. G. L. M. 2000,A&A, 362, 295
Werner, M. W., Roellig, T. L., Low, F. J., et al. 2004,ApJS, 154, 1
Whitaker, K. E., van Dokkum, P. G., Brammer, G., & Franx, M. 2012,ApJ, 754,
L29
Woosley, S. E. 1993,ApJ, 405, 273
Woosley, S. E., & Bloom, J. S. 2006,ARA&A, 44, 507
Woosley, S. E., & Heger, A. 2006,ApJ, 637, 914
Yin, S. Y., Liang, Y. C., Hammer, F., et al. 2007,A&A, 462, 535
Yoon, S.-C. 2015,PASA, 32, e015
Yoon, S. C., & Langer, N. 2006,ASP Conf. Ser., 353, 63


![Fig. 14. Result of the same analysis as presented in Sect. 3 except using a sSFR cut on the MOSDEF sample of log(sSFR [yr −1 ]) = −8.7.](https://thumb-eu.123doks.com/thumbv2/123dokorg/8105547.125056/13.892.93.799.127.724/fig-result-analysis-presented-sect-using-mosdef-sample.webp)
