ALMA MATER STUDIORUM
UNIVERSITÀ DEGLI STUDI DI BOLOGNA
D
OTTORATO DI RICERCA INB
IOINGEGNERIACICLO XXVI
SETTORE CONCORSUALE:09/G2
SETTORE SCIENTIFICO DISCIPLINARE DI AFFERENZA:ING-INF/06
MENTAL STATES MONITORING THROUGH PASSIVE
BRAIN-COMPUTER INTERFACE SYSTEMS
R
ELATORE:
Prof. ssa Serenella Salinari
C
O-
RELATORE:
Prof. Febo Cincotti
Ing. Fabio Aloise
R
EVISORI:
Prof. Mauro Ursino
Dr. Ricardo Chavarriaga
E
SAMEF
INALEA
NNO2014
C
OORDINATORE DOTTORATO:
Prof. ssa Elisa Magosso
A
BSTRACT
The monitoring of cognitive functions aims at gaining information about the current cognitive state of the user by decoding brain signals. In recent years, this approach allowed to acquire valuable information about the cognitive aspects regarding the interaction of humans with external world. From this consideration, researchers started to consider passive application of brain–computer interface (BCI) in order to provide a novel input modality for technical systems solely based on brain activity. The objective of this thesis is to demonstrate how the passive Brain Computer Interfaces (BCIs) applications can be used to assess the mental states of the users, in order to improve the human machine interaction. Two main studies has been proposed. The first one allows to investigate whatever the Event Related Potentials (ERPs) morphological variations can be used to predict the users’ mental states (e.g. attentional resources, mental workload) during different reactive BCI tasks (e.g. P300-based BCIs), and if these information can predict the subjects’ performance in performing the tasks. In the second study, a passive BCI system able to online estimate the mental workload of the user by relying on the combination of the EEG and the ECG biosignals has been proposed. The latter study has been performed by simulating an operative scenario, in which the occurrence of errors or lack of performance could have significant consequences. The results showed that the proposed system is able to estimate online the mental workload of the subjects discriminating three different difficulty level of the tasks ensuring a high reliability.
ABSTRACT ... 0
1INTRODUCTION ... 1
2PRELIMINARY CONCEPTS ... 3
2.1 The nervous system ... 3
2.1.1 The Central Nervous System ... 4
2.1.2 Temporal Lobes ... 5
2.1.3 Occipital Lobe ... 5
2.1.4 Parietal Lobe ... 5
2.1.5 Frontal Lobe ... 6
2.2 The Neuron ... 6
2.2.1 The action potential ... 8
2.3 The electroencephalography ... 9
2.3.1 The evoked potentials ... 12
2.3.2 EEG rhythms analyses ... 19
2.4 The electrocardiography ... 22
2.5 The attention: Overt vs Covert ... 24
2.5.1 Spatial (c)overt attention ... 26
2.6 The mental workload ... 27
2.6.2 Subjective evaluation ... 29
2.6.3 Performance evaluation ... 31
2.6.4 Psychophysiological variables assessment ... 33
2.7 Brain Computer Interfaces (BCIs) ... 40
2.7.1 Passive Brain Computer Interfaces ... 46
3OBJECTIVES ... 48
4MORPHOLOGICAL VARIATIONS IN THE ERPS (C)OVERT ATTENTION MODALITIES ... 50
4.1 A Covert Attention P300-based Brain-Computer Interface: GeoSpell ... 50
4.1.1 Introduction ... 50
4.1.2 Methods and Materials ... 56
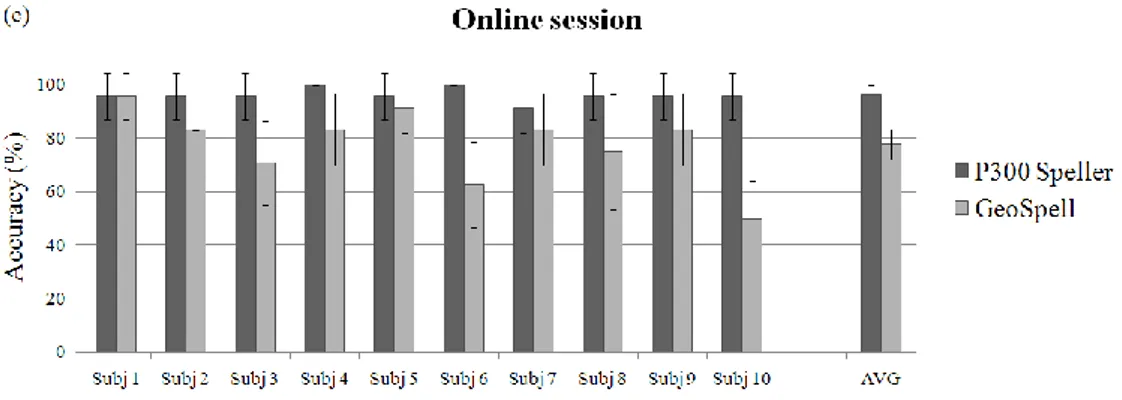
4.1.3 Results ... 64
4.1.4 Discussion ... 73
4.2 Influence of P300 latency jitter over ERPs based BCIs performance ... 78
4.2.1 Introduction ... 78
4.2.2 Materials and Methods ... 81
4.2.3 Results ... 92
4.2.4 Discussion ... 100
5EVALUATION OF THE OPERATORS’ MENTAL WORKLOAD USING EEG RHYTHMS AND THE HEART RATE SIGNAL ... 106
5.1 Towards an EEG and HR based framework for realtime monitoring of mental workload ... 106
5.1.1 Introduction ... 106 5.1.2 Methods ... 112 5.1.3 Results ... 131 5.1.4 Discussion ... 139 6CONCLUSION ... 143 7REFERENCES ... 145 8SCIENTIFIC WRITING ... 158 8.1 Full Papers ... 158 8.2 Conference proceedings ... 159
1
1 I
NTRODUCTION
Simultaneous control of multiple devices, while maintaining high attentional levels, represents an important feature in several operating environment. For example, pilot a plane or drive a car represents the classic situations where the operator has to manage simultaneously the available devices, while maintaining a high level of attention. There are also situations in which the required cognitive load can become very high, for example in safety-critical applications. These considerations point out the usefulness of a system that continuously monitors the user's mental states and that at the same time can act on the system itself using the subjective collected information.
A BCI is typically defined as a communication system, which relies on brain activity to control an external device bypassing muscular and nerves pathway (e.g., using electroencephalogram (EEG) technique, Wolpaw et al. 2002). BCI research was originally driven by the goal to provide an alternative/additional channel to restore communication and interaction with the external world in people with severe motor disabilities. More recently, Wolpaw and Wolpaw (2012) defined a Brain-Computer Interface as “a system that measures Central Nervous System (CNS) activity and
converts it into artificial output that replaces, restores, enhances, supplements, or improves natural CNS output and thereby changes the ongoing interactions between the CNS and its external or internal environment”. Thus, researchers suggested new
application fields for BCI systems, developing applications that also involve subjects in operational environments, as military and commercial pilots and car drivers (Zander et al., 2009; Mueller et al., 2008; Blankertz et al. 2010). In fact, the meaning of the
2
term “BCI” (which originally only included the translation of the users’ intentions through the classification of their voluntarily modulated brain activity) was broadened to comprise monitoring of cognitive states (e.g. mental workload, attention levels) identified through the users’ spontaneous brain activity.
The objective of this PhD thesis is to design and validate a passive Brain Computer Interface (BCI) system able to estimate the user's mental state through the analysis of neurophysiological signals.
This thesis is organized in five main sections:
In the first part basic concepts about the nervous system, the EEG signal and the ECG signal will be provided. In addition, a review of the state of the art concerning the covert and the overt attention modalities, the mental workload and the Brain Computer Interface (BCI) systems will be reported.
In the second section, the studies regarding the event-related potentials and changes in their morphology during the use of two BCI interfaces used in overt and covert attention modalities will be reported and discussed.
The third section will deal the design and the development of a monitoring system of the user's mental workload in operational environments using EEG rhythms and the ECG signal.
In the fourth section, the general conclusions about the carried out research will be discussed.
3
2 PRELIMINARY CONCEPTS
2.1 The nervous system
Before discussing physiological measures, it is important to have at least a brief understanding of the extremely complex human nervous system (NS). The NS is a complex network of nerves and cells that carry messages to and from the brain and spinal cord to various parts of the body (Figure 2.1). The nervous system includes both the Central nervous system and Peripheral nervous system. The Central nervous system is made up of the brain and spinal cord and The Peripheral nervous system is made up of the Somatic and the Autonomic nervous systems.
4
2.1.1 The Central Nervous System
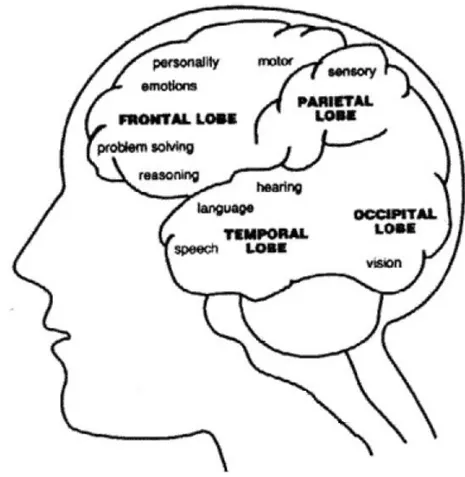
The Central Nervous System (CNS) gathers information about the environment through sensations, controls thought and motor control. Central to this effort and to the understanding of our existence is the brain. First, it is important to discuss the basic functions of the brain as related to its anatomy. The brain is made up of several components, which work in concert to perform the myriad of functions, which we use to survive (Figure 2.2).
5
2.1.2 Temporal Lobes
The temporal lobes are highly associated with memory skills and are involved in the primary organization of sensory input (Read, 1981). This area of the brain is involved with emotional response, memory, and speech recognition. The responsibility of these lobes also includes language functions such as naming and verbal comprehension. Evidence suggests that the temporal lobes are involved in high-level visual processing of complex stimuli and scenes as well as object perception and recognition. This part of the brain handles the transfer of memory from short to long term and control spatial memory.
2.1.3 Occipital Lobe
The ability to process visual images is located in the occipital lobe. This part of the brain handles the perception of motion, color discrimination and visual/spatial processing.
2.1.4 Parietal Lobe
There are several functions carried out by this part of the brain. First, the cognitive functions of sensation and perception. This sensory input is then integrated to form a corresponding spatial coordinate system to the environment. The parietal lobe has been associated with various visuo-spatial abilities and analogical mental rotations (Dehaene et al., 1999).
6
2.1.5 Frontal Lobe
The frontal lobe area of the brain involved several important activities including motor function, problem solving, memory, language, judgment, impulse control, and social behavior. The left and right frontal lobes are involved in different behaviors, for example, the left controls language related movement (e.g. muscle activation necessary for speech) and the right lobe is involved with non-verbal abilities.
2.2 The Neuron
There are about 1010 neurons in CNS organized in a multilevel hierarchical system (Shepherd, 1998). The nervous system provides a lot of diversity of neuron type, connectivity, functionality, etc. Therefore, pretty much all of what is said refers to the most common behaviour despite the whole variability present (Figure 2.3).
7
Figure 2.3: Schematic representation of a neuron.
The three main parts of a neuron are the dendrites, the soma (cell body) and the axon. Most of the incoming current to a neuron comes from the dendrites. Probably the great distinctive features of neurons is the presence of large dendritic trees. They are responsible for most of the variety in neuron size, shape and types. The dendritic tree contains many post synaptic terminals of chemical synapses. Several functions (Stuart et al., 1999) have also been claimed to be performed by dendritic arbors such as biological gates and coincidence detectors, learning signaling by dendritic spikes, to increase the learning capacity of the neuron (Poirazi and Mel, 2001) or to increase the
8
ability to differ incoming stimulus intensity into a neuron (or enhance the dynamic, Gollo et al., 2012). However such dendritic computation properties are still far away from been clearly understood. The cell body (soma) contains the nucleus and most of the cytoplasmic organelles. It is mainly where the metabolic process occur. The axon goes very far away from the soma. It might have different size (from 0.1 to 2.000 mm) depending on its functionality (Kandel et al., 2000). It starts at the axon hillock where the action potential is generated and present ramifications at the extremities. From those terminal buttons come out most of the pre synaptic terminals. It might be involved by myelin to protect and control some properties as the propagation velocity.
2.2.1 The action potential
The neurons are nonlinear excitable elements, i.e., they generate a spike when its membrane potential goes above a defined threshold (about 20-30 mV above the rest potential, Gerstner and Kistler, 2002). This excitation is also called action potential (Figure 2.4). When the membrane potential of a given neuron is perturbed, for instance via the incoming activity from a neighbour, it relaxes back to its rest potential in a time scale determined by the membrane time (τm) if it does not exceed the threshold. The spike is generated in a particular region called axon hillock located in between the soma and the axon. The pulse propagates (Bishop and Davis, 1960) mainly throw the axon (forward propagation) but may also propagate in the other direction (backpropagating spike, Falkenburger et al., 2001). The spike occurs in a very narrow time window followed by a fall of the membrane potential bellow the rest state. At that point, the neuron is hyperpolarized and its potential difference is greater with respect to the exterior region (arbitrarily defined as 0 mV). This stage is called refractory period and the neuron is typically not allowed to reach the threshold and consequently
9
to spike. Typically, the membrane potential relaxes to the rest potential before another cycle happens.
Figure 2.4: The action potential
2.3 The electroencephalography
The EEG is a recording of the brain’s electrical activity, in most cases, made from electrodes over the surface of the scalp or from needle electrodes inserted into the brain. One of the first ever reports about EEG was by Richard Caton (1875), who recorded the EEG oscillations from monkeys and rabbits. In 1929, Hans Berger reported the first reliable recording of the EEG from a human scalp and a first categorization of EEG oscillation into alpha (8-13 Hz) and beta waves (14-30 Hz). Here, we refer EEG only to that measured from the head surface. Generally, the EEG recordings could be categorized into two types: the spontaneous activity and the
10
evoked potentials. Spontaneous activity is often referred to the unprovoked occurrence of brain activity, in terms of the absence of an identifiable stimulus, with or without behaviour manifestation. The bandwidth of this signal is from under 1 Hz to over 100 Hz. The evoked potentials are time-locked components in the EEG that arise in response to a stimulus, which may be electric, visual, auditory, tactile, etc. Such signals are often evaluated by averaging a number of trials to improve the signal-to-noise ratio. EEG is measured using scalp electrodes, which record the difference in the electric potential between an electrode with an active neural signal and an electrode placed over a supposedly inactive region that serves as a reference. These recordings are the resultant field potentials containing many active neurons. However, the action potential in axons is revealed to contribute little to the scalp surface records, as they are asynchronous while the axons run in many different directions. Surface records are thought to be the net effect of local postsynaptic potentials of the cortical cells. Mostly, the EEG measures the currents that flow during synaptic excitations of the dendrites of many pyramidal neurons, a type of neuron found in areas of the brain including the cerebral cortex (Teplan, 2002). Although there are various EEG recording systems in the market, such systems conventionally include four parts: electrodes with conductive media, amplifiers with filters, A/D converter, and recording device. Electrodes are used to read the signal from the scalp; amplifiers increase the magnitude of the microvolt signals into a range which can be digitalized accurately; the converter changes the signals from analog to digital form; and the recorder system (normally personal computer) stores and displays the obtained data (Teplan, 2002). Additionally, a 10-20 system (Figure 2.5) EEG measurement has been adopted by the International Federation in Electroencephalography and Clinical
11
Neurophysiology (Jasper, 1958). Such a system provides the standardized physical placement of electrodes on the scalp. The electrodes are labelled according to adjacent brain areas: F (frontal), C (central), T (temporal), P (posterior), and O (occipital), with odd numbers on the left side and even numbers on the right side.
Figure 2.5: 10-20 system for the standardized electrode placement.
Two basic approaches are commonly used for the EEG analysis: (i) the analysis of evoked potentials (EPs); and (ii) the power spectrum analysis (EEG rhythms). These two methods have been applied in various experimental or field researches into human cognitive activities.
12
2.3.1 The evoked potentials
The evoked potential (EP) is a response induced by the presentation of an external stimulus that can be isolated from the electroencephalographic spontaneous activity. This means that, for any external stimulation, the brain reacts with a specific wave, characterized by a particular latency, an amplitude and a polarity. A given evoked potential appears at a time interval approximately constant from the presentation of the stimulus. Because the amplitude of each EP is smaller than the fluctuations in the amplitude of the spontaneous EEG, normally the EP is extracted from the EEG as the average of a series of single responses (synchronized averaging) in order to remove the random fluctuations of the EEG. In this way, the EEG variations which are not synchronized with the stimulus are deleted, while the EPs become more visible. From a morphological point of view, the EP is named according to the polarity of the peak that can be positive or negative (P or N) and to the latency with respect to the onset of the external stimuli. From the physiological point of view, the evoked potentials are defined as the electrical changes that occur in the central nervous system in response to an external stimulus: in this way, their latency and amplitude depend on the physical characteristics of the stimulus applied (e.g. tone and intensity for the auditory system; contrast, luminance, and spatial frequency for the visual system; intensity and stimulation mode for the somatosensory system). The evoked potentials are categorized into two basic types: the evoked potentials stimulus related (e.g. visual EPs, VEPs), which morphology depends from the physical characteristics of the stimulus, and the event related potentials (ERPs), which generation is independent from the physical characteristics of the stimulus but reflects the attentional resources of the subject.
13
2.1.1.3 Visual Evoked Potentials (VEPs)
The terms visually evoked potential (VEP), visually evoked response (VER) and visually evoked cortical potential (VECP) are equivalent. They refer to electrical potentials, initiated by brief visual stimuli, which are recorded from the scalp overlying visual cortex, VEP waveforms are extracted from the electroencephalogram (EEG) by means of a signal averaging synchronized to the onset of the stimuli. VEPs are used primarily to measure the functional integrity of the visual pathways from retina via the optic nerves to the visual cortex of the brain. Visually evoked potentials elicited by flash stimuli can be recorded from many scalp locations in humans. Visual stimuli stimulate both primary visual cortices and secondary areas. Clinical VEPs are usually recorded from occipital scalp overlying the calcarine fissure. This is the closest location to primary visual cortex. The time period analyzed is usually between 50 and 300 milliseconds following the onset of each visual stimulus. The most common stimulus used is a checkerboard pattern, which reverses every half-second. Pattern reversal is a preferred stimulus because there is more inter-subject VEP reliability than with flash or pattern onset stimuli.
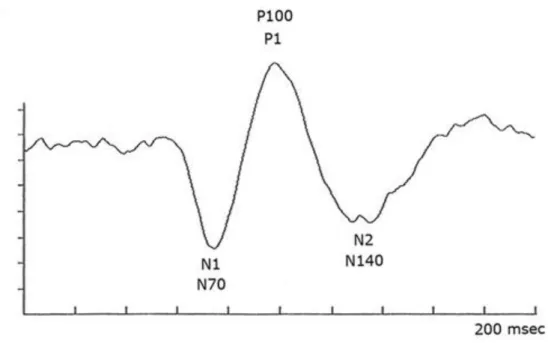
In the morphology of a VEP it is possible to differentiate few components (Figure 2.4): there is a prominent negative component at peak latency of about 70 ms (N1), a larger amplitude positive component at about 100 ms (P1) and a more variable negative component at about 140 ms (N2). The major component of the VEP is the large positive wave peaking at about 100 milliseconds. This “P100″ or P1 in the jargon of evoked potentials, is very reliable between individuals and stable from about age 5 years to 60 years. The mean peak latency of the “P100″ only slows about one millisecond per decade from 5 years old until 60 years old.
14
Figure 2.6: Representative normal pattern reversal VEP recorded from mid-occipital scalp using 50′ checkerboard pattern stimuli.
2.1.2.3 Event Related Potentials (ERPs)
Event-related potentials (ERPs) represent the voltage fluctuations that are associated in time with some physical or mental occurrence (Picton et al., 2000). ERP is a complex potential consisting of both time-locked fast and slow components, which could both precede an event or follow it (Kotchoubey, 2006). Since the late 1950s, the ERP analysis has been established as a psychophysiological approach to provide information about the cognitive processing of an event or a stimulus in the brain. ERP components are supposed to allow obtaining information about how the intact human brain processes signals and prepares actions.
15
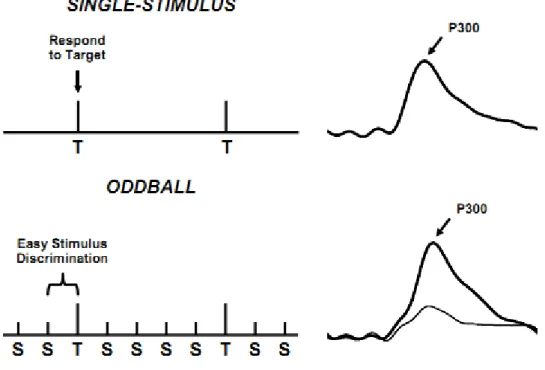
Specifically, the event related potential (ERP) P300 is a positive deflection of the EEG signal elicited in the process of decision-making (Fabiani et al., 1987). The P300 (P3) wave is an event related potential (ERP) component elicited in the process of decision-making. It is assumed an endogenous potential, as its occurrence links not to the physical attributes of a stimulus, but to a person's reaction to it. More specifically, the P300 is thought to reflect processes involved in stimulus evaluation or categorization. It is usually elicited using the oddball paradigm, in which low-probability target items are mixed with high-probability non-target (or "standard") items. The P300 component is measured by assessing its amplitude and latency. Amplitude is defined as the difference between the mean pre-stimulus baseline voltage and the largest positive-going peak of the ERP waveform within a time window (e.g., 250–500 ms, although the range can vary depending on stimulus modality, task conditions, subject age, etc.). Latency (ms) is defined as the time from stimulus onset to the point of maximum positive amplitude within a time window. P300 scalp distribution is defined as the amplitude change over the midline electrodes (Fz, Cz, Pz), which typically increases in magnitude from the frontal to parietal electrode sites (Johnson, 1996). The P300 potential can be evoked through different paradigms: The single-stimulus task presents an infrequent target (T) in the absence of any other stimuli. The oddball task presents two different stimuli in a random sequence, with one occurring less frequently than the other does (target = T, standard = S). In each task, the subject has to respond only to the target and otherwise to refrain from responding.
16
Figure 2.7: Schematic illustration of the single-stimulus (top) and oddball (bottom), with the elicited ERPs from the stimuli of each task at the right.
Latency and amplitude of the P300 potential can be influenced by several internal and external factors. Some of the determinants affecting P300 amplitude and latency include exercise and fatigue (Yagi et al., 1999), commonly used drugs, age, IQ, handedness, and gender, as well as some personality variables (Polich and Kok, 1995). Subjects who have eaten recently show a higher amplitude and a shorter latency than those who have not. Recent nicotine consumption affects both behavioral and P300 measures in some tasks (Houlihan et al., 1996). Caffeine, alcohol, and other substances have also been shown to influence the P300 morphology (Sommer et al., 1999). The amplitude and the latency of the P300 potential is reported to change with the age: latency increases of 1.8 ms/year and the amplitude decreases of 0.2μV/year. (Goodin et al., 1978). Rare no-target stimuli elicit different ERP components in
17
children and adults, while equally rare, target stimuli elicit similar components in children and adults (Courchesne, 1977). Also, the P300 increases in amplitude and decreases in latency with age (Polich et al., 1990). Auditory P300 has a centro-parietal distribution that increases in amplitude and decreases in latency (Martin et al., 1988) steadily from age 5 to age 19. Apart the physiological aspect, the P300 morphology is also dependent from the stimulation timing: the time between stimuli affects P300 amplitude, in particular the P300 potentials elicited with shorter timing within the stimuli have smaller amplitudes and longer latencies than those obtained with longer timing (Picton et al., 2000). The P300 potential is a measure of the attentional resources of the subject. In particular, the amplitude of the P300 is proportional to the amount of attentional resources engaged in processing a given stimulus (Johnson, 1986) and it is not influenced by factors related to response selection or execution (Crites et al., 1995). Gray et al., (2003) reported that the P300 amplitude therefore served as our covert measure of attention that arises independently of behavioral responding. Further, P300 latency is thought to reflect stimulus classification speed, such that it serves as a temporal measure of neural activity underlying attention allocation and immediate memory operations (Duncan and Johnson, 1981; Magliero et al., 1984; Polich, 1986). Finally, a large number of studies using ERPs to evaluate the mental user’s load have been conducted which proved that the amplitude and latency of P300 provide effective tools for the assessment of mental workload (Johnson, 1986, for further details refer to the 2.6.1 section).
The ERPs serve as important adjuncts to studies of human information processing, a fundamental problem with this method is the signal-noise ratio. The magnitude of the ERP signal is around 5-10 µV, which is far smaller than the amplitude of the
18
background EEG (0-100 µV ; Hagemann, 2008). Therefore, the classic approach for ERP extraction is to average the signal over a number of trials in order to obtain a stable response with a sufficient signal-to-noise ratio. In this regard, in the section 3.3 a method to enhance the signal to noise ratio (SNR) and to extract the single epoch P300 potential was reported (Aricò et al., 2014, [J 1], [C 3]).
2.1.3.3 Oddball paradigm
The oddball paradigm is a method used in evoked potential research in which trains of stimuli (usually auditory or visual) are used to assess the neural reactions to unpredictable but recognizable events (Figure 2.6). It has been found that the P300 event related potential across the parieto-central area of the skull is larger after the target stimulus (Polich et al., 2007). In the oddball paradigm, two stimuli are presented in a random series such that one of them occurs relatively infrequently (target stimuli). The subject is required to distinguish between the stimuli by noting the occurrence of every target mentally counting, button press and by not responding to the standard stimulus (Polich and Margala, 1997). For example, in a visual oddball task, there might be a 95% chance for a square to be presented and a 5% chance for a circle. When the targets (e.g. circles) appear, the subject must make a response, such as pressing a button or updating a mental count. This task has provided much of the fundamental data for the theoretical interpretation of P300 in terms of memory updating (Johnson, 1986), as well as in studies that suggest P300 amplitude is proportional to the amount of attentional resources required for a given task (Wickens et al., 1983; Kramer and Strayer, 1988). The oddball paradigm was widely used in several works in the brain computer interface (BCI) field (see section 2.7 for further details).
19
2.3.2 EEG rhythms analyses
The oscillatory activity of the spontaneous EEG is typically categorized into five different frequency bands: delta (0-4 Hz), theta (4-7), alpha (8-12), beta (12-30) and gamma (30-100 Hz), as shown in Figure 2.8. These frequency bands are suggested to be a result of different cognitive functions.
20
Figure 2.8: Comparison of EEG bands over one second of activity. Gamma (30-100Hz), Beta (12-30Hz), Alpha (8-12Hz), Theta (4-7Hz), and Delta (0-4Hz).
Delta (0 -4 Hz): The delta activity is characterized as high amplitude and low frequency. It is usually associated with the slow-wave sleep in the sleep research. It is suggested that delta waves represent the onset of deep sleep phases in healthy adults (Rechtschaffen and Kales, 1968). In addition, contamination of the eye activity is mostly represented in the delta frequency band.
Theta (4-7Hz): The generation of theta power is associated with the hippocampus (Buzsáki, 2002) as well as neocortex (Cantero et al., 2003). The theta band is thought to be associated with deep relaxation or meditation (e.g. Hebert and Lehmann, 1977; Kubota et al., 2001) and it has been observed at the transition stage between wake and sleep (Hagemann, 2008). However, theta rhythms are suggested to be important for learning and memory functions (Sammer et al., 2007), encoding and retrieval (Ward, 2003) which involve high concentration (Hagemann, 2008). It has also been suggested that theta oscillations are associated with the attentional control mechanism in the anterior cingulated cortex (Kubota et al., 2001; Smith et al., 2001) and is often shown to increase with a higher cognitive task demand (e.g. Gundel and Wilson, 1992; Gevins et al., 1998).
21
Alpha (8-12Hz): The alpha band activity is found at the visual cortex (occipital lobe) during periods of relaxation or idling (eyes closed but awake). It is characterized by high amplitude and regular oscillations with a maximum over parietal and occipital electrodes in the continuous EEG. The modulation of alpha activity is thought to be a result of resonation or oscillation of the neuron groups (Lopes da Silva et al., 1980; Smith et al., 2001). High alpha power has been assumed to reflect a state of relaxation or cortical idling. However, when the operator devotes more effort to the task, different regions of the cortex may be recruited in the transient function network leading to passive oscillation of the local alpha generators in synchrony with a reduction in alpha power (Smith et al., 2001). Recent results suggested that alpha is involved in auditory attention processes and the inhibition of task irrelevant areas to enhance signal-to-noise ratio (Cooper et al., 2006; Klimesch et al., 2007; Hagemann, 2008). Additionally, some researchers divide the alpha activity further into sub-bands to achieve a finer grained description of its functionality (e.g. Klimesch et al., 1999). For instance, the “mu” band (10-12 Hz) occurs with actual motor movement and intent to move with an associated diminished activation of the motor cortex (Dooley 2009).
Beta (13-30Hz): The beta wave is predominant when the human is awake. Spatially, it predominates in the frontal and central areas of the brain. It has been described that the high power in the beta band is associated with the increased arousal and activity. Dooley (2009) pointed out that the beta wave represents cognitive consciousness and an active, busy, or anxious thinking. Furthermore, it has been revealed to reflect visual concentration and the
22
orienting of attention (Birbaumer and Schmidt, 1996). The beta band can be further divided into several sub-bands: low beta wave (12.5-15 Hz); middle beta wave (15-18 Hz); high beta wave (> 18 Hz). These three sub-bands are associated with separate physiological processes. For instance, the high beta waves are suggested to be linked with the dopaminergic system (Gruzelier et al., 1990; Hagemann, 2008), while the low beta activities are thought to reflect the inhibition of phasic movements during sleep (Hagemann, 2008).
Gamma (30-100Hz): The gamma band is the fastest activity in EEG and is thought to be infrequent during waking states of consciousness (Dooley, 2009). It is reported that gamma waves are associated with perceptual blinding problem (Gray et al., 1989). More specifically, Tallon-Baudry et al. (2005) revealed that areas of lateral occipital cortex play an important role in visual stimulus encoding and show large gamma oscillations differently affected by attentional modulation. Recent studies reveal that gamma is linked with many other cognitive functions such as attention, learning, memory (Jensen, et al., 2007), and language perception (Eulitz et al., 1996).
2.4 The electrocardiography
The electrocardiogram (ECG) interprets the electrical activity caused by depolarization and polarization of the heart muscle. It reflects the electrical impulses produced by heart contraction. The ECG can be analyzed by means of three approaches: (a) time domain measures; (b) amplitude measures; and (c) frequency domain measures.
23
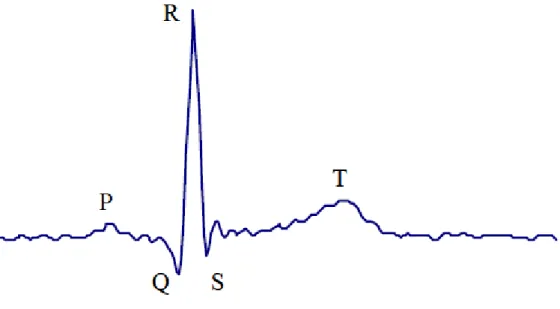
A typical time-domain ECG tracing of the cardiac cycle (heartbeat) consists of a P wave, a QRS complex, a T-wave, and a U-wave (Figure 2.9). The QRS complex is often used to detect peaks while the time between peaks i.e. namely, Inter-Beat-Interval (IBI), can be extracted. Typically, heart rate (HR) and heart rate variability (HRV) are widely used for the representation of the mental workload. HR is determined by the number of heart beats within a fixed period of time (usually per minute) and is non-linearly related to IBI. Compared with IBI, HR is less normally distributed in samples (Jennings et al., 1974). Additionally, the amplitude of T-wave (TWA) is another variable in the ECG signal reflecting sympathetic nervous system (SNS) activity (Furedy, 1987). Müller et al. (1992) reported that the amplitude of TWA decreased with increases in SNS activity
Figure 2.9: The typical time-domain ECG tracing of the cardiac cycle
Compared with HR and TWA, the analysis of HRV is more complex. HRV is usually defined as the changes in the interval between heart beats in either time or frequency domain. It reflects the irregularities in heart rate caused by a continuous feedback
24
between the CNS and peripheral autonomic receptors. Three frequency components have been defined: a very low frequency range (VLF; 0.02-0.06 Hz), a low frequency range (LF; 0.06-0.15 Hz; also called ‘0.1 Hz’ component), and a high frequency range (HF; 0.15-0.4 Hz). The VLF is believed to be linked to the regulation of the body temperature; LF is assumed to be involved in the regulation of short-term blood pressure; HF is shown to be related to respiratory fluctuations reflecting parasympathetic influences that are dependent on respiration frequency (Kramer, 1990; Grossman, 1992).
2.5 The attention: Overt vs Covert
Each time we open our eyes we are confronted with an overwhelming amount of information. Despite this, we experience a seemingly effortless understanding of our visual world. This requires selecting relevant information out of irrelevant noise. Attention is the key to this process; it is the mechanism that turns looking into seeing. In perception, ignoring irrelevant information is what makes it possible for us to attend to and interpret the important parts of what we see. Attention allows us to selectively process the vast amount of information with which we are confronted, prioritizing some aspects of information while ignoring others by focusing on a certain location or aspect of the visual scene. In general, three typologies of attention modalities can be identified:
Selective attention: The ability to process or focus on one message in the presence of distracting information.
25
Visual attention: The mechanism determining what information is or is not extracted from our visual field.
The appeal of visual attention seems to be related to an observation that is likely to disconcert a traditional vision scientist: changing an observer’s attentional state while keeping the retinal image constant can affect perceptual performance and the activity of ‘sensory’ neurons throughout visual cortex. For over a century, the study of visual attention has attracted some of the greatest thinkers in psychology, neurophysiology and perceptual sciences, including Hermann von Helmholtz, Wilhelm Wundt and William James. More recently (1960–1980s), many psychologists, including Michael Posner, Anne Treisman, Donald Broadbent and Ulric Neisser, have provided distinct theories and developed experimental paradigms to investigate what attention does and what perceptual processes it affects. Initially, there was a great deal of interest in categorizing mechanisms of vision as pre-attentive or attentive. The interest in that distinction has waned as many studies have shown that attention actually affects tasks that were once considered pre-attentive, such as contrast discrimination, texture segmentation and acuity. The influence of attention increases along the hierarchy of the cortical visual areas, resulting in a neural representation of the visual world affected by behavioral relevance of the information, at the expense of an accurate and complete description of it (e.g., Treue, 2001). Attention can affect perception by altering performance – how well we perform on a given task –and/or by altering the subjective appearance of a stimulus or object. These aspects will be discussed in the sections 3.1 and 3.2, in which the effects of the overt and covert attention modalities in the performance of two P300 BCI systems will be reported (Aloise et al., 2012a, [J 1] [J 6] [J 7] [J 10] [C 7] [C 28]).
26
There are three main types of visual attention: i) spatial attention, which can be either overt, when an observer moves his/her eyes to a relevant location and the focus of attention coincides with the movement of the eyes, or covert, when attention is deployed to relevant locations without accompanying eye movements; ii) feature-based attention (FBA), which can be deployed covertly to specific aspects (e.g., color, orientation or motion direction) of objects in the environment, regardless of their location; and iii) object-based attention in which attention is influenced or guided by object structure (Olson, 2001; Scholl, 2001).
2.5.1 Spatial (c)overt attention
Attention can be allocated by moving one’s eyes toward a location (overt attention) or by attending to an area in the periphery without actually directing one’s gaze toward it (covert attention). The deployment of covert attention aids us in monitoring the environment and can inform subsequent eye movements. Hermann von Helmholtz was the first scientist to provide an experimental demonstration of covert attention (Suzuki and Cavanagh, 1997). Looking into a wooden box through two pinholes, Helmholtz would attend to a particular region of his visual field (without moving his eyes in that direction). When a spark was lit to briefly illuminate the box, he found an impression of only the objects in the region he had been attending to, thus showing that attention could be deployed independently of eye position and accommodation. In general, to investigate covert attention, it is necessary to ensure that observers’ eyes remain fixated at one location, and to keep both the task and stimuli constant across conditions while manipulating attention. Spatial resolution, our ability to discriminate fine patterns, is not uniform across locations in the visual field. It decreases with
27
eccentricity. Correspondingly, signals from the central parts of the visual field are processed with greater accuracy and faster reaction times (e.g., Cannon, 1985; Carrasco, Evert et al., 1995; Rijsdijk et al., 1980). In many tasks, these performance differences are eliminated when stimulus size is enlarged according to the cortical magnification factor, which equates the size of the cortical representation for stimuli presented at different eccentricities (e.g., Rovamo and Virsu, 1979). There are several factors contributing to differences in spatial resolution across eccentricities. A greater proportion of the cortex is devoted to processing input from the central part of the visual field than from the periphery (cortical magnification) in many cortical visual areas (Sutter, 1992).
2.6 The mental workload
The mental workload is a measure of the resources required to process information during a specific task (O’Donnell and Eggemeier, 1986). Workload concept can be divided into five dimensions: instantaneous workload, peak workload, accumulated workload, average workload, and overall workload. The instantaneous workload measures dynamic changes in the workload values during task performance. The typical examples for such measures are the physiological markers. The peak workload is referred to as the maximal value of instantaneous workload. Accumulated workload is the total amount of instantaneous workload. The average workload is defined as the average of the instantaneous workload. Finally, the overall workload is the individual’s experienced mental workload which maps instantaneous workload (or accumulated and averaged workload) in the operator’s brain (Xie and Salvendy, 2000). In general, the mental workload is thought of as a mental construct, a latent
28
variable, or perhaps an “intervening variable” (Gopher and Donchin 1986), reflecting the interaction of mental demands imposed on operators by tasks they attend to. The capabilities and the effort of the operators in the context of specific situations all moderate the workload experienced by the operator. Workload is thought to be multidimensional and multifaceted. Workload results from the aggregation of many different demands and so is difficult to define uniquely. Casali and Wierwille (1984) note that as workload cannot be directly observed, it must be inferred from observation of overt behavior or measurement of psychological and physiological processes. Gopher and Donchin (1986) feel that no single, representative measure of workload exists or is likely to be of general use, although they do not provide guidance on how many workload measures they feel are necessary or sufficient (Cain, 2007). Mental workload can be influenced by numerous factors that make a definitive measurement difficult. Jex (1988) implies that mental workload derives from the operator’s meta-controller activities: the cognitive “device” that directs attention, copes with interacting goals, selects strategies, adjusts to task complexity, sets performance tolerances, etc. This supports the intuitive notion that workload can be represented as a function, and the utility of univariate workload measures as globally sensitive estimates of workload, while acknowledging that tasks of differing characteristics interfere differently. Alternatively, Wierwille (1988) suggests that an operator faced with a task is fully engaged until the task is done, then is idle or engages in another task.
29
2.6.1 Workload measurement techniques
The principal reason for measuring workload is to quantify the mental cost of performing tasks in order to predict operator and system performance. As such, it is an interim measure and one that should provide insight into where increased task demands may lead to unacceptable performance. In the comparison of system designs, procedures, or manning requirements, workload measurement can be used to assess the desirability of a system if performance measures fail to differentiate among the choices. Implicit in this approach is the belief that as task difficulty (workload) increases: performance usually decreases; response times and errors increase; control variability increases; fewer tasks are completed per unit time; task performance strategies change (Huey and Wickens 1993); and, there is less residual capacity to deal with other issues.The mental workload can be evaluated using mainly three approaches: i) subjective or self-assessment evaluation, ii) performance evaluation and iii) psychophysiological variables assessment.
2.6.2 Subjective evaluation
Subjective measures have been used extensively to assess operator workload in many studies (Tsang and Johnson, 1989; Zaklad, and Christ, 1989; Eggemeier and Stadler, 1984). The reasons for the frequent use of subjective procedures include their practical advantages (ease of implementation, non-intrusiveness) and current data which support their capability to provide sensitive measures of operator load. Many subjective procedures exist to measure mental workload. The most outstanding among them are the Cooper-Harper Scale (Cooper and Harper, 1969), the Bedford Scale
30
(Roscoe and Ellis, 1990), the SWAT (Subjective Assessment Technique) (Reid and Nygren, 1988) and the NASA-TLX (Task Load Index) (Hart and Staveland, 1988). Between these procedures, we will take into account only the NASA-TLX questionnaire that we used in many reported works (See section 2.2.1.6). Self-assessments involve rating demands on numerical or graphical scales, typically anchored either at one or two extremes per scale. Some subjective techniques use scales that are categorical, with definitions at every level, such as the Modified Cooper-Harper scale. Other techniques use an open-ended rating with a “standard” reference task as an anchor and subjects rate other tasks relative to the reference task. Despite this kind of measure is quite direct because the subject him/herself assesses the perceived workload, the repeatability and validity of such quantitative subjective techniques are sometimes uncertain and data manipulations are often questioned as being inappropriate.
2.2.1.6 NASA-Task Load Index (TLX)
The NASA Task Load Index (Hart and Staveland, 1988) uses six dimensions to assess mental workload:
1. Mental demand: How much mental and perceptual activity was required? Was the task easy or demanding, simple or complex?
2. Physical demand: How much physical activity was required? Was the task easy or demanding, slack or strenuous?
3. Temporal demand: How much time pressure did you feel due to the pace at which the tasks or task elements occurred? Was the pace slow or rapid?
31
4. Performance: How successful were you in performing the task? How satisfied were you with your performance?
5. Effort: How hard did you have to work (mentally and physically) to accomplish your level of performance?
6. Frustration: How irritated, stresses, and annoyed versus content, relaxed, and complacent did you feel during the task?
Twenty-step bipolar scales are used to obtain ratings for these dimensions. A score from 0 to 100 (assigned to the nearest point 5) is obtained on each scale. A weighting procedure is used to combine the six individual scale ratings into a global score; this procedure requires a paired comparison task to be per-formed prior to the workload assessments. Paired comparisons require the operator to choose which dimension is more relevant to workload across all pairs of the six dimensions. The number of times a dimension is chosen as more relevant is the weighting of that dimension scale for a given task for that operator. A workload score from 0 to 100 is obtained for each rated task by multiplying the weight by the individual dimension scale score, summing across scales, and dividing by 15 (the total number of paired comparisons).
2.6.3 Performance evaluation
The performance evaluation provides a direct correlation between the performance achieved by the subject during the task and the required mental workload. It can be classified into two major types: primary task measures and secondary task measures. In most investigations, performance of the primary task will always be of interest as its generalization to in-service performance is central to the study. Primary task measures
32
attempt to assess the operator’s performance on the task of interest directly, and this is useful where the demands exceed the operator’s capacity such that performance degrades from baseline or ideal levels. Speed, accuracy, reaction or response times, and error rates are often used to assess primary task performance (e.g. Multi Attribute Task Battery, MATB, Comstock, 1994).
In secondary task methods, performance of the secondary task itself may have no practical importance and serves only to load or measure the load of the operator. Secondary task measures provide an index of the remaining operator capacity while performing primary tasks, and are more diagnostic than primary task measures alone. The characteristics of the secondary task are used to infer the interaction between the primary and secondary tasks and this approach is frequently used when the operator can adapt to demand manipulations such that primary-task performance is apparently unaffected (Colle and Reid,1999).
2.3.1.6 Multi Attribute Task Battery (MATB)
The Multi-Attribute Task Battery (MATB, Figure 2.10) provides a benchmark set of tasks for use in a wide range of laboratory studies about operator performance and workload (Comstock, 1994). The MATB simulates the activities inside an aircraft’s cockpit and provides a high degree of experimental tasks control in terms of complexity and difficulty. Furthermore, task features include an auditory communications task (to simulate Air-Traffic-Control communications), a fuel resources management task of maintaining target performance (e.g. to keep the fuel level around 2500 lbs), an emergency lights control and a task of cursor tracking, that
33
is, it simulates the control of the aircraft flight level (this can be switched from manual to automatic mode).
Figure 2.10: Screenshot of the Multi Attribute Task Battery (MATB) interface. On the top left corner, there is the emergency lights task; on the top, in the center, there is the task of cursor tracking; on the left bottom corner, there is the radio communication task and, finally, in the center on the bottom, there is the fuel levels managing.
2.6.4 Psychophysiological variables assessment
Finally, the psycho - physiological measure, consists in the evaluation of the variability (and of the correlation) of one or more neurophysiological signals
34
(electroencephalogram (EEG), electrocardiogram (ECG), galvanic skin response (GSR), etc.) with respect to the mental workload required to the subject during the task (Kramer, 1990; Hancock and Desmond, 2001). This class of measures is based on the concept that increasing workload, for example by means of the increment of mental demand, leads to an activation in physical response from the body. Normally, a requirement of most psychophysiological measures is for reference data that establishes the operator’s unstressed background state. Such background states are subject to many factors and may change markedly over time so an operational baseline state is often used. For the purpose of this work, we will take into account only the EEG and the ECG signals as a measure of the user’s mental workload.
2.4.1.6 Electroencephalography
Characteristic changes in the EEG reflecting levels of mental workload have been identified in different works. In general, two kind of EEG features can be took into account for the representation of the human operator mental workload: ERPs and EEG rhythms modulation.
Event Related Potentials measurement
In the last decades, a large number of studies using ERPs to evaluate the mental workload have been conducted which proved that the amplitude and latency of P300 provide effective tools for the assessment of mental workload (Johnson, 1986; Schultheis and Jameson, 2004). For the workload assessment, three features from the P300, the latency, the latency jitter and the amplitude, are used.
35
P300 latency: Different studies demonstrated that the P300 latency provides a chronometric index for assess the duration of perceptual processing (Leuthold and Sommer, 1998). Kramer and Parasuraman (2007) also pointed out that the latency of P300 reflects the timing of stimulus identification and categorization processes. Previous research indicated that increasing the mental workload may lead to an extension of the P300 latency. Kutas et al. (1977) stated that increasing the difficulty of identifying the target stimulus also increased the latency of the P300 wave. Such conclusion was confirmed also by Fowler (1994). However, an increasing in the difficulty of response selection do not affect P300 latency (Magliero, 1984). This led to a discussion on whether the latency of the P300 provides a relatively pure measurement of perceptual processing and categorization time, independent of response selection and execution stages (Kutas et al., 1977; McCarthy and Donchin, 1981).
P300 latency jitter: This phenomenon happens when the lag between the onset of the stimulus of interest and the evoked P300 potential peak is not constant over the different stimuli. In different studies, the authors demonstrated that large latency variations were observed when the attention was divided between two tasks (Polich, 2007, Kutas et al., 1977). Aricò et al., (2014) demonstrated that a ERP-BCI used in covert attention modality, increase the workload perceived with respect to the overt attention, and at the same time the P300 latency jitter over the target stimuli significantly increases (for further details, please refer to the section 3.3).
P300 amplitude: It has been assumed that the amplitude of P300 is proportional to the amount of attentional resource allocation for the task performance (Johnson, 1986).
36
This assumption is in line with the findings in the oddball paradigm that the amplitude of P300 is sensitive to the probability of the presentation of stimulus. Gopher and Donchin (1986) suggested that the P300 amplitude could index the perceptual/central processing load, until the moment performance declines, in which case the amplitude remains unaffected. It is assumed that the amplitude of P300 may show different changes in the single and dual task performance. In a primary-task-only-condition, it was suggested that the P300 amplitude increases with task complexity. In a dual-task paradigm, the diversion of processing resources away from target discrimination leads to a reduction in P300 amplitude (Kramer and Parasuraman, 2007).
EEG rhythms modulation
An extensive body of literatures exists concerning the EEG spectra modulation according to the variation of the cognitive workload and the allocation of mental effort (Gundel and Wilson, 1992; Berka et al., 2007; Lei et al., 2009; Lei and Roetting, 2011) and applied settings (Wilson, 2002; Kohlmorgen et al., 2007; Aricò et al., 2013). Several studies described the correlation of spectral power of the electroencephalogram (EEG) with the complexity of the task that the subject is performing. In fact, an increase of the theta band spectral power (4 - 7 (Hz)) especially on the frontal cortex and a decrease in alpha band (8-12 (Hz)) over the parietal and occipital cortexes have been observed when the required mental workload increases (Lei and Roetting, 2011; Borghini et al., 2012). Specifically, at the Fz site the theta power was increased during high-load task relative to low-load task, whereas alpha power tended to be attenuated in the high-load task compared to low-load tasks. Consistent results have been found not only in similar working memory (WM) task
37
(Gundel and Wilson, 1992; Gevins et al., 1998), but also in more complex cognitive tasks (Smith et al., 2001; Wilson, 2002; Wilson and Russell, 2003). Smith et al. (2001) recorded continuous EEG while 16 participants performed versions of the compute based flight simulation task, the Multiple-Attribute Task Battery (MATB; Comstock, 1994), in low, moderate and high difficulty. As task difficulty increased, frontal midline theta EEG activity increased while parietal midline alpha decreased. In field research, Wilson (2002) reported a study involving ten pilots who flew an approximately 90-minute scenario containing both visual and instrument flight conditions. Multiple variables including EEG parameters were analyzed. Wilson (1992) found that parietal alpha band showed significant reduction in high workload condition, but an increasing in the theta power spectrum could only be observed at a few scattered electrode sites. However, disputing voices on theta power can be also heard. Decreases in theta activity were found with transitions from single to dual-tasks. Pigeau et al. (1987) revealed that theta power initially increases with increments in the task difficulty of an additional task and then decreases at high levels of difficulty. Alpha oscillation was found to systematically decrease in power as the task load increases. This inverse proportion has been found in numerous earlier studies (Sterman et al., 1988; Gevins et al., 1998) and is consistent with current understanding of the underlying neural mechanisms in the generation of the alpha rhythms.
Many studies attempted to combine the EEG parameters for a reliable index of neural activity, for example, using the ratio of the different band powers (Brookhuis and De Waard, 1993; Pope el al., 1995; Prinzel et al., 2000). Pope et al. (1995), who reported the first brain-based adaptive system, established a system to index the task engagement based upon ratios of EEG power bands (theta, alpha, beta, etc.). While
38
these changes are reproducible across subjects, and stable over the time, their estimations are relatively slow (more than five minutes in order to highlight differences between different mental workload levels).
Another approach towards real-time assessment of mental workload, instead of the EEG spectral components, is to use Brain-Computer-Interaction (BCI) technology, e.g. linear discriminate analysis (LDA), support vector machine (SVM), artificial neural network (ANN), etc. These studies classified workload into several levels (e.g. low, moderate and high) using the various EEG parameters in either a simple, single-task (Wilson and Fisher, 1995; Gevins et al., 1998; Nikolaev et al., 1998; Gevins and Smith, 1997) or complex tasks with skilled operators (Noel, et al., 2005; Russell and Wilson, 1998; Wilson and Russell, 2003; Grimes et al., 2008; Heger et al., 2010; Putze et al., 2010; Aricò et al., 2013). The use of the machine learning techniques allows to assess the subject's mental workload in a short time (few seconds) reaching a high accuracy (>90%) (Aricò et al., 2013, Kohlmogoren et al., 2007).
2.4.2.6 Electrocardiography
Heart Rate (HR): Since the hearth rate (HR) measure is easy to obtain and less sensitive to artefacts (Kramer, 1990), it is one of the most popular physiological parameters for mental workload assessment within various environments (Backs and Seljos, 1994; Wilson, 2002; Brookhuis and De Waard, 1993; Mehler et al., 2009). It is assumed that an increased mental workload leads to an increased cardiovascular activity, a heightened cortical energy transformation, and corresponding enhanced metabolic demands (Backs and Seljos, 1994). Although this generalization is widely accepted, not all studies agree with the findings. Some articles are critical of the use of
39
heart rate to measure workload because of the various psychological, environmental, and emotional factors that can influence the response (Jorna, 1993; Lee and Park, 1990; Roscoe, 1992). For example, “feelings of uncertainty and anxiety can significantly raise heart rate” (Jorna, 1993). Other research has determined that HR “does not appear to be of value as a sole measure of pilot workload but it can be strongly recommended as a technique to augment a good subjective rating scale” (Roscoe, 1992). HR is also sensitive to mental effort. Numerous studies have found correlations between cognitive demands and HR (Roscoe, 1992; Veltman and Gaillard, 1996, 1998; Caldwell et al., 1994). HR is sensitive to variations in task demand, but is also influenced by the contamination from physical effort, emotions and stress (Kramer, 1990). In a study on multitasking performance, Fairclough et al. (2005) explored the interaction between learning and task demand on psychophysiological reactivity. These authors used EEG activity, cardiac activity and respiration rate to evaluate the impact of task demand and learning and found that the sustained response to task demand was characterized by a reduction of parasympathetic inhibition (reduced vagal tone and increased heart rate), reduced eye blink duration. In another study, Wilson (2002) evaluated in a flight experimental scenario, ten pilots who were required to fly a 90-minute to test the reliability of psychophysiological measures of workload. Each pilot performed the same scenario twice to assess the test-retest reliability of the measures. Cardiac, electrodermal and electrical brain activity measures were highly correlated and exhibited changes in response to the demands of the flights. Wilson found that HR was more sensitive to the workload level than heart rate variability. Therefore, the majority of previous
40
researches consistently demonstrate that the increased workload leads to increased HR.
Heart Rate Variability (HRV): Several studies investigated the relationship between HRV and mental workload. It was demonstrated that HRV is sensitively decreased with increased mental demands in a binary choice task (Backs and Seljos, 1994; Lee and Park, 1990; Mehler et al., 2009). For instance, Lee and Park showed that both increased physical load and mental load could lead to decreased HRV. Brookhuis and De Waard (2001) stated that HRV shows sensitivity to computational effort but not to compensatory effort, while HR has generally been sensitive to both. As reported by Miller (2001), in laboratory studies, HRV has consistently responded to changes from rest to task conditions and to a range of between-task manipulations (Aasman et al., 1987; Sirevaag et al., 1987). In the experimental contexts, especially in flight-related studies, HRV increases as an indicator of the extent of task engagement in information processing requiring significant mental effort (Kramer, 1990; Sirevaag et al., 1987; Wilson and Eggemeier, 1991). HRV has been reported to respond rapidly to changes in operator workload and strategies, usually within seconds (Aasman et al., 1987; Coles and Sirevaag, 1987). Thus, HRV has been able to detect rapid transient shifts in mental workload (Kramer, 1990).
2.7 Brain Computer Interfaces (BCIs)
A BCI is a communication system in which messages or commands that an individual sends to the external world do not pass through the brain’s normal output pathways of peripheral nerves and muscles (Figure 2.11). For example, in an EEG-based BCI the
41
messages are encoded in EEG activity. A BCI provides its user with an alternative method for acting on the world (Wolpaw et al., 2002). More recently, Wolpaw and Wolpaw (2012) defined a Brain-Computer Interface as “a system that measures CNS
activity and converts it into artificial output that replaces, restores, enhances, supplements, or improves natural CNS output and thereby changes the ongoing interactions between the CNS and its external or internal environment”. In particular,
the electroencephalography (EEG) is the most commonly used technique to realize a BCI system, because the high temporal resolution and the portability, compared to other neuroimaging techniques (fMRI, MEG, etc.). A first categorization of the BCI systems can be made according to the invasiveness of the system. The invasive BCI systems are based on the use of electrodes implanted in the cerebral cortex of the user, which allow to obtain a high signal (control feature ) to noise (basic EEG) ratio. On the contrary, the non-invasive systems use the surface electrodes.
42
Figure 2.11: Basic design and operation of any BCI system. Signals from the brain are acquired by electrodes on the scalp or in the head and processed to extract specific signal features (e.g. amplitudes of evoked potentials or sensorimotor cortex rhythms, firing rates of cortical neurons) that reflect the user’s intent. These features are translated into commands that operate a device (e.g. a simple word processing program, a wheelchair, or a neuroprosthesis).
Regarding the non-invasive BCI, a second categorization is referred to the EEG feature used for act the control. Present-day BCIs fall into 4 groups: slow cortical potentials, SSVEP, P300 evoked potentials and EEG rhythms based BCIs.
43
Slow Cortical Potentials based BCIs: Among the lowest frequency features of the scalp-recorded EEG are slow voltage changes generated in cortex. These potential shifts occur over 0.5–10.0 s and are called slow cortical potentials (SCPs). Negative SCPs are typically associated with movement and other functions involving cortical activation, while positive SCPs are usually associated with reduced cortical activation (Rockstroh et al., 1993; Birbaumer, 1997). In studies over more than 30 years, Birbaumer and his colleagues have shown that people can learn to control SCPs and thereby control movement of an object on a computer screen (Elbert et al., 1980, Birbaumer et al., 1999, 2000). This demonstration is the basis for a BCI referred to as a ‘thought translation device’ (TTD). The principal emphasis has been on developing clinical application of this BCI system. It has been tested extensively in people with late-stage ALS and has proved able to supply basic communication capability (Kübler et al., 2001).
SSVEP based BCIs: It has long been established that any stimulus in the visual field that flickers at a specific frequency can cause neurons in visual areas to fire at the same frequency. These neural oscillations are called SSVEPs, also known as Steady State Visual Evoked Responses or SSVERs (Regan 1966). This effect is enhanced by attending to the flickering stimulus (Galloway 1990; Müller and Hillyard 2000). This suggests that users can indicate their interest in specific stimuli by choosing to attend or ignore it, thus providing the basis for a BCI (Ding et al. 2006).
P300 ERPs based BCIs: Infrequent or particularly significant auditory, visual, or somatosensory stimuli, when interspersed with frequent or routine stimuli, typically evoke in the EEG over parietal cortex a positive peak at about 300 ms (Walter et al.,