Alma Mater Studiorum – Università di Bologna
DOTTORATO DI RICERCA IN
CHIMICA
Curriculum: Chimica e Analisi Farmaceutica
Ciclo XXVIII
Settore Concorsuale di afferenza: 03/D1
Settore Scientifico disciplinare: CHIM08
TITOLO TESI
GLYCOGEN SYNTHASE KINASE 3BETA AS TARGET FOR
NEURODEGENERATIVE
DISEASE
DRUG
DISCOVERY:
PROTEOMIC APPROACHES TO CHARACTERIZE ITS ACTIVITY
IN VITRO.
Presentata da:
Dott.ssa Annalisa D’Urzo
Coordinatore Dottorato
Relatore
Prof. Aldo Roda
Prof.ssa Vincenza Andrisano
1
2
T
ABLE OF
C
ONTENTS
Introduction 3 Chapter 1 1.1 Abstract……… 1.2 Introduction………. 1.3 Experimental……… 1.4 Results and Discussion……… 1.5 Conclusion……….. 1.6 References……….. 6 7 8 10 15 25 26 Chapter 2 2.1 Introduction……… 2.2 Proposal ………. 2.3 References……… 30 31 32 34 Chapter 3 3.1 Abstract……….. 3.2 Introduction……… 3.3 Experimental ………3.4 Results and Discussion……….. 3.5 Conclusion 3.6 References……….. 3.7 Supporting Information……….. 35 36 37 39 42 49 50 53 Conclusion 67
3
I
NTRODUCTION
Scope of the thesis. The work described in this thesis was performed in order to develop
advanced analytical methods suitable to select and characterize Glycogen Synthase Kinase 3β 3β inhibitors in vitro (both cell free assay and cell-based assay). GSK-3β is a proline-directed serine-threonine kinase that was initially identified as a phosphorylating and an inactivating agent of glycogen synthase, then found as one of the key enzyme in neurodegenerative diseases (ND). Increased GSK-3β signaling, as found in Alzheimer disease (AD), not only leads to tau hyperphosphorylation, that is a prerequisite of Neurofibrillary Tangles (NFT), but also plays a direct role in several features of ND as modifying the axonal transport, enhancing toxic amyloid peptide production, inducing long term depression (LTD) and preventing memory formation [1]. Therefore, GSK-3β is recognized as a key target for the development of new therapeutic agents for AD.
Chapter 1. In order to select new potent and selective GS- 3β inhibitors by using in vitro
cell free assay, we validated an UHPLC-UV-Vis diode arrays detector (DAD) method for the very fast identification (resolution in less than 2 min) and determination of adenosine diphosphate (ADP) and adenosine triphosphate (ATP) in enzyme-based assay containing GSM-S synthetic peptide, ATP and GSK-3β. At present, there are a wide variety of indirect kinase assays that can be used to measure inhibition [2,3]. To overcome the drawbacks often associated to indirect methods, we aimed to a fast, direct and selective methodology, suited to monitoring in parallel ATP and ADP, in view of a more detailed description of the enzymatic reaction and for accurately describing the mechanism of action of potential inhibitors. By using this method, selected inhibition hits will be characterized by defining their competitive mode of action with the substrate rather than with the ATP cofactor, in view of the discovery of compounds endowed of an increased GSK-3β selectivity over other protein-kinases.
Chapter 2. Next, in order to verify that selected GSK-3β inhibitors can exert their
neuroprotective effects also in cell-based assay, we choose histones acetylation as biomarker, hypothesizing that GSK-3β could be directly involved in the regulation of
4
histone acetylation through Histone deacetylase (HDAC) protein. Our hypothesis accounts that inhibition of GSK-3β, which leads to reduced HDAC activity [8], could restores the acetylation level in histones, protecting against neurodegeneration. Interestingly, GSK-3β could be highly considered a critical node in the progression of AD and targeting its inhibition could lead to the inhibition of NFT and peptide β-amyloid [9] and to the restoring of histone acetylation level necessary for normal neuronal activity. The N-terminal tails of histones are subject to many enzyme–mediated post-translational modifications (PTMs) such as lysine acetylation that result in changes in the accessibility of DNA to transcription factors and in subsequent protein-protein interactions. The most thoroughly studied PTM is the acetylation of four universally conserved lysine residues K5, K8, K12, and K16 located within the amino-terminal tail of histone H4, which plays a role in epigenetic regulation in several important cellular events or diseases as cancer and Alzheimer disease (AD). Histone acetylation in particular has been shown to be important both in hippocampal long term potentiation (LTP) and memory formation in mice and both aging and AD pathology are associated with loss of histone acetylation (H4/H3) [4,5]. Therefore, quantification of histone modifications on individual lysine residues is of crucial importance to understand their role in cell biology and the loss of learning induced deacetylation at specific histone sites may represent biomarkers for memory loss and AD.
Chapter 3. This chapter describes a targeted liquid chromatography mass spectrometry
(LC-MS) method developed for the site-specific quantification of lysine acetylation in the N-terminal region of histone H4 from macrophage-like cell line RAW 264.7, with the perspective to apply the method on murine primary neurons upon administration of GSK-3β inhibitors. During the last decade Mass-Spectrometry (MS) became the most widely used technique to study histone post-translation modifications (PTMs), and has been applied to study the effect of inhibitors in cell culture [6,7]. However, the frequent occurrence of lysine residues in the N-terminus of histone H4 hampers the quantification of acetylation on specific lysine residues using current approaches based on protein labelling and digestion with a single protease like trypsin. The analytical strategy we developed shows that careful optimization of chemical derivatization steps at the protein and at the peptide level, combined with a more extensive digestion using chymotrypsin and trypsin, allows to differentiate between acetylation levels of each lysine residues.
5
References
1. Medina M, Avila J (2014) New insights into the role of glycogen synthase kinase-3 in Alzheimer's disease. Expert Opinion on Therapeutic Targets 18 (1):69-77
2. Partserniak I, Werstuck G, Capretta A, Brennan JD (2008) An ESl-MS/MS method for screening of small-molecule mixtures against glycogen synthase kinase-3 beta (GSK-3 beta). Chembiochem 9 (7):1065-1073
3. Baki A, Bielik A, Molnar L, Szendrei G, Keseru GM (2007) A high throughput luminescent assay for glycogen synthase kinase-3 beta inhibitors. Assay and Drug Development Technologies 5 (1):75-83
4. Francis YI, Fa M, Ashraf H, Zhang H, Staniszewski A, Latchman DS, Arancio O (2009) Dysregulation of Histone Acetylation in the APP/PS1 Mouse Model of Alzheimer's Disease. Journal of Alzheimers Disease 18 (1):131-139
5. Zhang K, Schrag M, Crofton A, Trivedi R, Vinters H, Kirsch W (2012) Targeted proteomics for quantification of histone acetylation in Alzheimer's disease. Proteomics 12 (8):1261-1268
6. Smith CM, Gafken PR, Zhang ZL, Gottschling DE, Smith JB, Smith DL (2003) Mass spectrometric quantification of acetylation at specific lysines within the amino-terminal tail of histone H4. Analytical Biochemistry 316 (1):23-33
7. Naldi M, Calonghi N, Masotti L, Parolin C, Valente S, Mai A, Andrisano V (2009) Histone post-translational modifications by HPLC-ESI-MS after HT29 cell treatment with histone deacetylase inhibitors. Proteomics 9 (24):5437-5445
8. Bardai FH, D'Mello SR (2011) Selective Toxicity by HDAC3 in Neurons: Regulation by Akt and GSK3 beta. Journal of Neuroscience 31 (5):1746-1751
9. Cai Z, Zhao Y, Zhao B (2012) Roles of Glycogen Synthase Kinase 3 in Alzheimer's Disease. Current Alzheimer Research 9 (7):864-879.
6
CHAPTER
1
Direct determination of GSK-3β activity and inhibition by
UHPLC-UV-Vis diode arrays detector (DAD)
J Pharm Biomed Anal
doi: 10.1016/j.jpba.2016.02.029
Annalisa D’Urzo1, Angela De Simone1, Jessica Fiori2, Marina Naldi2, Andrea Milelli1,
Vincenza Andrisano1.
1Department for Life Quality Studies, Alma Mater Studiorum-University of Bologna, Rimini,
Italy
2Department of Pharmacy and Biotechnology, Alma Mater Studiorum-University of Bologna,
7
Abstract
Altered GSK-3β activity can contribute to a number of pathological processes including Alzheimer’s disease (AD). Indeed, GSK-3β catalyzes the hyperphosphorylation of tau protein by transferring a phosphate moiety from ATP to the protein substrate serine residue causing the formation of the toxic insoluble neurofibrillary tangles; for this reason it represents a key target for the development of new therapeutic agents for AD treatment.
Herein we describe a new selective UHPLC methodology developed for the direct characterization of GSK-3β kinase activity and for the determination of its inhibition, which could be crucial in AD drug discovery.
The UHPLC–UV (DAD) based method was validated for the very fast determination of ATP as reactant and ADP as product, and applied for the analysis of the enzymatic reaction between a phosphate primed peptide substrate (GSM), resembling tau protein sequence, ATP and GSK-3β, with/without inhibitors. Analysis time was ten times improved, when compared with previously published chromatographic methods. The method was also validated by determining enzyme reaction kinetic constants (KM and vmax) for GSM and ATP and by
analyzing well known GSK-3β inhibitors. Inhibition potency (IC50) values for SB-415286 (81
± 6 nM) and for Tideglusib (251 ± 17 nM), found by the newly developed UHPLC method, were in good agreement with the luminescence method taken as independent reference method. Further on, the UHPLC method was applied to the elucidation of Tideglusib mechanism of action by determining its inhibition constants (Ki). In agreement with literature data, Tideglusib
resulted a GSM competitive inhibitor, whereas SB-415286 was found inhibiting GSK-3β in an ATP competitive manner. This method was applied to the determination of the potency of a new lead compound and was found potentially scalable to inhibitor screening of large compounds collections.
8
1. Introduction
Glycogen synthase kinase-3 (GSK-3) is an ubiquitous serine/threonine kinase first identified as one of several protein kinases that phosphorylated and inactivated glycogen synthase [1], the final enzyme in glycogen biosynthesis. Microtubule binding tau protein is a target of the GSK-3β isoform and has been demonstrated that increased GSK-3β signaling, as found in Alzheimer disease (AD) leads to tau hyperphosphorylation, a prerequisite for Neurofibrillary Tangles (NFT) formation. moreover, modifying the axonal transport, enhancing toxic amyloid peptide production, inducing long-term depression (LTD) and preventing memory formation, it also plays a direct role in several features of neurodegeneration (ND) [2-12]. Therefore, GSK-3β is recognized as a key target for the development of new inhibitors as potential therapeutic agents for neurodegenerative disease, including AD.
GSK-3 kinase is highly conserved throughout evolution and, in mammals, is encoded by two genes, GSK-3α and GSK-3β, which give rise two isoforms, 51 and 47 KDa respectively, which display a high degree of sequence identity at the level of their catalytic domain (98%) while at their N- and C- terminal regions the overall identity corresponds to 85% [13]. The two isoforms are not functionally redundant, as demonstrated by the gene knock-out studies [14], suggesting that they might have different physiological functions [15]. In adulthood, 3α and GSK-3β are most prominently expressed in the brain with particular abundance in hippocampus, neocortex, and cerebellum [16]. An alternative splice variant of GSK-3β, GSK-3β2, is a neuron-specific splicing isoform containing a 13 amino acid insertion in the catalytic domain [17].
In neurons, GSK-3β is intimately involved with control of apoptosis, synaptic plasticity, axon formation, and neurogenesis [2-8]. In vivo studies indicate that abnormal activity of GSK-3β is a key contributor to deficits in memory formation and neurodegeneration in AD. Transgenic animals that overexpress GSK-3 display alterations in brain size, impaired long-term potentiation (LTP), and deficits in learning and memory [9-12]. These animals also have features typical of AD such as hyperphosphorylation of tau protein, a prerequisite of neurofibrillary tangle (NFT), and enhanced production of Aβ peptide [9, 18-20]. Therefore, GSK-3β has attracted significant attention as a therapeutic target for the treatment of those disorders. In the last years a significant effort has been made to find highly selective GSK-3β
9
inhibitors both as potential therapeutic agents, able to modulate this abnormal activity, and as tools to understand the molecular basis of these disorders.
At present, a wide variety of assays are employed to evaluate GSK-3β inhibition. However, ATP-dependent assay as bioluminescent read-outs is an indirect method, where an additional enzyme (luciferase) is used to detect the degree of phosphorylation, without discriminating between substrate and product [21]. Radioassay is another approach to assess hyperphosphorylation of primed substrate by GSK-3β, but it is not scalable to high-throughput screening of large compound collections and has significant issues related to the use and disposal of radioactive materials [22]. Fluorescence plate readers are typically used for inhibitors screenings, nevertheless this technique presents limitations: false positive (inhibitors that fluoresce) false negative (inhibitors that quench fluorescence)[23].
Based on these considerations, we aimed to develop an accurate quantitative enzyme assay that does not require chromophore or radiolabelling and can be considered an useful analytical tool in numerous applications, particularly in the discovery of novel enzyme inhibitors, as potential leads for the treatment of AD. Therefore, we focused our attention on the development of a selective methodology suited to specifically monitoring ATP and ADP, cofactors in the GSK-3β catalyzed phosphorylation reaction of the primed peptide (GSM peptide), which resembles the protein sequence substrate (Fig.1).
In order to accomplish this aim, we validated an UHPLC-diode arrays detector (DAD) method for the very fast identification (resolution in less than 2 min) and determination of ADP and ATP in the enzymatic reaction containing GSM, ATP and GSK-3β with/without inhibitors. By using this validated method, selected inhibition hits were characterized by defining their potency and competitive mode of action with either the substrate or with the ATP cofactor, in view of the discovery of compounds endowed of an increased GSK-3β selectivity over other protein-kinases. Moreover, to gain a more detailed description of the enzymatic reaction for highlighting the mechanism of action of potential inhibitors, the UHPLC method was validated for inhibition studies, by testing two GSK-3β inhibitors, SB-415286 and Tideglusib, well known in literature for their potency and mechanism of action [24, 25].
10
Fig.1 GSM synthetic peptide sequence based on muscles glycogen synthase 1 where pS
corresponds to phosphorylated Serine residue. The presence of primed phosphorylation enhance the substrate affinity. The SXXXpS motif is specifically recognized by GSK-3β that phosphorylates the S residue by transfer of a phosphate moiety from ATP.
2. Experimental
2.1 Reagents and materials
GSK-3β enzyme (cod.14-306) and synthetic peptide GSM were purchased from Merck Millipore (Darmstadt, Germany). Kinase-Glo Luminescent Kinase Assay was obtained from Promega (Promega Biotech Iberica, SL).
Adenosine 5’-diphosphate (ADP) disodium salt, adenosine 5’-triphosphate (ATP) disodium salt hydrate, ammonium acetate, ammonium hydroxide, 4-(2-Hydroxyethyl)piperazine-1-ethanesulfonic acid (HEPES), Ethylene glycol-bis(β-aminoethyl ether)-N,N,N′,N′-tetraacetic acid tetrasodium salt (EGTA), Ethylenediaminetetraacetic acid (EDTA), dimethyl sulfoxide (DMSO), and 3-[(3-Chloro-4-hydroxyphenyl) amino]-4-(2-nitrophenyl)-1H-pyrrol-2,5-dione SB-415286 inhibitor were purchased from Sigma-Aldrich (St. Louis, MO, USA). Tideglusib was purchased by Selleckem (Houston, USA). Magnesium acetate tetrahydrate, sodium phosphate dibasic and tetrabutylammonium bisulfate (TBA) were purchased from Merck Millipore, (Darmstadt, Germany).
11
All other reagents were of analytical grade and filtered by nylon membrane filters 0.40 µM (Merck Millipore Darmstadt, Germany). Ultrapure water was obtained on a Purite LTD water purification systems (Thame, UK)
2.2. Standard Solutions
Stock standard solutions of ATP and ADP (1 mM) were prepared in 6 mM ammonium acetate 1.6 mM magnesium acetate pH 7.4 buffer (buffer A). Stock standard solutions of 1 mM GSM and 100 ng/μl GSK 3β were prepared in the buffer A, divided in aliquots and stored at -80°C. The GSM substrate resulted stable for six months. GSK-3β maintained its activity for one month after a single cycle of thawing. Further dilutions were prepared daily with fresh buffer A. The inhibitors were dissolved in DMSO in order to obtain 1 mg/mL stock solutions stored at -20°C. The stock solutions were diluted to the desired concentration with buffer A, in order to keep the percentage of DMSO below 1% value. The stock solutions resulted stable for more than six months.
2.3 Chromatographic conditions
The UHPLC/UV analysis was carried out by using a Jasco X-LC (JascoEurope, Cremella, Italy), including a binary pump (3185PU), autosampler (3059AS), a thermostated column compartment (3067C0), a degasser module (3080DG) and a Detector X-LC 3110 MD diode array (DAD). Instrument control, data acquisition, and processing were performed with software CromNAV Control Center. A reversed phase column (Kinetex 1.7 µm, C8, 100Å, 50 x 2.1 mm, Phenomenex, United State) was equilibrated with a mobile phase consisting of buffer containing 20 mM sodium phosphate (pH 7.0) and 5mM tetra-n-butylammonium / methanol (85/15) (v/v). Optimized chromatographic separation of ATP and ADP was carried out under isocratic conditions with a flow rate of 0.4 mL/min and the column oven set at T= 50°C. The eluent was monitored at 260 nm for nucleotide detection with a UV-DAD set in the range 210-450 nm.
In order to optimize the chromatographic conditions, pH buffer, TBA and phosphate concentrations and flow rate were investigated and optimized. Van Deemter plot was obtained by plotting theoretical plate height (H) versus flow rate. H was determined by H=L/N, dividing the length of the column by the number of plates N. N was determined from the
12
chromatographic data by applying the following formula N= 16 (Rt/w)2 where Rt= retention time of ADP/ATP; w=chromatographic peak width.
2.4 UHPLC Method validation
The method calibration and validation was performed on standard mixtures. For all the calculations, the analyte concentration was defined in terms of µM concentration of the injected volume (1 µL). Calibration curves were plotted for the ATP and ADP reference standards by performing UHPLC-UV analysis in triplicate on five incremental dilutions of the stock solutions. The concentration range for ADP and ATP were 0.5-10 µM, 0.25-250 µM, respectively. Calibration graphs were obtained by plotting the ADP and ATP peak areas, versus the corresponding analyte concentration. The detection limit (LOD, S/N=3) and quantification limit (LOQ, S/N=10) were also determined by performing UHPLC-UV analysis in triplicate on incremental dilutions of the standard mixture and real GSK3-β assay sample.
To verify the accuracy of analyses, ATP and ADP respectively were added to the individual enzymatic solution and substrate.
2.5. GSK 3β Activity Assay and kinetic studies by UHPLC
The activity of GSK 3β was determined by measuring the formation of ADP. The buffer, used to measure the enzymatic activity, contained 6 mM ammonium acetate pH 7.4, 1.6 mM magnesium acetate, 1% DMSO. Spontaneous hydrolysis of ATP and interference from enzyme solution and buffer were accounted by preparing the corresponding blanks. Assay solutions µL consisted of GSK-3β (2.5 ng µL-1), ATP (250 µM) cofactor, GSM (250 µM) substrate, final volume 40 µl. The reaction was initiated with the addition of the enzyme. The mix solutions were shaken for 10 seconds at 300 rpm and activity assays were carried out in the Termomixer equipment (Eppendorf, Hamburg, Germany) at 30oC for 30 min. After incubation, assay reactions were stopped adding 40 µL of methanol. An additional 40 µL volume of mobile phase buffer for chromatographic analysis was further added to the assay reaction. An aliquot of 1 µL of the reaction mixture was injected into the chromatograph under the chromatographic conditions described in section 2.3.
The extent of the enzymatic conversion was monitored by following the increase in ADP chromatographic peak area. The samples containing only ATP in buffer A were incubated and injected into UHPLC system as reaction blank. The amount of ADP obtained from ATP spontaneous hydrolysis was subtracted in the enzymatic assay samples. Enzymatic activity was
13
calculated by determining the amount of ADP, interpolating the ADP peak area in its calibration curve, which was produced in 30 min incubation time.Kinetic constants (KM and
vmax) values for GSK3β were determined by injecting in duplicate under the chromatographic
conditions 1 μL aliquots of enzymatic mixtures. The dependence of enzymatic activity on ATP and GSM was investigated by assaying both ATP and GSM in the concentrations ranging from 0 µM to 250 µM. The parameters for ATP were determined under saturating conditions of GSM (250 µM) and the parameters for GSM were determined using saturating concentrations of ATP (250 µM). By plotting the picomoles of ADP formed per minute (v) versus the GSM substrate or ATP cofactor concentrations, Michaelis–Menten and Lineweaver-Burk plots were obtained and KM, Ki and Vmax values evaluated [26].
2.6 GSK-3β Inhibition study
2.6.1 IC50 determination by UHPLC
The inhibition studies were performed by setting the assay solutions, composed of 2.5 ng/µL GSK-3β, 250 µM GSM substrate and 250 µM ATP, in presence of increased concentrations of the inhibitors SB-415286 and Tideglusib. Incubation time, final solution assay volume and temperature were set up as for the kinase assay above described in section 2.5.
The assay solutions containing increasing inhibitor concentration and a fixed GSM and ATP concentrations were then injected into the chromatographic system and the ADP peak areas integrated (Ai).
The peak areas were compared with those obtained in absence of inhibitor and % inhibition, due to the presence of increasing test compound concentration, was calculated by the following expression: 100−(Ai/A0 × 100) where Ai is the ADP peak area calculated in the presence of
inhibitor and A0 is the peak area obtained in the absence of inhibitor. Inhibition curves were
obtained for each compound by plotting the % inhibition versus the logarithm of inhibitor concentration in the assay solution. The linear regression parameters were determined for each curve and the inhibitor concentration that reduces at 50% the enzyme maximum velocity (IC50)
was extrapolated.
2.6.2. Determination of steady-state inhibition constant (Ki) and inhibitors mechanism of action by UHPLC
To obtain estimates of the ATP or GSM competitive inhibition constant Ki, reciprocal plots of
14
in duplicate enzymatic mixture containing either GSM (15-125 μM) and ATP (250 μM), increasing covalent inhibitor concentrations, and using the chromatographic conditions reported in Section 2.3. Product formation rates (v) were estimated by integrating the resulting ADP peak areas. The plots were assessed by a weighted least-squares analysis that assumed the variance of v to be a constant percentage of v for the entire data set. Slopes of these reciprocal plots were then plotted against inhibitor concentration and Ki was determined as the ratio of the replot intercept to the replot slope.Mechanism of action was evaluated by qualitatively comparing Lineweaver–Burk plot trends to the theoretical ones [27].
2.6.3 GSK-3β inhibition by luminescence assay
The method of Baki et al [21] was followed to analyze the inhibition of GSK-3β. Assays were performed in 50 mM HEPES, 1 mM EDTA, 1 mM EGTA, and 15 mM magnesium acetate pH 7.5 assay buffer using white 96-well plates. In a typical assay, 10 μL of test compound (dissolved in DMSO at 1 mM concentration and diluted in advance in assay buffer to the desired concentration) and 10 μL (20 ng) of enzyme were added to each well followed by 20 μL of assay buffer containing 25 μM substrate and 1 μM ATP. The final DMSO concentration in the reaction mixture did not exceed 1%. After a 30 min incubation at 30 °C, the enzymatic reaction was stopped with 40 μL of Kinase-Glo reagent. After 10 min., luminescence in the entire visible range was recorded using a Victor™ X3 Perkin Elmer multimode reader. The activity is proportional to the difference of the total and consumed ATP. The inhibitory activities were calculated on the basis of maximal kinase and luciferase activities measured in the absence of inhibitor and in the presence of reference compound inhibitor SB-415826, [24] at total inhibition concentration, respectively. The linear regression parameters were determined and the IC50 extrapolated (GraphPad Prism 4.0, GraphPad Software Inc.).
15
3. Results and discussion
The in vitro GSK-3β catalysed reaction is described in Fig.1. GSM is a synthetic peptide substrate, based on muscle glycogen synthase1, in which (pS) corresponds to the phosphorylated serine residue. The GSK-3β recognized sequence brings a serine/threonine at four amminoacids distance from a phosphorylated serine (Serine/Threonine)XXX(pSerine), a motif that represents an ideal model of target primed substrate for GSK-3β. In fact GSK-3β requires primed phosphorylation of the majority of its substrates and recognizes specifically the (S/T)XXX(pS) motif, whereby the first priming phosphorylation event is performed by another kinase in vivo andoccurs at the serine/threonine located after four amminoacids at N- terminal of the peptide sequence. Since ATP is consumed during the GSK-3β catalysed transfer of one phosphate moiety to the peptide substrate, giving rise to ADP, we developed a fast UHPLC method for the analysis of the enzymatic reaction by determining the amount of ADP.
3.1 UHPLC-DAD chromatographic method. Optimization and validation
. We previously reported the development and optimization of an ion exchange liquid chromatography (LC) method for the determination of ATP, ADP and AMP [28]. Separation of the nucleotides was achieved in a 15-min run by using a disk shaped monolithic ethylene diamine stationary phase, under a three-solvent gradient elution mode and UV detection. The described method resulted highly specific but not suitable for high-throughput screening due to the long gradient elution run time.Here the application of UHPLC technology allowed the determination of GSK-3β in vitro kinetics, and the possibility of developing a fast automated analysis of potential inhibitor collection. The developed chromatographic UHPLC method is based on the use of a C8 stationary phase packed with sub-2-μm particles [29], under ion pairing conditions. Elution of the ATP and ADP was obtained in less than 2 min, keeping the same resolution when compared to HPLC analysis performed with both monolith and column packed with conventional particle sizes [30].
16
Mobile phase composition and flow rate were optimized in order to achieve high selectivity, high resolution values and suitable analysis time, by injecting standard mixtures of adenosine nucleotides.
In this ion-pair HPLC method, we confirmed that the separation of negatively charged ATP and ADP is achieved due to either (1) the modification of the column’s surface by reversible binding of TBA, a large hydrophobic cations, or (2) to the binding of the ion pair complex of the cation with oppositely charged species formed in the mobile phase to the hydrophobic stationary phase [31, 32]. In order to elucidate the retention mechanism, different mobile phase compositions (phosphate ions and TBA concentration, percentage of the organic modifier) on ADP and ATP retention times and resolution were investigated. The obtained chromatographic data suggests the phosphate competition with the nucleotides anions distribution on the TBA modified stationary phase, under an ion-exchange mechanism [33]. This mechanism is in agreement with the higher retention time of ATP, which bears one phosphate moiety more than ADP. Since the increasing of the organic modifier percentage results in ADP and ATP decreased retention times, an alternative ion-pair mechanism can be invoked to explain the retention behavior of such compounds.
Flow rate optimization was carried out determining the H trend at various flow rate. The construction of plate height curve [34] was performed by injecting fixed ADP/ATP concentration at increasing flow rate. The obtained graph showed that the best flow rate was 0.4 mL/min (Fig. 2), because the minimum H value was reached, indicating the highest plate number i.e. the best efficiency. Baseline resolution of the two analytes plus AMP, was obtained under the optimised conditions, with a mobile phase consisting of buffer solution containing 20 mM sodium phosphate (pH 7.4) and 5 mM TBA and methanol (85:15 v/v); column oven was set at 50°C in order to reduce solvent mixture viscosity and UV detection at 260 nm., maximum absorption wavelength for both compounds. Representative chromatogram of ATP and ADP separation is shown in Fig. 3. Peak identification was performed by comparing retention times of the standard solutions and peak apex UV spectra.
The method linearity was estimated by plotting the obtained peak area of each analyte versus the corresponding analyte concentration expressed as µM. The calibration curves for ADP and ATP were found linear (r2 = 0.998 for both) and were described by the equations y = 1335.6 x + 334.04 for ADP and y = 1494.1 x + 282.62 for ATP (n = 3). Limit of Detection (LOD) for ADP was found to be 0.75 ± 0.18 µM from the linear regression equation (3 x b/s, where b is
17
the y-intercept and s is the slope). Limit of Quantification (LOQ) was determined as 2.25 ± 0.54 µM by 3*LOD.
Fig. 2 Van Deemter plot relates plate height (H) to linear velocity of mobile phase (u) at 50°C
18
Fig. 3 Representative chromatogram for ADP (60µM) and ATP (60µM) separation. The standard solution was analysed under chromatographic conditions described in section 2.3.
3.2 GSK-3β kinetic studies by UHPLC
The experimental conditions to perform the GSK-3β kinetic studies in vitro were developed by determining the substrate and cofactor kinetic constants KM and Vmax. The determination of the
activity and kinetic parameters of GSK-3β was carried out in buffer A, that was found to be the optimum buffer compatible for UHPLC analysis. Substrate, cofactor and enzyme were incubated for 30 min at 30°C and injected into the UHPLC system, under the chromatographic conditions reported in section 2.3, after the previous addition of 40 µL of methanol and 40 µL of chromatographic buffer. GSK-3β activity was determined by following the conversion of ATP into ADP. The amount of ADP was determined by interpolating its peak area into the calibration curve. ADP production was correlated to substrate or cofactor to obtain Michaelis– Menten plots for ATP and GSM.
19
Optimum enzyme concentration and incubation time were respectively found to be 2.5 ng/µL and 30 minutes, by injecting the kinase assay solution at increasing concentration of the enzyme (range 0-5 ng/µl) and at increasing incubation time (range 15-120 min) (data not shown). ATP and GSM concentrations varied independently in order to ascertain the saturating conditions for substrate and cofactor. Under the experimental conditions, the saturating concentrations for ATP and GSM were 250 µM and 250 µM, respectively. .
The Km and Vmax values for ATP/GSM were determined by plotting the enzyme activity, by
means of the ADP picomoles min-1, versus the ATP or GSM concentration of the assay (Fig. 4). By using a non linear fitting with the equation: Y = Bmax * X/(Kd+X), the kinetic constants values were obtained in good agreement with literature [35] and reported in Table 1.
Fig. 4 Michaelis–Menten plots showing the rate of GSK-3β catalysis. ADP pmol min−1 vs. injected GSM or ATP concentrations are showed in plot a and b respectively
20
*Data obtained by the luminescence method [21]
Table 1 Kinetic constants for GSM and ATP obtained by the UHPLC method. Data reported
are the mean of two independent measurements, each performed in duplicate.
3.3 Kinetics analysis of GSK-3β inhibition
The developed UHPLC method for GSK-3β kinase activity based assay was tested to evaluate the GSK-3β inhibition by using two well-known inhibitors. In order to validate our method, reference inhibitors with known potency and mechanism of action were chosen: SB-415286 (Fig. 5a), is a maleimide derivative and cell permeant small-molecule that has showed in vitro potent and selective GSK-3β inhibition in an ATP competitive manner [24]. Further data have revealed the role of SB-415286 to prevent neuronal death. At this regard, SB-415286 has shown the capability to protect primary neurones from death induced by reduced phosphatidylinositol 3-kinase pathway activity [37]. The second tested compound is Tideglusib (Fig 5b), well known in literature to be a potent, irreversible and non ATP competitive GSK-3β inhibitor [27]. GSM ATP KM (µM) 17 ± 3 25* 20 ± 2 >3* vmax (pmoles/min.) 18.8 ±8 13.3 ±8
21
Fig. 5 GSK-3β inhibitor structures: a SB-415286 ATP competitive inhibitor, b Tideglusib non ATP-competitive inhibitor and c EC7 novel GSK-3β inhibitor.
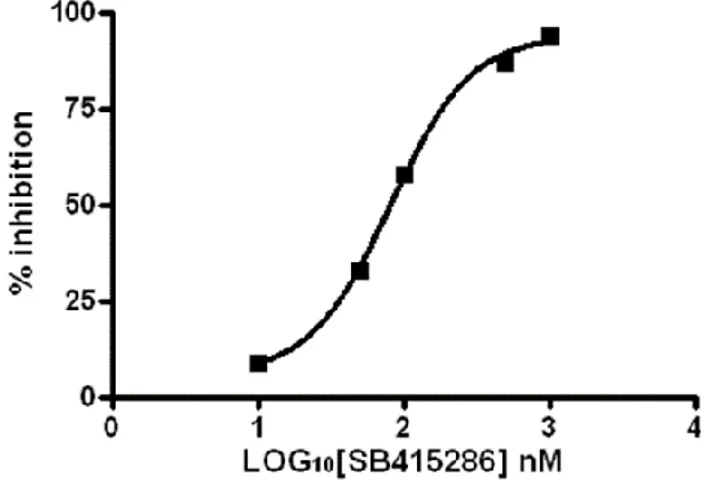
The IC50 of the two known inhibitors (Tideglusib and SB-415286), whose potency is in the low
micro molar range, was assessed by extrapolation from the inhibition curves (Fig. 6). The inhibition curves were obtained by incubating GSK-3β with simultaneously both the GSM and ATP at a fixed saturating concentration, as determined by the Michaelis–Menten plot, and inhibitors at increasing concentration. Increasing reduction of the ADP peak area (i.e. inhibition of enzyme rate of hydrolysis), when compared to the area obtained by the sole substrate and cofactor, was obtained for increasing inhibitors concentration (Fig. 7). The percent inhibition was plotted against the logarithm of inhibitor concentration to obtain the inhibition curves. The IC50 values was obtained by interpolation in the inhibition curve.
22
Fig. 6 Non -Linear regression analyses obtained by plotting inhibition of ATP catalysis versus
increasing SB-415286 inhibitor concentrations by UHPLC analyses.
Fig.7 Overlaid chromatograms obtained after injection of reaction mix solutions prepared as
described in section 2.5 plus increasing inhibitor concentration. The solid line chromatogram is relative to GSK-3β activity. Overlaid decreasing ADP peaks for reaction mixtures containing increasing inhibitor concentration (dashed lines).
23
The IC50 values obtained in the UHPLC method were compared with the values obtained with
the luminescence method and a valid correlation was obtained (Table 2), SB-415286 being a three times stronger inhibitor than Tideglusib. This validation allows a direct comparison between UHPLC inhibition potencies and IC50 values determined with the reference
luminescence method. Further on, the results indicate that the UHPLC method can be used for the on-line screen of new GSK-3β inhibitors.
Luminescence
method UHPLC method
IC50 (nM)±SEM IC50 (nM)±SEM
SB-415286 70 ±8 81 ± 6
Tideglusib 200 ± 15 251 ± 17
Table 2. Inhibitors’ potencies obtained with the reference luminescence and new UHPLC
methods.
The mechanism of action of SB-415286 inhibition was further investigated by carrying out the inhibition experiment at a lower concentration of ATP (125 µM). The resulting IC50 values of
45 ± 5 nM confirmed a clear mechanism of ATP competition. [24]. In fact a lower IC50, (higher
potency of inhibition) is observed in the presence of a lower ATP concentration, indicating a competition for the same site on the enzyme.
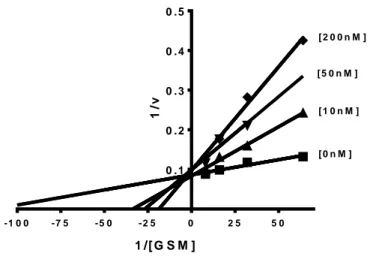
Conversely, Tideglusib showed a competitive mechanism of inhibition with the substrate GSM. In fact, its IC50 value was found to be 250 ± 17 nM at ATP 250 µM, whereas, at 125 and
62.5 µM GSM concentrations, its potencies were found respectively 15 ± 0.6 nM and 5 ±1 nM, In Fig.8, Lineweaver–Burk plots obtained for Tideglusib is reported as an example of substrate GSM competitive mechanism of action. Reciprocal plots for Tideglusib inhibition showed unvaried Vmax and increasing x-intercepts (higher KM) at increasing inhibitor concentrations,
as a pure GSK-3β competitive inhibitor.
These results are in agreement with patterns obtained with the same enzyme in the fluorescence or radiometric method [27]. Replots of the slope versus the concentration of inhibitor gave
24
estimate of the competitive inhibition constant (Ki), in agreement with data reported in literature for the GSK-3β FRET-based Z`-LYTETM technology inhibition. The Ki value of 96 nM obtained with the UHPLC method, based on ADP determination was therefore found to well correlate with the value reported in the literature [27].
The proposed new UHPLC method was further validated determining the IC50 value of the
EC7 (see Fig. 5c for structure) a non-classical inhibitor recently synthesized by the research group of Milellli A. as a GSK-3β inhibitor competitive for the substrate and endowed with a micromolar inhibitory potency. For this compound we obtained a IC50 value of 9.51 ± 0.13 µM
and 5.14 ± 0.11 µM by luminescence and UHPLC assay respectively.
Fig. 8 Kinetic study of Tideglusib mechanism of GSK-3β inhibition. Overlaid Lineweaver– Burk reciprocal plots of GSK-3β initial velocity at increasing substrate concentration (0.015-0.125 mM) in the absence and in the presence of Tideglusib (0-200 nM) are shown. Lines were derived from a weighted least-squares analysis of the data points. Tideglusib competitive mechanism of action is confirmed by all inhibitor curves having the same y-intercept i.e. the same Vmax. - 1 0 0 - 7 5 - 5 0 - 2 5 0 2 5 5 0 0 . 1 0 . 2 0 . 3 0 . 4 0 . 5 1 /[ G S M ] 1 /v [ 2 0 0 n M ] [ 5 0 n M ] [ 1 0 n M ] [ 0 n M ]
25
4. Conclusions
The obtained results indicate that the UHPLC method can be used for the on-line screening of new potential GSK-3β inhibitors. It is remarkable the time reduction for such a determination: a chromatographic run of 2 min gives a preliminary indication of the inhibitors potency. Considering that the development of new inhibitors require a large number of compounds to be tested for the lead selection and optimization, provided that an autosampler is put on-line, hundreds of compounds can be processed in continuous. Due to these peculiarities, this method can be considered suitable for high-throughput screening (HTS) in drug discovery.
This new methodology results more feasible than those based on radiolabeled ligands or on FRET technologies. Moreover, it offers the opportunity of overcoming the luminescence assay related drawbacks to the indirect determination of kinase activity (it is based on not hydrolyzed ATP quantification by a second enzyme); a too high substrate conversion, that made this assay not suitable for kinetic purpose; the detection of false negative, due to the possibility of test compounds to interact with luciferase or to absorb luminescent emission. The UHPLC method gives the opportunity of directly quantify ADP as reaction product. It is suitable for HTS without the risk of detecting false results. Furthermore the determination of kinetic parameters is also possible. This is of great interest in the drug discovery process of GSK-3β inhibitors because of the lack of non-ATP-competitive compounds. The new method results also advantageous in terms of costs and time since there is no need of a second enzyme, the analysis time is very short and the process can be automatized by autosampler employment.
26
References
[1] N. Embi, D.B. Rylatt, P. Cohen, Glycogen synthase kinase-3 from rabbit skeletal muscle. Separation from cyclic-AMP-dependent protein kinase and phosphorylase kinase, Eur. J. Biochem. 107 (1980) 519-27.
[2] R.J. Crowder, R.S. Freeman, Glycogen synthase kinase-3 beta activity is critical for neuronal death caused by inhibiting phosphatidylinositol 3-kinase or Akt but not for death caused by nerve growth factor withdrawal, J. Biol. Chem. 275 (2000) 34266-71.
[3] H. Jiang, W. Guo, X. Liang, Y. Rao, Both the establishment and the maintenance of neuronal
polarity require active mechanisms: critical roles of GSK-3beta and its upstream regulators, Cell 120 (2005) 123–135.
[4] T. Yoshimura, Y. Kawano, N. Arimura, S. Kawabata, A. Kikuchi, K. Kaibuchi, GSK-3beta regulates phosphorylation of CRMP-2 and neuronal polarity, Cell 120 (2005) 137–149. [5] W.Y. Kim, F.Q. Zhou, J. Zhou, Y. Yokota, Y.M. Wang, T. Yoshimura, K. Kaibuchi, J.R. Woodgett, E.S. Anton, W.D. Snider, Essential roles for GSK-3s and GSK-3-primed substrates in neurotrophin-induced and hippocampal axon growth, Neuron 52 (2006) 981–996.
[6] Y. Zhao, B.J. Altman, J.L. Coloff, C.E. Herman, S.R. Jacobs, H.L. Wieman, J.A. Wofford, L.N. Dimascio, O. Ilkayeva, A. Kelekar, T. Reya, J.C. Rathmell, Glycogen synthase kinase 3α and 3β mediate a glucose-sensitive antiapoptotic signaling pathway to stabilize Mcl-1, Mol. Cell. Biol. 27 (2007) 4328–4339.
[7] D. Muyllaert, A. Kremer, T. Jaworski, P. Borghgraef, H. Devijver, S. Croes, I. Dewachter, F. VanLeuven, Glycogen synthase kinase-3beta, or a link between amyloid and tau pathology? Genes Brain Behav. 7 (2008) 57–66.
[8] E.M. Hur, F.Q. Zhou, GSK3 signalling in neural development, Nat. Rev. Neurosci. 11 (2010) 539–551.
[9] J.J. Lucas, F. Hernandez, P. Gomez-Ramos, M.A. Moran, R. Hen, J. Avila, Decreased nuclear beta-catenin, tau hyperphosphorylation and neurodegeneration in GSK-3beta conditional transgenic mice, EMBO J. 20 (2001) 27–39.
[10] F. Hernandez, J. Borrell, C. Guaza, J. Avila, J.J. Lucas, Spatial learning deficit in transgenic mice that conditionally over-express GSK-3beta in the brain but do not form tau filaments, J. Neurochem. 83 (2002) 1529–1533.
27
[11] K. Spittaels, C. Vanden Haute, J. Van Dorpe, D. Terwel, K. Vandezande, R. Lasrado, K. Bruynseels, M. Irizarry, M. Verhoye, J. Van Lint, J.R. Vandenheede, D. Ashton, M. Mercken, R. Loos, B. Hyman, A. Vander Linden, H. Geerts, F. Van Leuven, Neonatal neuronal overexpression of glycogen synthase kinase-3 beta reduces brain size in transgenic mice, Neuroscience 113 (2002) 797–808.
[12] C. Hooper, R. Killick, S. Lovestone, The GSK3 hypothesis of Alzheimer's disease, J. Neurochem. 104 (2008) 1433–1439.
[13] J.R. Woodgett, Molecular cloning and expression of glycogen synthase kinase-3/factor A, EMBO J. 9 (1990) 2431–2438.
[14] K.P. Hoeflich , J. Luo, E.A. Rubie, M.S. Tsao, O. Jin, J.R. Woodgett, Requirement for glycogen synthase kinase-3beta in cell survival and NF-kappaB activation, Nature 406 (2000) 86-90.
[15] L. Ruel, M. Bourouis, P. Heitzler, V. Pantesco, P. Simpson, Drosophila shaggy kinase and rat glycogen synthase kinase-3 have conserved activities and act downstream of Notch, Nature 362 (1993) 557-60.
[16] H.B. Yao, P.C. Shaw, C.C. Wong, D.C. Wan, Expression of glycogen synthase kinase-3 isoforms in mouse tissues and their transcription in the brain, J. Chem. Neuroanat. 23 (2002) 291-297.
[17] F. Mukai, K. Ishiguro, Y. Sano, S.C. Fujita, Alternative splicing isoform of tau protein kinase I/glycogen synthase kinase 3beta, J. Neurochem. 81 (2002) 1073-1083.
[18] C.J. Phiel, C.A. Wilson, V.M. Lee, P.S. Klein, GSK-3alpha regulates production of Alzheimer's disease amyloid-beta peptides, Nature 423 (2003) 435–439.
[19] T. Engel, F. Hernandez, J. Avila, J.J. Lucas, Full reversal of Alzheimer's disease-like phenotype in a mouse model with conditional overexpression of glycogen synthase kinase-3, J. Neurosci. 26 (2006) 5083–5090.
[20] E. Rockenstein, M. Torrance, A. Adame, M. Mante, P. Bar-on, J.B. Rose, L. Crews, E. Masliah, Neuroprotective effects of regulators of the glycogen synthase kinase-3beta signaling pathway in a transgenic model of Alzheimer's disease are associated with reduced amyloid precursor protein phosphorylation, J. Neurosci. 27 (2007) 1981–1991.
[21] A. Baki, A. Bielik, L. Molnár, G. Szendrei, G.M. Keserü, A high throughput luminescent assay for glycogen synthase kinase-3beta inhibitors, Assay Drug Dev. Technol. 5 (2007) 75-83.
[22] J. Brabek, S.K. Hanks, Assaying protein kinase activity, Methods Mol. Biol. 284 (2004) 79–90.
28
[23] S.M. Rodems, B.D. Hamman, C. Lin, J. Zhao, S. Shah, D. Heidary, L. Makings, J.H. Stack, B.A. Pollok, A FRET-based assay platform for ultra-high density drug screening of protein kinases and phosphatases, Assay Drug Dev. Technol. 1 (2002) 9–19.
[24] M.P. Coghlan, A.A. Culbert, D.A. Cross, S.L. Corcoran, J.W. Yates, N.J. Pearce, O.L. Rausch, G.J. Murphy, P.S. Carter, L. Roxbee Cox, D. Mills, M.J. Brown, D. Haigh, R.W. Ward, D.G. Smith, K.J. Murray, A.D. Reith, J.C. Holder, Selective small molecule inhibitors of glycogen synthase kinase-3 modulate glycogen metabolism and gene transcription, Chem. Biol. 7 (2000) 793-803.
[25] R. Luna-Medina, M. Cortes-Canteli, S. Sanchez-Galiano, J.A. Morales-Garcia, A. Martinez, A. Santos, A. Perez-Castillo, NP031112, a thiadiazolidinone compound, prevents inflammation and neurodegeneration under excitotoxic conditions: potential therapeutic role in brain disorders, J. Neurosci. 27 (2007) 5766-5776.
[26] M. Dixon, E.C. Webb, Enzymes, third ed., Academic press, New York, 1976.
[27] J.M. Domínguez, A. Fuertes, L. Orozco, M. del Monte-Millán, E. Delgado, M. Medina, Evidence for irreversible inhibition of glycogen synthase kinase-3β by tideglusib, J. Biol. Chem. 287 (2012) 893-904.
[28] M. Bartolini, I.W. Wainer, C. Bertucci, V. Andrisano, The rapid and direct determination of ATPase activity by ion exchange chromatography and the application to the activity of heat shock protein-90, J. Pharm. Biomed. Anal. 73 (2013) 77-81.
[29] D.T. Nguyen, D. Guillarme, S. Rudaz, J.L. Veuthey, Fast analysis in liquid chromatography using small particle size and high pressure, J. Sep. Sci. 29 (2006) 1836-48. [30] M. Ushimaru , Y. Fukushima, Complete separation of adenine nucleotides for ATPase activity assay by ion-pair reversed-phase high-performance liquid chromatography, Anal. Biochem. 313 (2003) 173-175.
[31] G. Matthes, S. Strunk, W. Siems, T. Grune, Posttransfusional changes of 2,3-diphosphoglycerate and nucleotides in CPD-SAGM-preserved erythrocytes, Infusionsther. Transfusionsmed. 20 (1993) 89-92.
[32] P. Sikk, T. Käämbre, H. Vija, K. Tepp, T. Tiivel, A. Nutt, V. Saks, Proceedings of the Estonian Academy of Sciences, 58 (2009) 122–131.
[33] S.B. Butt, M. Riaz, E. Ul-Haq, Simultaneous assay of copper iron and uranium in phosphate media by ion-pair liquid chromatography, Chromatographia 42 (1996) 34-38. [34] D.T. Nguyen, D. Guillarme, S. Heinisch, M.P. Barrioulet, J.L. Rocca, S. Rudaz, J.L. Veuthey, High throughput liquid chromatography with sub-2 microm particles at high pressure and high temperature, J. Chromatogr. A 1167 (2007) 76-84.
29
[35] R. Bhat, Y. Xue, S. Berg, S, Hellberg, M. Ormö, Y. Nilsson, A.C. Radesäter, E. Jerning, P.O. Markgren, T. Borgegård, M. Nylöf, A. Giménez-Cassina, F. Hernández, J.J. Lucas, J. Díaz-Nido, J. Avila, Structural insights and biological effects of glycogen synthase kinase 3-specific inhibitor AR-A014418, J. Biol. Chem. 278 (2003) 45937-45.
[36] D.A. Cross, A.A. Culbert, K.A. Chalmers, L. Facci, S.D. Skaper, A.D. Reith, Selective small-molecule inhibitors of glycogen synthase kinase-3 activity protect primary neurones from death, J Neurochem. 77 (2001) 94-102.
30
CHAPTER
2
Hypothesis of direct changing of the histones acetylation
level upon GSK-3β regulation and its implication in
Alzheimer Disease. Targeted LC-MS/MS approach for
quantification of lysine acetylation in histones.
31
1. Introduction
Increased GSK-3β signalling, as found in AD, leads to tau hyperphosphorylation [[1-2], which is a prerequisite of the formation of neurofibrillary tangles (NFT), and also plays a direct role in several features of AD such as enhancing toxic amyloid peptide production. Another class of proteins involved in AD are histones, which are found in the nuclei of almost all eukaryotes and package DNA into nucleosomes. Histone proteins can be decorated with post-translational modifications (PTMs), such as acetyl-, methyl-, and phosphoryl- groups at distinct amino acid residues. These modifications are mainly located in the N-terminal tails of histones that protrude from the core nucleosome structure. The most thoroughly studied PTM is the acetylation of four universally conserved lysine residues K5, K8, K12, and K16 located within the amino-terminal tail of histone H4, which plays a role in the epigenetic regulation in diseases such as cancer and Alzheimer disease (AD). Histone acetylation in particular has been shown to be important both in hippocampal long term potentiation (LTP) and memory formation in mice and both aging and Alzheimer Disease are associated with a loss of histone acetylation (H4) [3] [4] [5]. Histone acetylation is catalysed by histone acetyl transferases (HATs), whereas the reverse reaction is catalysed by histone deacetylases (HDACs). HATs and HDACs are classified into several families that are often conserved from yeast to humans [6]. Actually, it is well established that pharmacological inhibitors of HDACs are protective in various in vivo models of neurodegenerative disease and HDAC3 was identified as a protein with cell selective neurotoxic activity [7] [8]. Moreover, HDAC3 was identified as a downstream target of GSK3-β. Indeed, HDAC-3 was found to be directly phosphorylated by GSK-3β and protection against HDAC-3-induced neurotoxicity was achieved by the inhibition of GSK-3β. Furthermore, neurotoxicity by HDAC-3 was inhibited by activation of the IGF-1/Akt signalling pathway, which in turn inhibits GSK3-β activity and protects against cell death in various models of neurodegenerative disease [8]. Consequently, histones deacetylation is considered a molecular hallmark of neurodegeneration in addition to those of NFT and toxic amyloid peptide.
32
2. Proposal
. Considering these findings, herein we hypothesize that GSK-3β could bedirectly involved in the regulation of histone acetylation through HDAC protein. Our hypothesis accounts that inhibition of GSK-3β, which leads to reduced HDAC activity [8], could restores the acetylation level in histones, protecting against neurodegeneration (see Figure 1 for a rational scheme of this hypothesis). Interestingly GSK-3β could be highly considered a critical node in the progression of AD and targeting its inhibition could lead to the inhibition of NFT and peptide β-amyloid [9] and to the restoring of histone acetylation level necessary for normal neuronal activity.
Figure 1. Line A. GSK-3β is a kinase constitutively active in cell (red rows) and upon Akt signalling pathway or subministration of its specific inhibitors is down regulated (blue rows). HDAC3 is directly phosphorylated by GSK-3β, and its inhibition protects against HDAC-3 induced neurotoxicity. Line B. Histone acetylation has been shown to be crucial in hippocampal long term potentiation (LTP) and memory formation in mice and both aging and AD pathology are associated with a loss of acetylation at the N-terminal tail of H4 (red rows). Herein we hypothesize that GSK-3β could be directly involved in the regulation of histone acetylation through HDAC (Blue rows in line B and dashed row in between line A and B).
33
Our proposal is to exploit the well-known GSK-3β inhibitor SB-415286, in order to trigger down-regulation of GSK-3β kinase activity and to monitor changes in histone H4 acetylation from murine primary neurons. SB-415286 enhances neuronal cell survival by protecting both central and peripheral nervous system neurons in culture from death and this action was found to be correlated with inhibition of GSK-3β activity [10]. Further treatment of murine cerebellar granular neurons (CGNs) with SB-415286 blocked toxicity induced by HDAC3 (histone deacetylase 3), an enzyme that deacetylates lysine residues on histones [8].
Unlike with cell lines that provide an unlimited supply of homogeneous cells, the preparation and culture of primary cells is much more challenging and this is especially true for neuronal cells. Neuronal primary cell cultures are deathly and hence the number of cells available for experiments is much more limited [11]. Therefore, we developed (described in Chapter 3) a targeted liquid chromatography mass spectrometry (LC-MS) method for the site-specific quantification of lysine acetylation in the N-terminal region of histone H4 from macrophage-like cell line RAW 264.7 by administrating well- known HDAC inhibitors with the perspective to apply the method on murine primary neurons and by administrating GSK-3β inhibitors as SB-415286.
Accomplishing the project, herein presented, may lead to innovative therapies for targeting the pathology of AD, as well as an increased understanding of how epigenetic mechanisms, such as histone acetylation, could be related to the GSK-3β signalling pathway through HDAC proteins.
34
References
1. Medina M, Avila J (2014) New insights into the role of glycogen synthase kinase-3 in Alzheimer's disease. Expert Opinion on Therapeutic Targets 18 (1):69-77
2. Sperber BR, Leight S, Goedert M, Lee VMY (1995) Glycogen-Synthase Kinase-3-Beta Phosphorylates Tau-Protein at Multiple Sites in Intact-Cells. Neurosci Lett 197 (2):149-153 3. Francis YI, Fa M, Ashraf H, Zhang H, Staniszewski A, Latchman DS, Arancio O (2009) Dysregulation of Histone Acetylation in the APP/PS1 Mouse Model of Alzheimer's Disease. Journal of Alzheimers Disease 18 (1):131-139
4. Zhang K, Schrag M, Crofton A, Trivedi R, Vinters H, Kirsch W (2012) Targeted proteomics for quantification of histone acetylation in Alzheimer's disease. Proteomics 12 (8):1261-1268 5. Govindarajan N, Agis-Balboa RC, Walter J, Sananbenesi F, Fischer A (2011) Sodium Butyrate Improves Memory Function in an Alzheimer's Disease Mouse Model When Administered at an Advanced Stage of Disease Progression. Journal of Alzheimers Disease 26 (1):187-197
6. Marmorstein R, Roth SY (2001) Histone acetyltransferases: function, structure, and catalysis. Current Opinion in Genetics & Development 11 (2):155-161
7. Kilgore M, Miller CA, Fass DM, Hennig KM, Haggarty SJ, Sweatt JD, Rumbaugh G (2010) Inhibitors of Class 1 Histone Deacetylases Reverse Contextual Memory Deficits in a Mouse Model of Alzheimer's Disease. Neuropsychopharmacology 35 (4):870-880
8. Bardai FH, D'Mello SR (2011) Selective Toxicity by HDAC3 in Neurons: Regulation by Akt and GSK3 beta. Journal of Neuroscience 31 (5):1746-1751
9. Cai Z, Zhao Y, Zhao B (2012) Roles of Glycogen Synthase Kinase 3 in Alzheimer's Disease. Current Alzheimer Research 9 (7):864-879
10. Cross DAE, Culbert AA, Chalmers KA, Facci L, Skaper SD, Reith AD (2001) Selective small-molecule inhibitors of glycogen synthase kinase-3 activity protect primary neurones from death. Journal of Neurochemistry 77 (1):94-102
11. Gordon J, Amini S, White MK (2013) General overview of neuronal cell culture. Methods in molecular biology (Clifton, NJ) 1078:1-8
35
CHAPTER
3
Site-specific quantification of lysine acetylation in the
N-terminal tail of histone H4 using a double labeling, targeted
UHPLC MS/MS approach.
Anal Bioanal Chem
DOI 10.1007/s00216-016-9431-1
Annalisa D’Urzo1,2, Alexander P. Boichenko1, Thea van den Bosch3, Jos Hermans1, Frank
Dekker3, Vincenza Andrisano2 and Rainer Bischoff1*
1Department of Analytical Biochemistry, University of Groningen, Antonius Deusinglaan 1,
9713 AV Groningen, The Netherlands
2Department for Life Quality Studies, Alma Mater Studiorum-University of Bologna, Corso di
Augusto, 237- 47921 Rimini, Italy
3Department of Pharmaceutical Gene Modulation, University of Groningen, Antonius
36
3.1 Abstract
We developed a targeted liquid chromatography - tandem mass spectrometry (LC-MS/MS) method for the site-specific quantification of lysine acetylation in the N-terminal region of histone H4 by combining chemical derivatization at the protein and at the peptide level with digestion using chymotrypsin and trypsin. Unmodified ε-amino groups were first modified with propionic acid anhydride and the derivatized protein digested with trypsin and chymotrypsin. The newly formed peptide N-termini were subjected to a second derivatization step with d6- (heavy) or d0- (light) acetic acid anhydride. Samples were mixed at different ratios
and peptides monitored by multiple reaction monitoring (MRM) LC-MS/MS. The method was validated in terms of linearity (R2 ≥ 0.94), precision (RSD ≤ 10%) and accuracy (≤ 27%) and
used to assess the effect of the histone deacetylase (HDAC) inhibitors SAHA and MS-275 in the murine macrophage-like cell line RAW 264.7. SAHA and MS-275 showed site-specific effects on the acetylation levels of K5 and K8 with the K5(Ac)-K8 and K5-K8(Ac) peptides increasing 2.5-fold and 5-fold upon treatment with SAHA and MS-275, respectively. Assessing lysine acetylation in a site-specific manner is important for gaining a better understanding of the effects of HDAC inhibitors and for clarifying disease mechanisms where lysine acetylation plays a role.
37
3.2 Introduction
In eukaryotes, the basic repeating unit of chromatin is composed of 147 bp of DNA wrapped around an octamer of two molecular groups of four histone core proteins: H2A, H2B, H3 and H4. The core histones (~11-17 kDa) are basic proteins with a globular domain and a flexible N-terminal extension protruding from DNA, referred to as the N-terminal tails. The N-terminal regions of histones are affected by different enzyme–mediated post-translational modifications (PTMs) that change the accessibility of DNA to transcription factors and subsequent protein-protein interactions. In particular, acetylation of K5, K8, K12, and K16 in the N-terminal tail of histone H4, have been described to play an important role in the epigenetic regulation of cellular events with relevance for diseases like cancer and Alzheimer’s Disease (AD). For example, histone acetylation has been shown to be crucial in hippocampal long term potentiation (LTP) and memory formation in mice and both aging and AD pathology are associated with a loss of acetylation at the N-terminal tail of histone H4[1,2]. Therefore, quantification of histone acetylation on individual lysine residues is of crucial importance to understanding their role in cell biology and disease mechanisms. Next to this, quantifying histone acetylation will assist in understanding the effects of drugs such as HDAC inhibitors, many of which are currently in clinical development.
One of the challenges in quantifying the level of acetylation at individual lysine residues in the N-terminal tail of histone H4 is the occurrence of multiple lysines within a short stretch of amino acids. While immunological approaches are useful to investigate histone modification patterns, it is technically challenging to generate antibodies that can distinguish between closely related epitopes[3]. Mass spectrometry (MS) has emerged as a powerful method to characterize histone PTMs complementary to antibody-based approaches [4].
Currently there are two complementary approaches in proteomics; the top-down and the bottom-up approach. In bottom-up, proteins of interest are first digested with a proteolytic enzyme and the resulting peptides analyzed by HPLC-MS/MS whereas in top-down the entire protein or a large fragment thereof is analyzed by HPLC-MS/MS [5]. While the top-down approach opens the possibility to gain an overview of different forms of a protein due to post-translational modifications (PTMs), it has certain limitations and presents significant challenges. Fragmentation efficiency of high-molecular weight ions is poor even though fragmentations induced by electron capture dissociation (ECD) or electron transfer dissociation
38
(ETD) are more efficient than the most widely used collision-induced dissociation (CID). Further challenges are the fact that large precursor ions are distributed across many charge states, reducing overall sensitivity of the top-down approach. Combined with the current lack of highly efficient chromatographic separations for proteins when compared to UHPLC of peptides and the need for high-resolution, expensive mass spectrometers, renders the top-down proteomics approach less suitable for the quantitative bioanalysis of protein modifications in complex mixtures. Nevertheless, it is to be expected that top-down protein analysis will gain ground with the advent of affordable high-resolution mass spectrometers, more efficient protein separation techniques and a better understanding of the charging mechanism in electrospray ionization. With the advent of Multiple Reaction Monitoring (MRM) for protein analysis with the bottom-up approach, it is possible to address each modification site individually on suitable signature peptides.
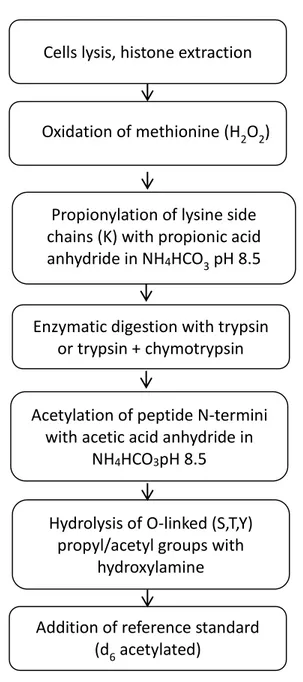
Here we describe a targeted LC-MS/MS method for the site-specific quantification of lysine acetylation in the N-terminal region of histone H4 using a total histone preparation from the murine macrophage-like cell line RAW 264.7. We labelled at protein level the ε-amino groups of lysine residues with propionic acid anhydride causing a mass shift of +56 Da and protecting them from further proteolytic digestion. Although there are many examples in the literature describing methods for the site-specific quantification of lysine acetylation following the scheme of labelling with propionic acid anhydride and proteolytic digestion [6-8], unequivocal and direct site-specific quantification is difficult when multiple lysines occur in close proximity to each other in a short amino acid sequence. In order to solve this issue, we combined the labelling with propionic acid anhydride at protein level with double digestion using chymotrypsin and trypsin followed by derivatization of the neo-N-termini of suitable signature peptides with with d6- (heavy) or d0- (light) acetic acid anhydride. LC-MS/MS in the multiple reaction monitoring (MRM) mode was applied to monitor changes in the acetylation level of individual lysine residues upon administration of the histone deacetylase (HDAC) inhibitors SAHA and MS-275 to RAW 264.7 cells.
39
3.3 Experimental Section
3.3.1 Chemicals.
Formic acid, hydrogen peroxide, chymotrypsin, trifluoroacetic acid (TFA), d6 and d0 acetic acid anhydride, propionic acid anhydride, ammonium hydrogencarbonate, 1.0 M triethylamine and 16.3 M hydroxylamine were purchased from Sigma Aldrich (St. Louis, MO, USA). Trypsin was purchased from Promega (Fitchburg, Wisconsin, United States). HPLC supra gradient acetonitrile was obtained from Biosolve (Dieuze, France). Triethylammonium hydrogencarbonate buffer, 1 M at pH 8.5, was prepared by titration of a 1M triethylamine solution with CO2. Water was purified by a MilliQ Advantage A10 Water System (Millipore, Billerica, Massachusetts, USA).3.3.2. Cell culture and histone isolation
. The murine macrophage-like cell line RAW 264.7 (American Type Culture Collection, Manassas, Virginia, USA) was cultured in Dulbecco’s Modified Eagle Medium (DMEM) containing 10 % heat-inactivated fetal bovine serum (FBS), 50 IU/mL penicillin, and 50 IU /mL streptomycin at 37 oC in a humidified atmosphere containing 5% CO2. Cell culture reagents were purchased from Life Technologies (Carlsbad, CA , USA). For the experiments, cells were used until passage 15. One day after seeding, cells were treated with the HDAC inhibitors MS-275 (Axon Medchem, Groningen, The Netherlands) or suberoylanilide hydroxamic acid (SAHA, Selleckchem, Munich, Germany) (see Figure S1, Supporting Information, for structures). Inhibitor stock solutions were prepared at 10 mM for MS-275 and 4.1 mM for SAHA, respectively, in dimethylformamide (DMF), and subsequently diluted in DMEM culture medium. Cells were incubated with 1 µM of MS-275 or 0.41 µM of SAHA for 20 hrs, conditions that were non-toxic as determined by MTS assays (Figures S-2 and S-3, Supporting Information). As a control, cells were treated with 0.01% DMF, corresponding to the same percentage used for treatment with inhibitors. Subsequently, cells were harvested, washed with PBS and pelleted by centrifugation at 1000 rpm for 5 min. Histones were extracted as previously described[9]. Briefly, cell pellets were suspended in 0.5 mL ice cold buffer containing 13 mM EDTA in 10 mM Tris-Base, pH 7.4. After centrifugation, sulphuric acid 0.4 M was added to the pellet with incubation of 1 hr. Acetone was added to the supernatant to a final concentration of 86% and40
left at -20 oC overnight to precipitate proteins. After centrifugation, acetone was removed and the pellet, dried at room temperature, was redissolved in phosphate buffer saline (PBS, PAA Laboratories GmbH, Pasching, Austria). Total protein concentration was determined using the microBCA assay according to the manufacturer's instructions (Pierce, Rockford, USA). Absorbance was measured with a Fluostar Optima plate reader (BMG, Labtech) at 580 nm. A bovine serum albumin standard (2 mg/mL, Pierce, Rockford, USA, # 23209) was used to calibrate the assay.