“SAPIENZA” UNIVERSITY OF ROME Department of Experimental Medicine
Ph.D. program
“HUMAN BIOLOGY AND MEDICAL GENETICS” XXXII cycle
DNA METHYLATION CHANGES IN THE
BRAIN WHITE MATTER OF MULTIPLE
SCLEROSIS PATIENTS
Candidate:
Stefano Tagliatesta
Scientific tutor:
Dr. Michele Zampieri “Sapienza” University of Rome
Director of Doctoral Program:
Prof. Antonio Pizzuti “Sapienza” University of Rome
Board of examiners:
Prof.ssa Silvia Galardi “Tor Vergata” University of Rome Prof.ssa Alice Conigliaro University of Palermo Prof.ssa Maria Piane “Sapienza” University of Rome Prof. Marco Barchi “Tor Vergata” University of Rome Prof.ssa Ornella Parolini “UCSC” University of Rome
INDEX ABSTRACT 1 INTRODUCTION 2 1. Multiple Sclerosis 2 1.1.Epidemiology 4 1.2.Classification 4
1.3.Pathophysiology and pathogenesis 8
1.4.MS risk factors 12
2. The epigenetic component of multiple sclerosis 16
2.1.DNA methylation 18
2.2.DNA methylation in multiple sclerosis patients 23
AIM OF THE WORK 29
MATERIAL AND METHODS 31
1. Origin of brain tissue samples 31
2. DNA purification 32
3. Dot blot technique 33
4. Extraction of total RNA 35
5. Gene expression quantification (RT-qPCR) 35
5.1.Reverse transcription (RT) 35
5.2.Gene expression evaluation (qPCR) 36
6. DNA immunoprecipitation (DIP) 39
7. RT-qPCRs for the expression evaluation of the
candidate genes 42
RESULTS 46
1. Subjects and tissue 46
2. NAWMs’ cell composition and inflammation 47
3. Decrease of 5-hydroxymethylcytosine in NAWM
samples 51
4. TET2 and IDAX genes are transcriptionally
deregulated in MS NAWMs 52
5. Relationship between 5hmC, TET2 and IDAX with NAWMs’ cell composition and inflammation 55
6. Association of 5hmC, TET2 and IDAX levels with the pathological activity and duration 57
7. Association between 5hmC contents and
TET2-IDAX enzyme expression 57
8. Locus-specific analysis of 5mC oxidation derivatives
60
DISCUSSION 69
1
ABSTRACT
The literature implies that Multiple Sclerosis (MS) holds an epigenetic component that mediates the effects of its typical environmental risk factors on disease progression. Some of the major epigenetic modifications on DNA are the addition of methyl or a hydroxymethyl group to the C5 cytosine position,
leading to 5-methylcytosine (5mC) and
5-hydroxymethylcytosine (5hmC) synthesis. Interestingly, abnormal epigenetic modification patterns, such as the global DNA methylation loss in MS brain white matter, link to several
neurodegenerative disorders. Abnormal DNA
methylation/hydroxymethylation enzymes expression is also extensively documented in Alzheimer’s disease and cancer. This doctoral research project traces the DNA methylation instability in MS white matter, back to the altered expression of the DNA methylation/hydroxymethylation enzymes.
2
INTRODUCTION
1. Multiple Sclerosis
Multiple sclerosis (MS) is a chronic and progressive disorder of the central nervous system (CNS) characterised mainly by autoimmune inflammation, myelin loss and neurodegeneration after demyelination.
In MS, myelinated nerves suffer from damages in discrete and scattered areas in the CNS, hence the name "multiple".
These lesions originate from the autoimmunity dysregulation where CNS myelin is recognised as foreign by the immune system, and it is subsequently destroyed by it.
The dispersed damaged regions where the myelin is attacked in the CNS and later lost around the axons evolve into "plaques". Along with pathology progression and with the chronic inflammation establishment, these areas may assume features similar to scars, hence the term "sclerosis". These events lead
3
to a permanent neurological deficit, mainly due to a compromised axonal functionality.
Mild symptoms, such as muscle weakness or slight movement disorders, defines MS early stages. The later phases are characterised by progressive neurological deficits, such as paralysis and cognitive impairment, possibly leading to fatal complications such as sepsis or aspiration pneumonia (Dendrou, Fugger et al. 2015).
While most MS patients are not affected by a significant degree of disability, 60% of them might lose the capacity to walk 20 years after the onset of the disease, with significant implications for their quality of life and the socio-economic impact linked to their assistance. This latter aspect of the pathology is of particular relevance as MS is one of the most common neurodegenerative and debilitating diseases among young adults. It affects millions of individuals in the world and with a specific incidence among European and North American young adults (Browne, Chandraratna et al. 2014).
Nevertheless, since the etiologic basis and the pathogenesis of MS is mainly elusive, there is no significant progress in finding out a final cure (Tizaoui 2018).
4
1.1 Epidemiology
MS affects around 2.5 to 3 million people in the world (Hunter 2016), displaying a non-uniform geographical distribution as it is more widespread in regions that are distant from the equator (Khan, Amatya et al. 2014)
There is also a global latitude gradient in MS prevalence, as a higher MS incidence defines some geographical areas. Moreover, some ethnic groups result in being more affected than others, such as the Caucasian race with northern European ancestry. Within the same racial group, MS appears to be twice more common in females than in males, with an onset peak of around 30 years of age (Zheleznyakova, Piket et al. 2017).
1.2 Classification
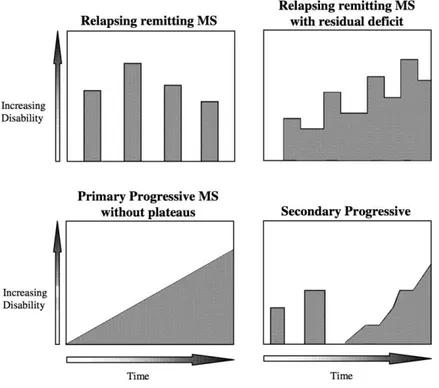
MS classification is primarily based on pathology progression, as it commonly manifests itself following recurring and typical patterns.
At the onset of clinical signs, approximately 85 % of people with MS are diagnosed as relapsing/remitting, RRMS (relapsing/remitting multiple sclerosis). Characteristics of this MS type are the initial episodes of acute neurological dysfunction, followed by subsequent periods of partial or complete remission (Hottenrott, Dersch et al. 2017).
5
The relapses can last days or months and, in some cases, also years. During the remission period, also, even if the pathology appears clinically inactive, the injuries that occur in the CNS are detected by an instrumental examination such as the MRI scan (Magnetic Resonance Imaging). Sometimes remissions are less isolated over time, and the symptoms seem to become more severe with clinically detectable signs (Dendrou, Fugger et al. 2015) (Figure 1).
The residual portion of MS patients at the clinical onset, approximately 10-15%, are diagnosed as primary progressive, PPMS (Primary Progressive Multiple Sclerosis). A continuous and gradual progression of disability characterises this disease type, commencing from the initial manifestation of signs without any remission. If compared with RRMS, PPMS presents a later disease onset, between 30 and 50 years of age, without any gender discrepancy regarding its prevalence and frequency. Inflammatory alterations relate to an autoimmune activity against the CNS as revealed by cerebrospinal fluid (CSF) examination. Such immune variations are, for example, the oligoclonal bands (OCB), which are shared by both RRMS and PPMS forms (Hottenrott, Dersch et al. 2017)
Despite beginning with a period of relapses and remissions, about 50% of RRMS patients progressively lose this original pattern, thus developing into another MS form called
6
secondary progressive, SPMS (Secondary Progressive Multiple Sclerosis). The disease evolution from RRMS to SPMS occurs within 10-20 years from the initial onset, and, similarly to the PPMS type, SPMS patients showcase a progressive increase of neurological dysfunction.
In several cases, a preliminary clinical sign of MS remains as an isolated episode that is interpreted clinically as a separate condition, the Clinically Isolated Syndrome (CIS).
Individuals with CIS do not generally turn into MS patients, but they have a higher risk of developing MS. The CIS patient who endures more than one sign or symptom simultaneously, the multifocal case, is more likely to develop MS (Dendrou, Fugger et al. 2015).
Less frequent are the variants of MS, which generally present themselves as more aggressive than the most prevalent forms. For example, the Marburg disease, also known as acute, fulminant, or malignant MS, is defined by a severe and continuous degeneration of axonal myelin, often ending in death within one year after the first clinical manifestation (Capello and Mancardi 2004).
7
Figure 1. Spectrum of disease course. Spectrum of disease
course: The RRMS (Relapsing Remitting MS) form can have two different courses: one in which remission phases alternate with disease manifestations; one in which the disease does not feature clear remissions. In the PPMS (Primary Progressive MS) form, the pathology is characterised by a continuous functional decline, starting from the onset of symptoms and does not present recurrences. Initial phases of remission characterise the SPMS (Secondary Progressive MS) form, later followed by a gradual neurological deterioration (Lublin and Reingold 1996).
8
1.3 Pathophysiology and pathogenesis
Demyelination areas localise in both the white and grey matter of the brain and spinal cord. The oligodendrocytes, the cells that exert a trophic effect on the axons and maintain the structural integrity of the myelin, are attacked by the immune system in MS. As a direct consequence of the damage, the compromised myelin sheath does not properly propagate the axonal action potential (Patel and Balabanov 2012). At the initial phases of the disease, both axons and neurons are still capable of preserving their functionality as well as their correct structure. With the disease progression, there is a gradual neuro-axonal integrity decline strongly related to the patient's degree of disability (Correale, Marrodan et al. 2019).
Interestingly, myelin degeneration may partially revert by
spontaneous phenomena of re-myelination. Hence,
oligodendrocyte precursor cells (OPCs) gather to the lesions
where they start differentiating into functional
oligodendrocytes. With myelin recovery, the conduction of nerve impulses re-establishes (Kirby, Jin et al. 2019). However, re-myelination mechanisms are efficient only during the early stages of the disease (Powers, Sellers et al. 2013). As well as the white matter, processes of demyelination localise in the grey substance but with a minor inflammatory component (Lucchinetti, Popescu et al. 2011; Nantes, Zhong et al. 2016).
9
The immune system, however, despite attacking the oligodendrocytes, recognise as non-self CNS-specific antigens that are components of the myelin. Indeed, it is possible to detect antibodies produced against these constituents in the lesions, the cerebrospinal fluid (CSF), but also the blood serum.
One of the first antibody raised against the myelin constituents is the one that recognises the MBP protein (Myelin Basic Protein), a fundamental component of the myelin sheath involved myelination (Stinissen and Hellings 2008; Zhou, Simpson et al. 2017).
Other autoantibodies recognise and attack specific-myelin proteins such as the Myelin Oligodendrocyte Glycoprotein (MOG), PLP (Myelin Proteolipid Protein) and AQP4 (Aquaporin-4) (McLaughlin and Wucherpfennig 2008; Lassmann and van Horssen 2011).
Also, MS autoimmunity directs against non-myelin targets. Other autoantibodies indeed attack the components of neurons such as neurofilaments, neurofascin, RNA-binding proteins, and potassium channels (Levin, Lee et al. 2013)
However, the processes that originate this autoimmunity in MS are not transparent yet. One possible hypothesis behind the aetiology of the autoimmunity is that an early CNS injury, not necessarily related to MS, abnormally exposes to the cell
10
surface some antigens that the immune system later identifies as non-self.
Another idea behind autoimmunity is related to a specific immune response referred to as "molecular mimicry". Contextually, the MBP itself retains on its structure a six amino acids peptide that is also present in the proteins of HBV virus (hepatitis B virus). Thus, once the immune system contains HBV infection, some unregulated responses might generate autoimmunity against myelin following antibody cross-reactivity (Fujinami and Oldstone 1985). Experiments demonstrated that rabbits injected with this HBV peptide exhibit pathological neural changes shared by the MS mouse model, the Experimental Allergic Encephalomyelitis (EAE) mouse. Besides, the mechanism of "molecular mimicry" could also explain the association between infection by microorganisms and the MS risk (Libbey, McCoy et al. 2007). Regarding MS immune cells, T-lymphocytes seem to induce the early autoimmune inflammation that recognises "self" antigens as "non-self". As a result of this trigger, immune cells break through the blood-brain barrier (BEE) and invade the CNS. Along with these events in the brain, the peripheral circulation of RRMS patients present reactive T-cells against myelin. These circulating reactive T-cells against myelin might invade the brain as a result of functional alterations of the BEE
11
endothelial cells (Varatharaj and Galea 2017). It is observed that endothelial cells present leukocyte-adhesion molecules that allow these immune cells to pass through the BEE (Minagar, Maghzi et al. 2012). Inflammatory infiltrates of the CNS present other cell types of the peripheral immune system, such as B-lymphocytes, plasma cells, and macrophages
As well as T-cells, these cells attack myelin components and trigger autoimmunity along with the resident brain immune cells, such as microglia and dendritic cells. All these events trigger the mechanisms of demyelination or neurodegeneration, including oedema, phagocytosis processes, complement activation, cytokine production, as well as cytotoxic protein synthesis (Hausser-Kinzel and Weber 2019).
Interestingly, the inflammatory process of MS is dynamic as the cellular populations that invade the brain vary according to the phases of the pathology. The initial stages of the disease present a low degree of lymphocytic infiltration at the brain lesions, while microglia are activated. With disease progression infiltrations of T, B cells and macrophages increase as well as the activation of microglia. The direct consequence of such events is the progressive myelin atrophy, associated with axonal damage and neurological dysfunction.
12
Advanced stages of the disease are interested by inflammation contraction; however, microglia and macrophages still preserve their state of chronic activation (Dendrou, Fugger et al. 2015). The cytotoxic effect of the inflammatory process is primarily associated with oxidative stress: macrophages and activated microglia produce reactive oxygen species (ROS) that further lead to demyelination and axonal damage. The advanced stage of the disease, where the inflammation process is moderate, the oxidative damage is caused by the release of iron from intracellular deposits with subsequent generation of ROS (Hametner, Wimmer et al. 2013)
However, despite the considerable amount of information related to MS immunity, the disease aetiology is still uncertain. However, tissue damage is considered to be secondary concerning the inflammation.
1.4 MS risk factors
MS risk associates with both genetic factors as well as environmental agents. Concerning the genetic component, studies conducted on familial aggregation and twin pairs show that MS risk grows among relatives, as about 1.9-4.7% of patients have a family history of MS. In these cases, MS risk for a first-degree relative is 30 times greater than the general
13
population (O'Gorman, Lin et al. 2013), thus strengthening the idea of a relevant genetic component in MS.
Indeed, several genes are associated with MS susceptibility, such as some polymorphisms of the Major Histocompatibility Complex (MHC) (or human leukocyte antigen (HLA)) loci. One of these variants is the haplotype HLA-DR15, which associates with a three times higher MS risk (Schmidt, Williamson et al. 2007). The population of Sardinia that is known to have an increased risk of MS (Pugliatti, Sotgiu et al. 2001), curiously, manifests an association between MS and the HLA-DR4 haplotype but not with HLA-DR15 (Marrosu, Murru et al. 1997; Marrosu, Murru et al. 1998). GWAS (genome-wide association study) and meta-analysis allowed the identification of 350 MS-associated loci even outside the MHC (Wang, Pappas et al. 2011). Furthermore, whole-genome association studies have validated that 50 genes (Beecham, Patsopoulos et al. 2013) are strongly linked to MS susceptibility as well as to the severity of the pathology (Mowry, Carey et al. 2013). However, although MS presents a clear genetic component, discrepancies in MS development have also been highlighted among members of the same family, thus implying the influence of other non-genetic factors. MS studies conducted on homozygous twins have highlighted susceptibility divergences as only one-third of the twin pairs are concordant
14
for MS development (Baranzini, Mudge et al. 2010). All these pieces of evidence demonstrate the critical influence of the environmental component on MS risk. To reinforce this statement it is essential to mention two consistent notions acquired on MS: on the one hand, migrants moving from a region of high MS risk to another associated with a lower risk showed a lower-than-expected disease rate; on the other hand, people moving from an area of lower risk to one of higher risk tended to maintain the lower MS risk of their country of origin. Migration studies also pointed to the importance of the first two decades of life on determining disease's risk on migrants: children of the migrants that moved to a high-risk area tended to acquire the MS risk rate featured in the host country. (Gale and Martyn 1995). Indeed, several environmental factors play a role in MS susceptibility, such as exposure to the Epstein-Barr virus (EBV), smoking, and vitamin D deficiency (presumed to be caused by low exposure to sunlight in areas distant from the equator or by an insufficient vitamin D intake). It is important to remark that vitamin D is considered beneficial in MS. Both low vitamin D intake or serum vitamin D levels are associated with MS risk as well as with an increased relapse risk and worsening of the disease (Munger, Levin et al. 2006; Mouhieddine, Darwish et al. 2019).
15
Vitamin D association with the pathology could demonstrate the prevalence of MS in high-latitude countries, featuring lower solar irradiation (Koch, Metz et al. 2013; Riccio and Rossano 2017). Concerning EBV infection, a higher IgG antibody raised against its nuclear antigens (Epstein-Barr NA; EBNA) is specifically associated with MS risk (Sundqvist, Sundstrom et al. 2012). Nevertheless, no association was identified concerning other EBV antigens or other viral infections (Ascherio and Munger 2007).
Smoking was associated with increased susceptibility to the development of MS as well as an increased frequency of relapses and the number of lesions (Pittas, Ponsonby et al. 2009). More recently, a significant relationship is emerging between the MS and the microbiota composition of the gut. Indeed, evidence indicates that alterations in gut microbiota composition may result in disease (Kirby and Ochoa-Reparaz 2018).
Several studies have also demonstrated that the family microenvironment does not affect MS risk, thus inferring the importance of the environmental factors that operate at a population level (O'Gorman, Lin et al. 2013).
16
2. The epigenetic component of multiple sclerosis
MS is a common and complex disease in which the balance between susceptibility genes and the environmental factors determines the disease pathogenesis (Peedicayil 2016). However, several studies suggest the underlying contribution of the epigenetic component as well on MS risk. The fact that these mechanisms may be relevant in MS is due to several pathology's characteristics, such as the influence of geographic location, diet (e.g., vitamin D intake), and smoking.
Furthermore, the parent-of-origin effect (Ebers, Sadovnick et al. 2004), and the recorded increment in female-to-male diagnostic ratio suggest further the involvement of epigenetics in MS. These characteristics highlight the importance of the X-chromosome on MS risk and, since this genomic portion does not feature susceptibility genes, mechanisms such as X-chromosome inactivation or imprinting probably link it to the disease (Wallin, Page et al. 2004; Hirst, Ingram et al. 2009). Epigenetic mechanisms may help explain MS "missing heritability" (the inability of single genetic variations to explain phenotypes' heritability), the low concordance rate in identical twins, the variable clinical course, and the different gender prevalence. Many epigenetic alterations in MS have been identified yet, involving different tissues and organs, and they
17
lead to expression alterations of genes potentially relevant for MS (Lill 2014).
Several studies have already identified several epigenetic changes in histones, DNA methylation and microRNAs (miRNAs) involved in the MS pathogenesis (Huynh, Garg et al. 2014; Wu, He et al. 2017; He, Hu et al. 2018).
For example, MS brain sections not featuring plaque formation, the Normal Appearing White Matter (NAWM) samples, show increased citrullination of histone H3 (Mastronardi, Wood et al. 2006). Histone acetylation is found altered as well in the frontal lobes of MS patients (Pedre, Mastronardi et al. 2011). Epigenetic changes extend to DNA methylation too, hence affecting the expression of genes putatively involved in MS pathogenesis in NAWM samples (Huynh, Garg et al. 2014 ). Epigenetic variations interest the immune blood cells as well where the expression of both histone deacetylases (HDACs) and miRNAs is found altered in relationship to MS pathogenesis (Ma, Zhou et al. 2014; Ciriello, Tatomir et al. 2018). Interestingly, even DNA methylation at the HLA-DRB1 locus is associated with MS susceptibility (Kular, Liu et al. 2018). However, among all the listed epigenetic variations implicated in MS pathogenesis, DNA methylation profiling offers a different chance to understand the genome activity of unexplained pathological conditions such as MS since both
18
stability and cell type-specificity characterise this epigenetic mark.
2.1 DNA methylation
DNA methylation, and in general epigenetic mechanisms, functions as a genetic annotation system that provides instructions for transcription regulation. This whole instruction pattern determines a stable gene expression profile of differentiated cells, and it establishes during development. However, methylation modifications also occur as a result of external environmental inputs, thus contributing to ageing as well as to a number of pathological conditions and disease predispositions.
From a chemical standpoint, DNA methylation is the covalent adding of a methyl group on the 5th carbon of cytosine residues, mainly placed in the cytosine-guanidine dinucleotides (CpG dinucleotides), thus forming the 5-methylcytosine (5mC) nucleotide.
DNA methylation pattern establishes after the earliest phases of embryogenesis when almost all methyl groups are eliminated from the genomic cytosines in two events of global demethylation and re-methylation. The demethylated genome undergoes a first global re-methylation after fertilization, in a process called "de-novo methylation" for somatic tissue
19
differentiation, mainly by the activity of DNMT3A-B enzymes (DNA methyltransferase 3A and 3B). DNMT3A-B de-novo activity extends to the primordial germ cells (PGCs) development for establishing their sex-specific methylation pattern before birth (Greenberg and Bourc'his 2019).
The bulk of DNA methylation ensures genomic stability at non-coding regions, primarily repeat elements such as transposons and microsatellite DNA. Only a limited portion of DNA methylation is intended for gene expression in discrete positions such as promoters, enhancers or silencers, where it mainly works as a repressive signal.
Genomic DNA methylation is propagated during cell divisions by a maintenance mechanism involving the activity of DNMT1, an enzyme that preserves symmetrical DNA methylation throughout DNA replication (Klose and Bird 2006; Suzuki and Bird 2008).
Nowadays, 5mC is considered the fifth base of DNA which primary role is to maintain genome integrity and stability since it prevents transpositions, translocations and chromosomal aneuploidy. For instance, aberrant methylation of subtelomeres, which present high-density DNA repeats, may lead to certain hallmarks of genomic instability that are related to cell senescence. Proper DNA methylation of centromeric regions is necessary for their correct function and structure,
20
Figura 2. DNA methylation/demethylation. 5-methylcytosine
(5mC) formation and its subsequent oxidation in the active demethylation pathway.
thus avoiding centromere perturbation that could lead to aneuploid cells (Deaton and Bird 2011; Defossez and Stancheva 2011).
Diverse mechanisms remove 5mC from the genome, sometimes influenced by tissue specificity. This process takes place in the absence of methylation on the newly synthesised DNA strands (passive demethylation), or by the activity of
21
specific enzymes (active demethylation). The passive process is probably due to the uncoupling of DNA replication and the maintenance methylation processes of DNMT1 that dilutes 5mC during cell divisions (Valinluck and Sowers 2007; Jin and Robertson 2013). The active demethylation mechanism, though, implies a series of enzymatic activities that remove methylation thanks to the sequential oxidations of 5mC. Indeed, 5mC oxidation proceeds throughout sequential steps: at
first, oxidation converts 5mC into 5hmC
(5-hydroxymethylcytosine), secondly into 5fC (5-formylcytosine) and lastly into 5caC (5-carboxylcytosine). After that, the machinery of base excision DNA repair (BER) delivers effective methylation removal as it recognises and targets 5fC and 5caC. Ten-Eleven Translocation (TET) family of enzymes, which accounts for the actual 5mC oxidations, comprises three members, TET1, TET2, and TET3 (Wu and Zhang 2017). Despite having similar chemical activities, the three proteins present structural differences. In fact, TET1 and 3 contain a DNA binding domain at their N-terminal, a ZF-CxxC (zinc finger-CxxC) domain, not featured by TET2. Indeed, the TET2 DNA binding domain exists as a separate gene, called IDAX, and it is important for TET2 activity regulation (Dunican, Pennings et al. 2013). TETs physiological role involves
22
development, stem cell differentiation, and cell transformation (Dawlaty, Breiling et al. 2014). Regarding 5hmC, this nucleotide is mainly present in embryonic stem cells and the CNS, thus suggesting that 5mC oxidation products do not function only as demethylation intermediates. Indeed, recent 5hmC mappings describe a highly site-specific distribution in promoters, gene bodies, and intergenic areas near genes which positively correlates with active transcription at these loci, leading to the possibility that 5hmC is the sixth base of DNA with its own functions (Pastor, Pape et al. 2011; Xu, Wu et al. 2011; Song, Yin et al. 2017). 5hmC is indeed involved in regulating genes with synaptic function in mouse and human brain (Khare, Pai et al. 2012). Differently from 5mC, 5hmC seems to have a different role in transcription regulation because it prevents the recruitment of transcription repressors, which often contain methyl-binding domain (MBD-domain), as well as the DNMTs (Branco, Ficz et al. 2011). As the knowledge on 5hmC roles are at an embryonal state, a large number of data are still emerging. Recent pieces of evidence explain that both 5fC and 5caC may influence the substrate specificities and transcriptional fidelity of RNA polymerase II. However, further structural study is required to explain the molecular impacts of 5fC or 5caC modifications on gene expression (Kellinger, Song et al. 2012).
23
2.2 DNA methylation in multiple sclerosis patients Early indication that associated 5mC to multiple sclerosis was the study of PAD2 (Peptidyl Argininedeiminase 2) gene promoter in MS NAWM.
Since the underlying evidence of such investigation was the detected global methylation loss in NAWMs by about 2/3 compared to the average control level, the promoter of PAD2 gene, an enzyme that converts arginine into citrulline residues, helped to interpret the eventual impact of the global
methylation variation on brains' MS pathogenesis
(Mastronardi, Noor et al. 2007).
This study displays a similar methylation reduction rate on PAD2 promoter, thus causing the increment of PAD2 transcript and protein. As a direct outcome of PAD2 upregulation in NAWM, MBP undergoes an abnormal gain of citrulline residues, thus leading to myelin structural destabilisation (Moscarello, Wood et al. 1994; Kim, Mastronardi et al. 2003). It is essential to remark that this chemical conversion exclusively hits the MS-CNS, and it is not found in other organs or neurodegenerative diseases (Mastronardi, Noor et al. 2007).
Epigenetic alterations in MS characterise the cellular components of the peripheral circulatory system. The same PAD2 gene shows an altered epigenetic control even in
24
PBMCs from MS patients. As similarly to brain tissues, the PAD2 promoter presents a reduced methylation rate that causes increased expression of the enzyme in peripheral blood cells. This mechanism might explain the development of autoimmune responses against MBP protein at the level of the central nervous system as it firstly develops in the periphery of the body (Calabrese, Zampieri et al. 2012).
Recent genome-wide sequencing studies on MS NAWMs did not confirm the previously detected global methylation loss. Instead, differentially methylated regions (DMRs) are scattered
on the whole NAWMs genome and feature both
hypermethylation and hypomethylation. RNA sequencing analyses conducted on these samples also confirmed that the observed DMRs occur and modulate the expression of specific gene categories involved in modulating the vulnerability of MS brains (Huynh, Garg et al. 2014).
On the one hand, hypermethylation seems to hit and repress genes that have a potential protective effect for the brain such as BCL2L2 and NDRG1, two oligodendrocyte survival genes; on the other hand potentially detrimental genes for brain’s health, such as the ones that encode cysteine proteases (LGMN and CTSZ), are hypomethylated and aberrantly upregulated. This notion is something that needs further exploration as eventual MS epigenetic targets may provide attractive new
25
targets for therapeutic strategies since the epigenetic modifications are susceptible to reshaping. A recent
investigation in the MS hippocampus showed that
demyelination processes coincide with other MS-specific DMRs, not shared by the previous studies.
However, deregulations in the expression of
methylation/demethylation enzymes reflect on hippocampus health as they influence the transcription of genes that are crucial for maintaining the brain’s health. For example, hypomethylation of AKNA, a gene involved in microglia regulations, promotes the expression of tumour necrosis factor-alpha (TNF-α), thus leading to neuronal death. On the contrary, WDR81, a neuronal survival gene, is hypermethylated and transcriptionally silenced in the MS hippocampus (Chomyk, Volsko et al. 2017).
The role of methylation in MS pathogenesis does not limit to local genomic changes, but it links to variations in the DNA methylation/demethylation machinery as well.
It is reported that TET2 modulates T-cells proliferation and differentiation in the murine model of MS. Once TET2 upregulates via 5-aza-2′-deoxycytidine (decitabine), a compound that hinders DNA methylation, the neurological worsening of the animals is prevented (Wang, Wang et al. 2017). As further evidence pointing to alterations in the
26
methylation/demethylation in MS is that even several TET2 polymorphisms have been associated with disease’s pathogenesis (Ottone, Cicconi et al. 2012; Ziliotto, Marchetti et al. 2019). Moreover, TET2 is among the MS susceptibility genes discussed earlier (Beecham, Patsopoulos et al. 2013). Noteworthy in this scenario is the fact that both genetic and epigenetic variations seem to associate TET2 to MS susceptibility. Similarly, even the major MS risk factor, the haplotype HLA-DR15, is known to be affected by both genetic and epigenetic changes in the context of MS pathogenesis (Kular, Liu et al. 2018). Consequently, the patients that do not present MS-associated genetic polymorphisms they would instead probably retain epigenetic variations on these genes, hence leading to as similar consequences determined by their genetic variants.
Other studies have also demonstrated that DNMTs are involved in the regulation of myelination. DNMT1 and DNMT3A are indeed involved in the modulation of oligodendrocyte differentiation and survival (Moyon, Ma et al. 2017).
PBMCs from MS subjects show that the expression of DNA methylation-associated enzymes, TET2 and DNMT1, is significantly reduced along with aberrant methylation profiles at their promoters. Moreover, 5hmC was reduced in PBMCs from MS subjects, probably as a direct consequence of the
27
altered expression of the TET2 enzyme (Calabrese, Valentini et al. 2014). Recently, it was discovered that the methylation/demethylation machinery is also altered in the
demyelinated brain lesions as they present TETs
downregulation, DNMTs upregulation as well as a hydroxymethyl residues reduction (Chomyk, Volsko et al. 2017).
As a further demonstration that epigenetic mechanisms are involved in MS is the fact that the literature reports an increasing number of amelioration of the disease via 'epigenetic drugs.' In this direction, the EAE animal model is essential as it opens up more opportunities for designing therapeutic strategies for MS. Trichostatin A (TSA), vorinostat and valproic acid (VPA), three HDAC inhibitors, were shown in several studies to attenuate spinal cord inflammation and disease severity as well as preventing demyelination, neuronal and axonal loss in EAE mice (Camelo, Iglesias et al. 2005; Xuan, Long et al. 2012; Ge, Da et al. 2013). EAE models confirmed the effects of methylation inhibitors. Treatment with 5-aza-2′-deoxycytidine has an immunosuppressive activity on CNS and prevents EAE disease severity and manifestations (Chan, Chang et al. 2014). Despite all these data recounted to possible epigenetic therapies, the utilisation of epigenetic drugs for MS is currently at an embryonal state. However, as these
28
novel therapies have already confirmed their effectiveness in the treatment of cancer and autoimmune diseases, this innovative approach will be hopefully beneficial for people affected with MS.
29
AIM OF THE WORK
The possibility that eventual epigenetic aberrations exert a causal role in MS is a hypothesis yet. This PhD thesis aimed to fill this informational gap by tracing the epigenetic imbalance in non-affected brain tissues from MS patients back to the altered expression of the DNA methylation/demethylation enzymes.
MS is a common and heterogeneous disease in which various genes and environmental determinants contribute to its pathogenesis. However, the low concordance rate in identical twins, the mutable clinical progression, and the distinctive sex prevalence imply the association with epigenetic phenomena. Many studies revealed alterations in DNA methylation, histones, and microRNAs (miRNAs) involved in MS NAWM (Normal Appearing White Matter) samples.
The study was carried out on autoptic samples of white matter not compromised by the MS pathological autoimmunity (NAWMs). This choice was necessary to avoid potential confounding effects linked to the extreme morphological heterogeneity and cellular composition that characterise the demyelination plaques (Lucchinetti, Popescu et al. 2011; Zheleznyakova, Piket et al. 2017). Furthermore, these brain sections have been selected as they present constitutive
30
anomalies not determined by MS autoimmunity. We analysed epigenetic variations in the context of two severe forms of the disease, the secondarily progressive form (SPMS), and the primary progressive form (PPMS). A group of control individuals, not affected by MS or other neurodegenerations, allowed the detection of MS-related epigenetic alterations. The other MS forms, such as the relapsing-remitting form (RRMS), have not been analysed as these patients turn into SPMS ones before the age of death. The experimental plan structures into four main objectives:
a. To determine the overall levels of the different epigenetic forms of cytosine such as 5mC, 5hmC, 5fC, and 5caC (dot-blot assays).
b. To measure the expression of the main enzymes involved in DNA methylation (DNMT1, DNMT3A, DNMT3B) and DNA demethylation/oxidation (TET1, TET2, TET3, TDG, and IDAX) (qRT-PCR technique). c. To observe local epigenetic variations in specific gene
loci, putatively associated with MS (MeDip - qRT-PCR technique).
31 MATERIALS AND METHODS
1. Origin of brain tissue samples
UK Multiple Sclerosis Society Tissue Bank provided the brain samples of normal-appearing white matter from MS subjects. For each patient, the analysis was conducted on three adjacent and cryopreserved NAWM sections of 2x2x1 cm from the cerebral frontal lobe.
These tissue fragments have been cut into smaller samples, weighing about 500 µg each, and stored at -80°C in the preservative solution Allprotect Tissue Reagent (Qiagen) to avoid tissue degradation and preserve RNA and DNA molecules.
The autopsy report has listed the information related to age, sex, disease duration, and disease form. The histopathological analysis of the patients' report confirmed that any disease signs,
32
demyelination events, or ongoing inflammations affect the samples.
2. DNA purification
Genomic DNA was purified using the optimised protocol described by Saldanha et al., as large amounts of lipids characterise the NAWM sections (Saldanha, Gannicliffe et al. 1984).
The procedure for extracting DNA from tissue starts with mincing 0,5-1 g of brain tissue in the specific buffer (10mM Tris-HCl pH 8, 5 mM EDTA, 400 mM NaCl, 1% SDS), with a ratio of 1:10 w/v (g/ml), and incubating it at 60° C for 30 min. The enzyme RNase A (Sigma), 20 ng/µl, ensured the removal of RNA contaminations on to the lysis by incubating the mixture for 1 hour at 37 ° C.
Successive removal of proteins was performed by Proteinase K addition, reaching the final suspension concentration of 0.1 µg/µl (Sigma) and leaving the sample at 60° C for about 16 hours.
The mixture is then extracted two times by adding an equal volume of Phenol: Chloroform: Isoamyl Alcohol 24: 25: 1
(Sigma). This suspension undergoes vortexing and
33
temperature (RT) to recover the aqueous phase containing the nucleic acid.
To precipitate DNA from the aqueous phase, we added sodium acetate 3 M pH 5.2 (1/10 of the mixture volume) and pure ethanol (2.5 times the suspension volume).
The samples were then incubated at -80 °C for one hour, to optimise DNA precipitation, and subsequently centrifuged at 13000 rpm for 10 min at 4 °C to recover the nucleic acid. The DNA underwent salt removal with ethanol 75%, dehydration at room temperature, and resuspension in TE solution (10 mM Tris-HCl pH 8, 1 mM EDTA). Purity and integrity of the extracted DNA was checked by spectrophotometry and agarose gel electrophoresis.
3. Dot blot technique
DNA samples are firstly denatured at 95 °C for 15 min. After three serial 1:1 dilutions in TE (1-0,25 µg), we immobilised DNA on a nitrocellulose filter (Hybond-N, GE Healthcare) via the Bio-Dot apparatus (Bio-Rad) and analysed in duplicate. DNA from two different cell types, HEK 293T cells, and peripheral blood mononuclear cells (PBMC), were used to check antibody specificity. Synthetic DNA sequences (Epigentek) retaining one specific cytosine modification allowed the evaluation of the antibody specificity.
34
The nucleic acids are then exposed to UV rays to fix them to the membrane. Once completed the DNA fixation, the filter undergoes incubation in a blocking solution (5% fat-free milk, 0.05% Tween 20 in PBS) for 1 hour. After the blocking phase, the membrane was probed for 1 hour with specific primary antibodies: anti-5mC 1:1000 (Epigentek), anti-5hmC 1: 5000 (Active Motif), anti-5fC 1:250 (Active Motif), anti-5caC 1:250 (Active Motif). Once completed the primary antibody incubation, the membrane is later washed three times in PBS 0.05% Tween 20 for 15 minutes to probe it with appropriate secondary antibodies for 1 hour. All the secondary antibodies are anti-IgG mouse/rabbit conjugated to HRP enzyme (horseradish peroxidase, horseradish peroxidase) (Santa Cruz Biotechnologies). The filter is then washed three times for 15 minutes in PBS 0.05% Tween 20 with to remove the secondary antibodies. The Pierce ECL Plus Western Blotting Substrate kit (Thermo Fisher Scientific) allowed the detection of the antigen-antibody complexes via a chemiluminescent reaction. Exposition, for 1-5 min, with photosensitive photographic plates (Amersham Hyperfilm ECL) captured the light produced by the membranes.
Filter colouration with a nonspecific nucleic acid dye, 0.02% methylene blue in 0.3 M of sodium acetate (pH 5.2), for 15 min checked eventual loading differences.
35
The GS-800 Calibrated Densitometer (Bio-Rad) quantified the methylene blue signals. For the following quantification procedure, all density values underwent subtraction from the background (signal of a sample without nucleic acid). The ratio between the "specific" cytosine variant light signal (immunological detection) and the "nonspecific" colourimetric blue signal (methylene) related to a signal strength value of each DNA modifications. Each sample's ratio was matched to a control one, to which the ratio value was arbitrarily associated with 1.0, to provide the comparison of the obtained signals.
4. Extraction of total RNA
The RNeasy Lipid Tissue Kit (Qiagen) allowed total RNA extraction from the samples. DNase addition that removed DNA contaminations allowed a better purification of RNA. Isolated RNAs were evaluated for their concentration, purity and integrity in the same way as DNA.
5. Gene expression quantification (RT-qPCR)
5.1 Reverse transcription (RT)
RT-qPCR was used to assess transcription levels for the studied genes. 1.5-2 µg of RNA for each sample was converted into the complementary cDNA by reverse transcriptase reaction (RT), according to the manufacturer's protocol for the
36
High-Capacity RNA-to-cDNA Kit (Thermo Fisher Scientific). Negative controls have been obtained through reactions performed in the absence of both RNAs or reverse transcriptase enzyme. The reaction was carried out with a Gentaur XP thermocycler following the steps, times and temperatures as indicated in Table 1. Storage at -20 ° C of the samples occurred at the end of the reaction.
5.2 Gene expression evaluation (qPCR)
qPCR assays tested the expression of the genes of interest in triplicate on 20 ng of cDNA relative to the initial RNA quantity.
The amplification comprehended the TaqMan gene expression fluorescent probes (Thermo Fischer Scientific) and the reagent solution Taqman Universal Master Mix (Thermo Fisher Scientific). The qPCRs were then loaded in 96-well optical plates and evaluated with the iCycler iQ (Bio-Rad) thermal cycler following the steps, times and temperatures listed in Table 2.
37 Table 1
Step 1 Step 2 Step 3 Temperature
(°C)
37°C 95°C 4°C
Time 60 min 5 min ∞
Table 2
Step 1 Step 2 step 3 (x 40 cicli) Temperature
(°C)
50°C 95°C 95°C 60°C
Time 2 min 10 min 15 sec 1 min
TaqMan gene expression assays were performed for TET1
(Hs04189344_g1); TET2 (Hs00325999_m1); TET3 (Hs00896441_m1); IDAX (Hs00228693_m1); TDG (Hs00702322_s1); DNMT1 (Hs00945875_m1); DNMT3A (Hs01027162_m1); DNMT3B (Hs00171876_m1); GUSB (Hs00939627_m1); GAPDH (Hs02786624_g1); XPNPEP1 (Hs00958021_m1); AARS (Hs00609836_m1); HPRT1 (Hs02800695_m1); ACTB (Hs01060665_g1); OSP (Hs00194440_m1); RBFOX3 (Hs01370654_m1); GFAP (Hs00909233_m1); CD45 (Hs02519237_s1); CD68 (Hs02836816_g1); TNF-α (Hs00174128_m1); IL1B
38
(Hs01555410_m1); CXCL13 (Hs00757930_m1); AIF1
(Hs00610419_g1); GAS6 (Hs01090305_m1); HLA-DPB2 (Hs01678253_m1).
For the proper comparison between different qPCR experiments, one sample was used in each plate as a calibrator to normalise the different amplifications (reference). Calibration curves estimated the amplification efficiency of each of the primer/probe pairs (serial dilutions 1:1 of the reference cDNA sample to obtain five dilution points containing 100 - 6.25 ng). The expected qPCR efficiencies were between 90 and 98%.
Among a list of housekeeping genes, HPRT1 (hypoxanthine
phosphoribosyltransferase 1), AARS2 (alanyl—tRNA
synthetase 2), ACTB (beta-actin), GAPDH (glyceraldehyde-3-phosphate dehydrogenase), GUSB (glucuronidase beta) and XPNPEP1 (X-prolyl aminopeptidase 1) it was determined which are the most suited for the expression normalisation. Two algorithms, geNorm (Vandesompele, De Preter et al. 2002) and NormFinder (Andersen, Jensen et al. 2004), have been used for such purpose. They both concluded that the geometric mean between the expression level of GUSB and XPNPEP1 being the optimal normalisation strategy to carry out expression analysis.
39 Table 3
GeNorm and NormFinder identify the optimal normalisation gene among a set of candidates. Stability
values of the analysed candidate genes. The represented numerical value is inversely proportional to the stability detected among the analyse genes.
The normalised gene expression in all samples referred to the expression of the same loci in the reference sample, to which the value 1.0 was arbitrarily assigned.
6. DNA immunoprecipitation (DIP)
DNA immunoprecipitations were performed to determine eventual locus-specific CpG methylation alterations on MS susceptibility genes. The same antibodies for the dot-blot assays applied for this other technique. The three sample
GeNorm NormFinder
Transcript Stability Transcript Stability
HPRT1 1,794 AARS2 0,461 AARS2 1,771 ACTB 0,449 ACTB 1,501 HPRT1 0,421 GAPDH 1,408 GAPDH 0,407 GUSB 1,339 GUSB 0,289 XPNPEP1 1,168 XPNPEP1 0,135
40
cohorts (CT, SPMS and PPMS) of genomic DNA were tested via a “pooling sample method” as this strategy is less expensive and it allows faster enrichment evaluations: 12 samples were pooled to form one cohort with 1 μg of genomic DNA each, thus having pooled cohorts of 12 μg. Each sample pool was sonicated (40% amplitude; 0.5 cycles) 16 times with pulses of 10 seconds and pauses of 1 minute in 400 μl of TE. After the sixteenth sonication, a 1% agarose gel electrophoresis checked the genomic DNA for the proper fragmentations (1000 bp-300 bp). Fragmented DNA is then denatured at 95° C for 10 minutes and ice-cooled for 10 minutes to allow the antibody hybridisation with the DNA. Each antibody was incubated with 5 μg of DNA in a solution containing TE and the IP buffer (10 mM Na-phosphate, 0.14 M NaCl, 0.05% Triton x-100). 2 μg of sonicated DNA have been stored at -80° C as they serve as the INPUT for qPCRs. On the one hand, 5 μg of the fragmented DNA incubated with the specific antibody for the four cytosine modifications (anti-5mC; anti-5hmC; anti-5fC; anti-5caC); on the other hand, 5 μg incubated with a non-specific IgG antibody as an isotype control.
The DNA-antibody hybridisations were conducted overnight on a rotating platform at 4° C. The antibody-DNA complexes are then recaptured with an agarose resin (Merck Millipore Protein A Agarose for the rabbit isotypes; Merck Millipore
41
Protein G Agarose for the mouse isotypes). The incubation of antibody-DNA complexes with the resins was carried out for 2 h on a rotating platform at 4° C. Once the recapture is completed, the resins are washed with cold IP buffer and later digested with proteinase K (Sigma-Aldrich) to solubilise the captured DNA fragments. For each digestion, addition of 7 μL of proteinase K (10 mg/ml) to the resin and then incubation for 2 hours on a rotating platform at 55° C occurred. The samples underwent a double organic extraction, to remove protein contaminations, with an equal volume of phenol:chloroform: isoamyl alcohol 25:24:1. DNA fragments precipitation is carried out with two volumes of pure ethanol, 400 mM of NaCl and 0.5 μg/μL glycogen (Bio Protech), then cooled on ice for 30 minutes. Precipitated DNA was later recovered by centrifugation at 14,000 rpm for 30 minutes at 4° C. The supernatant is discarded, and the sample was dehydrated at room temperature and resuspended in 50 μl of nuclease-free water. qPCR assays evaluated the enriched fractions by using site-specific primers: the experiments tested 14 µl of immunoprecipitations and 10 ng of the input sample. Each reaction was carried out using specific primers (0.4 µM) and the reagent SYBR Premix EX Taq (Takara) under the experimental conditions suggested by the manufacturer. The
42
following equation: 100 * 2 ^ (Ct input - Ct (IP)) calculated the enrichment value in the immunoprecipitated samples.
Ct input defines the average value of the cycle threshold for the input samples, while Ct (IP) the average value of the cycles threshold for the immunoprecipitated sample. Table 4 shows the sequence of primers in PCR assays. Before running the actual experiments, synthetic sequences for 5mC/5hmC cytosine variants (Zymoresearch) checked the technique efficiency as well as the antibody specificity. These DNA molecules hold the same nucleotide sequence with the only difference being that each one contains either 100%
unmodified cytosines, 5-methylcytosines, or
5-hydroxymethylcytosines. Based on the amount genomes present in 12 μg, we added an appropriate amount of DNA standard so that it would have been considered as a single copy of a gene.
7. RT-qPCRs for the expression evaluation of the candidate genes
Along with the locus-specific evaluations of the enrichments, the expression of these genes was evaluated as well. The amplification was carried out starting from 20 ng of cDNA (relative to the amount of RNA subjected to retro-transcription) using specific primers (0.4 µM) and the reagent SYBR Premix
43 Table 4
Primer sequences for the analysis of the immunoprecipitation enrichment of the candidate gene loci.
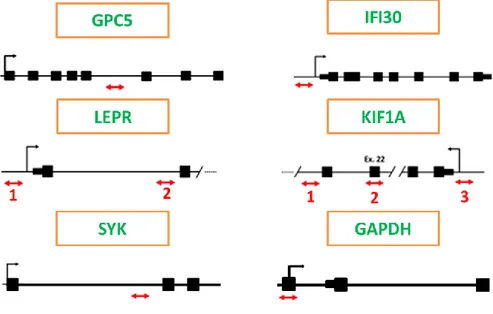
EX Taq (Takara) in the experimental conditions suggested by the manufacturer. Each sample was measured in triplicate, and the amplification was conducted in 96-well optical plates with an ICycler IQ (Bio-Rad) thermal cycler. For the calculation of the expression, the procedure already described in paragraph 3.5.2 has been adopted. The sequences of the used primers are shown in Table 5.
Primer Forward-Primer Reverse-Primer
GPC5 TTTCACCGTGTTGACCAGGTT AAATATGGTATACAGGCCGGG
IFI30 ATTTCTTCCAATAGGGCTGG AAGACTCACCACCCCAACTTT
KIF1A site 1 TTTCCTGGGGCTGCAGAGA GGTTTCCACCTTCCCATCA
KIF1A site 2 TCTGCCAAGGAAGGGAGGA TGATGCGGGAGATGTACGA
KIF1A site 3 AGCGAGCGTTGTTGGAAAA TGACAAAGGTGCGTTCGTAA
LEPR site 1 TGTTGAAAACCCAAGTCCCA TGGCTTGGACTTTGGATGAA
LEPR site 2 GAGGCCTTTAAAAATTAGCCA CGCTGGGTGATATGGAAGA
SYK AAGAAGGGAAAGCCACAGCAT TTCTGCCCTCCTGCTTCCT
GAPDH TACTAGCGGTTTTACGGGCG TCGAACAGGAGGAGCAGAGAGCGA
44 Table 5
Primer sequences for the expression analysis of candidate gene loci.
8. Statistical analysis
The characteristics of the population were studied using the mean and standard deviation (SD) for continuous variables (age, disease duration, post-mortem interval) and frequencies (%) for categorical variables (gender, disease activity). Eventual differences in these characteristics between cohorts were tested with the one-way analysis of variance tests (ANOVA) (continuous variables) or the chi-square test (prevalence, for categorical variables). The differences in the measured variables between the experimental groups were analysed with the Kruskal-Wallis (KW) and generalized linear model (GLM) tests. The paired comparisons (between the individual groups of samples) were performed with the
Mann-Primer Forward-Mann-Primer Reverse-Primer
GPC5 GCCAGGATATGCAGCAGTTT TTGTTTGATGAGAGTTTCAAGGG
IFI30 TGACCATTGTCTGCATGGAA TCCATGATAGTGTCTGGCGA
KIF1A TGAGACAGGCAGCCATATCC GAGACAAGATGTTGGGGTCG
LEPR AACCTTCAATTCCAGATTCGC TCTGGAACTGGGAGACTGACA
45
Whitney and Bonferroni methods. The GLM analysis was used to evaluate the influence of potential confounding variables on the differences between the experimental groups. The association between variables was analysed with Spearman and Pearson linear correlation.
All statistical analyses were performed using the SPSS software (SPSS Inc., Version 23.0).
46
RESULTS
1. Subjects and tissue
The experiments compared NAWMs from 29 patients with clinically definite MS, 15 SPMS and 14 PPMS, with NWMs (Normal White Matters) from 13 control subjects not-affected by neurodegenerations (Table 6). As the autopsy reports show, the three sample cohorts do not present any differences in regards to age, gender, postmortem interval (PMI: the elapsed time since a subject has died), disease duration (DD) or disease activity presence at the time of death.
Active patients are the ones that displayed ongoing demyelinations as revealed by the histopathological examination in the autoptic reports.
Being the samples size not large enough to determine if the normal distribution characterises the measured values, we applied both non-parametric and parametric statistical
47 Table 6 Controls SPMS PPMS P N. 13 15 14 Age (years) 73,08 ± 10 64,47 ± 13,43 66,07 ± 16,81 0,216§ % Females (n) 46 (6) 60 (9) 57 (8) 0,745‡ PMI (hours) 18,00 ± 6,22 17,73 ± 7,12 18,92 ± 5,74 0,346§ DD (years) 31,86 ± 11,49 30,36 ± 13,66 0,769$ % Active patients (n) 60 (9) 50 (7) 0,588‡
Patients data survey. The reported values are mean ± SD.
Percentages (number) describe female prevalence and active patients at the time of death. The reported p-values refer to the following statistical tests: one-way §ANOVA; ‡Chi-squared test; $Student's t-test.
procedures to verify the occurrence of differences between subjects groups.
The statistics tested the impact of these parameters on the examined variables by using two approaches: the Generalized Linear Model (GLM) and the Kruskal-Wallis test (KW).
2. NAWMs’ cell composition and inflammation
Before running the experiments, some preliminary tests checked the white matter samples for variations in their cell composition, the eventual presence of immune cells and the
48
inflammation rate via the expression evaluation of specific markers (qPCRs).
RBFOX3, OSP and GFAP transcripts have been measured as markers for neurons (Gusel'nikova and Korzhevskiy 2015), oligodendrocytes (Michalski, Keck et al. 2018) and glial cells (Yang and Wang 2016), respectively. CD45 (the common leukocyte antigen) and CD68 (cluster of differentiation 68) worked as leukocyte and macrophage markers (Altin and Sloan 1997; Chistiakov, Killingsworth et al. 2017). The expression of several inflammation factors, involved in MS pathogenesis, has been measured as well (AIF1, CXCL13, GAS6, HLA-DPB2, IL-1β, TNF-α) (Khademi, Kockum et al. 2011; Rossi, Motta et al. 2014; Rossi, Studer et al. 2014; Bellan, Pirisi et al. 2016; Chinnasamy, Lutz et al. 2016; Zrzavy, Hametner et al. 2017). As Table 7 shows, the analysed samples do not present differences in terms of cell composition, immune cells presence or inflammation.
49 Table 7 Cohorts Median (IQR) CT SPMS PPMS Stat a b c P (KW)* P (GLM)§ OSP 2.730 (6.415) 4.000 (2.439) 3.693 (6.978) 0,517 0,626 RBOFX3 1.025 (2,133) 2.166 (2,640) 1.027 (1,090) 0,402 0,384 GFAP 0.382 (0.490) 0.397 (0.516) 0.385 (0.398) 0,918 0,996 CD45 0.693 (1.318) 0.59 (0.608) 0.845 (1.356) 0,591 0,475 CD68 0.847 (1.410) 0.628 (0.812) 0.940 (0.957) 0,390 0,179 TNF-α 0.533 (0.602) 0.439 (0.410) 0.578 (0.704) 0,537 0,724 IL-1β 0.046 (0.096) 0.177 (0.167) 0.058 (0.104) 0,121 0,742 CXCL13 0.562 (0.855) 0.464 (0.631) 0.508 (0.677) 0,870 0,511 AIF1 1.023 (1,762) 0.905 (1,504) 0.768 (0,979) 0,638 0,594 GAS6 0.674 (0,524) 1.033 (0,861) 0.654 (0,859) 0,872 0,054 HLA-DPB2 1.026 (1,055) 1.054 (1,617) 1.516 (1,126) 0,160 0,129 NAWMs’ (Normal Appearing White Matter) cell composition and inflammation. *KW test: non-parametric
comparison with the Kruskal-Wallis test. Comparison data for pairs derived from the Mann-Whitney U test. The reported data corresponds to median and interquartile range (IQR). §GLM: comparison by generalized linear model. The model includes the effects of age, gender and PMI as covariates.
50 Table 8 Cohorts Median (IQR) CT SPMS PPMS Stat a b c P (KW)* P (GLM) § 5mC 1.347 (0.548) 1.228 (0.916) 1.265 (0.259) 0,898 0,161 5hmC 1.730 (0.300)b,c 1.570 (0.620)a 1.255 (0.525)a 0,002 0,008 5fC 0.294 (0.126) 0.291 (0.099) 0.268 (0.116) 0,203 0,594 5caC 4.295 (1.999) 2.939 (2.764) 3.360 (3.876) 0,149 0,047 Cohorts Median (IQR) CT SPMS PPMS Stat a b c P (KW)* P (GLM)§ TET1 1.431 (1.215) 1.316 (1.270) 1.228 (0.866) 0,919 0,040 TET2 8.45 (8.345)b, c 3.810 (2.08)a 4.84 (1.705)a 0,001 0,013 IDAX 4.176 (2.998)b 6.353 (5.108)a, c 4.441 (2.551)b 0,006 0,004 TET3 1.425 (0.595) 1.769 (0.840) 1.697 (0.845) 0,534 0,719 DNMT1 0.540 (0.261) 0.587 (0.141) 0.484 (0.330) 0,315 0,487 DNMT3A 2.955 (0.807) 2.603 (0.899) 2.419 (1.080) 0,621 0,417 DNMT3B 0.072 (0.067) 0.050 (0.048) 0.041 (0.032) 0,073 0,039 TDG 0.404 (0.197) 0.394 (0.205) 0.432 (0.220) 0,677 0,255
51
3. Decrease of 5-hydroxymethylcytosine in NAWM samples
The isolated DNA from NAWM samples were used to examine the relative cytosine modifications (5mC; 5hmC; 5caC; 5fC) content via dot-blot assays.
The dot-blots also examined the DNA of HEK-293-T cell line and PBMC cells from blood; the former worked as negative controls and the latter as a positive control for the antibody specificity (data not shown).
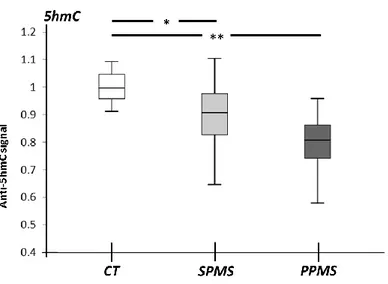
Overall, the experiments showed that 5hmC levels were significantly reduced in the MS groups compared to the controls (Table 8), especially in the PPMS group than in the SPMS group (Figure 3). Nevertheless, the MS cohorts do not deviate from the controls in terms of 5mC contents (Table 8). Interestingly, MS samples also show a reduction of both 5fC and 5caC contents that reach a sufficient statistical significance only with the GLM test (Table 8).
Cytosine modifications’ levels and methylation/ demethylation enzymes’ expressions. *KW test:
non-parametric comparison with the Kruskal-Wallis test. Comparison data for pairs derived from the Mann-Whitney U test. The reported data corresponds to the median and interquartile range (IQR). The values in bold indicate the groups with significant differences (P <0.05). §GLM:
comparison by the generalized linear model. The model includes the effects of age, gender and PMI as covariates.
52
Figure 3. 5hmC reduces in SPMS (Secondary Progressive MS) and PPMS (Primary Progressive MS) NAWMs (Normal Appearing White Matter). Global 5hmC level as
detected by Dot-blot assay in control (CT), SPMS and PPMS NAWM specimens. The relative levels were re-calculated taking the 5hmC levels in control as 1. The box plot displays the medians and the distribution of the measurements. The statistical significance refers to the Kruskal-Wallis test followed by the Mann-Whitney U test for the comparison between groups. * p <0.05, ** 0.01< p <0.05.
4. TET2 and IDAX genes are transcriptionally deregulated in MS NAWMs
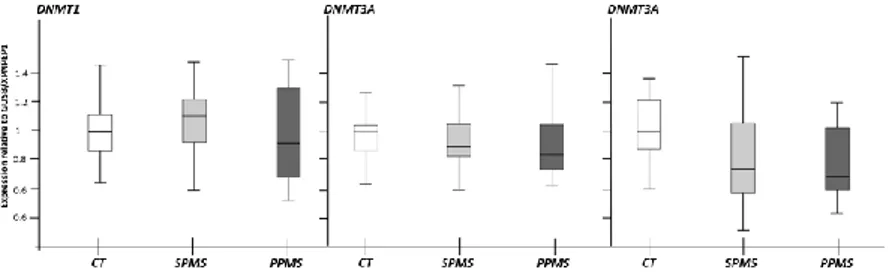
We, consequently, checked the MS NAWM samples for defects in DNA methylation/demethylation machinery. qPCR experiments assessed the expression of the maintenance/de novo DNA methylation enzymes, DNMT1, DNMT3a and
53
Figure 4. Methylation enzymes gene expression. DNMTs
family gene expression was measured by qPCR. To normalise the expressions, GUSB and XPNPEP1 geometric mean was used and the relative levels were calculated taking the control as 1. The box plot displays the medians and the distribution of the measurements.
DNMT3b, as well as the proteins accountable for DNA demethylation, TET1, TET2/IDAX, TET3 and TDG.
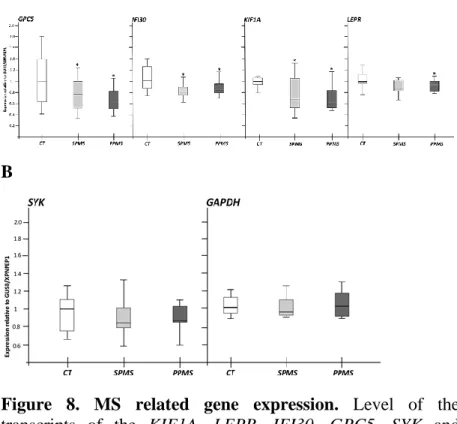
The geometric mean of GUSB and XPNPEP1 transcript levels normalised the expressions. The expression results of the methylation/demethylation machinery revealed that in NAWMs, the expression of TET2 is down-regulated in both MS cohorts (A). Furthermore, the protein that recruits TET2 on DNA, IDAX, is up-regulated only in SPMS patients. All the methylation proteins do not vary significantly in as well as no discrepancies feature TET1 and TET3 transcripts.
54 A
B
Figure 5. Demethylation enzymes gene expression. TETs
family gene expression was measured by qPCR (A). The DNA binding protein of TET2 (IDAX) and TDG transcripts were also measured as well (B). To normalise the expressions, GUSB and XPNPEP1 geometric mean was used and the relative levels were calculated taking the control as 1. The box plot displays the medians and the distribution of the measurements. The statistical significance refers to the Kruskal-Wallis test followed by the Mann-Whitney U test for the comparison between groups. * p <0.05, ** 0.01< p <0.05.*** p< 0.01.
55
5. Relationship between 5hmC, TET2 and IDAX with NAWMs’ cell composition and inflammation
The markers for inflammatory events, cell composition and immune cells presence exhibit a significant positive correlation between them, while they correlate negatively with the oligodendrocyte (OSP) marker (data not shown). This data confirms the well-known relationship between inflammation and the loss of CNS myelin-forming cells, even in the plaque-free areas of the brain. Despite having diverse significances in regards to these markers, with the GLM test, only the neuronal marker, RBFOX3, manifests an association with 5hmC (partial correlation with age, gender and groups as control variables, data not shown). Besides, the Wald Chi-Square tests and the GLMs showed that none of the measured markers removes the discovered differences. Therefore, patients' groups exert the strongest effect on determining the 5hmC, TET2 and IDAX variations (p-values after GLM's correction: 5hmC, <0.001; TET2, <0.001; IDAX, 0.005).