DiSES Working Papers
Università degli Studi di Salerno Dipartimento di Scienze Economiche e Statistiche >>>www.dises.unisa.it
Who And Where Are the Co-Authors?
The Relationship Between Institutional and
Geographical Distance in Scientific Publications
Rosamaria D’Amore
Roberto Iorio
Agnieszka Stawinoga
ISBN: 978-88-6197-054-0 ISSN: 1971-3029
Dipartimento di Scienze Economiche e Statistiche Università Degli Studi di Salerno
Via Ponte Don Melillo – 84084; Fisciano (SA) – Italy
Tel +39-089-96.21.55
Fax +39-089-96.20.49
E-mail [email protected]
WHO AND WHERE ARE THE CO-AUTHORS? THE RELATIONSHIP
BETWEEN INSTITUTIONAL AND GEOGRAPHICAL DISTANCE IN
SCIENTIFIC PUBLICATIONS
Rosamaria D’Amore* Roberto Iorio† Agnieszka Stawinoga‡
Abstract
The main goal of our research is to analyse the relationship between geographical and institutional distance in research collaboration. Given that there is institutional distance if different kinds of institutions collaborate, we want to verify if such distance changes, and in what direction, when the physical distance increases.
This analysis is conducted at an aggregated level, than at a more disaggregated one, taking some factors into consideration: on one side the quality and relevance of the papers; on the other side the different nature and aims, therefore the different behaviour, of different institutions. Regarding the analysis tools, the social network analysis is joined with the regression analysis.
The more relevant results may be synthesized in this way: at a more aggregate level the direction of the relationship between spatial and institutional distance does not emerge with full statistical evidence; at a more disaggregate level the results emerge more clearly: taking into consideration the papers that receive few citations (that may be considered as results of project of limited scientific relevance or quality), the relationship between geographical and institutional distance is inverse; among more cited papers, the relationship is direct. On another side, taking the behaviour of different institutions into consideration, we observe an inverse relationship between spatial and institutional distance for firms, universities and research centres, a direct relationship for hospitals.
The phenomenon of inter-institutional collaboration is seen through the lens of co-autorship of scientific publications in the Italian biotech sector. We analyse a database including the publications done by the Italian biotech firms from 2003 to 2005; the institutions the authors of the publications belong to are registered and classified in four categories (firms, universities, hospitals and research centres); their localization is registered too.
Keywords: University-industry collaboration; Institutional distance; Spatial distance;
Co-autorships; Knowledge flows; Scientific and Technological Policy.
JEL classifications: L65; O33; O31
* University of Salerno, Department of Economics and Statistics (DISES), Via Ponte Don Melillo, 84084, Fisciano (SA), Italy, [email protected]
†
University of Salerno, Department of Economics and Statistics (DISES), Via Ponte Don Melillo, 84084, Fisciano (SA), Italy, [email protected]
‡
2
Notes and Acknowledgements. This paper derives from a strict collaboration among the
authors, both on the conceptual and empirical point of view. Anyway, sections 4, 5 and 6 (first part: until Table 2 and its comments) have been written by Rosamaria D’Amore; sections 2, 3 and 6 (second part, after comments to Table 2) by Roberto Iorio and section 7 by Agnieszka Stawinoga. Introduction and conclusions have been jointly written.
For many precious suggestions we are grateful to Maria Rosaria D’Esposito, Giuseppe Giordano and two anonymous reviewers.
A previous version of this paper has been published as Working paper INFER 2011.4
Introduction
It is widely acknowledged that, in the modern knowledge-based economy, therefore particularly in science-based sectors, the innovation usually derives from collaboration of different agents, often located in different regions or countries and often belonging to different institutions (OECD, 1996). The patterns of collaboration across regions or countries, the ease given by modern information technology to distant collaborations and the persistent importance of vis-à-vis collaboration are themes widely investigated by the literature (Katz, 1994; Liang and Zhu, 2002; McKelvey et al., 2003). On the other side, an abundant stream of literature exists on the difficulties deriving from collaboration between different institutions, particularly between university and industry, which have different research goals and incentive structure (Dasgupta and David, 1994; Frenken and Van Oort, 2004); anyway collaboration among different innovative institutions may be fruitful in terms of quality, because of the existence of complementarities (Bonaccorsi and Thoma, 2007; Iorio, et al., 2012). Relatively less explored is the theme of the relationship between this two kind of “distance”, the physical and institutional one, in research collaborations. Analysing this relationship is the main goal of our paper. A more articulated view about this issue may help to better understand how knowledge flows among innovative agents and to adopt better and more selective policy measures.
We observe the phenomenon of research collaboration through the lens of co-autorship of scientific publications in the Italian biotech sector. This sector is particularly suitable for such kind of study, as it is characterized by a complex knowledge base, where the sources of expertise are widely dispersed and network relations are frequently used to access and to exchange this knowledge (Powell et al., 1996).
Basing on a database including the publications done by the Italian biotech firms from 2003 to 2005, we build the network of co-autorships and we analyse it through the instruments of the regression analysis and of the social network analysis. The institutions the authors of the publications belong to are the nodes of the network. They are classified in four categories (firms, universities, hospitals and research centres) and their localization is registered too. We compare the national network of publications (the network generated by the publications done by authors all belonging to Italian institutions) with the international network of publications (the network generated by the publications done by authors belonging at least to one international institution), trying to verify if the inter-institutional collaborations assumes different intensity in the two sub-networks, in this
3
way investigating the relationship between spatial and institutional distance. We sustain that, on a theoretical point of view, such relationship may be twofold. On one side, as both kind of distance imply a cost, a trade-off may emerge: according to this view, international publications should be characterized by more homogeneous (on an institutional point of view) networks of publications. On the other side, highly specialised competencies are very dispersed, on a geographic and institutional point of view; therefore a firm that needs on-the-frontier knowledge activates an international and heterogeneous network of collaboration, while, if the required knowledge is more ordinary, a local and homogeneous network is activated.
We try to verify which direction of the relationship prevails. We also test the hypothesis that this relationship may be influenced by the scientific relevance of the project that originated the paper (that we suppose may be measured by the citations received by the paper) and may be different for different kind of institutions.
The paper is structured in the following way: the second section presents a review of the more relevant literature for our research; the third section presents some hypotheses that may be formulated regarding the relation between spatial and institutional distance; in the fourth section the biotech sector and the theme of scientific collaboration and consequent joint publication are briefly illustrated; in the fifth section a description of the data used for the empirical analysis can be found; the fifth session presents the results of the bivariate and multivariate analysis, while the sixth session illustrated the analysis developed through the social network analysis; a seventh section with a synthesis of the results and some final considerations concludes the paper.
2. Spatial and institutional distance: a literature review
The specific focus of this paper is on the relationship between institutional and spatial distance in research collaborations: while an abundant theoretical and empirical literature analyses the effect of spatial distance on R&D collaboration, a more limited number of papers considers how this effect is mediated by other factors, like institutional distance.
A first remark regarding the relationship between institutional and geographic distance may be found in Pavitt (1984) and DeSollaPrice (1984), who assumed that collaboration between academic and non-academic organizations was more localised into space than collaboration between universities. Boschma (2005) explicitly states an inverse relationship between geographical and institutional proximity, as geographical proximity may compensate for the lack of institutional proximity and institutional proximity facilitates interaction over long geographic distance. An important reference point for our study is the paper by Ponds et al. (2008), as they analyse the role of geographical proximity for scientific research collaboration in science-based technologies between three kinds of institutions: academic organizations, firms and governmental/non-profit organizations. They observe the co-autorships in scientific publications, in eight technological fields, as registered in ISI-Web of Science from 1988 onwards. The spatial distance is calculated in great detail: it is the average travel time between the regions (defined at a NUTS-3 level) where the institutions are located. The consideration of institutional distance is less in detail: as reported above, three kinds of institutions are defined, and there is a distinction between collaboration among institutions of the same kind (no institutional distance) and of different kind (institutional distance) Their conclusion is that the collaboration involving different kinds of institutions is more
4
localised than collaboration between the same kind of institutions: when institutional distance increases, spatial distance reduces.
The paper of McKelvey et al. (2003) is of great importance for us too, as the content of their study is similar as before and the sector they analyse is the of our study, (biotechnologies); they also consider a national case (Sweden). They also find a trade-off between spatial and institutional distance: geographical co-location is more important for inter-institutional collaboration (firms with universities) than for collaboration among the same kind of institutions (firms with firms; universities with universities).
Other papers, even though not exactly focused on the theme of our interest, are relevant to our work, as they analyse the effect of spatial distance on collaboration through the interaction of other factors (kind of research, social distance, nature of the agents). Broström (2010) explores if, in university-industry interaction, there is a relationship between the spatial distance and the kind of research involved in the project. He conducts a survey among the managers responsible for R&D in the engineering sector in Sweden and he finds that geographical proximity is important for short-term projects of a very applied nature, because the exchange of tacit knowledge is particularly relevant for this kind of research, while in long-term projects it is generally easier to work across geographical distance.
Autant-Bernard et al. (2007) analyse the role of geographical distance and of the “network effects” (the position and role in the network of collaboration) in affecting the probability to collaborate in R&D projects. The analysis is conducted among participants to 290 research projects submitted for the 6th EU Framework Program in micro and nanotechnogies. They distinguish among firms that are involved in many projects and firms involved in one single project: taking into consideration only the “multi-project” firms, there is no evident influence of spatial distance on the probability to collaborate, while there is a clear influence of the firm’s position within the network (number of direct and indirect partners; social distance between firms); if “single-project” firms are taken into account too, both geographical distance and social network effects matter, reinforcing the phenomenon of intra-national local clustering.
Even Scherngell and Barber (2009) find different effects of geographical distance on R&D collaboration in two different groups of agents: in this case the distinction is among private and public agents. Considering the collaboration among firms (industrial R&D networks), spatial distance seems to have an important effect on the probability to collaborate, while, analysing the public research R&D network (among universities and research organizations) the effects of geography are smaller. In both groups the technological distance is the most important factor. This analysis is conducted among the projects of the 5th EU Framework Programme.
Scherngell and Barber (2011) find that the spatial proximity does increase to probability to collaborate between different organizations, but other factors may act in the same way; such factors are: the thematic distance, the experience in projects of the same kind (the authors are analysing the projects of the 5th EU Framework Programme), the prior acquaintance and the centrality of the institution in the network of collaborations.
5
3. Expectations about the relationship between spatial and institutional distance
This paper has the aim to analyse the relationship between spatial and institutional distance in the research collaborations. The existing literature about these issues suggests some hypotheses. Following Ponds et al. (2008), it is possible to argument that both kind of distance, spatial and institutional, imply a cost, that may be intended in direct monetary terms or in terms of “strength”; as agents try to minimise costs, there is a trade-off between the two kinds of distance: the more is the spatial distance, the less is the institutional distance and vice versa; therefore local networks should be more heterogeneous than international networks (we call this hypothesis A).
Indeed, another line of argument is possible, leading to an opposite conclusion: highly specialised competencies are very dispersed, on a geographic and institutional point of view: a firm that needs on-the-frontier knowledge activates an international and heterogeneous network of collaboration; if, on the contrary, the required knowledge is more ordinary, a local and homogeneous network may be activated. If this argument is correct, local networks should be more homogeneous than international networks (we call this hypothesis B).
The first hypothesis is substantially based on an idea of at least partial substitutability of collaborators (considered like a sort of inputs in the production of new knowledge), therefore the costs of factors have a role in the choice process. The second hypothesis is based on the idea that particularly high competencies are difficultly substitutable and they must be taken “wherever they are”.
It is of course possible that the effects indicated by the two hypotheses coexist. The predominance of one or the other may depend by other factors. The quality and relevance of the scientific project may be one of such factors: if an important research project is activated, involving a strong monetary investment, the need to save resources is less important than finding the proper competencies: in this case the “strength” of hypothesis
A, based on a “resources effect”, is weaker than the effect predicted by hypothesis B, based on a “competencies effect”; on the contrary, if the project is less ambitious the aim to save resources may be prevalent, and the effect predicted by hypothesis A may be predominant.
Moreover, it is possible that different institutions have different behaviour and attitudes in managing the balance between the two kinds of distance, therefore the relation between spatial and institutional distance may be different for different kinds of institutions.
In the empirical part of the paper we will try to test which of the two hypotheses fits better our information. We conduct our analysis at an aggregate level first, considering all the publications and institutions together; than we disaggregate our data according to the factors indicated above: the citations received by the papers, as an indicator of the quality and relevance of the research projects; the kind of institution the authors of the paper belong to.
As empirical tools of analysis, we utilise both the regression analysis and the social network analysis.
6
4. Research collaboration and joint publications in the biotech sector
The theme of the relationship between spatial and institutional distance in this paper is empirically tested in a specific context, the Italian biotech sector. This sector is particularly suitable for a study about research collaborations involving different institutions because it relies mostly on inter-organizational collaborations. As Powell et al. (1996) argue, in the biotech sector the locus of innovation will be found in networks rather than in individual firms. There are many organizations where it is possible to find the knowledge, the expertise useful for the firm: it is possible to find it in the universities, in the research centres, in the hospitals.
The new knowledge generated by these collaborations not only takes the form of industrial innovations, but it is often disclosed trough the scientific publications: research collaborations often generate co-authored publications. Over two-thirds of even formal alliance partners in this field also appear as partners in scientific publications (Gittelman, 2005) and there is a close link between successful patents and scientific publications (Gittelman and Kogut, 2003; Murray and Stern, 2007).
Therefore, if the aim is to study the characteristics of the knowledge exchanges inside a technological field, considering that data on publications are usually of high quality and easy to access, it is possible to study the publications of the firms.
5. Data
In order to build a database of scientific publications in the biotech sector we made an intersection of two databases: i) RP Biotech data base; ii) ISI Web of Science. They are briefly described in the following.
RP Biotech data base. It is a collection of potentially all the Italian firms belonging to the biotech sector, active at December 2005. In this study we considered only the 306 life-science for profit firms.
ISI databases, especially the Science Citation Index®, and the web-based version Web of Science, is a detailed bibliometric database of journal articles and citations of worldwide research literature, that contains 14.000 international peer-reviewed scientific and technical journals.
We obtained information about publications of the selected firms across the period 2003-2005. The record of each publication in ISI-Web of knowledge reports, among other kinds of information, the name of the authors and the name of the institutions the authors belong to. We extracted all the publications where the name of at least one of the selected firms (Italian life-science for-profit biotech firms) appeared among the institutions of affiliation. Then we identified five categories of institutions (universities, research centres, hospitals, Italian life-science for-profit biotech firms1, other firms) and established which category each institution belongs to. In the following, except the presentations of the graphs, the category are reduced to four, as all firms are considered together.
7
6. Empirical results: descriptive and regression analysis
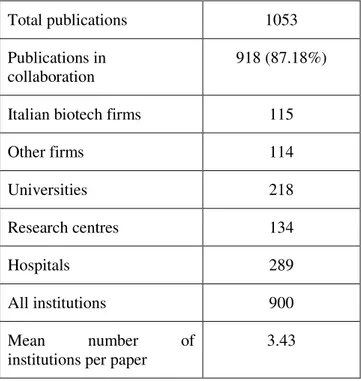
Table 1 shows some relevant statistics about our sample of Italian biotech firms’ publications. We report, the total number of publications done by Italian biotech firms in the period 2003-2005, the number and percentage of publications deriving from institutional collaboration, the number of different institutions involved in such publications and the mean number of institutions involved in each pape. It is remarkable the frequency of institutional cooperation, as in almost 9 papers on 10 the authors belong to more than one institution.1
Table 1. Descriptive statistics about publications and involved institutions
Total publications 1053
Publications in collaboration
918 (87.18%)
Italian biotech firms 115
Other firms 114 Universities 218 Research centres 134 Hospitals 289 All institutions 900 Mean number of
institutions per paper
3.43
In order to analyse the impact of spatial distance, we divided the papers in two categories: national papers (all the institutions the authors belong to are Italian) and international papers (at least one of the institutions the authors belong to is non Italian). In our analysis we exclude papers written not in collaboration (written by authors belonging only to Italian biotech firms), therefore we have 918 papers. Among these, 550 (60.57%) are national papers, 362 (39.43%) are international papers.
We assume that in international papers the physical distance among the authors is greater. It is of course possible that this is not always true: the distance between two distant regions of Italy may be greater than between two locations near the national borders. But this distinction lets to simplify the analysis and we calculated that it is, on
1
A more detailed description of the biotech sector, of the data and more statistical information may be found in D’Amore, Iorio and Stawinoga (2010); the present paper may be considered a further step of the research project begun with that paper, so that the two papers share some descriptive parts.
8
average, largely true. Besides, a collaboration across the borders implies other kinds of distance, like cultural and linguistic ones, that are absent in national collaboration (we remember that in Italy only a few and little minorities do not have Italian as their main language2, while, except a little region in Switzerland, in no other country Italian is spoken),
The first step of our analysis consists in calculating, for national and international papers, the average number of institutions the authors of the papers belong to: the average is 3.51 for national papers and 4.21 for international papers. Therefore the international networks of research are wider.
Then we take into consideration the variety of institutions involved in the publications. We assume that the institutional distance is measured by the variety of institutions the authors of the paper belong to: if the authors belong to n institutions, the institutional distance is greater than in the case the authors belong to less then n institutions3.
In our analysis we consider four kinds of institutions (firms, universities, research centres and hospitals) and we calculate how many kinds of institutions the authors of the papers belong to. Among national papers, the authors belong, on average, to 2.34 kinds of institutions; among international papers to 2.35 institutions.
From this results we should conclude that, when spatial distance increases, the number of involved institutions increases too, but there is no variation in the institutional distance. But this conclusion is not fully convincing: as an higher number of institutions increases the probability to have an high variety of institutions (in fact the number of institutions and the number of kinds of institutions involved in each paper are highly and significantly correlated: 0.521, significant at 99%) we need to verify the relationships between spatial distance and the variety of institutions also ceteris paribus, that is controlling for the number of institutions. The proper question is: given the number of institutions, do international papers have an higher or lower variety of institutions?
We need therefore a multivariate analysis, where the institutional distance among the authors of the paper (measured by how many kinds of institutions are involved in the paper) depends on the spatial distance among the institutions (measured by their national or international nature), controlling for the number of involved institutions. In the basic model, assuming the single paper as unit of analysis, we have therefore as dependent variable the number of kinds of institutions the authors of the paper belong to (we call this variable KINDINST); a dummy variable assuming value 1 if the paper is “international” and value 0 if the paper is “national” as independent variable (INTERNAT) and the number of institutions the authors of the paper belong to (NUMINST) as control variable.
2 The greatest linguistic minority is represented by almost half of the inhabitants of the province of Bozen, that are German speaking.
3 If a paper is written by six authors, two of them belonging to the firm Rossi S.P.A, two to the University of Milan, one to the University of Turin and the other author to the University of Rome, the number of institution involved is four and there are two kinds of institutions (firm and university). If another paper is written by five authors, one of them belonging to the firm Bianchi S.P.A., two to the University of Naples and two to the Hospital of Florence, the number of institutions involved is three and there are three kinds of institutions (firm, university, hospital). We assume that the institutional distance is greater in the second paper, as the variety of institutions is greater (even if their number is smaller; neither the number of authors has an influence on the institutional distance).
9
Dummy variables for years and firms may be added: the world of scientific research and publication is rapidly and continuously changing, therefore even a quite limited period may imply systematic changes that could be controlled through year dummy variables; on the other side, the unit of analysis is the single publication and each publication is connected to an Italian biotech firm (at least one author belongs to an Italian biotech firm), but each Italian biotech firm may be connected to one or more publications; as the behaviour about publications of different firms may be systematically different, firm dummy variables may be useful in controlling for these differences.
As the dependent variable can assume only four integer values, from 1 to 4, the ordered probit is the more suitable technique to adopt.
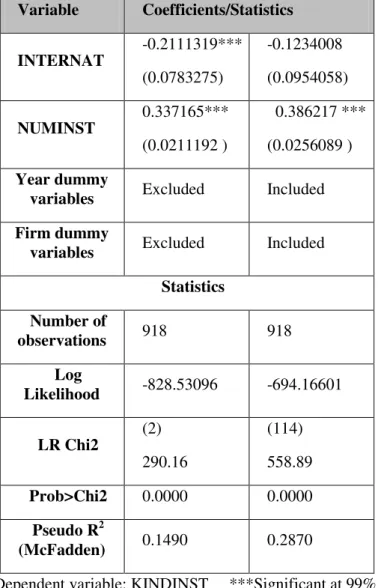
In Table 2 we show the results and the relevant statistics of the ordered probit regression of the restricted model (without dummy variables) and of the extended one (including dummy variables).
Table 2: Results and statistics of ordered probit regression on the determinants of the number of kinds of institutions involved in the co-autorship of a publication
Dependent variable: KINDINST ***Significant at 99%
Variable Coefficients/Statistics INTERNAT -0.2111319*** (0.0783275) -0.1234008 (0.0954058) NUMINST 0.337165*** (0.0211192 ) 0.386217 *** (0.0256089 ) Year dummy
variables Excluded Included Firm dummy
variables Excluded Included Statistics Number of observations 918 918 Log Likelihood -828.53096 -694.16601 LR Chi2 (2) 290.16 (114) 558.89 Prob>Chi2 0.0000 0.0000 Pseudo R2 (McFadden) 0.1490 0.2870
10
The coefficient of INTERNAT is negative. This means that, given the number of institutions involved in each paper, in international papers there are, on average, less typologies of institutions involved than in national paper: when spatial distance increases, institutional distance decreases. But this coefficient, significant at 99% in the restricted model, in the extended model is not significantly different from zero.
We also observe that the relationship between NUMINST and KINDINST is positive and significant in this multivariate analysis too.
The inclusion of firm dummy variables largely increases the goodness of fit of the model, while the increase given by years dummy variables is weak.
The results we obtained, both bivariate and multivariate, show that, even if there are some signals of a negative relationship between spatial and institutional distance, there is no convincing statistical evidence in this sense. As regards the two hypotheses formulated in the theoretical section of the paper, one supposing a negative relationship between spatial and institutional distance, the other supposing a positive relationship, these results are consistent with the coexistence of the two effects, up to the point that the net effect is not clear.
If the two effect coexist, we also hypothesized in the theoretical section that their strength may be different with different scientific relevance and quality of the research projects. Among the low quality papers the negative relationship between spatial and institutional distance should prevail, while a positive relationship should prevail among high quality papers.
Relevance and quality may be measured by the citation received by the publications. Therefore a group of regressions could be run, among differently cited papers. If the hypothesis formulated above is correct, the sign of the coefficient of the variable indicating the spatial nature of the co-autorships (INTERNAT) should increase when the number of citations increases; it should be negative among little cited papers, positive among highly cited papers.
As the number of citations received by a paper tends naturally to increase over time, a good way to conduct this analysis is to take into consideration the papers published in the same year, grouping them according to the number of citations received (the database, including the number of citations, has been built during 2006).
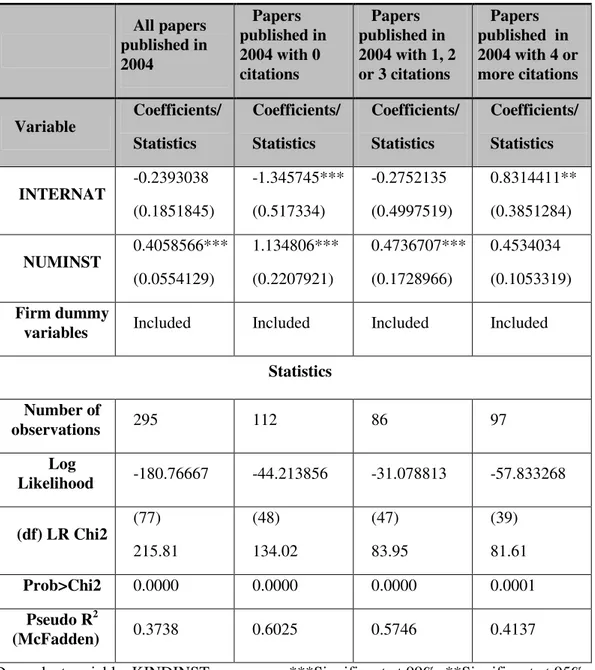
In Table 3 we show the results of the regressions run among the papers published in 2004. We have the results of four regression: the first one among all the papers published in 2004; the second one among papers which had received no citations; the third one among the papers that had received one, two or three citations; the fourth group includes the papers that had received at least four citations (the number of citations is chosen in order that the three sub-groups are of similar consistency).
11
Table 3. Results and statistics of the ordered probit regression on the determinants of the number of kinds of institutions involved in the co-autorship of a publication in three groups of publications
Dependent variable: KINDINST ***Significant at 99%; **Significant at 95%
The results are consistent with the expectations: when the number of citations increases, the coefficient of INTERNAT is progressively increasing, turning from a negative to a positive sign. More precisely, testing the complete models, with year and firm dummy variables, the sign of the variable INTERNAT is negative and significant at 99% among the never cited papers, greater but still negative and not significant at 95% among the little cited papers, positive and significant at 95% among the most cited papers.
All papers published in 2004 Papers published in 2004 with 0 citations Papers published in 2004 with 1, 2 or 3 citations Papers published in 2004 with 4 or more citations Variable Coefficients/ Statistics Coefficients/ Statistics Coefficients/ Statistics Coefficients/ Statistics INTERNAT -0.2393038 (0.1851845) -1.345745*** (0.517334) -0.2752135 (0.4997519) 0.8314411** (0.3851284) NUMINST 0.4058566*** (0.0554129) 1.134806*** (0.2207921) 0.4736707*** (0.1728966) 0.4534034 (0.1053319) Firm dummy
variables Included Included Included Included
Statistics Number of observations 295 112 86 97 Log Likelihood -180.76667 -44.213856 -31.078813 -57.833268 (df) LR Chi2 (77) 215.81 (48) 134.02 (47) 83.95 (39) 81.61 Prob>Chi2 0.0000 0.0000 0.0000 0.0001 Pseudo R2 (McFadden) 0.3738 0.6025 0.5746 0.4137
12
The results, not shown here, are similar if the same kind of regressions are run among the papers published in 2003 or among those published in 20054: the coefficient of INTERNAT shows the same increasing value, turning from negative among the never cited papers to positive among the more cited papers.
We can synthesize the results we obtained in the following way.
The international papers involve more institutions than national papers, but there is no significant difference in the variety of institutions, that we assume as a measure of the institutional distance. Even if the relationship between variety of institution and the geographical nature of the paper is verified in a multivariate context, no clear evidence emerge about it: when spatial distance increase, it can not be excluded that there is, on average, no variation in the institutional distance. It is possible that the two opposite effects, predicted by those we called hypothesis A and hypothesis B, leading to opposite results (respectively: indirect and direct relationship between spatial and institutional distance), coexist.
These conclusions hold considering all the papers together. But, if we distinguish the publications according to the number of received citations (that is an indicator of relevance and quality) we see that among little cited papers, when spatial distance increases, the institutional distance decreases; among highly cited papers the opposite holds: spatial and institutional distance move in the same direction. It is therefore possible to conclude that the effects predicted by the two hypothesis coexist but, when the quality and relevance of the scientific projects increases, the strength of the effect predicted by
hypothesis A decreases and the strength of the effect predicted by hypothesis B increases5.
7. Empirical results: the social network analysis
In order to explore more in depth spatial and institutional distance in the scientific collaboration among universities, research centres, hospitals, Italian life-science for-profit biotech firms and other firms, we decided to look at the structure and properties of their co-authorship relations.
Generally, Social Network Analysis (SNA) focuses on studying relationships among individuals or groups of individuals which represent nodes of the network. Methods for Social Network Analysis applied to co-authorship data give the possibility to examine the knowledge flow throughout a scientific community. These techniques have been used by many authors to investigate the co-authorship networks in different scientific disciplines. Barabasi et al.(2002) and Newman (2004) analysed the structural features and
4
Considering the papers published in 2003, the coefficient of INTERNAT is negative among never cited papers; greater but still negative among papers with 1 to 3 citations; positive among papers with 4 or more citations; these coefficients are never significant at 90%.
Considering the papers published in 2005, the coefficient of INTERNAT is negative and significant at 90% among never cited papers; greater but still negative and not significant at 90% among papers with 1 to 3 citations; positive but not significant at 90% among papers with 4 or more citations.
5
The results of a probit analysis should be interpreted in terms of probability: coefficients measure the probability that, given an increase in the independent variable, the dependent variable increases or decreases. We avoid this terminology for the sake of language simplicity.
13
collaboration patterns of knowledge diffusion among researchers in biology, mathematics and physics. Moody (2004) examined a structurally cohesive core in collaboration networks by testing some models for the sociological co-authorship networks. Goyal et al. (2006) investigated the evolution and the properties of co-authorship relations among economists. De Stefano et al. (2011) analysed how the use of different adjacency matrices can produce a major insight into the author role and position in co-authorship networks in different scientific disciplines.
Before representing the data as a co-authorship network, we used an affiliation matrix Z of size (n × m), where the rows represent the set of institutions and the columns represent the set of publications written by the authors affiliated to the institutions. In this matrix the generic element z(i, j) (i = 1, …, n; j = 1,…, m) equals 1 if the paper j was written by the author affiliated to the institution i and 0 otherwise. From the affiliation matrix Z we derived an adjacency matrix A (n × n ):
A=ZZT .
A is an undirected weighted adjacency matrix. The value of the element a(i,j) represents
the number of co-authored papers for institutions i and j. If two institutions have no publication in common the entries are equal to 0. The diagonal elements represent the total number of publications for each institution and were removed from the matrix A. If we are interested in taking into account only the presence and absence of ties we have to transform the matrix A in an undirected binary adjacency matrix by setting all entries greater than zero to “1”. Because the information about frequency of collaboration is lost by considering the binary adjacency matrix we decided to focus further analysis on weighted adjacency matrix.
In addition to relational information we associated two categorical attributes with each node: institutional type (universities, research centres, hospitals, Italian life-science biotech firms, other firms) and geographical location (Italy, Europe, Extra-Europe).
In order to evaluate if the behaviour of the actors toward the institutional distance is different when geographical scale changes, inside the whole network of co-autorships we considered three sub-networks on a geographical basis. The first network is the national network which includes only Italian institutions (derived from publications written only by Italians). The second one is the international network which represents collaboration among institutions of the papers written by at least one international author. The “pure” international network is the network obtained from the international network by eliminating links among institutions belonging to the same nation.
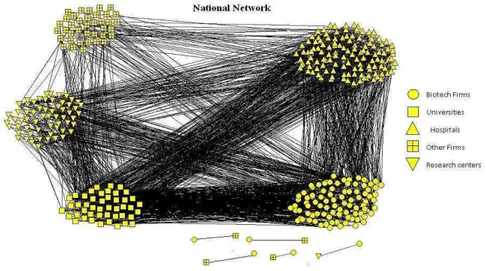
The following figures (Figure1, Figure 2, Figure 3) show the graphs of the three
networks. Different shapes represent the different kinds of institutions (while in the
previous analysis we considered four categories of institutions, in the graphs below
there are five categories, because the Italian biotech firms are distinguished from
the other firms), different colours represent different localizations (in the graphs
there is the distinction between Italian, European and Extra-European institutions,
but in all the analysis we only considered the dichotomization Italy-abroad).
14
Figure 1. National network
15
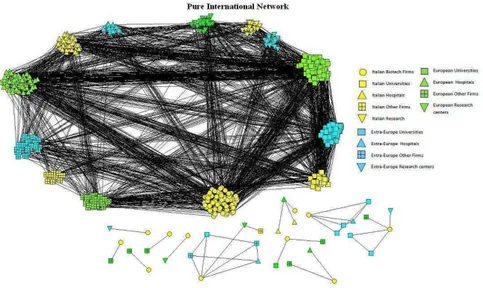
Figure 3. Pure international network
Figure 3. Pure international network
Table 3 shows the basic statistics describing the structural characteristics for the three networks. In the case of valued network the density is calculated as the total of all values divided by the number of possible ties. Respectively for the national network, the international network and the pure international network the density values are 0.034, 0.019 and 0.012. Analysing the connectivity of the actors, we observed that in the national network there are several components, one large of 369 nodes and 5 sub-groups of 2 nodes which have no connection to the largest group. This means that there are some Italian biotech firms which wrote papers only with one institution and did not create their collaboration network. For the international network we notice 10 different components: one very large of 636 nodes, 3 components of 2 nodes, 3 groups of 3 nodes, 2 sub-groups of 5 nodes and 1 component of seven nodes. For the pure international network, respect to the international network, we observed that, by eliminating links among institutions of the same nationality, we derive other two components with 2 nodes, 2 sub-groups of 3 nodes, 1 sub-group of 4 nodes.
In order to analyse the position of the single institutions in terms of their popularity and relational activity, their ability to influence or control communication and the capacity of a node to be reached, we calculated respectively three measures of centrality: degree centrality, betweenness centrality and closeness centrality. We noticed that in the national network the central role belongs to the three universities (Milan, Bologna and Rome) In the international network three different kinds of institutions (the hospital San Raffaele in Milan; the university of Turin; the firm Sigma Tau) show the highest values of degree, betweenness and closeness centrality. In the pure international network the most central roles are played by the hospital San Raffaele in Milan, the firms Sigma Tau and Bracco Imaging and the Leiden, Leuven and Munich. Since technically closeness centrality cannot be computed if the network is not connected, this centrality measure was calculated for the main component of the network.
16
Table 3. Main statistics for the three networks
Number of nodes Number of edges Density (St. Dev) Number of components National Network 379 3694 0,034 (0,26) 6 International Network 668 6158 0,019 (0,2) 10 Pure International Network 668 3784 0,012 (0,16) 12
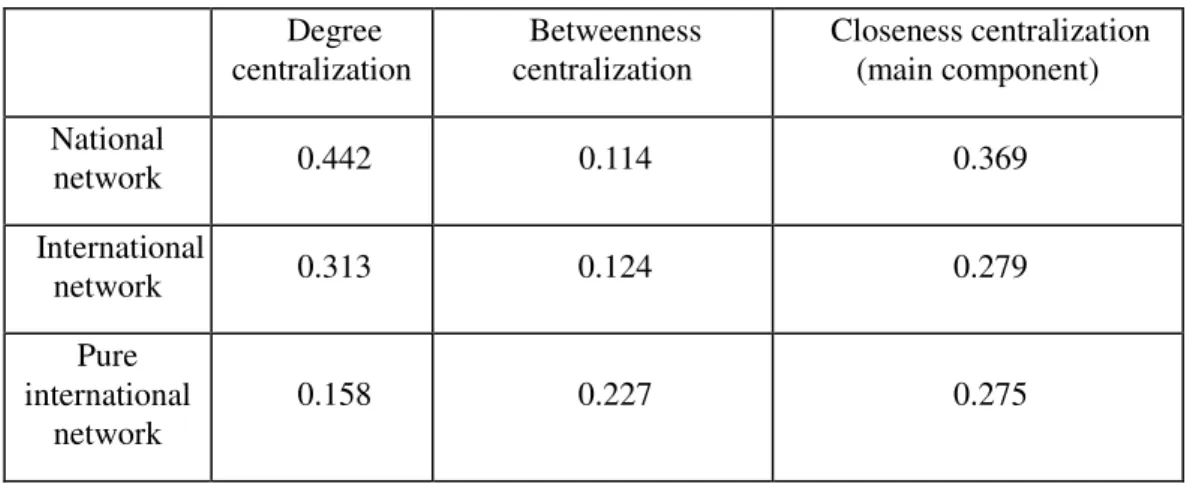
Table 4 illustrates the values of network centralization with regard to the three centrality measures. The values of degree and closeness centralization show that the national network is more concentrated around the most central subjects than the other two networks. With regard to the betweenness centralization the highest value is registered by the pure international network.
Table 4. Centralization indexes for the three valued networks
Degree centralization Betweenness centralization Closeness centralization (main component) National network 0.442 0.114 0.369 International network 0.313 0.124 0.279 Pure international network 0.158 0.227 0.275
In order to investigate our specific issue - the relationship between spatial and institutional distance- we need to analyse if the national network is more or less homogeneous, on the point of view of co-authorship relations among different institutions, than the international networks. In this part of analysis the institutional
17
distance will be seen as the heterogeneity of relations among different institutions in the networks under analysis.
In order to measure which network (national or international) has more homogeneous linkages we focus on the E-I index proposed by Krackhardt and Stern (1988). This index measures the relative homophily of a group while comparing the numbers of ties within groups and between groups and it is defined by :
E-I index = (E-I) / (E+I)
where E (External) is the number of external ties (ties between nodes belonging to different groups); I (Internal) is the number of internal ties (ties between nodes belonging to the same group). The E-I index can be applied at three levels: the entire population, each group, and each individual. It ranges from -1 (all ties are internal,
E=0) to +1 (all ties are external, I=0).
In our case the groups are the four kinds of institutions. A co-autorship relation between two firms indicates a collaboration within the same group, therefore it is an internal link; a co-autorship relation between a firm and an university is a collaboration between two different groups, therefore it is an external link. The value of E-I index is a measure of the mean propensity of each institutional actor to collaborate with a “different” actor rather than with a similar one.
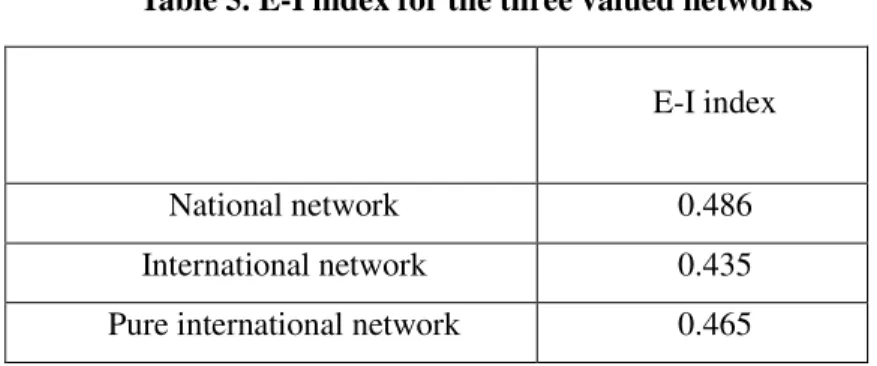
As we decided not to loose the information about the number of publications two institutions wrote together, we proposed to calculate the E-I index taking weights of ties into account. In this case the values of E (External) and I (Internal) are obtained by summing the tie strengths instead of the number of respective ties. In our opinion it is important to save the values on the edges while calculating the E-I index because they influence the final result and interpretation of this index. Table 5 shows the values of the E-I index for the three valued networks.
If, according to the hypothesis A, in the international collaborations the institutional distance decreases, therefore the links are more homogeneous than in the national networks, the E-I index should be smaller in the international network than in the national one. The opposite according to the hypothesis B.
We observe a small decrease in the value of the index moving from the national to the international network (comparing national and pure international network the difference is even smaller). This result is consistent with the prevalence of the
hypothesis A which states that more spatial distance results in less institutional distance and vice versa.
18
Table 5. E-I index for the three valued networks
E-I index
National network 0.486
International network 0.435
Pure international network 0.465
If we want to compare this analysis with that developed in section 6, we have to observe that data are investigated from a different point of view. In the previous analysis the institutional distance has been seen as the variety of institutions co-authoring a paper; here we focus on the relations among different institutions in their co-authorship network and the institutional distance is seen as the heterogeneity of linkages.
A weakness of the analysis based on the E-I index is the lack of multivariate considerations. Nevertheless, through the network analysis, it is possible to observe, in a quite easy and synthetic way, an important aspect: the relationship between spatial and institutional distance in collaboration networks of different kinds of institutions . For this purpose we calculated the value of the E-I index for each institution, then we calculated the mean value for each kind of institution: results are shown in Table 6.
We observe that firms, universities and research centres have a lower E-I index in the international networks than in the national network. It means that, when physical distance increases, the collaborations become more homogeneous, that is the institutional distance reduces. On the contrary, for hospitals we notice an higher E-I index in the international network. It means that, when spatial distance increases, the collaborations become more heterogeneous and the institutional distance increases too.
Table 6: E-I index for each kind of institution
National network International network Pure international network Firms 0.789 0.448 0.384 Universities 0.353 0.236 0.215 Research centres 0.831 0.707 0.698 Hospitals 0.083 0.185 0.250
Therefore the direction of the relationship between spatial and institutional distance is different for different kinds of institutions. This may be due to the fact that different institutions have different objectives and attitudes.
19
Universities and research centres often base their research networks on personal knowledge: on a local basis it is easy to contact people belonging to different institutions; in a broader spatial context, it is common to meet people belonging to universities in conferences et similia, while it is more difficult to meet people belonging to other institutions.
Italian biotech firms are often sections of multinational companies: the collaboration with the headquarter and the other sections, both located abroad, is more frequent than the collaboration with other Italian firms; therefore the homogeneous collaborations are more frequent on an international than on a national scale.
For hospitals, it particularly holds what the hypothesis B predicts: having the
solution of practical health problems as their main goal, they find the competencies
“wherever they are” and “whoever they belong to”.
8. Conclusions
In this paper we analyse the co-authoring networks in the scientific publications of the firms belonging to the Italian biotech sector, in order to understand the relation existing between spatial and institutional distance.
Two hypotheses are formulated: according to a “resource based” theory, as both kinds of distance are a cost, a trade-off among them exist, therefore when spatial distance increases, institutional distance decreases. According to a “competence based” theory it is possible to suppose that highly specialised competencies are very dispersed, on a geographic and institutional point of view, therefore a firm that needs on-the-frontier knowledge activates an international and heterogeneous network of collaboration; if the required knowledge is more ordinary, a local and homogeneous network is activated; according to this view an increase in spatial distance goes together with an increase in institutional distance.
Using the regression analysis and the social network analysis, particularly through the E-I index, we can conclude that both analyses do not evidence a univocal relationship between spatial and institutional distance; this may be consistent with the coexistence of the two effect described before.
On the other side, analysing disaggregated data, according to the quality/relevance of publications (measured by the citations received by each paper) and to the “institutional” level, we obtain more articulated results. In fact, we observe that the direction of the relationship between the two kinds of distance changes when the quality/relevance of publications increases: among little cited papers, when spatial distance increases, institutional distance decreases; among more cited papers the opposite holds; this does not contradict the coexistence of the two effects, but it is possible to assume that they have different strength according to the quality/relevance of the papers. The institutional-level analysis shows a different behaviour for different institutions: for hospitals, when spatial distance increases, institutional distance increases too; for firms, universities and research centres the opposite holds.
On a methodological point of view, this paper shows the utility to treat a research issue with different analytical tools and under different perspectives, that may let to capture
20
different aspects of the problems. Under the point of view of new contents, this kind of analysis may shed more light on the way knowledge flows in an innovative sector and should be taken into consideration by the policy maker that aims to promote research collaboration between different institutions: a careful consideration of the role played by different kinds of distance and of the behaviour of different institutions in managing the proximity issue may be useful in designing proper policy measures in a field that is so important for the competitiveness in the contemporary knowledge-based economy.
References
Arundel A., Geuna A. (2004): “Proximity and the Use of Public Science by Innovative European Firms”, Economics of Innovation and New Technology, 13(6), 559-580.
Autant-Bernard C., Billand P., Frachisse D., Massard N. (2007): “Social Distance versus Spatial Distance in R&D Cooperation: Empirical Evidence from European Collaboration Choices in Micro and Nanotechnologies”, Papers in regional Science, 86, 495-520.
Barabasi A., Jeong H., Neda Z., Ravasz E., Schubert A., Vicsek T. (2002): “Evolution of the social network of scientific collaborations”, Physica A 311(3-4), 590–614
Bonaccorsi A., Thoma G. (2007): “Institutional complementarity and inventive performance in nanotechnology”, Research Policy, 36(6), 251-283.
Boschma R. (2005): “Proximity and Innovation: a Critical Assessment, Regional
Studies, 39(1), 61-74.
Broström A. (2010): “Working with Distant Researchers-Distance and Content in university-industry interaction”, Research Policy 39(10), 1311-1320.
D’Amore R., Iorio R., Stawinoga A. (2010): “The Role of Institutions and Firm Characteristics in the Network of Firm Publications. An analysis of the Italian Biotech Sector through the Social Network Analysis”, World Journal of Management 2(3), 81-100.
Dasgupta P., David P. (1994): “Toward a New Economics of Science”, Research
Policy, 23(5), 487-521.
DeSolla Price D. (1984): “The Science/Technology Relationship, the Craft of Experimental Science, and Policy for the Improvement of High Technology Innovation”, Research Policy, 13(1), 3-20.
De Stefano D., Giordano G., Vitale M. (2011): “Issues in the analysis of co-authorship networks”, Quality & Quantity, 45(5), 1091-1107.
Gittelman M. (2005): “What makes research socially useful? Complementarities between in-house research and firm-university collaboration in biotechnology”, Revue
21
Gittelman M., Kogut B. (2003): “Does Good Science Lead to Valuable Knowledge? Biotechnology Firms and the Evolutionary Logic of Citations Patterns”, Management
Science, 49(4), 366-382.
Goyal, S., Van der Leij, M.J., Moraga-Gonzalez, J.L. (2006): ”Economics: An Emerging Small World”, Journal of Political Economy, 114, 403–412.
Iorio R., Labory S., Paci D. (2012): “The Research Collaboration and Publication’s Citation Impact: Evidence in the Italian Biotech Sector”, Rivista Italiana degli
Economisti, 18(1), 75-100.
Katz J. (1994): “Geographical Proximity and Scientific Collaboration”,
Scientometrics, 31(1), 31-43.
Krackhardt D., Stern N. (1988): “Informal Networks and Organizational Crisis: An Experimental Simulation”, Social Psychology Quarterly, 51(2), 123-140.
Liang L., Zhu L. (2002): “Major Factors Affecting China’s Inter-Regional Research Collaboration: Regional Scientific Productivity and Geographical Proximity”,
Scientometrics, 55(2), 287-316.
McKelvey M., Alm H., Riccaboni M. (2003): “Does Co-location Matter for Formal Knowledge Collaboration in the Swedish Biotechnological-Pharmaceutical Sector?”.
Research Policy 32(3), 483-501.
Moody, J. (2004): “The Structure of a Social Science: Disciplinary Cohesion from 1963 to 1999”, American Sociological Review, 69, 213-238.
Murray F., Stern S. (2007): “Do Formal Intellectual Property Rights Hinder the Free Flow of Scientific Knowledge? An Empirical Test of the Anti-Commons Hypothesis”
Journal of Economic Behaviour and Organization, 63(4), 648-687.
Newman, M.E.J. (2004): “Coauthorship networks and patters of scientific
collaboration”, Proceedings of the National Academy of Sciences, 101, 5200–5205. OECD (1996): The Knowledge-Based Economy, Paris.
Pavitt K. (1984): “Sectoral Patterns of Technical Change: Towards a Taxonomy and a Theory”, Research Policy, 13(6), 343-373.
Ponds R., van Oort F., Frenken K. (2007): “The Geographical and Institutional Proximity of Scientific Collaboration Networks”, Papers in Regional Science 86(3), 423-443.
Powell W., Koput K., Smith-Doerr L. (1996): “Interorganizational Collaboration and the Locus of Innovation: Networks of Learning in Biotechnology”, Administrative
Science Quarterly 41, 116-145.
Scherngell T., Barber M. (2009): “Spatial Interaction Modelling of Cross-regions R&D Collaborations: Empirical Evidence from the 5th EU Framework Programme”,
22
Scherngell T., Barber M. (2011): “Distinct Spatial Characteristics of Industrial and Public Research Collaborations: Evidence from the Fifth EU Framework Programme”,