Structure and pattern of food consumption in Italian
household: an analysis of impact on climate change
and land use
Alessandro K. Cerutti1,3*, Serenella Sala1, Antonella Pietta2,3, Michela Secchi1 1 European Commission, Joint Research Centre – Directorate Sustainable Resources,
Bio-Economy Unit
2 Department of Economics and management, University of Brescia, Italy 3 Interdisciplinary Research Institute on Sustainability (IRIS), Italy
Email*: [email protected]
Abstract
The environmental impacts of food consumption of Italian households in 2011 have been calculated adopting an Environmentally Extended Input-Output Analysis, using EXIOBASE v3 as the underpinning database for the assessment. Because of the structure of such database, it is possible to divide domestic and imported final demand. Climate change and Land use related impacts are calculated then matched with household expenditures for the same year. The food consumption in an average Italian household for 2011 results in a total Climate change of 4237 kg CO2eq and in a total Land use impact of 10 kg Cdeficit. There are limitations due to a non-perfect
match of food product groups in EXIOBASE and Italian National Statistics. Nevertheless, with this approach it is possible to investigate environmental impacts in relation to expenditure patterns of the families.
1. Introduction
Food consumption plays an important role in household’s environmental burden. Nevertheless, the relative weight of food consumption in comparison to other aspects of household (such as mobility and shelter) varies a lot on the base of the environmental indicator considered. According to a recent assessment at the level of impact associated to an average European citizen (Huysman et al., 2016), food consumption contributes to 9% of the total Climate change (compared with 29% related to services and 27% related to mobility), but it contributes to 54% of the Land use (compared with 23% related to services and 14% related to goods). These differences are clearly related to the characteristics of food production systems, which are connected to the consumption of land more than other goods and services, which are, on the contrary, more related to energy consumption. Indeed, according to literature (Hertwich, 2011) food is responsible for a range of 11-19% of the energy consumed at the household level, which is significantly lower than mobility, 35-53% of total energy use.
Similar share of impacts are reported for Italy by Cellura et al. (2011) according to whom the highest share on the indirect energy consumption in Italian households comes from the products of tertiary sector (31%), and the food and
beverage sector accounts for 8.5%.
analysis - EEIOA), the former focusing on production processes and the latter on community’s macroeconomic dimensions (Pairotti et al., 2015). Both approaches have their strength and limitations (for a description of the pro and con of each approach applied to consumption see Huysman et al., 2016). One of the most relevant advantage of using an EEIOA approach is the potentiality to better capture impacts related to trade (Tukker and Diezenbacher, 2013) and to services, which are usually not included or below the cut off of process LCAs. In particular, when the EEIOA is based on multiregional input-output tables, it is possible to differentiate environmental impacts that occurs in the country where the consumption takes place and the impacts that take place outside such country due to trade (Ivanova et al., 2015). From a consumption-oriented perspective, it is important to note that impacts are related to the country that consumes a certain good, not the one that produces it (unless it is the same country). As a consequence, life cycle impacts of consumption can be described as ‘domestic’ when the good consumed is produced in the same country and ‘imported’ when the good is produced in a different country. It is interesting to highlight that different countries have a very different share of impact due to domestic and import according to the structure of their economy. For example, according to Ivanova et al. (2015) the carbon footprint of Switzerland households is for around 63% related to import, whether for Chinese households the share of carbon footprint related to import is less than 10%.
In Italy, there have been some applications of different versions of the EEIOA approach, but very few of them are focusing on the household level. Cellura et al., (2011) calculated the energy and environmental impacts of Italian households in the period 1999-2006 using IO tables environmentally extended through NAMEA (National Accounting Matrix including Environmental Accounts). In their study more oriented to food consumption and diets, Pairotti et al. (2015) calculated the carbon footprint of the average food consumption in Italian households, in comparison with a Mediterranean and a vegetarian diet. In this study, a hybrid LCA-IO was applied, considering reference food products per food category and implementing IOA elements in their LCA.
In this contribution, Italy is chosen as an example for a more general discussion of strengths and weaknesses of matching EEIOA and family expenditure data applied at the country level. Therefore, this contribution aims at: (I) evaluating if the considered method and database is suitable for this purpose, (II) highlight limitations using the available database and (III) make a preliminary assessment of the impacts from the climate change and the land use viewpoints in relation to the structure of Italian households.
2. Materials and methods
The impacts associated to consumption structure and patterns are calculated using EEIOA complemented with EXIOBASEv3 for the inventory and the ILCD recommended method (EC-JRC, 2011) for the characterisation of the impacts (here, focusing on climate change and land use only).
2.1. The Input-Output approach
The EEIOA builds on economic input output tables (Leontief, 1936) which are complemented with environmental extensions, i.e. a list of elementary flows referring to emissions and resource consumption, so to attribute them from the production stages to final demand, in a consistent framework (Wiedmann 2009). According to this method, the monetary flows across sectors of the economy and between sectors and final consumers are used as proxies for the allocation of indirect environmental burdens of final consumption.
For this assessment, the EEIOA is completed by using the EXIOBASE v3 database, a multi-regional input output table with focus on the EU. The database
is the result of a series of EU funded research projects1 and it addresses the EU
production and consumption, including impacts that happens outside EU, as it covers 44 countries + 5 Rest of the World regions, and 200 sectors x 163 products (Wood et al., 2015). In this study, Just Climate change and Land use impacts are considered as exemplary of the results that can be achieved. Impacts are calculated referring to the year 2011, in the two components of domestic and import, for 25 reference food groups of EXIOBASE (then grouped again in 8 general groups in this study) that cover the full spectrum of food consumption in Italian households. The environmental extensions of consumption considered in this study are taken from Schmidt (2017).
2.2. Combining expenditure data and Input-Output model
The approach of matching results from IO models with household expenditure data is well described in several researches (for a list of papers applying this approach see Steen-Olsen et al., 2016). These researches are mainly focused on pointing out correlations between environmental burdens related to consumption practices and explanatory variables such as income, age and household size (Steen-Olsen et al., 2016).
In this study, expenditure data were extracted from the Italian National Institute of Statistics (ISTAT) with reference to the year 2011 in order to be coherent with the result of the EXIOBASE v3 model. Data are expressed in terms of average monthly expenditure per family structure and per number of family components. In order to match environmental impacts with household expenditures, a concordance matrix linking each ISTAT product group to one or more EXIOBASE reference product was constructed on the base of the NACE codes (Statistical classification of economic activities in the European Community). In some cases, it was not possible to establish a 1-to-1 connection, for example the Italian item
of cured meat2 refers to products that can be found in the EXIOBASE categories
of .Animal products nec, Products of meat pigs and Meat products nec. Another example is the beverages group in EXIOBASE, which refers to some products in the ISTAT categories of wine, beers, mineral waters and beverages nec. Hence,
a two-steps procedure was adopted following the approach described in Steen-Olsen et al. (2016). In particular: (I) firstly, a scaling factor was assigned to ISTAT products groups that refer to more than one EXIOBASE products according to their relative presence in the Italian market; then, (II) all partial contributions for each EXIOBASE product were scaled in order to have their sum equal to 1 and so to consider the full impact of that product.
As a result of this approach, a concordance matrix is obtained and Climate change and Land use from EXIOBASE are then transposed into ISTAT product group keeping the same grand total. By dividing the impacts of each product group for the total expenditure in that group for 2011 it is possible to obtain the
emission factors expressed as kg CO2eq/€ for Climate change and kg Cdeficit/€ for
Land use.
3. Results and discussion
Several kind of results can be drawn matching EEIAO and expenditure data: (I) the resulting emission factors for food group; (II) the impacts per family on the chosen impact category and (III) the impacts in relation to the family structure.
3.1. Emission factors
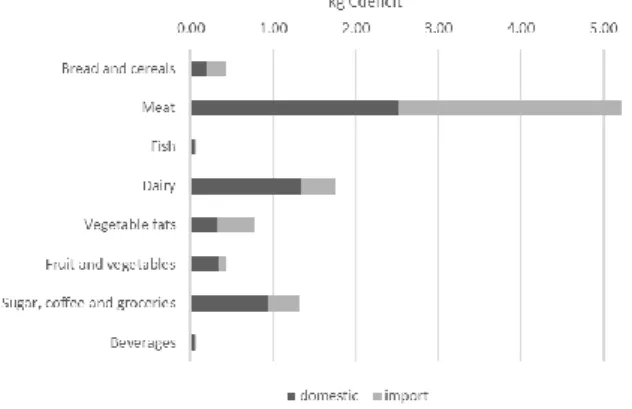
In Table 1, the calculated emission factors are reported for general ISTAT product groups, in their two components of domestic and import.
Table 1: Average emission factors for Climate change and Land use for main food groups.
Climate change Land use
kg CO2eq / € kg Cdeficit / € Domestic component Import component Domestic component Import component
Bread and cereals 0.05 0.06 2.58E-04 2.91E-04
Meat 0.57 0.94 1.64E-03 2.11E-03
Fish 0.53 0.16 1.21E-04 1.02E-05
Dairy 1.01 0.27 2.60E-03 5.03E-04
Vegetable oils and fats 0.50 0.44 1.83E-03 4.06E-03
Fruit and vegetables 0.09 0.03 3.24E-04 1.05E-04
Sugar, coffee and groceries 1.02 0.64 2.06E-03 1.03E-03
Beverages 0.22 0.05 1.21E-04 2.87E-05
Differences in emission factors for domestic and imported products of the same food group are related to three main issues: (I) significant differences in the price of the product between Italy and other countries; (II) different production practices which result in different emissions for the same food type; (III) different share of products within the same category (e.g. the vegetable fats group contains both olive oil and other fats, but the domestic component is dominated by olive oil and the imported component is almost entirely constituted by other fats which have a significant higher impact per € in Land use). It is important to note that with a top-down approach is more difficult to catch the origin of this differences as it would have been using a bottom-up approach in which, using a process based Life Cycle Assessment, all the three issues described are explicit in the model.
3.2. Climate change
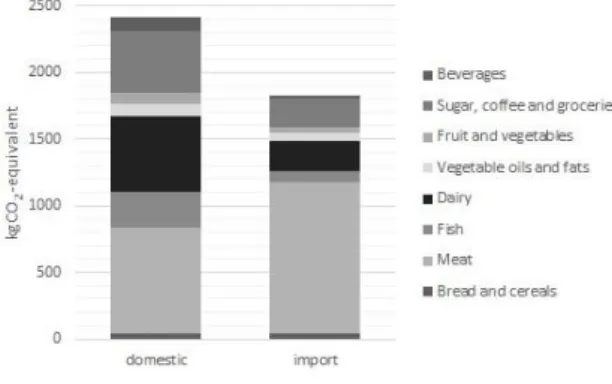
The food consumption in an average Italian household for 2011 results in a total
Climate change of 4237 kg CO2eq, 57% of which due to food produced in Italy
and 43% to food produced abroad. The breakdown of Climate change by main food groups is presented in Figure 1. As reported in several studies (reported in Garnett, 2009), meat is the most contributing food category (45% of the total Climate change) with the two main components of bovine meat (23% of the total Climate change) and pork meat (11% of the total Climate change). Dairy is the second main contributor to Climate change (19% of the total impact), followed by the variegated group of sugar, coffee and groceries which covers about 16% of the total Climate change. The big impact related to this last group is due to the
occurrence of elevated emissions per € and the high expenditure in Italian
household for these products. The product breakdown is interesting also when comparing the domestic and the imported components of Climate Change (Figure 2). In both cases, meat is the dominant food group, but it is interesting to note that it contributes to more than the half of the imported component of Climate change and it is the only food group in which the emissions from imported products are higher than emissions from domestic consumption.
Figure 1: Climate change of food consumption in an average Italian household in 2011 for main food groups.
Figure 2: Comparison of the domestic and imported components of Climate change for food consumption in an average Italian household in 2011.
3.3. Land use impacts
The food consumption in an average Italian household for 2011 results in a total
Land use impact of 10 kg Cdeficit, 56% of which due to food produced in Italy and
44% from food produced abroad. The breakdown of Land use by main food groups is presented in Figure 3. Also in this case, meat is the most contributing food category, but with a larger share (52% of the total Land use). Bovine meat alone covers 32% of the total Land use, followed by pork meat (10% of the total Land use). It is interesting to note that the contribution due to impacts of food groups less related to land consumption drop significantly in comparison with Climate change, e.g. fish accounts for 1% of Land use impact compared to 8%
consumption significantly increase their impacts, e.g. bread and cereals contribute for 5% of Land use compared to 2% of Climate change. The comparison between domestic and imported components (Figure 4) shows that imported meat plays a dominant role (around 63%) in the imported fraction of Land use. The contribution of vegetable fats increases as well in the imported component because of the different main product (i.e. olive oil in the domestic component and other fats in the imported component).
Figure 3: Land use related impact of food consumption in an average Italian household in 2011 for main food groups.
Figure 4: Comparison of the domestic and imported components of Land use related impacts for food consumption in an average Italian household in 2011.
3.4. Impacts in relation to the expenditure structure
Besides the analysis of the contribution of different food categories to the total impact of Climate change and Land use, it is interesting to study the breakdown of the impacts in relation to some household parameters. Although impacts are different in magnitude, trends are similar for both Climate change and Land use because of the same expenditure structure. Hence, in this section just the impact on Climate change is presented.
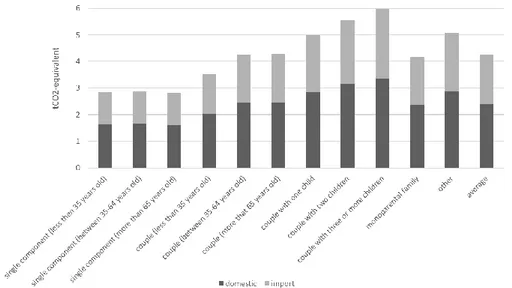
The Climate change for an average household for several family structures is presented in Figure 5, whereas in Figure 6 per capita figures are reported. Families with the higher number of components have a higher Climate change, while their emissions per capita are lower compared to families with just one component.
Figure 5: Climate change of different family structures in Italy for 2011 and the general average.
This result highlights a potential increase of per capita impacts due to the strong trend of having more and more single-component families in Italy, in fact if in 1971 single-person families in Italy were 12.9% in 2015 they were 31.1% of the families (ISTAT, 2016). Emissions from young couples are lower than couples that are more than 35 years old, but this could be related to expenditure capabilities. The share of domestic and import impacts is almost constant as an effect of very limited shift of food consumption components for different family structures.
Figure 6: Per capita Climate change of different family structures in Italy for 2011 and the general average.
4. Conclusions and limitations
Among other aspects, results show clearly that a significant share of the indirect impacts (43-44%) takes place abroad and that families with three or more components are able to save from 40% to 52% of the impacts. Nevertheless there are a lot of issues that should be improved in relation to both the database chosen and the top-down approach itself.
In relation to the use of EXIOBASE, it is important to underline that some food groups might suffer for a very low granularity of the assessment because of a non-perfect match of EXIOBASE and ISTAT products. For instance, in EXIOBASE all beverages are collected in a single product group whereas in ISTAT there are four groups (water, wine, beer and other) with very different impacts.
EXIOBASE still suffers the loss of information on product specifications, as usual in a top-down approach associated to household expenditure (Kerkhof et al., 2009). For example, it is not possible to differentiate impacts of organic products from other products. Therefore, the model is suitable for the assessment of different diets or food consumption patterns if assuming just a shift in relative shares of consumption and not a shift in production properties and agricultural techniques.
Concerning the impact categories considered, it is evident that Land use indicator strongly stresses the impacts due to land related foods (such as vegetables, fruits
and – consequently - bovine meat). On the other hand, Climate change
emphasizes the impact of food with a longer supply chain or for which a more intense processing is needed.
5. References
Cellura, M, Longo, S, & Mistretta, M, 2011. The energy and environmental impacts of Italian households consumptions: an input–output approach. Renewable and Sustainable Energy Reviews, 15(8), 3897-3908.
EC-JRC, 2011. Recommendations based on existing environmental impact assessment models and factors for life cycle assessment in European context. Luxembourg: Publications Office of the European Union. EUR24571EN. ISBN 978-92-79- 17451–3. Available at http://eplca.jrc.ec.europa.eu/ Garnett T, 2009 Livestock-related greenhouse gas emissions: impacts and options for policy makers. Envrion Sci Policy 12(4):491–503
Hertwich, EG, (2011). "The life cycle environmental impacts of consumption." Economic Systems Research 23: 27-47.
Huysman, S, Schaubroeck, T, Goralczyk, M, Schmidt, J, & Dewulf, J, 2016. Quantifying the environmental impacts of a European citizen through a macro-economic approach, a focus on climate change and resource consumption. Journal of Cleaner Production, 124, 217-225.
Ivanova, D, Stadler, K, Steen‐Olsen, K, Wood, R, Vita, G, Tukker, A, & Hertwich, EG, 2015. Environmental impact assessment of household consumption. Journal of Industrial Ecology.
ISTAT, 2016. Annuario Statistico Italiano. Technical report of the Italian National Institute of Statistic. Available at http://www.istat.it/it/files/2016/12/Asi-2016.pdf
Kerkhof, AC, Nonhebel, S, & Moll, HC, 2009. Relating the environmental impact of consumption to household expenditures: an input–output analysis. Ecological Economics, 68(4), 1160-1170.
Leontief, W, 1936. Quantitative input and output relations in the economic systems of the United States. Rev. Econ. Stat. 18, 105-125.
Milà i Canals, L, Bauer, C, Depestele, J, Dubreuil, A, Freiermuth Knuchel, R, Gaillard, G, Michelsen, O, Müller-Wenk, R, Rydgren B, 2007. Key elements in a framework for land use impact assessment within LCA. Int J LCA 12:5-15
Pauliuk, S, Deetman, S, Kleijn, R, 2014. Interim report on data sources and the link of the SFA model to the EE IO framework – Deliverable 6.2. [http://fp7desire.eu/documents/category/3- finaldeliverables?download=8:d6-2-interim-report-on-data-sources-and-the-link-of-the-sfa-model-tothe-ee-io-framework] accessed on May 2016
Schmidt, J, 2017. Extraction, processing support and contribution to interpretation of data from the multi-regional input-output (MRIOT). 2.-0 LCA consultants, Aalborg, Denmark. JRC contract C393250 Steen‐Olsen, K, Wood, R, & Hertwich, EG, 2016. The carbon footprint of Norwegian household consumption 1999–2012. Journal of Industrial Ecology, 20(3), 582-592.
Tukker, A, & Dietzenbacher, E, 2013. Global multiregional input–output frameworks: an introduction and outlook. Economic Systems Research, 25(1), 1-19.
Wiedmann T, 2009. A review of recent multi-region input–output models used for consumption based emission and resource accounting. Ecol. Econ. 69, 211-222.
Wood, R, Stadler, K, Bulavskaya, T, Lutter, S, Giljum, S, de Koning, A, & Simas, M, 2014. Global sustainability accounting—developing EXIOBASE for multi-regional footprint analysis. Sustainability, 7(1), 138-163.