This content has been downloaded from IOPscience. Please scroll down to see the full text.
Download details:
IP Address: 192.167.23.210
This content was downloaded on 08/09/2016 at 14:52
Please note that terms and conditions apply.
You may also be interested in:
Performance of the CMS drift tube chambers with cosmic rays CMS Collaboration
Performance of the CMS Level-1 trigger during commissioning with cosmic ray muons and LHC beams CMS Collaboration
Precise mapping of the magnetic field in the CMS barrel yoke using cosmic rays CMS Collaboration
Performance of the CMS drift-tube chamber local trigger with cosmic rays CMS Collaboration
Aligning the CMS muon chambers with the muon alignment system during an extended cosmic ray run CMS Collaboration
Performance of the CMS cathode strip chambers with cosmic rays
Performance of CMS muon reconstruction in cosmic-ray events
View the table of contents for this issue, or go to the journal homepage for more 2010 JINST 5 T03022
(http://iopscience.iop.org/1748-0221/5/03/T03022)
2010 JINST 5 T03022
PUBLISHED BYIOP PUBLISHING FORSISSA
RECEIVED: November 30, 2009 REVISED: January 29, 2010 ACCEPTED: February 13, 2010 PUBLISHED: March 19, 2010
COMMISSIONING OF THECMS EXPERIMENT WITHCOSMIC RAYS
Performance of CMS muon reconstruction in
cosmic-ray events
CMS Collaboration
ABSTRACT: The performance of muon reconstruction in CMS is evaluated using a large data sam-ple of cosmic-ray muons recorded in 2008. Efficiencies of various high-level trigger, identification, and reconstruction algorithms have been measured for a broad range of muon momenta, and were found to be in good agreement with expectations from Monte Carlo simulation. The relative mo-mentum resolution for muons crossing the barrel part of the detector is better than 1% at 10 GeV/c and is about 8% at 500 GeV/c, the latter being only a factor of two worse than expected with ideal alignment conditions. Muon charge misassignment ranges from less than 0.01% at 10 GeV/c to about 1% at 500 GeV/c.
KEYWORDS: Muon spectrometers; Large detector systems for particle and astroparticle physics
2010 JINST 5 T03022
Contents
1 Introduction 1
2 Cosmic muons in CRAFT: data selection and event simulation 2
3 Muon reconstruction and identification algorithms in CRAFT 3
3.1 Standalone muon reconstruction 3
3.2 Global muon reconstruction 4
3.3 Muon reconstruction refinements 5
3.4 Muon identification 6
4 General comparisons between data and simulation 7
4.1 Kinematic properties of cosmic muons 7
4.2 Basic distributions for standalone and global muons 9
4.3 Basic distributions for tracker muons 9
5 Reconstruction and identification efficiency 15
5.1 Efficiency measurements with tracks in opposite detector hemispheres 15
5.2 Measurements of standalone-muon efficiency with tracker tracks 17
6 Momentum and angular resolutions 19
7 Charge assignment 25
8 Performance of the muon high-level trigger 26
8.1 Level-2 muon reconstruction 26
8.2 Level-3 muon reconstruction 28
9 Conclusion 29
The CMS collaboration 32
1 Introduction
The primary goal of the Compact Muon Solenoid (CMS) experiment [1] is to explore particle physics at the TeV energy scale, by exploiting the proton-proton collisions delivered by the Large Hadron Collider (LHC) [2]. During October-November 2008, the CMS Collaboration conducted a month-long data-taking exercise known as the Cosmic Run At Four Tesla (CRAFT). The main goals of CRAFT were to test in situ the CMS magnet at the nominal current and to commission the experiment for extended operation [3]. These goals were met successfully, and a dataset of 270
2010 JINST 5 T03022
million cosmic-ray events was recorded with the solenoid at an axial field of 3.8 T and with allinstalled detector systems participating in taking data.
This paper describes studies of the muon reconstruction performance carried out using a data-set of muons collected during CRAFT. The muon system performs three main tasks: triggering on muons, identifying muons, and assisting the CMS tracker in measuring the momentum and charge of high-pT muons. Four stations of muon detectors are embedded in the steel yoke of the
superconducting solenoid, covering the pseudorapidity region |η| < 2.4. Each station consists of several layers of drift tubes (DT) in the region |η| < 1.2 and cathode strip chambers (CSC) in the |η| interval between 0.9 and 2.4. The region |η| < 0.8 is covered by the DT chambers in all 4 stations and is referred to as the barrel region. In the region |η| < 1.6, the DT and CSC subsystems are complemented by resistive plate chambers (RPC). A detailed description of the CMS muon system can be found elsewhere [1].
The CMS experiment has a two-level trigger system consisting of the hardware-based Level-1 Trigger and the software-based High-Level Trigger (HLT). During CRAFT, the Level-Level-1 trigger was configured to yield maximum efficiency for cosmic muons [4], while the HLT was primarily in ”pass-through” mode, transferring to storage the events accepted by the Level-1 trigger without additional processing or selection [5].
Studies of the performance of the individual muon subsystems carried out on CRAFT data, as well as of the Level-1 muon trigger, are described in refs. [4,6–9]. This paper focuses on the results related to the tasks of muon identification and reconstruction for high-level trigger and physics analysis. Initial event selection and Monte Carlo (MC) simulation are summarized in section 2. Section3 describes muon reconstruction and identification algorithms. Data-simulation compar-isons of distributions of the main kinematic variables of cosmic muons and of several other basic quantities are shown in section4. Section5summarizes results obtained for muon reconstruction and identification efficiencies. Section6describes studies of muon momentum and angular reso-lutions. Section7is dedicated to the measurement of the muon charge. Performance of the muon high-level trigger is discussed in section8.
2 Cosmic muons in CRAFT: data selection and event simulation
In order to compare CRAFT data with the predictions obtained from simulations, a large sample of cosmic-muon events was generated using the CMSCGEN package [10, 11]. This generator includes a detailed description of the CMS access shafts and other surroundings (composition of material above the cavern, geometry of the service cavern, etc.) and reproduces correctly angular and momentum distributions of cosmic-ray muons in the CMS cavern (see section 4.1). The de-tector response to the cosmic muons was simulated with the standard CMS software based on the GEANT4 package [12].
The reconstruction of both CRAFT data and simulated cosmic-muon events was performed with the CMS full-reconstruction CMSSW package [13]. Modifications of the standard reconstruc-tion code necessary for efficient reconstrucreconstruc-tion of cosmic-muon events are summarized in ref. [14]. Tracker and muon reconstruction algorithms used in the processing of the samples are described in the next section. An improved description of the magnetic field in the muon system [15], as well as
2010 JINST 5 T03022
a CRAFT-based alignment for the silicon tracker [16] and for the muon chambers [17] were usedas input for the reconstruction.
To facilitate studies performed by various analysis groups, several subsets of CRAFT data and corresponding Monte Carlo events were produced according to different selection criteria [14]. Unless explicitly stated, the analyses described in this paper used the “super-pointing” dataset designed to contain muons similar to those expected from collisions at the LHC. It was formed by requiring that there be at least one track reconstructed in the tracker or in the muon system that crosses a cylindrical volume of 10 cm radius and 100 cm length along the beam line centered at the nominal interaction point, roughly corresponding to the outer boundaries of the pixel detector. The total number of events in good-quality runs in this dataset was about 500 000. In a few cases mentioned below, the “tracker-pointing” dataset formed by less stringent selection criteria was used instead: it contained events with any track reconstructed in the tracker, or at least one track in the muon system crossing the outer boundaries of the tracker barrel, which is approximated by a cylinder of 90 cm radius and 260 cm length. The total number of these events was about 8 million. Both the super-pointing and the tracker-pointing datasets predominantly consist of muons fully contained in the DT region: the fraction of muons with at least one CSC hit is of the order of 7%.
3 Muon reconstruction and identification algorithms in CRAFT
Using the data from CRAFT, various muon reconstruction and identification algorithms were stud-ied. In addition to the standard algorithms designed for muons produced at the LHC, dedicated cosmic-muon reconstruction algorithms were provided, optimized for muons not pointing at the nominal beam-interaction region. While the standard reconstruction algorithms typically yield two tracks (“2 legs”) for a single cosmic muon, one in each of the top and bottom halves of the detec-tor, the dedicated cosmic-muon algorithms are also capable of fitting tracks traversing the whole detector (“1 leg”).
This section gives an overview of the different algorithms. Depending on the information used, they can roughly be divided into three groups: standalone muon fits using only information from the muon system (section3.1), global muon reconstruction algorithms based on a combined fit to selected hits in the muon system and the silicon tracker (sections3.2and3.3), and muon iden-tification algorithms checking whether tracks reconstructed in the silicon tracker have signatures compatible with that of a muon in the calorimeters and in the muon system (section3.4).
3.1 Standalone muon reconstruction
In the offline reconstruction, track segments are built within individual muon chambers using a linear fit to the positions of the hits reconstructed in each of the 8-12 (in case of DT) or 6 (in case of CSC) layers of the chamber. These segments are used to generate “seeds” consisting of position and direction vectors and an initial estimate of the muon transverse momentum. The seeds serve as starting points for the track fits in the muon system, which are performed using segments and hits from DTs, CSCs, and RPCs, and are based on the Kalman-filter technique [18]. To improve the momentum resolution, a beam-spot constraint is applied in the fit for beam collision data. The result is a collection of tracks reconstructed using only information from the muon system, which are referred to as “standalone muons”.
2010 JINST 5 T03022
The standard reconstruction algorithm for standalone muons is described in section 9.1.1 ofref. [13]. Since it was developed to reconstruct muons produced at the LHC, it makes use of the fact that such muons are produced at or close to the nominal interaction point and travel from the center of the detector to its periphery. Therefore, a number of modifications to the standard algorithm were necessary to reconstruct efficiently muons coming from outside, in particular those traversing the detector far from its center. A detailed description of the modifications implemented at various stages of the standalone muon reconstruction (in seeding, navigation, and trajectory building) to build the dedicated cosmic-muon reconstruction algorithm can be found in ref. [19].
Since the standard algorithm is still applicable to a subset of cosmic muons crossing the detec-tor close to the nominal interaction point, both dedicated cosmic-muon (CosmicSTA) and beam col-lision (ppSTA) algorithms were used to reconstruct standalone muons in CRAFT. The CosmicSTA algorithm could also be configured to attempt to combine muon hits in both detector hemispheres into one single standalone-muon track spanning the whole detector and revert to single-hemisphere CosmicSTA tracks should such an attempt be unsuccessful; this algorithm is referred to as 1-leg CosmicSTA.
3.2 Global muon reconstruction
At values of the transverse momentum pT below about 200 GeV/c, the momentum resolution for
a muon track is driven by measurements in the silicon tracker. As a particle’s momentum in-creases and the curvature of its corresponding track dein-creases, however, momentum resolution in the tracker becomes limited by position measurement resolution (including misalignment effects). One can then benefit from the large lever arm and 3.8 T magnetic field in the region between the tracker and the muon system by including hits in the muon chambers.
Each standalone-muon track is compared with the tracks reconstructed in the tracker (referred to as “tracker tracks”), and the best-matching tracker track is selected. For each “tracker track” — “standalone muon” pair, the track fit using all hits in both tracks is performed, again based on the Kalman-filter technique and taking into account the average expected energy losses, the magnetic field, and multiple scattering in the detector materials. The result is a collection of tracks referred to as “global muons”. More details on the standard reconstruction of global muons can be found in section 9.1.2 of ref. [13]. As in the case of the standalone muon reconstruction, some modifications to the standard global muon algorithm were implemented for cosmic muons, notably to enable reconstruction of tracks consisting of two standalone-muon tracks at opposite sides of the detector and a single track that traverses the entire tracker sandwiched between them. These modifications are described in ref. [19].
Reconstruction of tracker tracks in CRAFT data was performed using two algorithms, the stan-dard Combinatorial Kalman Finder (CKF) and the specialized Cosmic Track Finder (CosmicTF). Both algorithms are described in refs. [20,21]. The CKF algorithm can be used in its standard con-figuration intended for proton-proton collisions (ppCKF), or re-configured specifically for cosmic-muon events in two ways: to reconstruct cosmic-muons as single tracks (1-leg CosmicCKF) or as two separate tracks in the two hemispheres of the detector (2-leg CosmicCKF). The CosmicTF algo-rithm was designed to reconstruct cosmic muons crossing the tracker as single tracks; furthermore, tracks produced by the CosmicTF can be split at the point of their closest approach to the nominal
2010 JINST 5 T03022
beam line (PCA) into two separate track candidates, with each of the candidates refittedindividu-ally to yield a pair of so-called “split tracks”.
Given the assortment of algorithms available to reconstruct standalone-muon and tracker tracks, various types of global muons can be produced. The following ones were used in the studies described in this paper:
• LHC-like global muons, formed from ppCKF tracker tracks and ppSTA standalone-muon tracks. These are tracks found by the standard algorithm aimed at reconstructing muons produced in beam collisions at the LHC. Only cosmic muons crossing the detector within a few centimeters of the nominal interaction point are selected to be reconstructed by this algorithm.
• 1-leg global muons, formed from 1-leg CosmicCKF tracker tracks and CosmicSTA standalone-muon tracks. These muons typically consist of a single track in the entire tracker sandwiched between two standalone-muon tracks, and yield the best estimate of the param-eters of the muon.
• split global muons, each formed from a split tracker track and a CosmicSTA standalone-muon track. A cosmic standalone-muon traversing the core of the detector typically yields a pair of split global muons. Comparison of these tracks, fitted independently, provides a measure of muon reconstruction performance, while the splitting mechanism ensures that they indeed originate from the same muon.
• 2-leg global muons, each formed from a 2-leg CosmicCKF tracker track and a CosmicSTA standalone-muon track. Since the two 2-leg muon tracks typically found for each tracker-pointing cosmic muon are treated independently at all stages of reconstruction, they provide fully unbiased measurements of reconstruction performance, though care must be taken to ensure that they were produced by the same muon.
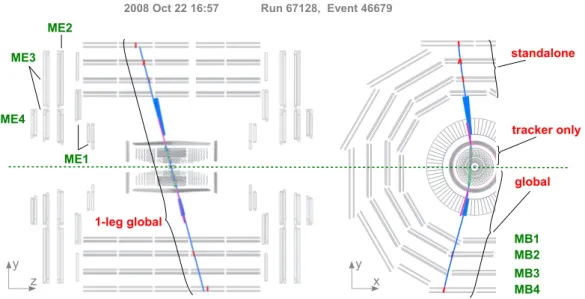
An example of an event display of a cosmic muon crossing CMS in figure1illustrates the main topological differences between tracker tracks, standalone muons, 1-leg global muons, and other types of global muons (LHC-like, split, and 2-leg). The CMS coordinate system is right-handed, with the origin at the nominal collision point, the x axis pointing to the centre of the LHC, the y axis pointing up (perpendicular to the LHC plane), and the z axis along the anticlockwise-beam direction. The pseudorapidity η is defined as η = −ln tan (θ /2), where cos θ = pz/p, and has the
same sign for both legs of a muon. The radius r is the distance from the z axis; the azimuthal angle φ is the angle from the positive x axis measured in the x-y plane.
3.3 Muon reconstruction refinements
As the muon traverses the steel yoke, multiple scattering and radiative processes can significantly degrade the precision with which the muon trajectory is measured, so using all available muon system hits in the track fit — the approach chosen for global muons — is not always the best choice. An alternative approach studied on CRAFT data consists of refitting the global-muon track ignoring hits in all muon stations except the innermost one containing hits. This approach is called the “tracker plus the first muon station” (TPFMS) fit. Another approach, dubbed the “picky” fit,
2010 JINST 5 T03022
ME1 ME2 ME3 ME4 standalone tracker only global 1-leg global MB1 MB2 MB3 MB42008 Oct 22 16:57 Run 67128, Event 46679
y z
y x
Figure 1. Event display of a cosmic muon crossing CMS: the side view (left) and a part of the transverse view (right). “MB” and “ME” labels indicate positions of the muon barrel and the muon endcap stations, respectively. The solid blue curve represents a 1-leg global muon reconstructed using silicon tracker and muon system hits in the whole detector. Small green circles indicate hits in the silicon tracker. Short red stubs correspond to fitted track segments in the muon system; as the z position is not measured in the outer barrel station, the segments in it are drawn at the z center of the wheel, with their directions perpendicular to the chamber. Energy deposits in the electromagnetic and hadron calorimeters are shown as (thin) magenta and (thick) blue bars, respectively.
imposes tight cuts on the compatibility of hits with the muon trajectory in those muon stations which appear to contain electromagnetic showers (i.e., contain a large number of hits).
Momentum resolution for high-pTmuons can potentially be further improved by choosing, on
a track-by-track basis, between fits including muon hits and the tracker-only fit, depending on the fit output. Three such approaches (“selectors”) were studied in CRAFT:
• The sigma-switch method, in which one chooses the global-muon fit if the global and tracker-only fit results for the ratio of the charge q to the momentum p of a muon, q/p, are within 2σq/pof the tracker-only fit from each other, and if the pTvalues found by both fits are above
200 GeV/c; one chooses the tracker-only fit otherwise.
• The truncated muon reconstructor (TMR), whereby one chooses between the TPFMS and tracker-only fits on a track-by-track basis, using goodness-of-fit variables for each fit. • Tune P, which is similar to TMR, but includes the result of the “picky” fit in the selection. 3.4 Muon identification
An approach complementary to global muon reconstruction, referred to as muon identification, consists of considering all tracker tracks to be potential muon candidates and checking this hypoth-esis by looking for compatible signatures in the calorimeters and the muon system.
2010 JINST 5 T03022
Tracker tracks for which at least one matched segment in the muon system is found are called“tracker muons”. Tracker muons have a rather low purity and necessitate further selection re-quirements before they can be considered viable muon candidates. Two sets of such rere-quirements, compatibility-based and cut-based, are currently defined:
• In the compatibility-based selection, two “compatibility” variables are constructed, one based on calorimeter information and the other based on information from the muon system. A tracker muon is considered to be a muon candidate if the value of a linear combination of these variables is larger than a pre-defined threshold. Two versions of the selection, with a lower (CompatibilityLoose) and a higher (CompatibilityTight) threshold, are available. • In the cut-based selection, cuts are applied on the number of matched muon segments and on
their proximity to the extrapolated position of the tracker track. In the LastStation method, one makes use of the fact that the penetration depth of muons is larger than that of hadrons by requiring that there be well-matched segments in at least two muon stations, one of them being in the outermost station. Two versions of the LastStation method exist, with track-to-segment proximity cuts in only x (LastStationLoose) or in both x and y (LastStationTight) projections. In a less stringent OneStation method, a well-matched segment can be located in any muon station. Track-to-segment matching is performed in a local (chamber) coordinate system, where local x is the best-measured coordinate (in the r-φ plane) and local z is the coordinate perpendicular to the chamber and pointing towards the center of CMS.
More details on the muon identification algorithms can be found in section 9.2 of ref. [13].
4 General comparisons between data and simulation
The presentation of the results starts with some general data-simulation comparisons. Section4.1
shows how well the Monte Carlo simulation reproduces the main kinematic properties of cosmic muons. Data-simulation comparisons for a few basic distributions for standalone and global muons are shown in section4.2. Section4.3describes the results obtained for various building blocks of the muon identification algorithm.
4.1 Kinematic properties of cosmic muons
Since the generation of cosmic muons with the CMSCGEN package does not include the produc-tion of multiple muons (muon showers), only events with a single muon crossing the detector were selected for the comparisons below; furthermore, the reconstructed momentum of the muon at the entry point to the CMS detector was required to be larger than 10 GeV/c, the typical energy loss for a cosmic muon traversing the entire detector.
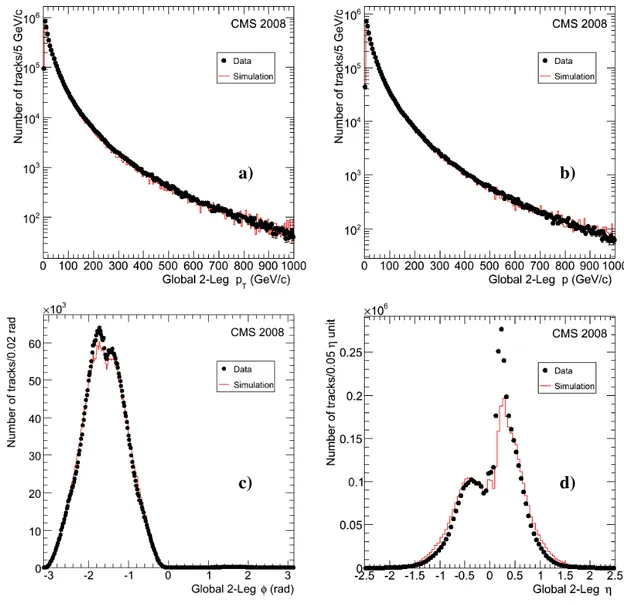
The comparison between the measured and the predicted distributions of the transverse mo-menta of cosmic muons is shown in figure2a, for 2-leg global muons in the tracker-pointing dataset. The agreement is good up to very high pT values. Figure2b shows the momentum distributions
for cosmic muons in the same dataset. Data and Monte Carlo spectra agree to better than 10% over 4 orders of magnitude. The distributions of the azimuthal angle φ of the direction of the track at the point of its closest approach to the nominal beam line are shown in figure 2c. The
2010 JINST 5 T03022
a) b)
c) d)
Figure 2. Distributions of a) the transverse momentum pT, b) the momentum p, c) the azimuthal angle φ ,
and d) the pseudorapidity η of 2-leg global muons at the point of closest approach to the nominal beam line, for the data (points) and for the Monte Carlo simulation (histogram). The MC distributions are normalized to the number of events in the data.
double-peak structure is due to the superposition of the distributions for negatively charged and positively charged muons bent in opposite φ directions by the CMS magnetic field. The Monte Carlo simulation reproduces the shape of the distribution very well, only slightly underestimat-ing a fraction of near-vertical downward-gounderestimat-ing (φ ∼ −π/2) muons. Finally, figure2d shows the distributions of the pseudorapidity η. An excess of events at positive η values is due to an extra contribution from muons reaching the core of the detector through the main access shaft located at negative z. There are more muons from the shaft in data than predicted by the MC simulation: the simulation of cosmic muons used a simplified description of the materials surrounding the CMS cavern, notably of a concrete plug covering the shaft and of the material between the surface and
2010 JINST 5 T03022
a) b)
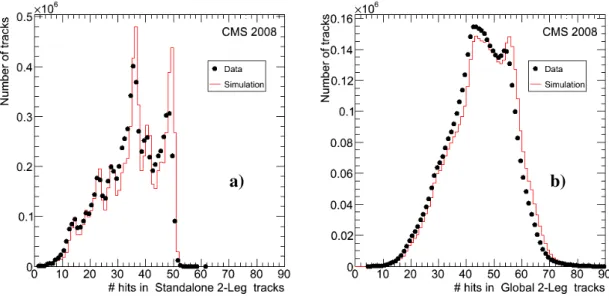
Figure 3. Distributions of the total number of hits per track for the data (points) and for the Monte Carlo sim-ulation (histogram), for a) CosmicSTA standalone muons and b) 2-leg global muons. The MC distributions are normalized to the number of events in the data.
the detector cavern, leading to an underestimated flux of muons from the shaft relative to the flux of muons traversing the rock. Overall, however, the Monte Carlo simulation reproduces the main kinematic distributions of cosmic muons fairly well and therefore can be used in the studies of the muon reconstruction performance described below.
4.2 Basic distributions for standalone and global muons
The same sample of events was used to examine a few other basic distributions for standalone and global muons. Figure3shows the comparison between the data and the Monte Carlo simulation for the total number of hits per track, for CosmicSTA standalone and 2-leg global muons in the tracker-pointing dataset. The most prominent peaks correspond to the number of hits in the tracks spanning 3 and 4 barrel muon stations. The number of hits per track in data is on average slightly lower than that in the MC simulation. These differences are discussed in refs. [8, 20]; as shown below, their impact on the performance of the muon reconstruction is very small, thanks to the high redundancy of measurements in the tracker and the muon system.
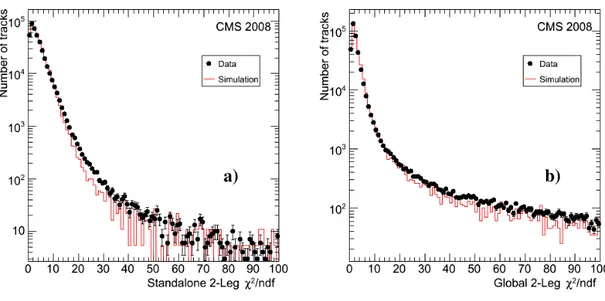
Figure 4 shows the comparison between the data and the simulation for the χ2/ndf of the track fit for events in the super-pointing dataset. The tails of the distributions are larger in the data, indicating that the errors are underestimated; this issue is discussed further in section6.
4.3 Basic distributions for tracker muons
A crucial step of the muon identification approach described in section3.4consists of propagating the tracker track to the calorimeters and to the muon chambers, and associating the propagated trajectory with the energy depositions and the muon segments, respectively. The propagation takes into account the magnetic field, the average expected energy losses, and multiple scattering in the detector materials.
2010 JINST 5 T03022
a) b)
Figure 4. Distributions of the χ2/ndf of the track fit for the data (points) and for the Monte Carlo simulation
(histogram), for a) CosmicSTA standalone muons and b) 2-leg global muons. The MC distributions are normalized to the number of events in the data.
The accuracy of the propagation and the performance of the track-to-segment match were studied using events in the tracker-pointing dataset. Every CosmicTF track with pT > 1.5 GeV/c
or p > 3 GeV/c at the point of its closest approach to the nominal beam line (PCA) was propagated to the muon stations, and a search for the nearest muon segment reconstructed in each station was performed. For each segment found, the normalized residuals (pulls) for position and direction were calculated; the pull is defined as the difference between the position (or direction) of the extrapolated track and the position (or direction) of the nearest segment, divided by their combined uncertainty. The track and the segment were considered to be matched if the distance between them in local x is less than 3 cm or if the value of the pull for local x is less than 4.
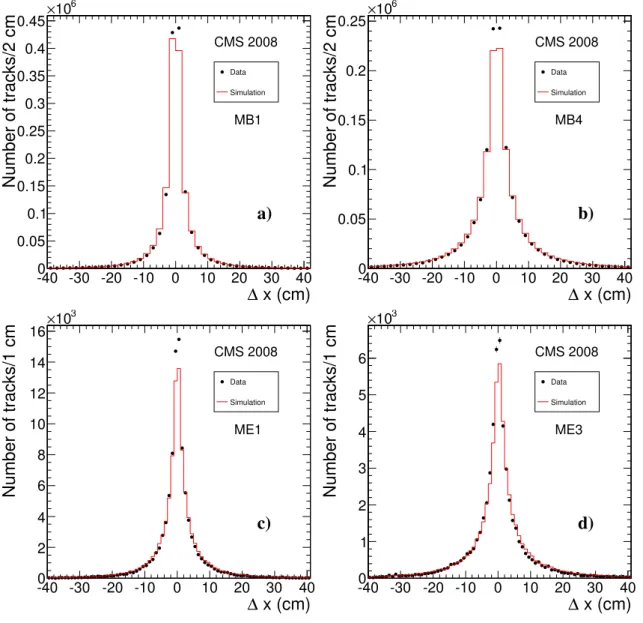
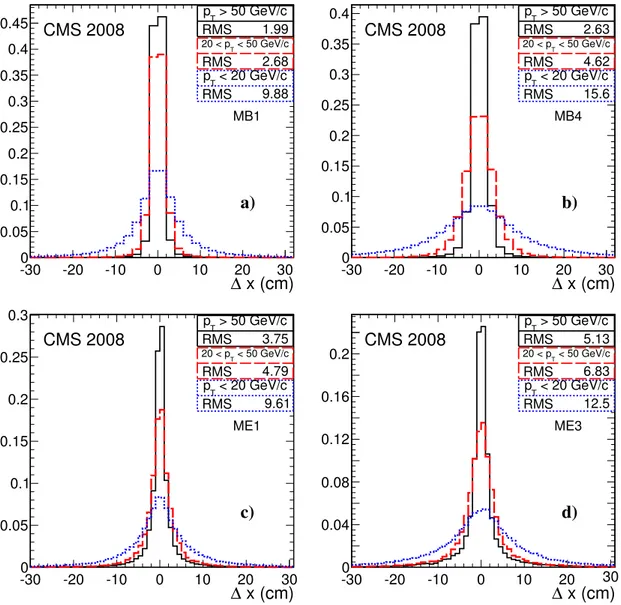
The comparison between the measured and the predicted distributions of the distance in local xbetween the extrapolated track position and the position of the segment for successful track-to-segment matches is shown in figure5. As expected, the width of the distributions increases with the distance over which the track is extrapolated, from the innermost to the outermost muon stations (from MB1 to MB4 and from ME1 to ME3 in the DT and the CSC systems, respectively; see figure1). This effect is well reproduced by the Monte Carlo simulation. Figure6shows the same residuals plotted separately in three bins of tracker-track pT: less than 20 GeV/c, 20–50 GeV/c, and
above 50 GeV/c. No bias is observed in any of the pTbins. As expected, the width of the residuals
decreases with increasing pT, because of smaller multiple-scattering effects.
Figure7shows the distributions of pulls of the local x position and of the local dx/dz direction in the DT and CSC systems. The widths of these and other pulls were found to be close to unity and no large biases were observed, thus demonstrating that the propagation works as expected and that the uncertainties are estimated correctly.
Figure 8shows the efficiency of a successful track-to-segment match, averaged over all DT chambers, as a function of the distance between the propagated track position and the nearest
2010 JINST 5 T03022
x (cm) ∆ -40 -30 -20 -10 0 10 20 30 40 Number of tracks/2 cm 0 0.05 0.1 0.15 0.2 0.25 0.3 0.35 0.4 0.45 6 10 × Data Simulation CMS 2008 MB1 a) x (cm) ∆ -40 -30 -20 -10 0 10 20 30 40 Number of tracks/2 cm 0 0.05 0.1 0.15 0.2 0.25 6 10 × Data Simulation CMS 2008 MB4 b) x (cm) ∆ -40 -30 -20 -10 0 10 20 30 40 Number of tracks/1 cm 0 2 4 6 8 10 12 14 16 3 10 × Data Simulation CMS 2008 ME1 c) x (cm) ∆ -40 -30 -20 -10 0 10 20 30 40 Number of tracks/1 cm 0 1 2 3 4 5 6 3 10 × Data Simulation CMS 2008 ME3 d)Figure 5. Distributions of residuals of the local x position for the track-to-segment match in the data (points) and in the Monte Carlo simulation (histogram) for a) MB1 chambers; b) MB4 chambers; c) ME1 chambers; d) ME3 chambers. The MC distributions are normalized to the number of events in the data.
chamber edge. The distance to the chamber edge is defined to be negative when the extrapolated position of the track is inside the nominal chamber volume, and to be positive otherwise. One can see that the efficiency of finding a muon segment well inside the chamber is close to unity. The inefficiency observed near the edge of the chamber is explained by the increased probability that a given muon (mostly with low momentum) passed outside the chamber, considering the extrapo-lation uncertainty; for higher-pT muons the efficiency drop-off is steeper and begins nearer to the
chamber edge. The slope of this efficiency drop is consistent with that expected from the Monte Carlo simulation.
The ratio of the number of successful track-to-segment matches to the total number of possible ones for a given track, and detailed information on how well the extrapolated track and the segments
2010 JINST 5 T03022
x (cm) ∆ -300 -20 -10 0 10 20 30 0.05 0.1 0.15 0.2 0.25 0.3 0.35 0.4 0.45 pT > 50 GeV/c RMS 1.99 < 50 GeV/c T 20 < p RMS 2.68 < 20 GeV/c T p RMS 9.88 CMS 2008 MB1 a) x (cm) ∆ -300 -20 -10 0 10 20 30 0.05 0.1 0.15 0.2 0.25 0.3 0.35 0.4 pT > 50 GeV/c RMS 2.63 < 50 GeV/c T 20 < p RMS 4.62 < 20 GeV/c T p RMS 15.6 CMS 2008 MB4 b) x (cm) ∆ -300 -20 -10 0 10 20 30 0.05 0.1 0.15 0.2 0.25 0.3 > 50 GeV/c T p RMS 3.75 < 50 GeV/c T 20 < p RMS 4.79 < 20 GeV/c T p RMS 9.61 CMS 2008 ME1 c) x (cm) ∆ -300 -20 -10 0 10 20 30 0.04 0.08 0.12 0.16 0.2 > 50 GeV/c T p RMS 5.13 < 50 GeV/c T 20 < p RMS 6.83 < 20 GeV/c T p RMS 12.5 CMS 2008 ME3 d)Figure 6. Distributions of residuals of the local x position for the track-to-segment match in the data, shown
separately in three pTbins: less than 20 GeV/c (dotted histograms), 20–50 GeV/c (dashed histograms), and
above 50 GeV/c (solid histograms). The four panels show residuals for different chambers: a) MB1; b) MB4; c) ME1; d) ME3. Each histogram is normalized to unit area; histograms and boxes with statistics are matched in style and color.
match, are combined into a single variable used to quantify the compatibility of a given track with the hypothesis that it is from a muon. Such a segment-based compatibility variable is constructed to be in the interval from 0 to 1, with a higher value indicating a higher probability for the track to be from a muon. The distributions of this variable in the data and in the Monte Carlo simulation are shown in figure 9a. As expected, most of the cosmic muons have large values of compati-bility. The Monte Carlo simulation reproduces the shape of the measured distribution very well. Figure9b shows a similar muon-compatibility variable constructed from the energy depositions in the electromagnetic and hadron calorimeters [13]. Again, the distribution in the data behaves as
2010 JINST 5 T03022
Pull x -100 -5 0 5 10 0.02 0.04 0.06 0.08 0.1 0.12 0.14 Entries 5647564 Constant 0.1505 ± 0.0001 Mean 0.01127 ± 0.00051 Sigma 1.017 ± 0.001 Entries 5647564 Constant 0.1505 ± 0.0001 Mean 0.01127 ± 0.00051 Sigma 1.017 ± 0.001 Entries 5647564 Mean 0.01127 ± 0.00051 Sigma 1.017 ± 0.001 CMS 2008 DT a) Pull dx/dz -100 -5 0 5 10 0.02 0.04 0.06 0.08 0.1 0.12 0.14 Entries 5647564 Constant 0.1476 ± 0.0001 Mean -0.01145 ± 0.00052 Sigma 1.009 ± 0.001 Entries 5647564 Constant 0.1476 ± 0.0001 Mean -0.01145 ± 0.00052 Sigma 1.009 ± 0.001 Entries 5647564 Mean -0.01145 ± 0.00052 Sigma 1.009 ± 0.001 CMS 2008 DT b) Pull x -100 -5 0 5 10 0.02 0.04 0.06 0.08 0.1 0.12 0.14 Entries 231954 Constant 0.1475 ± 0.0004 Mean 0.006692 ± 0.002545 Sigma 1.013 ± 0.003 Entries 231954 Constant 0.1475 ± 0.0004 Mean 0.006692 ± 0.002545 Sigma 1.013 ± 0.003 Entries 231954 Mean 0.006692 ± 0.002545 Sigma 1.013 ± 0.003 CMS 2008 CSC c) Pull dx/dz -100 -5 0 5 10 0.02 0.04 0.06 0.08 0.1 0.12 Entries Constant 0.1211 ± 231954 0.0004 Mean -0.006901 ± 0.003123 Sigma 1.107 ± 0.003 Entries 231954 Constant 0.1211 ± 0.0004 Mean -0.006901 ± 0.003123 Sigma 1.107 ± 0.003 Entries 231954 Mean -0.006901 ± 0.003123 Sigma 1.107 ± 0.003 CMS 2008 CSC d)Figure 7. Distributions of pulls of the local x position and of the local dx/dz direction of the track-to-segment match: a) pull of x in the DT system; b) pull of dx/dz in the DT system; c) pull of x in the CSC system; d) pull of dx/dz in the CSC system. Each plot is a combined distribution of pulls in all MB or ME stations. All histograms are normalized to unit area; the superimposed curves are the results of Gaussian fits in the range from −2 to 2.
expected. Since the compatibility algorithms were built and optimized for muons produced in pp collisions but were applied to cosmic muons in this study without any modifications, their current performance is not expected to be optimal. For example, the small enhancement at zero in figure9b is produced by muons crossing calorimeters sideways and depositing more energy than expected for a muon coming from the interaction point; this effect is well described by the cosmic-muon simulation. The efficiency of the muon identification algorithms using these segment-based and calorimeters-based compatibility variables is discussed in the next section.
2010 JINST 5 T03022
(cm)
edge- x
extrapolationx
-140 -120 -100 -80 -60 -40 -20 0 20Efficiency
0 0.2 0.4 0.6 0.8 1 Data SimulationCMS 2008
Figure 8. Efficiency of a successful track-to-segment match in the DT system, averaged over all DT cham-bers, as a function of the distance between the propagated track position and the nearest chamber edge, for the data (points) and the Monte Carlo simulation (histogram).
Compatibility 0 0.2 0.4 0.6 0.8 1 Number of tracks/bin 0 0.05 0.1 0.15 0.2 0.25 0.3 0.35 6 10 × Data Simulation CMS 2008 a) Compatibility 0 0.2 0.4 0.6 0.8 1 Number of tracks/bin 0 0.05 0.1 0.15 0.2 0.25 0.3 0.35 0.4 0.45 6 10 × Data Simulation CMS 2008 b)
Figure 9. Compatibility of the muon hypothesis with a) segments reconstructed in the muon chambers and b) energy deposits in the calorimeters, for the data (points) and the simulation (histogram).
2010 JINST 5 T03022
5 Reconstruction and identification efficiency
This section reports on the efficiency of muon reconstruction and identification algorithms, mea-sured using two different approaches: by independently reconstructing the two halves of a cosmic-muon track in opposite detector hemispheres (section5.1) and by searching for a track in the muon system corresponding to a track reconstructed in the silicon tracker (section5.2).
5.1 Efficiency measurements with tracks in opposite detector hemispheres
The efficiency of various muon reconstruction and identification algorithms was measured by se-lecting events with a good-quality global muon reconstructed in one hemisphere of the detector (top or bottom) and examining whether there is a corresponding track in the opposite hemisphere, in the region of |∆φ | < 0.3 and |∆η| < 0.3 around the direction of the reference global-muon track. Since this method of measuring muon efficiency is sensitive to the efficiency of the silicon tracker, it was only applied to the runs from the last part of CRAFT (“period B”), in which all parts of the tracker were correctly synchronized with the rest of CMS [20]. To ensure that the muon traversed the whole detector, the pTof the reference global-muon track at the point of its closest approach to
the nominal beam line was required to be larger than 10 GeV/c.
Two groups of muon reconstruction and identification algorithms were considered: the dedi-cated cosmic-muon and, most importantly, the standard algorithms developed for muons produced in pp collisions. Efficiencies of the cosmic-muon algorithms were evaluated on a sample of muons with a topology similar to that of muons produced in beam collisions (i.e., with muon trajectories pointing to the nominal interaction point). Such events were selected by requiring that the distance between the point of closest approach of the reference track to the beam line and the nominal posi-tion of pp interacposi-tions did not exceed 10 cm in the direcposi-tion perpendicular to the beam axis (r) and 20 cm along the nominal beam line (z). Efficiencies of the standard algorithms were measured on a smaller subsample of muons selected by applying even tighter impact-parameter cuts to reference tracks: r < 4 cm (the beam-pipe radius) and |z| < 10 cm (∼ 3σ boundary of the collision region at start-up). The total numbers of reference tracks available for this study were 4530 and 1028 for the dedicated cosmic-muon and standard algorithms, respectively.
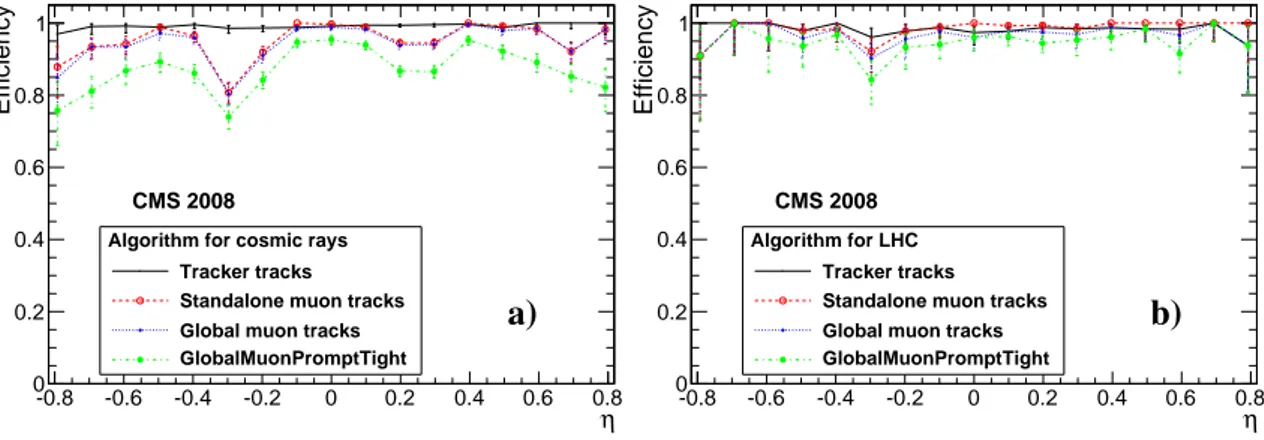
Figure 10 shows the efficiencies to reconstruct a) 2-leg and b) LHC-like global muons and their constituents as a function of the pseudorapidity of the reference tracks. Integrated over the barrel region of the detector (|η| < 0.8), the average efficiency for 2-leg global muons produced by the dedicated cosmic-muon reconstruction algorithm (figure10a) was found to be (95.4 ± 0.3)%. The main source of efficiency loss is an inefficiency of about 4% in the cosmic standalone muon reconstruction, mostly in the gaps between the barrel wheels. The efficiencies of the CosmicCKF tracker-track reconstruction and of the tracker-track to standalone-muon matching are both larger than 99%. The efficiency of the standard global muon reconstruction algorithm in the barrel region (figure 10b), evaluated on a sample of collision-like cosmic muons, was measured to be (97.1 ± 0.6)%. The small inefficiency stems mainly from the component tracks of global muons: for events in which both the tracker track and the standalone-muon track are found, the efficiency to reconstruct the global muon is (99.7 ± 0.1)%. Figure10also shows the efficiency for the global muons with an additional requirement applied to the normalized χ2 of the fit, χ2/ndf < 10; this cut is expected to strongly suppress hadronic punch-throughs and muons from decays of π- and
2010 JINST 5 T03022
η -0.8 -0.6 -0.4 -0.2 0 0.2 0.4 0.6 0.8 Efficiency 0 0.2 0.4 0.6 0.8 1Algorithm for cosmic rays Tracker tracks Standalone muon tracks Global muon tracks GlobalMuonPromptTight CMS 2008 a) η -0.8 -0.6 -0.4 -0.2 0 0.2 0.4 0.6 0.8 Efficiency 0 0.2 0.4 0.6 0.8 1 Algorithm for LHC Tracker tracks Standalone muon tracks Global muon tracks GlobalMuonPromptTight
CMS 2008
b)
Figure 10. Muon reconstruction efficiencies as a function of η of the reference track, for a) cosmic-muon algorithms and b) algorithms developed for muons produced in beam collisions at the LHC. Plot a) shows efficiencies of 2-leg CosmicCKF tracker tracks (solid line), CosmicSTA standalone muons (open circles),
2-leg global muons (small filled circles), and 2-leg global muons with an additional χ2 cut applied (large
filled circles). Plot b) shows efficiencies of ppCKF tracker tracks (solid line), ppSTA standalone muons
(open circles), LHC-like global muons (small filled circles), and LHC-like global muons with an extra χ2
cut (large filled circles).
K-mesons in collision events. The results for LHC-like global muons in figure10b confirm that the proposed cut value leaves the efficiency for prompt muons almost intact: the corresponding decrease in efficiency is on the order of 2%.
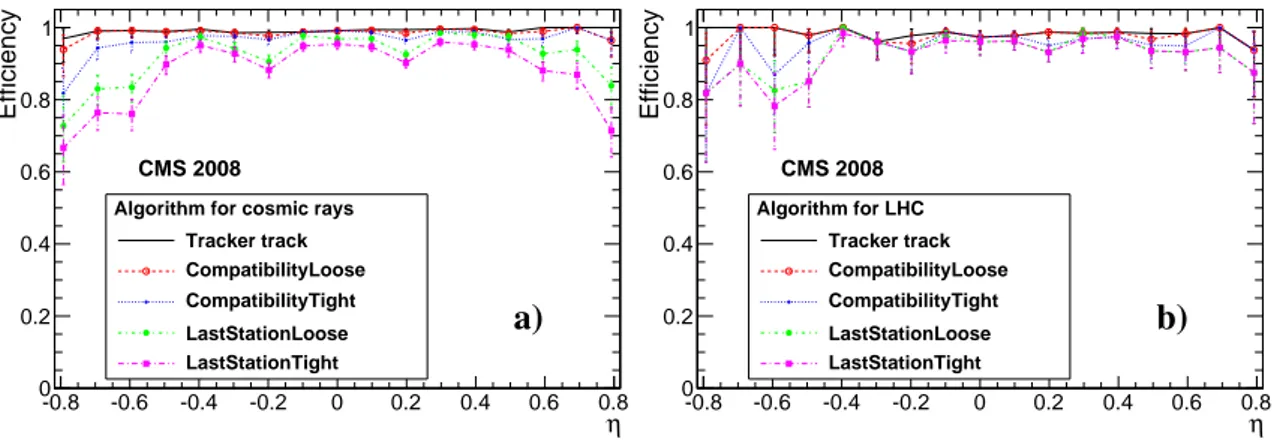
The efficiencies for the loose and tight versions of the compatibility-based and cut-based muon identification algorithms are compared with the efficiencies of tracker tracks in figure11as a function of η of the reference track. For both cosmic-muon and standard track reconstruction methods, the efficiency of CompatibilityLoose tracker muons is very similar to that of the tracker tracks: the overall efficiency reduction caused by the CompatibilityLoose selection does not exceed 0.3%. The loss of efficiency due to the CompatibilityTight selection criteria is also small, of the order of 2%. The average efficiencies of the loose and tight versions of the LastStation variant of the cut-based selection are all above 90%. All measured efficiency values are summarized in table1. To evaluate a possible bias from correlations between reference and probe tracks, average efficiencies were calculated in two ways: by dividing the number of probe tracks found by the number of reference tracks, and as an arithmetic mean of efficiencies in η bins, neglecting their statistical uncertainties. As can be seen in table1, the efficiencies obtained by the two methods agree within 1–2% in most cases.
The dependence of the efficiencies of the various muon reconstruction and identification al-gorithms on the pTof the reference muons at the PCA is shown in figure12. None of the studied
algorithms show a strong pTdependence in the range above 10 GeV/c, as expected.
Measured efficiencies were compared with those obtained by applying the same method of evaluating efficiencies to the simulated samples of cosmic muons. Two examples of such com-parisons are displayed in figure13, showing the η dependence of efficiencies for standalone and global muons reconstructed by the standard algorithms. MC efficiencies integrated over the barrel region of the detector are compared in table1to efficiencies measured in the data. In general, the
2010 JINST 5 T03022
η -0.8 -0.6 -0.4 -0.2 0 0.2 0.4 0.6 0.8 Efficiency 0 0.2 0.4 0.6 0.8 1Algorithm for cosmic rays Tracker track CompatibilityLoose CompatibilityTight LastStationLoose LastStationTight CMS 2008 a) η -0.8 -0.6 -0.4 -0.2 0 0.2 0.4 0.6 0.8 Efficiency 0 0.2 0.4 0.6 0.8 1 Algorithm for LHC Tracker track CompatibilityLoose CompatibilityTight LastStationLoose LastStationTight CMS 2008 b)
Figure 11. Muon identification efficiencies as a function of η of the reference track, for a) cosmic-muon algorithms and b) algorithms developed for muons produced in beam collisions. The efficiencies for loose (CompatibilityLoose) and tight (CompatibilityTight) versions of the compatibility-based selection of tracker muons are shown in open and small filled circles, respectively. The efficiencies for loose (LastStationLoose) and tight (LastStationTight) versions of the cut-based selection of tracker muons are shown in large filled cir-cles and in squares, respectively. For comparison, the efficiency for tracker tracks (upper line) is also shown. Table 1. Summary of muon reconstruction and identification efficiencies (in %) for cosmic-muon algorithms and algorithms developed for muons produced in beam collisions at the LHC, for muons in the region |η| < 0.8. Errors represent statistical uncertainties only. Numbers in parentheses show efficiencies calculated by a simple (non-weighted) averaging of the efficiencies in η bins.
Algorithm Cosmic-muon algorithms Beam collision algorithms
Data Simulation Data Simulation
Reconstruction algorithms Tracker-only 99.2 ± 0.2 (99.2) 99.9 ± 0.1 (99.9) 98.3 ± 0.5 (98.3) 99.1 ± 0.3 (98.8) Standalone muon 96.1 ± 0.3 (95.2) 91.5 ± 0.3 (92.7) 98.8 ± 0.4 (98.7) 96.2 ± 0.5 (96.8) Global muon 95.4 ± 0.3 (94.5) 91.3 ± 0.3 (92.5) 97.1 ± 0.6 (96.9) 95.0 ± 0.5 (95.5) Identification algorithms CompatibilityLoose 98.9 ± 0.2 (98.5) 98.8 ± 0.1 (98.7) 98.1 ± 0.5 (97.8) 97.9 ± 0.4 (97.4) CompatibilityTight 97.6 ± 0.2 (96.5) 97.2 ± 0.2 (97.0) 96.4 ± 0.7 (95.9) 96.6 ± 0.5 (96.2) LastStationLoose 94.7 ± 0.4 (92.0) 94.6 ± 0.3 (94.8) 94.6 ± 0.8 (93.3) 93.2 ± 0.6 (93.1) LastStationTight 91.7 ± 0.4 (87.8) 84.9 ± 0.4 (84.1) 94.2 ± 0.8 (92.2) 92.0 ± 0.7 (91.2)
results are in good agreement. In several cases, the measured efficiencies are slightly larger than the predicted ones: in particular, this is the case for standalone muons and for muons selected by the tight version of the cut-based identification algorithm. The measured value of the key efficiency, namely that for LHC-like global muons (and, therefore, for the refits and selectors described in section3.3), exceeds that predicted by the MC simulation by (2.1 ± 0.8)%.
5.2 Measurements of standalone-muon efficiency with tracker tracks
In addition to the efficiency studies described above, the efficiency of the standalone muon re-construction was measured relative to the number of tracks in the tracker and compared to the
2010 JINST 5 T03022
(GeV/c) T p 2 10 Efficiency 0 0.2 0.4 0.6 0.8 1Algorithm for cosmic rays Tracker track Standalone muon Global muon CompatibilityLoose LastStationLoose CMS 2008 a) (GeV/c) T p 2 10 Efficiency 0 0.2 0.4 0.6 0.8 1 Algorithm for LHC Tracker track Standalone muon Global muon CompatibilityLoose LastStationLoose CMS 2008 b)
Figure 12. Muon reconstruction and identification efficiencies in the barrel region of the detector (|η| <
0.8) as a function of pTof the reference track, for a) cosmic-muon algorithms and b) algorithms developed
for muons produced in beam collisions, for tracker tracks (solid line), standalone muons (open circles), global muons (small filled circles), and the loose versions of the compatibility-based and cut-based muon identification algorithms (large filled circles and squares, respectively).
η -0.8 -0.6 -0.4 -0.2 0 0.2 0.4 0.6 0.8 Efficiency 0 0.2 0.4 0.6 0.8 1 Algorithm for LHC Simulation Data CMS 2008 a) η -0.8 -0.6 -0.4 -0.2 0 0.2 0.4 0.6 0.8 Efficiency 0 0.2 0.4 0.6 0.8 1 Algorithm for LHC Simulation Data CMS 2008 b)
Figure 13. Reconstruction efficiencies for LHC-like a) standalone (ppSTA) and b) global muons as a func-tion of η of the reference track. Efficiencies in data are shown as points with error bars; efficiencies predicted by the Monte Carlo simulation are depicted as histograms. Statistical uncertainties for simulated points are similar to those in data.
efficiency expected from the Monte Carlo simulation. Events triggered by the DT or barrel RPC detectors and containing at least one tracker track reconstructed by the CosmicTF algorithm were first selected from the tracker-pointing dataset. Tracker tracks including more than 10 hits and with |η| < 0.8 and p > 10 GeV/c were defined as tags. The trajectories of these tracks were then prop-agated to the outer surface of the CMS detector, and a standalone-muon track reconstructed by the 1-leg CosmicSTA algorithm (the probe) was searched for in the nearby region.
The efficiencies measured in the data were compared to those in the Monte Carlo simulation, calculated in two ways: relative to the number of reconstructed tracker tracks using the tag-and-probe method, as for the data, and relative to the number of generated muons. Simulated events were required to satisfy the (very loose) Level-1 trigger selection criteria used during CRAFT [4].
2010 JINST 5 T03022
η -0.6 -0.4 -0.2 0 0.2 0.4 0.6 Efficiency 0.8 0.82 0.84 0.86 0.88 0.9 0.92 0.94 0.96 0.98 1 CMS 2008Tag and probe, data Tag and probe, simulation Truth from simulation
a) (GeV/c) T p 2 10 103 Efficiency 0.8 0.82 0.84 0.86 0.88 0.9 0.92 0.94 0.96 0.98 1 CMS 2008
Tag and probe, data Tag and probe, simulation Truth from simulation
b) (rad) φ 0.5 1 1.5 2 2.5 Efficiency 0.8 0.82 0.84 0.86 0.88 0.9 0.92 0.94 0.96 0.98 1 CMS 2008
Tag and probe, data Tag and probe, simulation Truth from simulation
c) z (cm) -500 -400 -300 -200 -100 0 100 200 300 400 500 Efficiency 0.8 0.82 0.84 0.86 0.88 0.9 0.92 0.94 0.96 0.98 1 CMS 2008
Tag and probe, data Tag and probe, simulation Truth from simulation
d)
Figure 14. Reconstruction efficiency for 1-leg CosmicSTA standalone muons in the data (filled squares)
and in the Monte Carlo simulation (open squares) as a function of a) η, b) pT, c) φ , and d) the z coordinate
of the muon entry point into the detector. Also shown is the efficiency calculated relative to the number of generated muons (diamonds).
Figure14shows reconstruction efficiencies for standalone muons as a function of the tracker-track η , pT, azimuthal angle φ , and the z coordinate of the muon entry point into the detector. The
standalone-muon efficiency in the data is seen here to be 98–99%, except for small regions at the boundaries between the barrel wheels (z ∼ ± 200 cm and η ∼ ± 0.2). The efficiency remains high at the largest pT values studied (of the order of 500 GeV/c). As expected, no dependence
on φ is observed. The Monte Carlo simulation reproduces all efficiency distributions to within 1– 2%. Good agreement with the true efficiency calculated relative to the generated number of muons confirms the validity of the method used.
6 Momentum and angular resolutions
The muon momentum resolution was studied using 2-leg muons. A pure sample of muons with a topology similar to that of muons produced in beam collisions at the LHC was obtained by requiring that each of the muon tracks has at least 1 hit in the pixel detector and at least 8 hits in the silicon-strip detector. To further suppress contamination from events in which one could inadvertently compare tracks from different muons, only events with exactly one pair of tracks were considered. Since the alignment of the muon endcaps has not been completed, the small subset of events with
2010 JINST 5 T03022
muons in the CSCs was removed explicitly. Finally, events with muons having hits in several DTchambers in the horizontal sectors that could not be aligned to satisfactory precision [17] were discarded. Overall, 23 458 events were selected.
For each pair of muon tracks in the selected events, the relative q/pT residual, R(q/pT), was
calculated as R(q/pT) = (q/pT)upper− (q/pT)lower √ 2(q/pT)lower , (6.1)
where (q/pT)upperand (q/pT)lowerare the ratios of the charge sign to the transverse momentum for
muon tracks in the upper and lower detector halves, respectively. The√2 factor accounts for the fact that the upper and lower tracks are reconstructed independently and with a similar precision. The normalized q/pTresidual (or pull), P(q/pT), was defined as
P(q/pT) = (q/pT)upper− (q/pT)lower q σ(q/p2 T)upper+ σ 2 (q/pT)lower , (6.2)
where σ(q/pT)upper and σ(q/pT)lower are the estimates of q/pT errors for the upper and lower muon
tracks, respectively. The values of q/pT and the corresponding errors were evaluated at the point
of closest approach of each track to the nominal beam line. As the momentum resolution for standalone muons is expected to be significantly worse than that obtained using the other muon reconstruction algorithms [13], the residuals and pulls for standalone muons were estimated by comparing q/pT of each standalone muon reconstructed in the lower detector hemisphere with
q/pTof the global muon in the same hemisphere (and omitting
√
2 in eq. (6.1)). Since the momen-tum vector of a tracker muon is the same as that of the corresponding tracker track, the results for tracker tracks shown in this and the next section are valid for tracker muons as well.
The widths of the pull distributions were examined to verify the accuracy of the estimated track-parameter errors. These estimates depend, among other things, on the so-called alignment position errors (APEs) accounting for the precision with which the positions of different detector components are known [16]. The available sample of 2-leg muons was subdivided into several subsamples according to the pT of the muon track reconstructed in the lower hemisphere (the
reference track), and a Gaussian fit to the P(q/pT) distribution for each subset was performed.
The fit range used throughout this section was ± 2·RMS; various other ranges were tried and only small differences were observed. Figure15shows the widths of these Gaussian fits as a function of reference-track pTfor muon tracks reconstructed by various algorithms described in section3. If all
errors were calculated correctly, these widths should be 1.0. The widths of the pulls for standalone muons are greater than unity at all pT values because the muon APEs, which were not yet fully
implemented, were all set to zero in the reconstruction. The widths of other pulls are consistent with unity in the region of pT. 40 GeV/c, confirming that the estimates of errors for the low-pT
region are accurate. In the higher-pT region, the widths of the tracker-only pulls are larger than
1.0, indicating that the tracker APEs are underestimated. As the muon pT increases, so does the
importance of the muon system in the momentum measurement, and the widths of the pulls for the combined tracker-muon fits move closer to the widths of the pulls of the standalone-muon fit.
Figure16shows the widths of the Gaussian fits to R(q/pT) distributions obtained with various
2010 JINST 5 T03022
Figure 15. Widths of Gaussian fits to the distributions of the normalized residuals, P(q/pT), for various
muon reconstruction algorithms, as a function of pTof the reference track.
pT region below approximately 200 GeV/c, the resolution in the muon detector is dominated by
multiple-scattering effects and the inclusion of muon hits does not improve the resolution beyond that obtained with the tracker-only fits. At higher pT, the resolution of the global muon
recon-struction algorithm is currently not as good as that of the tracker tracks; we expect it to improve once the muon APEs are taken into account or there is a sufficiently better alignment. On the other hand, the resolution in the high-pT region obtained with TPFMS and TMR is already better than
that of global muons and of tracker-only tracks, as expected. These and other algorithms described in section3.3 improve not only the “core” resolution but also the resolution tails, as can be seen from the summary of the performance of all studied muon reconstruction algorithms obtained on a sample of muons with reference-track pT> 200 GeV/c in table2. Very similar results (albeit with
somewhat larger statistical uncertainties) were obtained by repeating the analysis on a sample of split global muons and using the pTof the original “unsplit” track as the reference pT.
Momentum resolutions obtained for various reconstruction algorithms were compared with those predicted by the Monte Carlo simulation of cosmic muons. Figure17shows two examples of such data-simulation comparisons, for standalone muons (without the beam-spot constraint) and for muons reconstructed by the “Tune P” method. Each measured distribution is compared to two types of simulated ones: that obtained using the current best estimates of the precision to which the tracker and the muon system have been aligned in CRAFT, and a scenario in which all components of the tracker and the muon system are perfectly aligned. While the MC simulation using the CRAFT-based alignment describes the resolution for standalone muons rather well, its prediction
2010 JINST 5 T03022
Figure 16. Widths of Gaussian fits to the distributions of the relative residuals, R(q/pT), for various muon
reconstruction algorithms, as a function of pTof the reference track.
Table 2. Summary of figures characterizing R(q/pT) residuals for the studied muon reconstruction
algo-rithms, evaluated on a sample of 567 muons with reference-track pT> 200 GeV/c: the width of the
Gaus-sian fit; the value of the RMS truncated at ± 0.5; the number of events with R(q/pT) < −0.5; the number of
events with R(q/pT) > 0.5. Fit/selector Fitted σ (%) RMS (%) R(q/pT) < −0.5 R(q/pT) > 0.5 Tracker-only fit 5.5 ± 0.1 7.6 ± 0.2 1 1 Global fit 6.1 ± 0.2 9.5 ± 0.3 8 14 TPFMS fit 5.2 ± 0.1 6.9 ± 0.2 4 3 “Picky” fit 5.5 ± 0.2 6.9 ± 0.2 0 0 Sigma switch 5.3 ± 0.1 7.4 ± 0.2 1 1 TMR 5.1 ± 0.1 7.3 ± 0.2 0 1 Tune P 5.0 ± 0.1 6.5 ± 0.2 0 1
for muons reconstructed by the “Tune P” method (as well as other combined tracker-muon fits) is better than the measured resolution at all pTvalues. The difference is about 10% at low pT, mostly
due to a too optimistic description of the tracker alignment, and is about a factor of two in the highest-pTbin, where both the tracker and the muon alignment play a role. Comparisons between
the data and MC predictions for the ideal alignment confirm the results of other studies [16,17] demonstrating that the alignment precision achieved in CRAFT for the barrel tracker and muon system is already quite good, although there is some room for improving the resolution further,
2010 JINST 5 T03022
a) b)
Figure 17. Widths of Gaussian fits to the distributions of the relative residuals, R(q/pT), for a) standalone
muons (without the beam-spot constraint) and b) muons reconstructed by the “Tune P” method as a function
of pT of the reference track. The widths are compared to two different MC predictions: one assuming a
CRAFT-based alignment precision and the other an ideal alignment.
Figure 18. Distributions of the relative residual, R(q/pT), for muons reconstructed by the “Tune P” method
in data (points with error bars) and in the Monte Carlo simulation with the CRAFT-based alignment (his-togram). The MC distribution is normalized to the number of events in the data.
notably at high pT. The resolution tails are rather well reproduced, as can be seen from the
data-MC comparison for the R(q/pT) distribution for “Tune P” muons shown in figure18.
The same sample of events was used to evaluate angular resolutions. The absolute residuals for the azimuthal angle φ and the polar angle θ were calculated as differences between the
corre-2010 JINST 5 T03022
a) b)
Figure 19. Distributions of residuals for a) the azimuthal angle φ and b) the polar angle θ at the point of closest approach to the nominal beam line, for muons reconstructed by the “Tune P” method. Residuals in data (points) are compared with the predictions of the Monte Carlo simulation using the CRAFT-based alignment (histograms). The MC distributions are normalized to the number of events in the data.
sponding angles of the upper and the lower tracks divided by√2. In figure19, the distributions of the φ and θ residuals for “Tune P” muons in data are compared to the predictions obtained from the simulation using the CRAFT-based alignment. As for the pTresolution, the predictions of the
Monte Carlo simulation for angular resolutions are slightly more optimistic than the resolutions measured in data, but the overall agreement is reasonable.
The impact of certain systematic effects on the muon reconstruction performance can be ex-amined by comparing results of the full muon reconstruction with parameters of the tracks re-constructed in the tracker alone. Such effects include systematic deviations of the values of the magnetic field used in the muon reconstruction from their true values [15], as well as unaccounted shifts or rotations of the muon system with respect to the tracker [17]. For this purpose, a track-by-track comparison was performed of the pT value of the global muon, (pT)G, with the pT of
the corresponding tracker track, (pT)T. Split global muons in the upper and lower halves of the
detector were used. The distributions of
F(pT) = (pT)T/(pT)G (6.3)
in various pT bins were plotted separately for positively charged and negatively charged muons;
the mean values of the Gaussian fits to these distributions are shown in figure20. Systematic biases in the magnetic field map would affect µ+ and µ− distributions similarly, resulting in deviations of hF(pT)i from unity of the same sign and magnitude, whereas global misalignments that are
not accounted for would lead to biases of the same magnitude but of different sign. As one can see in figure20, deviations from unity do not exceed 1% in the transverse momentum range up to 150 GeV/c and are of different sign for µ+ and µ−. Such deviations are consistent with the current understanding of global alignment in CMS [17]; if they are attributed wholly to the effect of the global rotation around the z axis of the muon system with respect to the tracker, they would
2010 JINST 5 T03022
(GeV/c) T p 20 40 60 80 100 120 140 G /(p ) T T T (p ) 0.97 0.98 0.99 1 1.01 1.02 1.03 +µ
-µ
Top half CMS 2008 (GeV/c) T p 20 40 60 80 100 120 140 G /(p ) T T T (p ) 0.97 0.98 0.99 1 1.01 1.02 1.03 Bottom half CMS 2008 a) b)Figure 20. Mean values of Gaussian fits to F(pT) distributions (see text) for µ+(circles) and µ−(squares)
as a function of pT, for split global muons a) at the top half and b) at the bottom half of the detector. When
plotted, points for µ−are offset by a small distance in pTfor clarity.
correspond to an angle of about 0.25 mrad. Overall, these results provide important constraints on the impact of any remaining unknown systematic effects on the muon reconstruction performance.
7 Charge assignment
The tracker and the muon system of CMS are designed to provide a reliable determination of the muon charge sign up to very high muon momenta. However, some low rate of charge misidentifi-cation is unavoidable. Charge identifimisidentifi-cation is particularly challenging at very high energies since the muon trajectory is nearly straight, and radiative effects can lead to high-multiplicity showers in the muon system further complicating muon reconstruction.
The rate of charge misassignment is studied by measuring the number of times the two mea-surements of the charge of the same muon, in the top and bottom hemispheres, disagree. In order to obtain two independent measurements of the muon charge, 2-leg muons in the tracker-pointing dataset are used. Stringent selection criteria suppressing the wrong charge assignment to a negligi-ble level are applied to the muon track in the upper hemisphere (used as the tag), and the charge of the other leg in the bottom hemisphere (the probe) is compared with the charge of the tag.
Since charge misassignment is a low-rate effect, the purity of the test sample is crucial. The dominant background in this study comes from muon showers, where multiple muons traverse the detector at the same time. In that case, the top and bottom muon measurements may not correspond to the same muon, which would affect the charge misidentification measurement. In order to re-move this background, exactly two CosmicSTA standalone muons are required to be present in the event, one in the top hemisphere, the other in the bottom. Since the standalone muon reconstruction is very efficient at detecting muons, the resulting sample has a high purity of single muons.
2010 JINST 5 T03022
The study only includes the performance of the barrel muon system and central tracker, as thealignment and the magnetic field maps for these parts of the CMS detector were best understood at the time of this paper. To obtain a pure sample of barrel muons, cosmic rays in the muon and tracker endcaps are vetoed explicitly by requiring that there are no CSC or tracker endcap hits in the muon fit. In order to guarantee good fits of transverse momentum and charge, each leg of the muon must have at least 5 hits in the tracker. To select a sample of muons resembling those expected from beam collisions, the PCA of each track to the nominal beam line is required to lie within r< 50 cm and |z| < 30 cm of the nominal position of pp interactions. Finally, the charges of the tag track assigned by the tracker-only, global, and TPFMS algorithms must all be the same. While the “core” resolution is driven by the tracker for each of these algorithms, events in the far resolution tails are typically different for different algorithms. Requiring consistent charges for the three fits reduces the charge misassignment to about a factor of 10 lower than that for the best performing of the three algorithms, over the full momentum range. Since this level of charge misassignment is below what can be probed accurately with the available number of events, we chose to apply stringent cuts only to the top leg and report charge confusion for the individual algorithms in the lower leg, for which the muon propagation direction is LHC-like.
The results for different muon reconstruction algorithms are shown in figure21. The charge misassignment fraction is reported in bins of transverse momentum of the tracker track recon-structed in the top hemisphere; pT is measured at the point of closest approach to the nominal
beam line. As expected, the measurement of the charge provided by the standalone muon recon-struction is less accurate than that in the tracker for the entire pT range. Both the tracker-only fit
and the combined tracker-muon fits provide a reliable charge measurement for the low momentum region. At high-pT values, the most accurate charge assignment is given by the dedicated high-pT
muon reconstruction algorithms. While different algorithms lead in performance over different momentum regions, the charge misassignment remains well below 0.1% up to pT = 100 GeV/c,
becoming about 1% at pT∼ 500 GeV/c.
8 Performance of the muon high-level trigger
This section describes studies of the performance of the muon reconstruction algorithms used in the online event selection. The online muon reconstruction carried out by the High-Level Trigger [22] is performed in three stages: local reconstruction (reconstruction of hits and segments in individual chambers), Level-2 reconstruction, and Level-3 reconstruction. The Level-2 muon reconstruction uses only information from the muon system and is very similar to the offline standalone muon reconstruction. The Level-3 muon reconstruction adds information from the silicon tracker and shares many features with the offline global muon reconstruction. Since the Level-1 trigger used during CRAFT was configured to maximize the acceptance for cosmic muons [4] and neither Level-2 nor Level-3 selections were applied, the performance of the HLT algorithms can be studied offline in an unbiased way.
8.1 Level-2 muon reconstruction
The main difference between the Level-2 muon reconstruction and the offline standalone muon reconstruction lies in the seeding algorithms: Level-2 muon seeds are made using the information
2010 JINST 5 T03022
(GeV/c)
top Tp
10
10
210
3 bottomq≠
topq
Probability
-610
-510
-410
-310
-210
-110
1
muon system only global muon fit tracker only
tracker + first muon station
CMS 2008
Figure 21. Rate of charge misassignment as a function of pT of the tracker track reconstructed in the
top hemisphere, for standalone muons (squares), tracker tracks (triangles), global muons (circles), and the TPFMS refit (upside-down triangles).
available in the Level-1 trigger, while offline muon seeds are constructed from the muon segments reconstructed offline. At the time of the CRAFT data taking in 2008, the Level-1 DT trigger firmware had not yet been fully commissioned; as a consequence, the Level-2 seeds could be reconstructed reliably only in the bottom hemisphere of the detector, in the φ slice between −2.2 and −0.9 radians.
The efficiency of the Level-2 muon reconstruction algorithm was studied by selecting events with a good-quality tracker track in the top hemisphere and checking whether a Level-2 muon track was reconstructed in the bottom hemisphere. In order to ensure that the parameters of the reference track are well measured, the tracker track was required to be in the barrel region (|η| < 0.8) and to have at least 10 hits in the silicon-strip tracker and at least 1 hit in the pixel detector. Muons with a topology similar to that expected in beam collisions at the LHC were selected by requiring that the distance between the point of closest approach to the beam line and the nominal position of pp interactions did not exceed 10 cm in r and 30 cm in z. The only modification to the standard Level-2 reconstruction algorithm made for this study was the removal of the beam-spot constraint in the final track fit. The final sample contained about 100 000 events.
Figure 22 shows the efficiencies of the seeding and trajectory-building steps of the Level-2 reconstruction, as well as of the full Level-2 reconstruction algorithm, as a function of pT of the
reference track at the PCA. For comparison, the corresponding efficiencies of the default offline standalone muon reconstruction (ppSTA) in the same φ − η detector region, also calculated relative to the tracker tracks and with the beam-spot constraint removed, are shown superimposed. The overall Level-2 efficiency reaches a plateau close to 100% for muons with pT above 5 GeV/c,
2010 JINST 5 T03022
(GeV/c) T p 0 20 40 60 80 100 120 140 160 Efficiency 0.8 0.85 0.9 0.95 1 CMS 2008 ppSTA Level-2 a) (GeV/c) T p 0 20 40 60 80 100 120 140 160 Efficiency 0.8 0.85 0.9 0.95 1 CMS 2008 ppSTA Level-2 b) (GeV/c) T p 0 20 40 60 80 100 120 140 160 Efficiency 0.8 0.85 0.9 0.95 1 CMS 2008 ppSTA Level-2 c) (GeV/c) T p 2 4 6 8 10 12 14 16 Efficiency 0 0.2 0.4 0.6 0.8 1 CMS 2008 ppSTA Level-2 d)Figure 22. a) Seeding, b) trajectory building, and c) overall efficiencies for Level-2 (open circles) and ppSTA
(filled squares) reconstruction algorithms as a function of tracker-track pT, for muons in the region defined
by |η| < 0.8 and −2.2 < φ < −0.9. Panel d) is a close-up view of the low-pTregion of the plot in c).
as expected, and remains very high up to pT values on the order of 60–70 GeV/c. The
Level-2 efficiency in this momentum region is ∼1% lower than the offline efficiency, because of the slightly less accurate seeding. At higher pT values, the Level-2 efficiency drops by a few per cent;
this efficiency reduction occurs mostly at the seeding step. 8.2 Level-3 muon reconstruction
The Level-3 muon reconstruction consists of three steps: seeding, trajectory building, and global matching and refitting. Three Level-3 algorithms differing in how the seeding step is performed are currently available: Inside-Out Hit-based (IOHit), In Hit-based (OIHit), and Outside-In State-based (OIState). Outside-In the IOHit algorithm, the initial trajectory seed is constructed from the innermost tracker (pixel) hits by proceeding from the interaction point towards the outer edge of the silicon tracker. Unlike the IOHit strategy, the OIHit algorithm forms the trajectory seed from the outermost tracker hits, and proceeds to collect hits for the fit from the outer edge of the tracker towards the center of the detector. The OIState algorithm does not use tracker hits for seeding: it builds the trajectory seed from the parameterization of the Level-2 muon trajectory extrapolated to the outermost layer of the tracker. The CRAFT data sample is used to study the efficiencies of these algorithms for muons resembling those produced in collisions at the LHC.