Plasma Sources Science and Technology
PAPER • OPEN ACCESS
Capacitively coupled hydrogen plasmas sustained
by tailored voltage waveforms: excitation dynamics
and ion flux asymmetry
To cite this article: B Bruneau et al 2016 Plasma Sources Sci. Technol. 25 045019
View the article online for updates and enhancements.
Related content
Effect of gas properties on the dynamics of the electrical slope asymmetry effect in capacitive plasmas: comparison of Ar, H2 and CF4
B Bruneau, T Lafleur, T Gans et al.
-Capacitively coupled hydrogen plasmas sustained by tailored voltage waveforms: vibrational kinetics and negative ions control
P Diomede, B Bruneau, S Longo et al.
-Control and optimization of the slope asymmetry effect in tailored voltage waveforms for capacitively coupled plasmas
B Bruneau, T Novikova, T Lafleur et al.
-Recent citations
Monte Carlo calculation of the potential energy surface for octahedral confined H$$_2^+$$2+
Savino Longo et al
-Heating mechanisms of magnetized capacitively coupled argon plasmas excited by tailored voltage waveforms Shali Yang et al
-Current gain of a pulsed DC discharge in low-pressure gases
V.A. Lisovskiy et al
Introduction
Parallel plate capacitively coupled radio-frequency (CCRF) plasmas are commonly used for materials processing appli-cations such as the deposition and etching of thin films. Especially for deposition applications, large area reactors
are generally used, and only minimal geometrical asym-metry is present. When single-frequency (sinusoidal) exci-tation is used, the energy distribution of ions arriving at the reactor surfaces can then only be controlled by the RF power or the pressure, and will be identical on both electrodes (or electrode and substrate). However, the RF power also determines the deposition rate, and therefore cannot be used to independently vary the ion energy. Furthermore, changing the pressure will lead to significant changes in the deposition chemistry, and may cause the appearance of nanoparticles and
Plasma Sources Science and Technology
Capacitively coupled hydrogen plasmas
sustained by tailored voltage waveforms:
excitation dynamics and ion flux asymmetry
B Bruneau1, P Diomede2,3, D J Economou2, S Longo4, T Gans5,D O’Connell5, A Greb5, E Johnson1 and J-P Booth6 1 LPICM-CNRS, Ecole Polytechnique, Palaiseau 91128, France
2 Plasma Processing Laboratory, Department of Chemical & Biomolecular Engineering, University of Houston, Houston, TX 77204-4004, USA
3 FOM Institute DIFFER—Dutch Institute for Fundamental Energy Research, PO Box 6336, Eindhoven 5600 HH, The Netherlands
4 Dipartimento di Chimica, Universita’ degli Studi di Bari, via Orabona 4, Bari 70126, Italy
5 York Plasma Institute, Department of Physics, University of York, Heslington, York, YO10 5DD, UK 6 LPP, Ecole Polytechnique-CNRS-Univ Paris-Sud-UPMC, Palaiseau 91128, France
E-mail: [email protected]
Received 10 February 2016, revised 9 May 2016 Accepted for publication 14 June 2016
Published 8 July 2016
Abstract
Parallel plate capacitively coupled plasmas in hydrogen at relatively high pressure (~1 Torr) are excited with tailored voltage waveforms containing up to five frequencies. Predictions of a hybrid model combining a particle-in-cell simulation with Monte Carlo collisions and a fluid model are compared to phase resolved optical emission spectroscopy measurements, yielding information on the dynamics of the excitation rate in these discharges. When the discharge is excited with amplitude asymmetric waveforms, the discharge becomes electrically asymmetric, with different ion energies at each of the two electrodes. Unexpectedly, large differences in the H2+ fluxes to each of the two electrodes are caused by the different H3+
energies. When the discharge is excited with slope asymmetric waveforms, only weak electrical asymmetry of the discharge is observed. In this case, electron power absorption due to fast sheath expansion at one electrode is balanced by electron power absorption at the opposite electrode due to a strong electric field reversal.
Keywords: tailored voltage waveforms, electrical asymmetry effect, capacitively coupled plasmas, hydrogen discharge, discharge asymmetry, PIC simulations, PROES
(Some figures may appear in colour only in the online journal) B Bruneau et al Printed in the UK 045019 PSTEEU © 2016 IOP Publishing Ltd 2016 25
Plasma Sources Sci. Technol.
PSST
0963-0252
10.1088/0963-0252/25/4/045019
Paper
4
Plasma Sources Science and Technology IOP
Original content from this work may be used under the terms of the Creative Commons Attribution 3.0 licence. Any further distribution of this work must maintain attribution to the author(s) and the title of the work, journal citation and DOI.
doi:10.1088/0963-0252/25/4/045019
B Bruneau et al
2
powders in the plasma. However, with the use of plasma exci-tation by voltage waveforms comprising multiple frequencies, it is possible to control the ion energy, for example via the electrical asymmetry effect (EAE), independently of other plasma parameters [1–13] and in particular independently of the ion flux. According to an analytical model developed by Czarnetzki et al the self-bias, η [1–3], caused by the EAE can be expressed as: V V 1 m1 m2 η ε ε = − + + (1) where V m1 and V m2 are the maximum and the minimum (rela-tive to the temporal average) of the applied voltage wave-form VAC(t), respectively, and the symmetry parameter, ε, is
defined by: V V A A n n sg sp p g 2 sp sg ⎛ ⎝ ⎜ ⎞ ⎠ ⎟ ε = ≈ (2) where V sp and V sg are the maximum voltages across the sheaths at the powered and grounded electrodes, respectively, Ap and
Ag are the areas of the powered and the grounded electrodes,
and nsp and nsg are the respective mean ion densities in the sheaths. Whereas the EAE was originally proposed for wave-forms comprising only two harmonics, the pioneering work on ion energy control using multiple-harmonic waveforms of Wendt et al [14, 15] inspired the use of more complex Tailored Voltage Waveforms (TVWs) for plasma excitation to further
enhance the EAE [16]. Such waveforms can be described by the following expression [17]
V t V n k n k t 1cos k n AC 0 1 ( )=
∑
− + ( ω + Θ) = (3) where V0 is a voltage amplitude factor, n is the number ofhar-monics, (varied between one and five in this work), ω is the
angular frequency, here corresponding to a frequency f of 5 MHz (ω = 2πf ), and Θ is a phase shift. V0 is set to give the desired
peak-to-peak voltage, VPP. TVWs therefore contain multiple
harmonics of the same fundamental frequency f. The phase shift Θ can be varied to control the amplitude asymmetry from a max-imum (Θ = 0), to a minmax-imum (Θ = π). Such waveforms, with
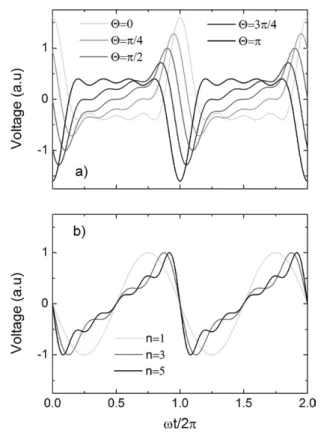
n = 4, are shown in figure 1(a) for different values of Θ. The harmonics’ amplitudes are chosen to maximize the amplitude asymmetry of the waveform (V m1/V m2) for Θ = 0 or π (when the waveforms are temporally symmetric) and therefore maximize the accessible range of DC self-bias according to equation (1). For other values of the phase shift the amplitude asymmetry is lower (and is non-existent for Θ = π/2), but the waveforms have temporal asymmetry, with differing rise and fall rates.
The use of waveforms that do not exhibit temporal sym-metry can produce unexpected dynamics in the plasma, as was recently shown for argon discharges [18–20]. Choosing the harmonics’ amplitudes to maximize this second type of wave-form asymmetry as follows:
( )= ±
∑
( )ω = V t V k k t 1sin k n AC 0 1 (4) produces waveforms that are approximations of sawtooths. The minus sign in equation (4) corresponds to sawtooth-up waveforms, while the plus sign corresponds to sawtooth-down waveforms. Such waveforms have slope asymmetry, increasing with the number of harmonics, n, but no amplitude asymmetry. The 1/k prefactors maximize the slope asymmetry for a given n. Such sawtooth-up waveforms with different values of n are shown in figure 1(b). Sawtooth waveforms cause fast sheath expansion and slow sheath contraction in front of one electrode, and slow sheath expansion and fast sheath contrac-tion in front of the opposite electrode [20]. As a consequence, a strong asymmetry of the ionization occurs in argon discharges, with larger ionization at the side where the sheath expands rap-idly. In relatively high pressure argon discharges a DC self-bias was also shown to appear, despite the absence of amplitude asymmetry (V m1 = − Vm2), and was attributed to different mean ion densities in the sheaths (ε ≠ 1 in equation (1)), leading to different ion fluxes at each of the electrodes.More recently, Bruneau et al [21] have studied the impact of waveforms with continuously changing amplitude and slope asymmetry, obtained by slightly shifting the higher fre-quencies from the harmonics. These waveforms are shown to control the shape of the ion flux distribution function, and in particular its width, while keeping the ion flux and mean ion energy constant. They are, however, not used in the present study.
Figure 1. (a) Waveforms according to equation (3) with different phase shifts Θ, for n = 4, (b) waveforms according to equation (4), corresponding to sawtooth-up waveforms, with different n, V0 is chosen to keep VPP equal to two.
Amplitude-asymmetric waveforms (defined by equation (3) with Θ = 0 or π) have been used to grow silicon thin films by PECVD [16, 22–25] including their application to solar cells [26–28]. Most of these studies used the standard discharge chemistry of silane highly diluted in hydrogen, with gas pres-sures in the Torr range. However, plasma studies of hydrogen discharges excited with TVWs are rather scarce [29–32]. There is hence a need to further study the impact of TVWs on hydrogen discharges under conditions relevant to those used in thin film deposition. In particular, attention should be paid to the spatiotemporal dynamics and not only the time-averaged values of the quantities of interest, since TVWs significantly alter the sheath motion within the RF cycle.
In the present work numerical simulations were carried out using a code developed by the Bari University group. This hybrid code was described in detail in [29, 33]. It self-consistently couples a PIC/MCC description for five charged species (H+, H+2, H3+, H− and electrons) with a reaction- diffusion fluid model for neutrals (15 vibrational levels of the electronic ground state of H2, and H atoms). The equations of
motion for the charged particles are integrated by using the leap-frog method and the electric field is calculated by solving the Poisson equation, with the space charge obtained from a first-order particle-grid interpolation. The field solver and the particle/Monte Carlo solver are coupled by matching the fixed PIC time step ∆t with the values of the times between collisions using the modified time step approach [34, 35]. The predictions of this code were recently compared to experimental results in the case of TVWs [29], using Θ = 0 or π in equation (3), with n being varied from 1–3. The simulated ion flux distribution func-tions (IFDFs) were shown to be in good agreement with those measured experimentally with a quadrupole mass spectrometer (QMS) coupled with an ion energy analyser.
In the present work, the predictions of this hybrid simulation are compared to phase resolved optical emission spectroscopy (PROES) measurements. The experimental setup was pre-sented in [20]. A reactor with an inter-electrode gap of 2.5 cm
was made geometrically symmetric by adding a thick Teflon ring (inner diameter 10 cm), fitted with a 2.5 × 2.5 × 10 cm window of borosilicate glass to allow optical access. The window is placed so that its edges are aligned with the two electrodes. A working pressure of 900 mTorr was used in all experiments, as measured outside the plasma chamber, and the gas flow was kept low to avoid over-pressure inside. The voltage waveform was generated using a computer-controlled arbitrary function generator (AFG) and wideband power amplifier as described previously [16]. The actual waveform at the electrode was monitored by a high voltage probe, and was corrected for distortion using a feedback loop as proposed by Patterson et al [15]. An intensified CCD camera (Andor iStar) was synchronized to the AFG, and the phase varied using a delay generator. The intensifier gate of the ICCD camera was 2 ns, therefore giving 100 images within one RF-cycle for a fundamental frequency of 5 MHz. The excitation rate at each position and phase was deconvoluted from the measured
Hα emission at 656 nm, using the method proposed in [36],
and was compared to the H(n = 3) excitation rate given by the simulations. Although two different processes are com-pared, these processes have similar energy thresholds and will therefore probe in a comparable way the high energy electron population. This strategy therefore limits us to a qualitative comparison of the dynamics of energetic electrons.
In the following, first the effect of amplitude-asymmetric waveforms (defined by equation (3)) on hydrogen discharges is investigated, and then we focus on the effect of slope-asym-metric waveforms (defined by equation (4)). In both cases the simulated excitation rates and the DC self-bias are compared to experiments. Furthermore the simulations are used to inves-tigate the effect of TVWs on the ion flux and ion flux distribu-tion funcdistribu-tion (IFDF) at each electrode.
Results
Amplitude asymmetry
In the following section, waveforms according to equation (3) are used, with n = 4, i.e. corresponding to the waveforms shown in figure 1(a). The phase shift Θ is varied from 0 to π in order to vary the amplitude asymmetry of the waveform. The neutral gas pressure is kept constant at 900 mTorr, and
V0 is kept constant at 112 V (giving a peak-to-peak voltage
VPP = 350 V for Θ = 0).
As a first comparison between the experiments and the simulations, figure 2 shows the DC self-bias η, exper imentally
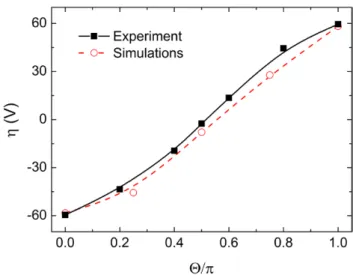
measured (black solid line and squares) and obtained from simulations (red dashed line and circles) for a phase shift Θ varying from 0 to π. The experimental values have been shifted by +6 V (mean value of the DC self-biases measured for Θ = 0 and Θ = π) to correct for a small remaining geo-metrical asymmetry. The agreement between the simulations and experiments is excellent for all values of Θ. The increase of the DC self-bias with Θ is almost linear, as can be expected from equation (1) and from the variation of V m1 and V m2 with Θ in equation (3).
Figure 2. DC self-bias η as a function of the phase shift Θ; the red dashed line and circles represent the results of PIC simulations, while the black solid line and squares represent the experimental data. Lines are a guide to the eye.
B Bruneau et al
4
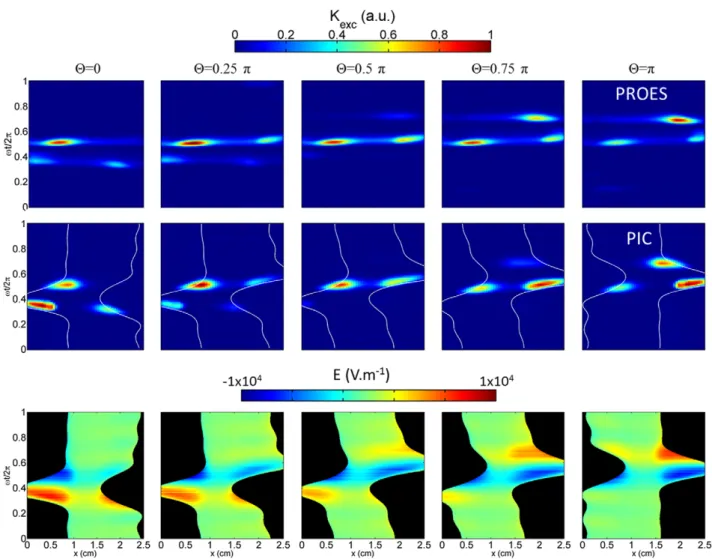
Figure 3 shows the H(n = 3) excitation rate obtained from the optical emission of the Hα line at 656 nm (top row),
and the simulated excitation rate (middle row) for different phase shifts Θ. The x-axis represents position (with the pow-ered electrode at x = 0 cm and the grounded electrode at
x = 2.5 cm), while the y-axis represents time and spans one fundamental RF cycle. For both the experiments and the simu-lations, all images are normalized to the maximum intensity observed for the Θ = 0 case. The sheath edge position, as determined by the Brinkmann criterion [37], is shown as a white line. Also shown is the dynamics of the electric field outside of the sheath regions (the latter areas being shown in black) obtained from the simulations (bottom row). As one can see by comparing the two first rows of the figures, the general excitation features observed in the experiment are qualitatively well reproduced by the simulations. However, the relative amplitudes of individual excitation features differ slightly between the experiments and the simulations. In part-icular, excitation rates occurring during fast sheath collapses are generally overestimated by the simulations.
Focusing first on the Θ = 0 case and starting at the begin-ning of the RF cycle, a first excitation peak appears when the
sheath close to the grounded electrode expands. This excita-tion is due to electron power absorpexcita-tion by sheath expansion, which can be described by the hard-wall model introduced by Godyak [38, 39]. Almost simultaneously, another peak appears close to the powered electrode as the sheath at this electrode contracts. This phenomenon occurs in hydrogen plasmas due to the generation of a significant electric field reversal (i.e. one that accelerates electrons from the plasma bulk towards the electrode) when the sheath collapses, as appears in the image in the bottom row (the field reversal at the powered electrode appears in red). This field reversal occurs because the motion of electrons is hindered by col-lisions, and therefore a significant (reversed) electric field is necessary to accelerate the electrons to the electrode and balance the escaping ion current [40]. It only occurs close to the powered electrode since the sheath is fully expanded for most of the RF cycle, and therefore the electrons have to reach the electrode within a limited time between the sheath con-traction and expansion. These electrons can then efficiently excite, or ionize, the gas. In contrast, at the grounded electrode the sheath is fully contracted for most of the RF cycle, and therefore almost no field reversal is needed to ensure current Figure 3. Spatio-temporal excitation rates derived from measurement of the emission line at 656 nm using PROES (top row), and from PIC simulations (middle row), and predicted bulk electric field (bottom row) using waveforms with n = 4 frequencies, for different Θ from 0 (left) to π (right); the excitation rates are normalized to the global maximum of the case Θ = 0.
balance. These results are consistent with simulation results by Mohr et al [30], for two-frequency driven plasmas, where such excitation due to field reversal was predicted. Following these two quasi-simultaneous excitation peaks, a final one is caused by the fast sheath expansion at the powered electrode. The amplitude of this excitation peak is larger than that occur-ring duoccur-ring sheath expansion at the grounded electrode, and is similar to that observed in argon at high pressure [5].
As previously stated, the excitation rate due to field reversal is generally overestimated by the simulations. A likely origin of this is that simulations usually underestimate the electron density [29], and therefore a larger field reversal is needed to balance the ion flux in the simulations in comparison to the experiments. This larger field reversal in the simulations would accelerate the electrons more strongly, leading to an overestimation of the excitation rate.
Further considering figure 3, one can clearly see that the excitation rate is spatially asymmetric in all cases, and that this asymmetry depends on Θ. As a consequence, the ion flux to each of the two electrodes should be different. Figure 4 shows the ion flux ratio, i.e. the ion flux at the powered electrode divided by the ion flux at the grounded electrode, for three spe-cies H3+ (black square), H+2 (red circles), and H+ (blue triangles).
Note that the y-axis is in log scale. It is clear that the total ion flux, which is approximately equal to the H3+ ion flux (since H+3
is by far the dominant species) is different on the two electrodes for Θ = 0. The ion flux is about three times higher at the pow-ered electrode for this waveform. The ion flux ratio decreases with Θ. It is close to unity for Θ = π/2, and the reason for that will be studied in the next section. For Θ = π, the ion flux is three times higher at the grounded electrode, i.e. the inverse of the Θ = 0 case. This is to be expected, as a waveform corresp-onding to Θ = π is equivalent to swapping the electrodes for a waveform corresponding to Θ = 0. These results show that, at this relatively high pressure (compared to [29]), it is not pos-sible to vary the ion energy independently of the ion flux using
the phase shift Θ, similarly to what was observed in Ar [3]. This is in contrast with the low pressure case [29], where the ion flux remains almost constant when varying Θ.
Surprisingly, whereas the flux ratio for H+ ions is very
similar to that for H3+, it is significantly different for H+2 ions. Indeed, for this species, the ion flux ratio is about 50 for Θ = 0, (compared to ~3 for the other two). The trend of the ion flux ratio for H+2 ions with Θ is similar to the other species, but has a much larger value.
This behavior of the H2+ ion flux ratio can be explained in terms of its creation pathway. H+2 ions are mainly created within the sheath by collisions between energetic H3+ ions and the neutral gas. The reaction rate depends strongly on the H+3
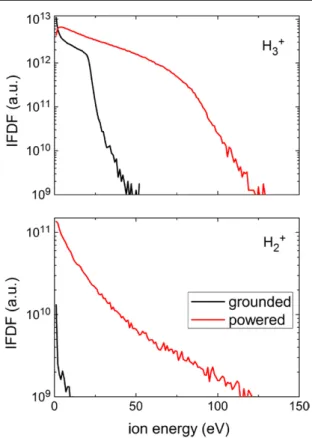
energy, with an energy threshold of about 18 eV [41]. Figure 5
shows the ion flux distribution function (IFDF) for H3+ (top) and H2+ (bottom), at the powered (red line) and grounded (black line) electrodes, for a waveform corresponding to Θ = 0. Note that the IFDF is shown in log scale. The unit for the IFDF is a number of counts over a certain average time in the simulations. As a consequence, the IFDF for H+3
and for H2+ can be compared with each other. Ions with high energy (up to about 120 eV) are found at the powered elec-trode, whereas at the grounded elecelec-trode, the ion energy does not exceed 50 eV, consistent with the strong negative DC self-bias obtained with this waveform, (observed in figure 2). In addition, very few H3+ ions have an energy above 25 eV at the grounded electrode.
Figure 4. H+3 (black square), H+2 (red circles), and H+ (blue triangles) ratio of the flux at the powered electrode and the flux at the grounded electrode, as a function of Θ, predicted by the PIC simulations. Lines are a guide to the eye.
Figure 5. Ion flux distribution function (IFDF) for H+3 (top), and H+2
(bottom) for a waveform corresponding to Θ = 0, determined by the PIC simulations.
B Bruneau et al
6
Integrating the IFDF for ion energies above 18 eV gives an indication of the number of H3+ ions with energies suf-ficient to create H2+ ions via collisions with neutral H2
mol-ecules. The ratio of this integral at the powered electrode to that at the grounded electrode is found to be about 15. The large difference in the number of H3+ ions with energies above 18 eV at the two electrodes is therefore the main cause for the large ion flux ratio observed in figure 4. Furthermore, the cross section for the H+2 creation reaction is about one order of magnitude higher for H3+ ion energy of 100 eV com-pared to an ion energy of 20 eV, hence the very energetic ions at the powered electrode will be even more efficient in producing H+2 ions.
In short, due to the strong dependence of the creation rate on ion energy, controlling the H3+ ion energy therefore allows the H2+ flux ratio to be controlled. This effect was not observed at lower pressure [29].
Slope asymmetry
In the following, waveforms according to equation (4), i.e. sawtooth waveforms, are used, and the number of frequen-cies composing the waveform n is varied to control the slope asymmetry of the waveform, as shown in figure 1(b). The neu-tral gas pressure is kept constant at 900 mTorr, and the peak-to-peak voltage VPP is kept at 350 V.
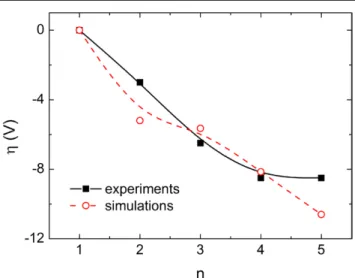
Figure 6 shows the DC self-bias η obtained in a H2
dis-charge excited with a sawtooth-up waveform with n = 1–5. Both the experimental data (black solid line and squares) and the results of simulations (red dashed line and circles) are shown. Experimental data are shifted by 1 V, corresponding to the DC self-bias for the case n = 1, to correct for the remaining geometrical asymmetry of the reactor. As one can see, the DC self-bias remains very low for all values of n. Indeed, it is much lower than the DC self-bias that was observed in Ar for similar conditions [19].
It was previously shown [18] that in Ar plasmas the DC self-bias obtained with sawtooth waveforms is strongly correlated to the ion flux ratio through equation (1), and therefore to the spatial asymmetry of the excitation rate. The low value of the DC self-bias in hydrogen can therefore be explained by the dynamics of the electron power absorption (reflected by the excitation rate). Figure 7 shows the excitation rate extracted from optical emis-sion of the Hα line at 656 nm (top row), and obtained from
simu-lations (middle row) for a discharge excited with a sawtooth-up waveform with n = 1 to 5 (from left to right). The images are normalized to the maximum of the case n = 5. The bottom row displays the dynamics of the electric field outside of the sheath regions. The scale is the same for the five images of the electric field. It should be noted that for low n, and particularly for n = 1, the time-averaged electron density (not shown) is significantly lower than the time-averaged ion density in the inter-electrode gap, which means that no quasi-neutral bulk plasma can be defined. In these conditions (low n) it is not clear whether the Brinkmann criterion used here is fully appropriate to describe the sheath edge and therefore one should proceed with caution when considering the edges displayed in figure 7. It is neverthe-less used for consistency with the results of the previous section. There is excellent agreement in the excitation rates between the simulations and the experiments, both in the observed features and in their relative amplitude. For n > 2, two excitation peaks can be observed; one close to the pow-ered electrode, immediately followed by another one close to the grounded electrode. Whereas the first excitation peak is due to the fast sheath expansion at the powered electrode, similar to the argon case [20], the second one occurs during the fast sheath contraction at the grounded electrode. This is due to the field reversal which appears at that time, as shown in the bottom row, and which accelerates the bulk electrons towards the grounded electrode. It should be mentioned that, although weaker, a field reversal also occurs at the grounded electrode when the sheath collapses. The intensity of these field reversals therefore only depends on how fast the sheath contracts. When the sheath at the powered electrode contracts rapidly, the electron thermal flux is too low to ensure current balance, and a high, reversed, electric field is necessary. In contrast, the sheath contraction at the grounded electrode is slow, and therefore a weaker reversed electric field is suf-ficient to ensure current balance. As one can see, this field reversal becomes stronger as n is increased, therefore bal-ancing the increase of the excitation from sheath expansion. As a consequence of these two excitation peaks, which are of similar amplitude for the conditions studied here, negligible discharge asymmetry occurs, hence the low DC self-bias observed in figure 6.
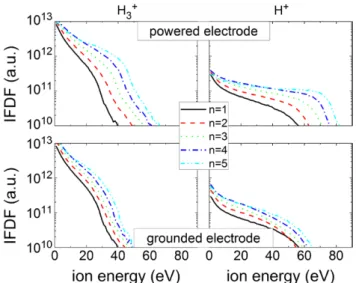
For all species, the ratio of the ion fluxes to the two elec-trodes (not shown) remains close to unity for all values of n. This is because the spatial asymmetry of the excitation rate is small for sawtooth-like waveforms, as can be inferred from figure 7. Figure 8 shows the predicted IFDF at the powered (top) and grounded (bottom) electrodes, for H3+ (left) and H+ (right) ions. For H
2
+ ions, the IFDF is simply an interme-diate case and is therefore not shown. When n is increased, Figure 6. DC self-bias voltage η, experimentally measured (solid
lines and full symbols), and obtained from PIC simulations (dashed lines and open symbols), as a function of n, for sawtooth-up waveforms. Lines are a guide to the eye.
the high energy tail of the IFDF increases more significantly at the powered electrode compared to the grounded elec-trode for both H+ and H+. This is because, as observed in
figure 7, the excitation peak at the grounded electrode side occurs in a region which is within the sheath for most of the cycle. Therefore, ions in this region are less accelerated than those close to the powered electrode, where the excitation peak occurs farther from the electrode.
In addition, under these conditions, the ion plasma frequen-cies of H+3 and H+ are about 2.5 MHz and 4.5 MHz, respectively, i.e. they are comparable to the fundamental frequency of 5 MHz. As a consequence, these ions are affected by the instantaneous potential to some extent, and not only the time-averaged poten-tial. Immediately after the excitation peak, ions close to the pow-ered electrode experience a fully extended sheath, while those close to the grounded electrode experience a fully collapsed sheath. As a consequence, the energy gain for the ions close to the powered electrode is greater than that for ions close to the grounded electrode. These two effects combine, explaining the difference in the high energy tail of the IFDFs at each electrode.
Conclusions
The impact of tailored voltage waveforms (TVWs) on par-allel plate capacitively coupled hydrogen discharges was investigated, focusing on the comparatively high pressure Figure 7. Excitation rate extracted from optical emission of the Hα line at 656 nm (top row), and obtained from PIC simulations (middle row), and predicted bulk electric field (bottom row) for a discharge excited with a sawtooth-up waveform with n = 1–5 (from left to right); the excitation rates are normalized by the maximum for the case n = 5.
Figure 8. Ion flux distribution function (IFDF) at the powered (top) and grounded (bottom) electrode, for H+3 (left), and H+ (right) ions, predicted by the PIC simulations for different values of n.
B Bruneau et al
8
(~1 Torr) regime, which is often used for thin film deposi-tion. Using amplitude asymmetric waveforms, it was found that strong field reversal occurs close to the electrode where the sheath is expanded for most of the RF cycle, i.e. where the highest ion energy is observed. As a consequence of this field reversal, higher ionization occurs close to this electrode, leading to higher ion flux. Therefore, the decoupling between ion flux and ion energy is limited under these conditions. Unexpectedly, it was found that a large ratio (~50) in the H+2 flux on the powered electrode compared to the grounded elec-trode is due to the difference in the H3+ energy distribution on the two electrodes. The main creation path for H2+ is collisions of H3+ ions with H2 molecules, and the rate of this process
increases strongly with H3+ energy, which was much higher on the powered electrode.
When the hydrogen discharge is excited with slope asym-metric waveforms, such as sawtooth waveforms, strong exci-tation is observed during the fast sheath expansion, as well as during the fast sheath contraction at the opposite electrode. The latter occurs due to a strong field reversal, which is needed to accelerate electrons from the plasma bulk to the electrode to balance the ion flux. As a consequence, only weak spatial asymmetry in the excitation rate is observed, and the ion flux to the two electrodes is similar.
The results of this work provide an improved understanding of the effect of TVWs on hydrogen discharges at relatively high pressure. They can be used to optimize the application of the electrical asymmetry effect in hydrogen-containing dis-charges used for surface modification of materials.
Acknowledgments
The authors would like to thank F Farci and P Bulkin for their help with the reactor used in this study. Work described in this paper was made possible by financial support from the ANR projects APOCALYPSO (ANR-13-PRGE-0003-01), CleanGRAPH (ANR-13-BS09-0019), the UK EPSRC (EP/ K018388/1 & EP/H003797/1), and the York-Paris Low Temper ature Plasma Collaborative Research Centre. B Bruneau was also supported by the Doctoral School of Ecole Poly-technique (EDX grant, Ecole Doctorale de l’X). P Diomede and D J Economou acknowledge support from the Depart-ment of Energy, Office of Fusion Energy Science, contract DE-SC0001939.
References
[1] Heil B G, Czarnetzki U, Brinkmann R P and Mussenbrock T 2008 On the possibility of making a geometrically symmetric RF-CCP discharge electrically asymmetric J. Phys. D: Appl. Phys. 41 165202
[2] Schulze J, Schüngel E, Czarnetzki U and Donkó Z 2009 Optimization of the electrical asymmetry effect in dual-frequency capacitively coupled radio dual-frequency discharges: experiment, simulation, and model J. Appl. Phys. 106 063307
[3] Donkó Z, Schulze J, Heil B G and Czarnetzki U 2009 PIC simulations of the separate control of ion flux and energy in
CCRF discharges via the electrical asymmetry effect J. Phys. D: Appl. Phys. 42 025205
[4] Korolov I, Donkó Z, Czarnetzki U and Schulze J 2012 The effect of the driving frequencies on the electrical asymmetry of dual-frequency capacitively coupled plasmas
J. Phys. D: Appl. Phys. 45 465205
[5] Lafleur T and Booth J P 2012 Control of the ion flux and ion energy in CCP discharges using non-sinusoidal voltage waveforms J. Phys. D: Appl. Phys. 45 395203
[6] Lafleur T, Delattre P A, Johnson E V and Booth J P 2012 Separate control of the ion flux and ion energy in capacitively coupled radio-frequency discharges using voltage waveform tailoring Appl. Phys. Lett. 101 124104
[7] Lafleur T, Boswell R W and Booth J P 2012 Enhanced sheath heating in capacitively coupled discharges due to non-sinusoidal voltage waveforms Appl. Phys. Lett. 100 194101
[8] Delattre P-A, Lafleur T, Johnson E and Booth J-P 2013 Radio-frequency capacitively coupled plasmas excited by tailored voltage waveforms: comparison of experiment and particle-in-cell simulations J. Phys. D: Appl. Phys. 46 235201
[9] Coumou D J, Clark D H, Kummerer T, Hopkins M, Sullivan D and Shannon S 2014 Ion energy distribution skew control using phase-locked harmonic RF bias drive IEEE Trans. Plasma Sci. 42 1880–93
[10] Zhang Y, Zafar A, Coumou D J, Shannon S C and
Kushner M J 2015 Control of ion energy distributions using phase shifting in multi-frequency capacitively coupled plasmas J. Appl. Phys. 117 233302
[11] Gibson A R, Greb A, Graham W G and Gans T 2015 Tailoring the nonlinear frequency coupling between odd harmonics for the optimisation of charged particle dynamics in capacitively coupled oxygen plasmas Appl. Phys. Lett. 106 054102
[12] Economou D J 2013 Tailored ion energy distributions on plasma electrodes J. Vac. Sci. Technol. A 31 050823
[13] O’Connell D, Gans T, Semmler E and Awakowicz P 2008 The role of the relative voltage and phase for frequency coupling in a dual-frequency capacitively coupled plasma Appl. Phys. Lett. 93 081502
[14] Wang S-B and Wendt A E 2000 Control of ion energy distribution at substrates during plasma processing J. Appl. Phys. 88 643–6
[15] Patterson M M, Chu H-Y and Wendt A E 2007 Arbitrary substrate voltage wave forms for manipulating energy distribution of bombarding ions during plasma processing Plasma Sources Sci. Technol. 16 257–64
[16] Johnson E V, Verbeke T, Vanel J-C and Booth J-P 2010 Nanocrystalline silicon film growth morphology control through RF waveform tailoring J. Phys. D: Appl. Phys. 43 412001
[17] Schulze J, Schüngel E, Donkó Z and Czarnetzki U 2011 The electrical asymmetry effect in multi-frequency capacitively coupled radio frequency discharges Plasma Sources Sci. Technol. 20 015017
[18] Bruneau B, Novikova T, Lafleur T, Booth J P and Johnson E V 2014 Ion flux asymmetry in radiofrequency capacitively-coupled plasmas excited by sawtooth-like waveforms Plasma Sources Sci. Technol. 23 065010
[19] Bruneau B, Novikova T, Lafleur T, Booth J P and
Johnson E V 2015 Control and optimization of the slope asymmetry effect in tailored voltage waveforms for capacitively coupled plasmas Plasma Sources Sci. Technol. 24 015021
[20] Bruneau B, Gans T, O’Connell D, Greb A, Johnson E V and Booth J-P 2015 Strong ionization asymmetry in a geometrically symmetric radio frequency capacitively coupled plasma induced by sawtooth voltage waveforms Phys. Rev. Lett. 114 125002
[21] Bruneau B, Lafleur T, Booth J-P and Johnson E 2016 Controlling the shape of the ion energy distribution at constant ion flux and constant mean ion energy with tailored voltage waveforms Plasma Sources Sci. Technol. 25 025006
[22] Johnson E V, Pouliquen S, Delattre P A and Booth J P 2011 Control of nanocrystalline silicon growth phase and deposition rate through voltage waveform tailoring during PECVD MRS Proc. 1339
[23] Bruneau B, Wang J, Dornstetter J-C and Johnson E V 2014 Growth mechanisms study of microcrystalline silicon deposited by SiH4/H2 plasma using tailored voltage waveforms J. Appl. Phys. 115 084901
[24] Hrunski D, Janssen A, Fritz T, Hegemann T, Clark C, Schreiber U and Grabosch G 2013 The influence of the electrical asymmetry effect on deposition uniformity of thin silicon film Thin Solid Films 532 56–9
[25] Bruneau B, Cariou R, Dornstetter J, Lepecq M, Maurice J, Roca i Cabarrocas P and Johnson E V 2014 Ion energy threshold in low-temperature silicon epitaxy for thin-film crystalline photovoltaics IEEE J. Photovolt. 4 1361–7
[26] Johnson E V, Delattre P A and Booth J P 2012 Microcrystalline silicon solar cells deposited using a plasma process excited by tailored voltage waveforms Appl. Phys. Lett. 100 133504
[27] Hrunski D et al 2013 Deposition of microcrystalline intrinsic silicon by the electrical asymmetry effect technique Vacuum 87 114–8
[28] Bruneau B, Lepecq M, Wang J, Dornstetter J, Maurice J and Johnson E V 2014 Effect of ion energy on microcrystalline silicon material and devices: a study using tailored voltage waveforms IEEE J. Photovolt. 4 1354–60
[29] Diomede P, Economou D J, Lafleur T, Booth J-P and Longo S 2014 Radio-frequency capacitively coupled plasmas in hydrogen excited by tailored voltage waveforms: comparison of simulations with experiments Plasma Sources Sci. Technol. 23 065049
[30] Mohr S, Schüngel E, Schulze J and Czarnetzki U 2013 Field reversals in electrically asymmetric capacitively coupled
radio-frequency discharges in hydrogen J. Phys. D: Appl. Phys. 46 435201
[31] Mohr S, Schungel E, Schulze J and Czarnetzki U 2014 Ion distribution functions in electrically asymmetric capacitively coupled radio-frequency discharges in hydrogen IEEE Trans. Plasma Sci. 42 2376–7
[32] Bruneau B et al 2016 Effect of gas properties on the dynamics of the electrical slope asymmetry effect in capacitive plasmas: comparison of Ar, H2 and CF4, Plasma Sources Sci. Technol. 25 01LT02
[33] Diomede P, Longo S, Economou D J and Capitelli M 2012 Hybrid simulation of a dc-enhanced radio-frequency capacitive discharge in hydrogen J. Phys. D: Appl. Phys. 45 175204
[34] Hockney R W and Eastwood J W 1988 Computer Simulation Using Particles (Boca Raton, FL: CRC Press)
[35] Longo S 2006 Monte Carlo simulation of charged species kinetics in weakly ionized gases Plasma Sources Sci. Technol. 15 S181–8
[36] Gans T, O’Connell D, Schulze-von der Gathen V and Waskoenig J 2010 The challenge of revealing and tailoring the dynamics of radio-frequency plasmas Plasma Sources Sci. Technol. 19 034010
[37] Brinkmann R P 2007 Beyond the step model: approximate expressions for the field in the plasma boundary sheath J. Appl. Phys. 102 093303
[38] Godyak V A 1972 Statistical heating of electrons at an oscillating plasma boundary Sov. Phys.—Tech. Phys.
16 1073–6
[39] Lieberman M A and Lichtenberg A J 2005 Principles of Plasma Discharges and Materials Processing (New York: Wiley) [40] Czarnetzki U, Luggenhölscher D and Döbele H F 1999 Space
and time resolved electric field measurements in helium and hydrogen RF-discharges Plasma Sources Sci. Technol. 8 230
[41] Phelps A V 1990 Cross sections and swarm coefficients for H+, H2+, H3+, H, H
2, and H− in H2 for energies from 0.1 eV–10 keV J. Phys. Chem. Ref. Data 19 653–75