Giuseppe Losurdo, Floriana Giorgio, Domenico Piscitelli, Lucia Montenegro, Claudia Covelli, Maria Grazia Fiore,
Antonio Giangaspero, Andrea Iannone, Mariabeatrice Principi, Annacinzia Amoruso, Michele Barone,
Alfredo Di Leo, Enzo Ierardi
Giuseppe Losurdo, Floriana Giorgio, Lucia Montenegro, Antonio Giangaspero, Andrea Iannone, Mariabeatrice Principi, Annacinzia Amoruso, Michele Barone, Alfredo Di Leo, Enzo Ierardi, Section of Gastroenterology, Department of Emergency and Organ Transplantation, University of Bari, 70124 Bari, Italy
Domenico Piscitelli, Claudia Covelli, Maria Grazia Fiore, Section of Pathology, Department of Emergency and Organ Transplantation, University of Bari, 70124 Bari, Italy
Author contributions: Principi M, Barone M, Di Leo A and Ierardi E conceived the study; Losurdo G, Montenegro L, Giangaspero A, Iannone A and Amoruso A collected the data; Piscitelli D, Covelli C and Fiore MG performed immunohistochemistry and pathological evaluations; Giorgio F performed molecular analysis; Losurdo G and Giorgio F performed statistical analysis; Principi M performed endoscopy; Losurdo G and Ierardi E wrote the manuscript; all authors read and approved the final version of the manuscript.
Institutional review board statement: The study was reviewed and approved after two meetings of all the authors (all affiliated to the same Department) before and after immune-histochemical and molecular analysis.
Institutional animal care and use committee statement: This study was not performed on experimental animals.
Informed consent statement: All study participants provided informed written consent prior to endoscopic investigation. Additional oral consent to perform immunohistochemistry and molecular analysis was obtained. No ethical committee approval was required because all invasive procedures had been performed according to the current clinical patient management.
Conflict-of-interest statement: No conflict of interest is declared by authors.
Data sharing statement: No additional data are available.
Moreover, the presented data are anonymized and risk of identification is low.
Open-Access: This article is an open-access article which was selected by an in-house editor and fully peer-reviewed by external reviewers. It is distributed in accordance with the Creative Commons Attribution Non Commercial (CC BY-NC 4.0) license, which permits others to distribute, remix, adapt, build upon this work non-commercially, and license their derivative works on different terms, provided the original work is properly cited and the use is non-commercial. See: http://creativecommons.org/ licenses/by-nc/4.0/
Manuscript source: Invited manuscript
Correspondence to: Enzo Ierardi, Professor, Section of Gastroenterology, Department of Emergency and Organ Transplantation, University of Bari, Piazza Giulio Cesare 11, 1, 70124 Bari, Italy. [email protected]
Telephone: +39-805-594034 Fax: +39-805-593088 Received: May 5, 2016
Peer-review started: May 6, 2016 First decision: June 20, 2016 Revised: June 30, 2016 Accepted: July 21, 2016 Article in press: July 21, 2016 Published online: September 21, 2016
Abstract
AIMTo evaluate mucosal baseline mRNA expression of tissue transglutaminase 2 (tTG2), interferon gamma (IFNγ), toll-like receptor 2 (TLR2) and Myeloid Differen-tiation factor 88 (MyD88) in patients with microscopic enteritis (ME).
ORIGINAL ARTICLE
DOI: 10.3748/wjg.v22.i35.8017 © 2016 Baishideng Publishing Group Inc. All rights reserved.
Basic Study
May the assessment of baseline mucosal molecular pattern
predict the development of gluten related disorders among
microscopic enteritis?
discriminate the development of CD from GS. MyD88 levels indicate that intestinal permeability is more increased when a severe intestinal damage underlies ME in both gluten related and unrelated conditions. Therefore, the results of the present paper do not seem to show a clear translational value.
Key words: Celiac disease; MyD88; Microscopic enteritis; Gluten sensitivity; Tissue transglutaminase; Interferon gamma; Toll-like receptor 2
© The Author(s) 2016. Published by Baishideng Publishing Group Inc. All rights reserved.
Core tip: Microscopic enteritis (ME) is an inflammatory condition, which is characterized by increased intraepithelial CD3 lymphocytes in the duodenum and can be due to both gluten and non-gluten related diseases. It is often difficult to achieve a final diagnosis in cases of ME, therefore the assessment of baseline mucosal molecular pattern may be helpful. In this study, we demonstrated that tissue transglutaminase and interferon gamma may predict the development of Celiac Disease more than Gluten Sensitivity with high specificity, despite an expected low sensitivity.
Losurdo G, Giorgio F, Piscitelli D, Montenegro L, Covelli C, Fiore MG, Giangaspero A, Iannone A, Principi M, Amoruso A, Barone M, Di Leo A, Ierardi E. May the assessment of baseline mucosal molecular pattern predict the development of gluten related disorders among microscopic enteritis? World J Gastroenterol 2016; 22(35): 8017-8025 Available from: URL: http://www.wjgnet.com/1007-9327/full/v22/i35/8017.htm DOI: http://dx.doi.org/10.3748/wjg.v22.i35.8017
INTRODUCTION
Duodenal lymphocytosis (DL) is a condition charac terized by a pathologic infiltration of lymphocytes in the epithelium (IELs) of duodenal mucosa[1]. It is not a single entity, since several conditions may underlie this picture. The main associated disorders may be gluten related (Celiac disease CD; Non celiac gluten sensitivity NCGS; and Wheat allergy WA) and nongluten related (Irritable bowel syndrome IBS; infectious or parasitic diseases; autoimmune disorders: vasculitides, connective tissue diseases and inflammatory bowel disease; immunoglobulin deficiencies; drug damage)[28]. Therefore, DL may be considered as an “umbrella term” rather than a single entity. Recently, the Bucharest Consensus has proposed “Microscopic enteritis (ME)” as an alternative term to DL, and has reviewed and standardized an algorithm for its diagnosis and treatment[9,10].
In the ME scenario, it is well known that CD is an autoimmune enteropathy triggered by the ingestion of gluten and represents the most common cause of METHODS
We retrospectively enrolled 89 patients with ME of different etiology, which was defined within a 2-year mean period of follow-up. Baseline histological examination was performed on Hematoxylin-Eosin stained sections and CD3 lymphocyte immunohis-tochemistry was used for intraepithelial lymphocyte count (IELs). ME was defined according to the criteria of Bucharest Consensus Conference. For each patient, formalin embedded biopsy samples of the duodenum referred to the period of ME diagnosis were retrieved. Real-time polymerase chain reaction (RT-PCR) was used to detect the amount of mRNA coding for tTG2, IFNγ, TLR2 and MyD88, and the quantity was expressed as fold change compared to controls. Control group was represented by duodenal normal specimens from 15 healthy subjects undergoing endoscopy for functional symptoms. Comparisons among continuous variables were performed by One way analysis of variance (ANOVA) and Bonferroni’s test. The
χ
2 test was used forcategorical variables. Pearson’s test was used to evaluate correlations. Receiver operating curves were drawn for all four markers to estimate sensitivity and specificity in discriminating the development of CD and GS.
RESULTS
After a period of follow up of 21.7 ± 11.7 mo, the following diagnoses were achieved: gluten related disorders in 48 subjects (31 CD; 17 GS) and non-gluten related ones in 41 (29 Irritable Bowel Syndrome - IBS; 12 Others). CD patients had the highest tTG2 levels (8.3 ± 4.5). The ANOVA plus Bonferroni analysis showed that CD > Other ME > GS = IBS > negative controls. A cut off value of 2.258 was able to discriminate between CD and GS with a sensitivity of 52.94% and a specificity of 87.1%. Additionally, CD patients had the highest IFNγ levels (8.5 ± 4.1). ANOVA plus Bonferroni demonstrated CD > Other ME > GS = IBS > negative controls. A cut off of 1.853 was able to differentiate CD and GS with a sensitivity of 47.06% and a specificity of 96.77%. Patients with non gluten-related causes of ME exhibited the highest TLR2 levels (6.1 ± 1.9) as follows: Other ME > CD = GS = IBS > negative controls. TLR2 was unable to discriminate CD from GS. Patients with CD overexpressed MyD88 levels similarly to non gluten-related causes of DL (7.8 ± 4.9 and 6.7 ± 2.9), thus CD = Other ME > GS = IBS > negative controls. A cut off of 3.722 was able to differentiate CD from GS with a sensitivity of 52.94% and a specificity of 74.19%. IELs count (15-25 and more than 25/100 enterocytes) strongly correlated with mRNA levels of all tested molecules (
P
< 0.0001).CONCLUSION
Our results confirm that a single marker is unable to predict a discrimination among ME underlying conditions as well as between CD and GS. Mucosal high levels of tTG and IFNγ mRNA may predict the development of CD more than GS with high specificity, despite an expected low sensitivity. TLR2 does not
intestinal malabsorption and villous atrophy[11]. NCGS [or simply gluten sensitivity (GS)] is a disorder showing intestinal and extraintestinal symptoms related to the ingestion of gluten containing food, in subjects not suffering from either CD or WA[12]. It is an emerging gluten related cause of ME and intestinal symptoms, with an increasing rate of diagnosis[13,14]. However, the spectrum of ME encompasses even non glutenrelated disorders. For instance, IBS may show increased IELs as well as organic diseases[1,15]. For this reason, it is often difficult to formulate a differential diagnosis in ME, and the diagnostic iter may be long and time consuming. This aspect is of relevance especially for GS, whose diagnosis is essentially clinical. Moreover, the clinical manifestations of GS often overlap with IBS, and this is a diagnostic challenge[16,17]. A previous experience of our group found that IELs count of 1525 IELs/100 enterocytes, autoimmune thyroiditis, folate deficiency and diarrhea may be predictive factors for GS[18], but a reliable marker has not been discovered yet despite the report that GS is characterized by the upregulation of tolllike receptor 2 (TLR2)[19].
In our experience, a IELs infiltrate > 15 per 100 enterocytes paralleled an enhanced expression of pro inflammatory cytokines, in particular interferon gamma (IFNγ), in subjects with suspected seronegative CD[20]. Therefore, a pro-inflammatory status may underlie CD-related ME and the intestinal assessment of baseline mucosal molecular pattern could likely give useful information about ME underlying conditions. In detail, tissue Transglutaminase 2 (tTG2), IFNγ, TLR2 and Myeloid Differentiation factor 88 (MyD88) have been suggested as potential targets in this field[19]. tTG2 is the main autoantigen involved in the pathogenesis of CD, and it has been demonstrated that it is over expressed in the mucosa of patients with CD[21,22]. IFNγ is a proinflammatory cytokine that is essential for innate and adaptive immunity against infections[23]. Aberrant IFNγ expression is associated with a number of autoinflammatory and autoimmune diseases, including CD[24]. TLR2 is a type of cellular receptor mainly invo lved in innate immunity, which has been proposed as a mediator of a potential inborn response to gliadin[25]. MyD88 is an adapter protein mediating intracellular pathways triggered by TLRs to activate the transcription factor NFκB[26]. Indeed, some gliadin peptides may bind TLR2 and drive the production of interleukin 1, a proinflammatory cytokine, through the mediation of MyD88[27]. Moreover, the MyD88 was found to be a key protein mediating the release of zonulin in response to gliadin, thus leading to an increase of mucosal permeability in CD[28]. Therefore, an increase of MyD88 may be considered as a marker of an alteration of intestinal barrier.
The aim of the present study was to investigate the duodenal mucosal transcriptomic expression of these four molecules in the prediction of ME underlying disorders at baseline, before a 2year followup mean
period, and to assess their potential accuracy in discriminating the development of CD and GS.
MATERIALS AND METHODS
Patients
We retrospectively enrolled 89 consecutive patients with ME followed up for a mean period of two years until a diagnosis was reached. ME was defined according to the criteria of the Bucharest Consensus Conference[9].
Follow-up strategies which allowed achieving final diagnosis have been described elsewhere[18]. In detail, CD was diagnosed if duodenal biopsy showed a micro scopic picture of Marsh 1 or higher, along with the positivity of IgA anti tissue transglutaminase 2 (anti tTG2) antibodies, according to current guidelines[29]. The diagnosis of GS was made according to the Salerno criteria[30]. Patients with IBS fulfilled the Rome
Ⅲ criteria and underwent a series of investigations (serology for CD, full blood count, folate, vitamin B12, serum protein electrophoresis with immunoglobulin subclasses, stool investigations, fecal occult blood test, calprotectin, urea/lactose/glucose breath test and, if necessary, colonoscopy with random biopsy samples) in order to rule out organic diseases[31]. Finally, patients with established nongluten related cause of ME (Helicobacter pylori infection, autoimmune disorders) were included.
We excluded subjects with immunoglobulin defi ciencies, which may show possible molecular dere gulation of duodenal mucosa. A group of 15 dyspeptic patients, undergoing upper endoscopy and duodenal biopsy without ME, represented the negative control group.
Histology and immunohistochemistry
For each patient, formalin embedded biopsy samples of the duodenum performed at baseline were retrieved. Histological examination had been carried out on HematoxylinEosin stained sections. Immunohis tochemistry of CD3 lymphocytes had been performed using monoclonal murine antibody (Novocastra Leica Biosystems Ltd, Newcastle, United Kingdom), according to the manufacturer’s instructions. In all subjects, IELs were counted in a field containing at least 1000 enterocytes and expressed as number per 100 ente rocytes. We selected biopsy specimens with at least 15 IELs/100 enterocytes to define ME, as established in previous reports[17,19]. The count was executed in the epithelial layer by two observers (DP and MGF) in a blinded fashion. Collection and processing was managed according to BRISQ recommendations[32].
Molecular analysis
Real time polymerase chain reaction (RTPCR) was used to detect the amount of mRNA coding for tTG2, IFNγ, TLR2 and MyD88 in duodenal mucosa. As wellstated, mRNA levels were expressed as foldchange compared
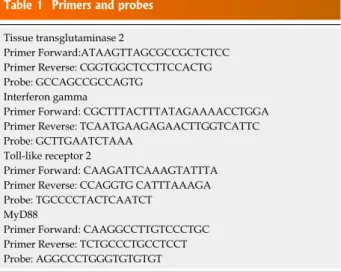
System (Applied Biosystems). A standard curve plus validation experiment was performed for each primer/ probe set. The reference gene was represented by glyceraldehydes3phosphate dehydrogenase. Primers and probes are reported in Table 1.
Statistical analysis
Comparisons among continuous data obtained in our groups of patients were performed by one way analysis of variance (ANOVA) and Bonferroni’s test as posthoc analysis to compare headto head each group. The
χ
2 test was used for categorical variables. Values of P < 0.05 were considered significant. Receiver operating curves (ROC) were drawn to estimate sensitivity and specificity of tTG2, IFNγ, TLR2 and MyD88. Correlations between IELs count, tTG2, IFNγ, TLR2 and MyD88 were assessed by Pearson’s test. Diagnostic agreement for the IEL count was tested by calculating the weighted Cohen’s k coefficient interpreted in accordance with the Landis and Koch benchmarks, whereby a value of more than 0.8 indicated excellent agreement. Statistical analyses were performed using the statistical software GraphPad Prism version 5.00 for Windows (GraphPad Software, San Diego, CA, United States).RESULTS
Patients baseline features
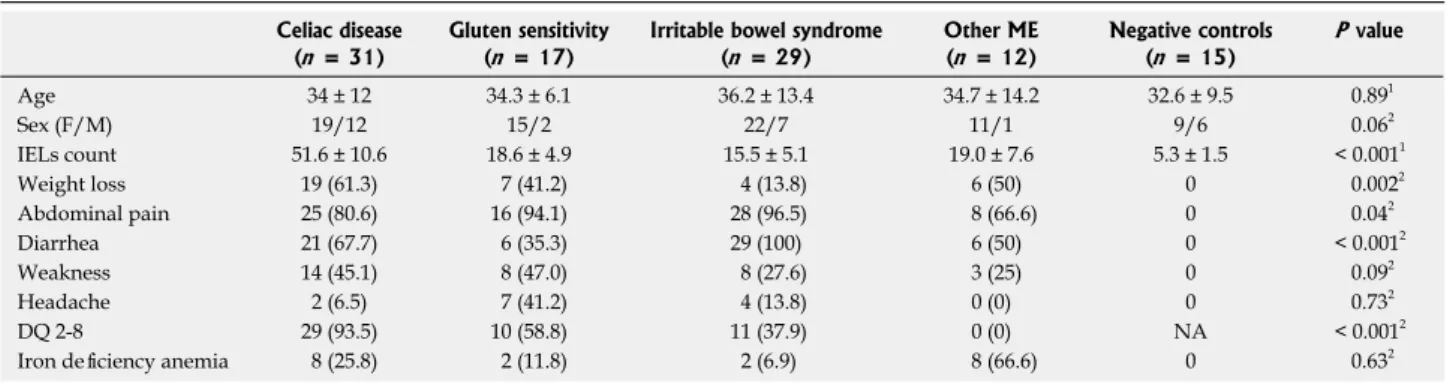
We enrolled 89 patients with ME. After the follow up the following diagnoses were observed: 31 CD, 17 GS, 29 IBS and 12 other non glutenrelated ME. Among the 12 non glutenrelated ME, 4 had small bowel Crohn’s disease, 6 H. pylori infection, 1 scleroderma and 1 lymphocytic colitis. The most relevant clinical, demographic and histopathological characteristics are summarized in Table 2. A good agreement among pathologists was achieved (k = 0.86, 95%CI: 0.750.91). The IELs count, DQ 2 or 8 positivity and the presence of weight loss, abdominal pain and diarrhea were the most important discriminating factors between CD, GS and nonglutenrelated diseases (Table 2). Villous atrophy (Marsh 3 stage) was found in 14 out of 31 CD patients, Marsh 2 in 3 and Marsh 1 in 14 patients.
tTG2
The mucosal expression of mRNAtTG2 is represented in Figure 1A. In detail, CD patients had the highest levels (8.3 ± 4.5) compared to GS (3.6 ± 2.7), IBS (3.5 ± 1.8), other ME (5.3 ± 2.3) and negative controls (1.001 ± 0.089). The ANOVA plus Bonferroni analysis showed that CD > Other ME > GS = IBS > negative controls.
The ROC curve analysis, displayed in Figure 1B showed that a cut off of 2.258 was able to discriminate between CD and GS with a low sensitivity (52.94%) and a good specificity (87.1%; AUC = 0.804).
to controls. The relative expression of the studied gene levels was calculated with the 2-ΔΔCT method. RNA was extracted from at least 5, 10 µm sections of paraffin block using the RNeasy FFPE Kit (Qiagen, GmbH, Heidelberg, Germany), specifically designed for the purification of total RNA from formalinfixed paraffinembedded (FFPE) tissue sections, according to a validated protocol[33]. Five hundred microliters (µL) of xylene were added to the sections to yield a solution that was vortexed for 10s and then incubated for 10 min at room temperature (25 ℃). This step was repeated twice. Subsequently, 500 µL of absolute ethanol was added and the novel solution was again vortexed vigorously for 10 s and centrifuged for 2 min at 11000 rpm in order to remove residual xylene. The supernatant was carefully removed by pipetting without disturbing the pellet. Finally, the mRNA concentrations were estimated by ultraviolet absorbance at 260/280 nm. We performed the agarose formaldehyde gel run to confirm the RNA integrity. Imaging analysis after this procedure was performed with the BioRad Chemidoch Analyzer (BioRad Laboratories S. r. l., Milan, Italy). Aliquots of total mRNA (1 mg) were reverse transcribed using random hexamers and TaqMan Reverse Transcription Reagents (Applied Biosystems, Foster City, CA, United States) in a final volume of 50 µL. Two step reverse transcription PCR was performed using the firststrand cDNA with a final concentration of 1 × TaqMan gene expression assay, i.e., the analyzed molecules and glyceraldehyde 3 phosphate dehydrogenase as reference gene (Applied Biosystems, Foster City, CA). The final reaction volume was 25 µL and analyzed in triplicate (all experiments were repeated twice). A non template control (Rnase free water) was included on every plate. Our method was further validated by including in each assay fresh samples from three normal patients, frozen at 90 ℃ until the analysis. These samples were treated with the same technique as the paraffin embedded samples, except for the paraffin removal and rehydration procedures. Specific thermal cycler conditions were employed using a real time PCR
Table 1 Primers and probes Tissue transglutaminase 2
Primer Forward:ATAAGTTAGCGCCGCTCTCC Primer Reverse: CGGTGGCTCCTTCCACTG Probe: GCCAGCCGCCAGTG
Interferon gamma
Primer Forward: CGCTTTACTTTATAGAAAACCTGGA Primer Reverse: TCAATGAAGAGAACTTGGTCATTC Probe: GCTTGAATCTAAA
Toll-like receptor 2
Primer Forward: CAAGATTCAAAGTATTTA Primer Reverse: CCAGGTG CATTTAAAGA Probe: TGCCCCTACTCAATCT
MyD88
Primer Forward: CAAGGCCTTGTCCCTGC Primer Reverse: TCTGCCCTGCCTCCT Probe: AGGCCCTGGGTGTGTGT
IFN
γ
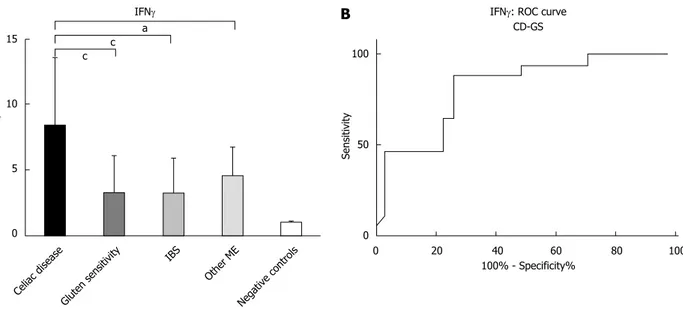
The mucosal expression of mRNAIFNγ is displayed in Figure 2A. We observed that CD patients had the highest levels (8.5 ± 4.1) compared to GS (3.3 ± 2.8), IBS (3.3 ± 2.6), other ME (4.6 ± 2.1) and negative controls (1.001 ± 0.15). The ANOVA plus Bonferroni analysis showed that CD > Other ME > GS = IBS > negative controls.
The analysis of ROC curve (Figure 2B) showed that a cut off of 1.853 was able to differentiate CD and GS with a sensitivity of 47.06% and a specificity of 96.77%, with an AUC of 0.816.
TLR2
The mucosal expression of mRNATLR2 is represented in Figure 3. Patients with non glutenrelated causes of ME were characterized by the highest levels (6.1 ± 1.9), greater than GS (3.1 ± 1.8), IBS (3.5 ± 2.0), CD (4.1 ± 2.4) and negative controls (1.006 ± 0.18). The ANOVA plus Bonferroni analysis showed that Other ME > CD = GS = IBS > negative controls.
MyD88
The mucosal expression of mRNAMyD88 is re presented in Figure 4A. Patients with CD expressed levels similar as non glutenrelated causes of ME (7.8 ± 4.9 and 6.7 ± 2.9), higher than GS (4.2 ± 2.3), IBS (4.3 ± 2.4), and negative controls (0.99 ± 0.17). The ANOVA plus Bonferroni analysis demonstrated that CD = Other ME > GS = IBS > negative controls.
The analysis of ROC curve (Figure 4B) showed that a cut off of 3.722 was able to differentiate CD and GS with a sensitivity of 52.94% and a specificity of 74.19%, with an AUC of 0.712.
Correlation between IELs count and transcriptome
analysis
In all cases, the IELs count correlated with mRNA levels with a strong significance (P < 0.0001). The expression of tTG2 directly correlated to IELs (r = 0.66, 95%CI: 0.530.76). IFNγ showed a similar pattern, with an r = 0.56, 95%CI: 0.420.68. A less relevant, despite significant correlation, was found for TLR2 (r Table 2 Main demographic, clinical and pathologic features of enrolled patients
Celiac disease (n = 31)
Gluten sensitivity (n = 17)
Irritable bowel syndrome (n = 29) Other ME (n = 12) Negative controls (n = 15) P value Age 34 ± 12 34.3 ± 6.1 36.2 ± 13.4 34.7 ± 14.2 32.6 ± 9.5 0.891 Sex (F/M) 19/12 15/2 22/7 11/1 9/6 0.062 IELs count 51.6 ± 10.6 18.6 ± 4.9 15.5 ± 5.1 19.0 ± 7.6 5.3 ± 1.5 < 0.0011 Weight loss 19 (61.3) 7 (41.2) 4 (13.8) 6 (50) 0 0.0022 Abdominal pain 25 (80.6) 16 (94.1) 28 (96.5) 8 (66.6) 0 0.042 Diarrhea 21 (67.7) 6 (35.3) 29 (100) 6 (50) 0 < 0.0012 Weakness 14 (45.1) 8 (47.0) 8 (27.6) 3 (25) 0 0.092 Headache 2 (6.5) 7 (41.2) 4 (13.8) 0 (0) 0 0.732 DQ 2-8 29 (93.5) 10 (58.8) 11 (37.9) 0 (0) NA < 0.0012
Iron deficiency anemia 8 (25.8) 2 (11.8) 2 (6.9) 8 (66.6) 0 0.632 1ANOVA test; 2χ2 test for trend. NA: Not available.
Figure 1 Pattern of mucosal expression of tTG2-mRNA in subjects with different causes of microscopic enteritis. A: ANOVA plus Bonferroni analysis showed that CD > Other ME > GS = IBS > negative controls, aP < 0.05, cP < 0.001; B: ROC curve of CD vs GS comparison is reported. ROC: Receiver operating curves.
100 50 0 Sensitivity 0 20 40 60 80 100 100% - Specificity% ROC of tTG2 CD-GS 15 10 5 0 Fold change c c a Celiac disease Gluten sensitivity IBS Other ME Negative controls tTG2
A
B
= 0.32, 95%CI: 0.130.48) and for MyD88 (r = 0.49, 95%CI: 0.330.63).
DISCUSSION
ME often represents a diagnostic dilemma, therefore a careful algorithm should be applied in such cases to achieve the final diagnosis[9,18]. IELs infiltrate re presents the only common denominator; therefore, in our series we selected only subjects showing IELs levels higher than 15/100 enterocytes, independently from ME etiology. This cutoff value was associated with molecular mucosal changes suggestive of inflam-matory damage/repair in our experience[20]. IELs
infiltrate is a well known feature of GS and CD[34,35], but it has been described even in patients with duodenal involvement in systemic disorders[36]. IBS may show an increased IELs infiltrate, thus confirming that it cannot be considered only as a functional entity[37]. In a previous experience of our group, we demonstrated a positive correlation between the amount of IELs infiltrate and the mucosal expression of tTG2 and IFNγ in patients with seronegative suspected CD[20,38]. In the present study, moreover, we confirmed that IELs infiltrate parallels mucosal molecular expression, more markedly for tTG2 and IFNγ, but also for TLR2 and MyD88. Therefore, our results demonstrate that ME clearly underlies a local inflammatory status.
tTG2 is the main autoantigen involved in CD pathogenesis[21], however it is an enzyme essential for the process of wound healing and tissue repa ration, since it is able to create crosslinks between peptides[39]. For this reason, tTG2 is overexpressed not only in glutenrelated disorders, but even in all pathological conditions that induce mucosal injury, as confirmed in the present study. In our analysis, we reported that tTG2 has a good performance in the comparison between CD and GS or IBS. This detail could be useful especially in the subgroup of subjects with IBS who show positivity of antitTG antibodies, without histological evidence of CD[40]. Moreover, our result may explain the reason of a fourfold increased risk of CD in subjects with IBS[41]. A pattern similar to tTG was found for IFNγ. Indeed, patients with CD show the upregulation of IELssecreted IFNγ. This ability has been demonstrated even in peripheral T lymphocytes of CD patients, which are able to produce high IFNγ levels when stimulated by gliadin peptides[42,43]. For these reasons, tTG2 and IFNγ could represent a good diagnostic tool in gluten relateddisorders. In summary, we found a high specificity of tTG2 and IFNγ, Figure 2 Pattern of mucosal expression of interferon gammaγ-mRNA in subjects with different causes of microscopic enteritis. A: ANOVA plus Bonferroni analysis showed that CD > Other ME > GS = IBS > negative control, aP < 0.05, cP < 0.001; B: ROC curve of CD vs GS comparison is reported. ROC: Receiver
operating curves. 15 10 5 0 Fold change c c a Celiac disease Gluten sensitivity IBS Other ME Negative controls IFNγ
A
100 50 0 Sensitivity 0 20 40 60 80 100 100% - Specificity%IFNγ: ROC curve CD-GS
B
10 8 6 4 2 0 Fold change b b a Celiac disease Gluten sensitivity IBS Other ME Negative controls TLR2Figure 3 Pattern of mucosal expression of toll-like receptor 2-mRNA in subjects with different causes of microscopic enteritis. ANOVA plus Bonferroni analysis showed that Other ME > CD = GS = IBS > negative controls, aP < 0.05, bP < 0.01.
despite an expected low sensitivity, in discriminating CD from GS development. The expression of these molecules in GS has been poorly explored until now and available data are controversial. Some reports have shown an IFNγ overexpression in GS similar to CD[44], while others described a marked increase only in CD[19]. In the present study, we have found that high levels of IFNγ are more predictive of CD than GS.
TLR2 is a receptor involved in the innate immune response against nonself antigens. It has been demon strated that some gliadin peptides may bind such receptor and address the production of interleukin 1, a proinflammatory cytokine, trough the mediation of MyD88[27]. Moreover, MyD88 was found to be a key protein mediating the release of zonulin in response to gliadin, thus leading to an increase of mucosal permeability in CD[28]. In a previous report[19], patients with GS expressed higher levels of TLR2 than subjects with CD. However, we found that ME had similar baseline mRNA levels encoding for TLR2, independently from the successive development of CD or GS within a twoyear period. Surprisingly, in our series, non gluten related ME had the highest levels of TLR2. This finding could be related to the deep deregulation of TLRs, which has been described in IBD (a possible cause of non gluten related ME). Indeed, such receptors mediate the immune response against the microbiota, a phenomenon that has been claimed as a trigger in IBD pathogenesis[4547].
In regard to the molecular pattern of MyD88, similarly to TLR2, we found that patients with non gluten related causes of ME showed higher levels than IBS and GS, but comparable with CD. This finding suggests that a potential increase of intestinal permeability may be more marked when a severe intestinal damage underlies ME. On the other hand, MyD88 has been poorly investigated in CD. Eiró et al[48]
demonstrated that its increased expression paralleled mucosal TLR4 in CD. Therefore, MyD88 overexpression overtaking TLR2 may be explained by a MyD88 independent pathway for TLR2 in CD, as described by Junker et al[25].
In conclusion, our results suggest that a single marker is unable to discriminate the development of different ME underlying conditions as well as between CD and GS. High mucosal levels of tTG and IFNγ mRNA may predict the development of CD more than GS with high specificity. TLR2 does not discriminate the development of CD from GS. High MyD88 levels may indicate that intestinal permeability is more increased when a severe intestinal damage underlies ME (CD as well as Crohn’s disease). Finally, a reliable marker for GS diagnosis has not yet been found; however, further studies need to be addressed to evaluate whether the combination of different mucosal markers could help the differential diagnosis with CD and support the identification of doubtful cases of GS[49,50]. Therefore, the results of the present paper do not seem to show a clear translational value.
COMMENTS
Background
Microscopic enteritis is an inflammatory condition, which is characterized by increased intraepithelial CD3 lymphocytes in the duodenum and can be due to both gluten and non-gluten related diseases.
Research frontiers
The MyD88 was found to be a key protein mediating the release of zonulin in response to gliadin, thus leading to an increase of mucosal permeability in CD. Therefore, an increase of MyD88 may be considered as a marker of an alteration of intestinal barrier.
Innovations and breakthroughs
The authors demonstrated that tissue transglutaminase and interferon gamma Figure 4 Pattern of mucosal expression of MyD88-mRNA in subjects with different causes of duodenal lymphocytosis. A: ANOVA plus Bonferroni analysis showed that CD = Other ME > GS = IBS > negative controls, bP < 0.01; B: ROC curve of CD vs GS comparison is reported. ROC: Receiver operating curves.
15 10 5 0 Fold change b b Celiac disease Gluten sensitivity IBS Other ME Negative controls MyD88
A
100 50 0 Sensitivity 0 20 40 60 80 100 100% - Specificity% ROC of MyD88 CD-GSB
COMMENTS
may predict the development of Celiac Disease more than Gluten Sensitivity with high specificity, despite an expected low sensitivity.
Peer-review
This report seeks to distinguish among 4 causes of duodenal lymphocytosis (celiac disease, non-celiac gluten sensitivity, wheat allergy and irritable bowel syndrome) by retrospectively comparing the mRNA expression of tissue transglutaminase 2, interferon gamma, toll-like receptor 2 and myeloid differentiation factor 88 in duodenal biopsies from 89 patients obtained up to two years previously.
REFERENCES
1 Lauwers GY, Fasano A, Brown IS. Duodenal lymphocytosis with no or minimal enteropathy: much ado about nothing? Mod Pathol 2015; 28 Suppl 1: S22-S29 [PMID: 25560597 DOI: 10.1038/ modpathol.2014.135]
2 Aziz I, Key T, Goodwin JG, Sanders DS. Predictors for Celiac Disease in Adult Cases of Duodenal Intraepithelial Lymphocytosis. J Clin Gastroenterol 2015; 49: 477-482 [PMID: 25014240 DOI: 10.1097/MCG.0000000000000184]
3 Simondi D, Ribaldone DG, Bonagura GA, Foi S, Sapone N, Garavagno M, Villanacci V, Bernardi D, Pellicano R, Rizzetto M, Astegiano M. Helicobacter pylori in celiac disease and in duodenal intraepithelial lymphocytosis: Active protagonist or innocent bystander? Clin Res Hepatol Gastroenterol 2015; 39: 740-745 [PMID: 25956489 DOI: 10.1016/j.clinre.2015.03.005]
4 Losurdo G, Principi M, Di Leo A, Ierardi E. Letter: Helicobacter-negative gastritis--a distinct condition? Aliment Pharmacol Ther 2015; 41: 597-598 [PMID: 25659217 DOI: 10.1111/apt.13080] 5 Patterson ER, Shmidt E, Oxentenko AS, Enders FT, Smyrk
TC. Normal villous architecture with increased intraepithelial lymphocytes: a duodenal manifestation of Crohn disease. Am J Clin Pathol 2015; 143: 445-450 [PMID: 25696804 DOI: 10.1309/ AJCPBKQND4SHVX9Q]
6 Malamut G, Verkarre V, Suarez F, Viallard JF, Lascaux AS, Cosnes J, Bouhnik Y, Lambotte O, Béchade D, Ziol M, Lavergne A, Hermine O, Cerf-Bensussan N, Cellier C. The enteropathy associated with common variable immunodeficiency: the delineated frontiers with celiac disease. Am J Gastroenterol 2010; 105: 2262-2275 [PMID: 20551941 DOI: 10.1038/ajg.2010.214] 7 Giorgio F, Principi M, Losurdo G, Piscitelli D, Iannone A, Barone
M, Amoruso A, Ierardi E, Di Leo A. Seronegative Celiac Disease and Immunoglobulin Deficiency: Where to Look in the Submerged Iceberg? Nutrients 2015; 7: 7486-7504 [PMID: 26371035 DOI: 10.3390/nu7095350]
8 Ianiro G, Bibbò S, Montalto M, Ricci R, Gasbarrini A, Cammarota G. Systematic review: Sprue-like enteropathy associated with olmesartan. Aliment Pharmacol Ther 2014; 40: 16-23 [PMID: 24805127 DOI: 10.1111/apt.12780]
9 Rostami K, Aldulaimi D, Holmes G, Johnson MW, Robert M, Srivastava A, Fléjou JF, Sanders DS, Volta U, Derakhshan MH, Going JJ, Becheanu G, Catassi C, Danciu M, Materacki L, Ghafarzadegan K, Ishaq S, Rostami-Nejad M, Peña AS, Bassotti G, Marsh MN, Villanacci V. Microscopic enteritis: Bucharest consensus. World J Gastroenterol 2015; 21: 2593-2604 [PMID: 25759526 DOI: 10.3748/wjg.v21.i9.2593]
10 Rostami K, Villanacci V. Microscopic enteritis: novel prospect in coeliac disease clinical and immuno-histogenesis. Evolution in diagnostic and treatment strategies. Dig Liver Dis 2009; 41: 245-252 [PMID: 18657490 DOI: 10.1016/j.dld.2008.06.008] 11 Mooney PD, Hadjivassiliou M, Sanders DS. Coeliac disease. BMJ
2014; 348: g1561 [PMID: 24589518 DOI: 10.1136/bmj.g1561] 12 Catassi C, Bai JC, Bonaz B, Bouma G, Calabrò A, Carroccio A,
Castillejo G, Ciacci C, Cristofori F, Dolinsek J, Francavilla R, Elli L, Green P, Holtmeier W, Koehler P, Koletzko S, Meinhold C, Sanders D, Schumann M, Schuppan D, Ullrich R, Vécsei A, Volta U, Zevallos V, Sapone A, Fasano A. Non-Celiac Gluten sensitivity: the new frontier of gluten related disorders. Nutrients 2013; 5:
3839-3853 [PMID: 24077239 DOI: 10.3390/nu5103839]
13 Biesiekierski JR, Newnham ED, Shepherd SJ, Muir JG, Gibson PR. Characterization of Adults With a Self-Diagnosis of Nonceliac Gluten Sensitivity. Nutr Clin Pract 2014; 29: 504-509 [PMID: 24740495]
14 Francavilla R, Cristofori F, Castellaneta S, Polloni C, Albano V, Dellatte S, Indrio F, Cavallo L, Catassi C. Clinical, serologic, and histologic features of gluten sensitivity in children. J Pediatr 2014; 164: 463-7.e1 [PMID: 24252792 DOI: 10.1016/j.jpeds.2013.10.007] 15 Remes-Troche JM, Adames K, Castillo-Rodal AI, Ramírez T,
Barreto-Zuñiga R, López-Vidal Y, Uscanga LF. Intraepithelial gammadelta+ lymphocytes: a comparative study between celiac disease, small intestinal bacterial overgrowth, and irritable bowel syndrome. J Clin Gastroenterol 2007; 41: 671-676 [PMID: 17667051]
16 Makharia A, Catassi C, Makharia GK. The Overlap between Irritable Bowel Syndrome and Non-Celiac Gluten Sensitivity: A Clinical Dilemma. Nutrients 2015; 7: 10417-10426 [PMID: 26690475 DOI: 10.3390/nu7125541]
17 Shahbazkhani B, Sadeghi A, Malekzadeh R, Khatavi F, Etemadi M, Kalantri E, Rostami-Nejad M, Rostami K. Non-Celiac Gluten Sensitivity Has Narrowed the Spectrum of Irritable Bowel Syndrome: A Double-Blind Randomized Placebo-Controlled Trial. Nutrients 2015; 7: 4542-4554 [PMID: 26056920 DOI: 10.3390/ nu7064542]
18 Losurdo G, Piscitelli D, Giangaspero A, Principi M, Buffelli F, Giorgio F, Montenegro L, Sorrentino C, Amoruso A, Ierardi E, Di Leo A. Evolution of nonspecific duodenal lymphocytosis over 2 years of follow-up. World J Gastroenterol 2015; 21: 7545-7552 [PMID: 26140001 DOI: 10.3748/wjg.v21.i24.7545]
19 Sapone A, Lammers KM, Casolaro V, Cammarota M, Giuliano MT, De Rosa M, Stefanile R, Mazzarella G, Tolone C, Russo MI, Esposito P, Ferraraccio F, Cartenì M, Riegler G, de Magistris L, Fasano A. Divergence of gut permeability and mucosal immune gene expression in two gluten-associated conditions: celiac disease and gluten sensitivity. BMC Med 2011; 9: 23 [PMID: 21392369 DOI: 10.1186/1741-7015-9-23]
20 Ierardi E, Amoruso A, Giorgio F, Principi M, Losurdo G, Piscitelli D, Buffelli F, Fiore MG, Mongelli A, Castellaneta NM, Giangaspero A, De Francesco V, Montenegro L, Di Leo A. Mucosal molecular pattern of tissue transglutaminase and interferon gamma in suspected seronegative celiac disease at marsh 1 and 0 stages. Saudi J Gastroenterol 2015; 21: 379-385 [PMID: 26655133 DOI: 10.4103/1319-3767.167189]
21 Dieterich W, Ehnis T, Bauer M, Donner P, Volta U, Riecken EO, Schuppan D. Identification of tissue transglutaminase as the autoantigen of celiac disease. Nat Med 1997; 3: 797-801 [PMID: 9212111]
22 Esposito C, Paparo F, Caputo I, Porta R, Salvati VM, Mazzarella G, Auricchio S, Troncone R. Expression and enzymatic activity of small intestinal tissue transglutaminase in celiac disease. Am J Gastroenterol 2003; 98: 1813-1820 [PMID: 12907337]
23 Schoenborn JR, Wilson CB. Regulation of interferon-gamma during innate and adaptive immune responses. Adv Immunol 2007; 96: 41-101 [PMID: 17981204]
24 Lahdenperä AI, Fälth-Magnusson K, Högberg L, Ludvigsson J, Vaarala O. Expression pattern of T-helper 17 cell signaling pathway and mucosal inflammation in celiac disease. Scand J Gastroenterol 2014; 49: 145-156 [PMID: 24325470 DOI: 10.3109/00365521.201 3.863966]
25 Junker Y, Zeissig S, Kim SJ, Barisani D, Wieser H, Leffler DA, Zevallos V, Libermann TA, Dillon S, Freitag TL, Kelly CP, Schuppan D. Wheat amylase trypsin inhibitors drive intestinal inflammation via activation of toll-like receptor 4. J Exp Med 2012; 209: 2395-2408 [PMID: 23209313 DOI: 10.1084/jem.20102660] 26 Arancibia SA, Beltrán CJ, Aguirre IM, Silva P, Peralta AL,
Malinarich F, Hermoso MA. Toll-like receptors are key participants in innate immune responses. Biol Res 2007; 40: 97-112 [PMID: 18064347]
DP, Fundová P, Kotrbová-Kozak A, Černá M, Kamanová J, Martin SF, Freudenberg M, Tučková L. Pepsin digest of wheat gliadin fraction increases production of IL-1β via TLR4/MyD88/TRIF/ MAPK/NF-κB signaling pathway and an NLRP3 inflammasome activation. PLoS One 2013; 8: e62426 [PMID: 23658628 DOI: 10.1371/journal.pone.0062426]
28 Thomas KE, Sapone A, Fasano A, Vogel SN. Gliadin stimulation of murine macrophage inflammatory gene expression and intestinal permeability are MyD88-dependent: role of the innate immune response in Celiac disease. J Immunol 2006; 176: 2512-2521 [PMID: 16456012]
29 Ludvigsson JF, Bai JC, Biagi F, Card TR, Ciacci C, Ciclitira PJ, Green PH, Hadjivassiliou M, Holdoway A, van Heel DA, Kaukinen K, Leffler DA, Leonard JN, Lundin KE, McGough N, Davidson M, Murray JA, Swift GL, Walker MM, Zingone F, Sanders DS. Diagnosis and management of adult coeliac disease: guidelines from the British Society of Gastroenterology. Gut 2014; 63: 1210-1228 [PMID: 24917550 DOI: 10.1136/gutjnl-2013-306578] 30 Catassi C, Elli L, Bonaz B, Bouma G, Carroccio A, Castillejo G,
Cellier C, Cristofori F, de Magistris L, Dolinsek J, Dieterich W, Francavilla R, Hadjivassiliou M, Holtmeier W, Körner U, Leffler DA, Lundin KE, Mazzarella G, Mulder CJ, Pellegrini N, Rostami K, Sanders D, Skodje GI, Schuppan D, Ullrich R, Volta U, Williams M, Zevallos VF, Zopf Y, Fasano A. Diagnosis of Non-Celiac Gluten Sensitivity (NCGS): The Salerno Experts’ Criteria. Nutrients 2015; 7: 4966-4977 [PMID: 26096570 DOI: 10.3390/nu7064966] 31 Ford AC, Moayyedi P, Lacy BE, Lembo AJ, Saito YA, Schiller
LR, Soffer EE, Spiegel BM, Quigley EM. American College of Gastroenterology monograph on the management of irritable bowel syndrome and chronic idiopathic constipation. Am J Gastroenterol 2014; 109 Suppl 1: S2-26; quiz S27 [PMID: 25091148 DOI: 10.1038/ajg.2014.187]
32 Moore HM, Kelly AB, Jewell SD, McShane LM, Clark DP, Greenspan R, Hayes DF, Hainaut P, Kim P, Mansfield EA, Potapova O, Riegman P, Rubinstein Y, Seijo E, Somiari S, Watson P, Weier HU, Zhu C, Vaught J. Biospecimen reporting for improved study quality (BRISQ). Cancer Cytopathol 2011; 119: 92-101 [PMID: 21433001 DOI: 10.1002/cncy.20147]
33 Ierardi E, Giorgio F, Rosania R, Zotti M, Prencipe S, Della Valle N, De Francesco V, Panella C. Mucosal assessment of tumor necrosis factor alpha levels on paraffined samples: a comparison between immunohistochemistry and real time polymerase chain reaction. Scand J Gastroenterol 2010; 45: 1007-1008 [PMID: 20446801 DOI: 10.3109/00365521.2010.483739]
34 Abadie V, Discepolo V, Jabri B. Intraepithelial lymphocytes in celiac disease immunopathology. Semin Immunopathol 2012; 34: 551-566 [PMID: 22660791 DOI: 10.1007/s00281-012-0316-x] 35 Volta U, Bardella MT, Calabrò A, Troncone R, Corazza GR. An
Italian prospective multicenter survey on patients suspected of having non-celiac gluten sensitivity. BMC Med 2014; 12: 85 [PMID: 24885375 DOI: 10.1186/1741-7015-12-85]
36 Shmidt E, Smyrk TC, Faubion WA, Oxentenko AS. Duodenal intraepithelial lymphocytosis with normal villous architecture in pediatric patients: Mayo Clinic experience, 2000-2009. J Pediatr Gastroenterol Nutr 2013; 56: 51-55 [PMID: 22785416 DOI: 10.1097/MPG.0b013e318267c353]
37 Fritscher-Ravens A, Schuppan D, Ellrichmann M, Schoch S, Röcken C, Brasch J, Bethge J, Böttner M, Klose J, Milla PJ. Confocal endomicroscopy shows food-associated changes in the intestinal mucosa of patients with irritable bowel syndrome. Gastroenterology 2014; 147: 1012-20.e4 [PMID: 25083606 DOI: 10.1053/j.gastro.2014.07.046]
38 Ierardi E, Losurdo G, Piscitelli D, Giorgio F, Sorrentino C,
Principi M, Montenegro L, Amoruso A, Di Leo A. Seronegative celiac disease: where is the specific setting? Gastroenterol Hepatol Bed Bench 2015; 8: 110-116 [PMID: 25926935]
39 Nurminskaya MV, Belkin AM. Cellular functions of tissue transglutaminase. Int Rev Cell Mol Biol 2012; 294: 1-97 [PMID: 22364871 DOI: 10.1016/B978-0-12-394305-7.00001-X]
40 Locke GR, Murray JA, Zinsmeister AR, Melton LJ, Talley NJ. Celiac disease serology in irritable bowel syndrome and dyspepsia: a population-based case-control study. Mayo Clin Proc 2004; 79: 476-482 [PMID: 15065612]
41 Ford AC, Chey WD, Talley NJ, Malhotra A, Spiegel BM, Moayyedi P. Yield of diagnostic tests for celiac disease in indivi-duals with symptoms suggestive of irritable bowel syndrome: systematic review and meta-analysis. Arch Intern Med 2009; 169: 651-658 [PMID: 19364994 DOI: 10.1001/archinternmed.2009.22] 42 van Leeuwen MA, Lindenbergh-Kortleve DJ, Raatgeep HC, de
Ruiter LF, de Krijger RR, Groeneweg M, Escher JC, Samsom JN. Increased production of interleukin-21, but not interleukin-17A, in the small intestine characterizes pediatric celiac disease. Mucosal Immunol 2013; 6: 1202-1213 [PMID: 23571506 DOI: 10.1038/ mi.2013.19]
43 Ontiveros N, Tye-Din JA, Hardy MY, Anderson RP. Ex-vivo whole blood secretion of interferon (IFN)-γ and IFN-γ-inducible protein-10 measured by enzyme-linked immunosorbent assay are as sensitive as IFN-γ enzyme-linked immunospot for the detection of gluten-reactive T cells in human leucocyte antigen (HLA)-DQ2·5(+) -associated coeliac disease. Clin Exp Immunol 2014; 175: 305-315 [PMID: 24192268 DOI: 10.1111/cei.12232] 44 Brottveit M, Beitnes AC, Tollefsen S, Bratlie JE, Jahnsen FL,
Johansen FE, Sollid LM, Lundin KE. Mucosal cytokine response after short-term gluten challenge in celiac disease and non-celiac gluten sensitivity. Am J Gastroenterol 2013; 108: 842-850 [PMID: 23588237 DOI: 10.1038/ajg.2013.91]
45 Brun P, Giron MC, Qesari M, Porzionato A, Caputi V, Zoppellaro C, Banzato S, Grillo AR, Spagnol L, De Caro R, Pizzuti D, Barbieri V, Rosato A, Sturniolo GC, Martines D, Zaninotto G, Palù G, Castagliuolo I. Toll-like receptor 2 regulates intestinal inflammation by controlling integrity of the enteric nervous system. Gastroenterology 2013; 145: 1323-1333 [PMID: 23994200 DOI: 10.1053/j.gastro.2013.08.047]
46 Cammarota G, Ianiro G, Cianci R, Bibbò S, Gasbarrini A, Currò D. The involvement of gut microbiota in inflammatory bowel disease pathogenesis: potential for therapy. Pharmacol Ther 2015; 149: 191-212 [PMID: 25561343 DOI: 10.1016/j.pharmthera.2014. 12.006]
47 Bringiotti R, Ierardi E, Lovero R, Losurdo G, Di Leo A, Principi M. Intestinal microbiota: The explosive mixture at the origin of inflammatory bowel disease? World J Gastrointest Pathophysiol 2014; 5: 550-559 [PMID: 25400998 DOI: 10.4291/wjgp.v5.i4.550] 48 Eiró N, González-Reyes S, González L, González LO, Altadill A, Andicoechea A, Fresno-Forcelledo MF, Rodrigo-Sáez L, Vizoso FJ. Duodenal expression of Toll-like receptors and interleukins are increased in both children and adult celiac patients. Dig Dis Sci 2012; 57: 2278-2285 [PMID: 22562536 DOI: 10.1007/ s10620-012-2184-6]
49 Khayyat YM. Serologic markers of gluten sensitivity in a healthy population from the western region of Saudi Arabia. Saudi J Gastroenterol 2012; 18: 23-25 [PMID: 22249088 DOI: 10.4103/1319-3767.91733]
50 Volta U, Tovoli F, Cicola R, Parisi C, Fabbri A, Piscaglia M, Fiorini E, Caio G. Serological tests in gluten sensitivity (nonceliac gluten intolerance). J Clin Gastroenterol 2012; 46: 680-685 [PMID: 22138844 DOI: 10.1097/MCG.0b013e3182372541]
P- Reviewer: Freeman HJ, Mishra PK, Rhoads JM S- Editor: Qi Y L- Editor: A E- Editor: Ma S