Available online 16 July 2020
2352-7102/© 2020 Elsevier Ltd. All rights reserved.
Contents lists available at ScienceDirect
Journal of Building Engineering
Analysis of thermal comfort in a football stadium designed for hot and
humid climates by CFD
Gianluca Losi , Arianna Bonzanini , Andrea Aquino
*, Pietro Poesio
** Department of Mechanical and Industrial Engineering, University of Brescia, Brescia, 25123, ItalyA R T I C L E I N F O
Keywords :
Stadium CFD analysis Thermal comfort Conjugate heat transfer HVAC
Hot and humid climate conditions
A B S T R A C T
Qatar is host ing the 2022 FIFA World Cup. In the field of sports ar chi tec ture, this is a chal leng ing case study for new de sign so lu tions that guar an tee the com fort and safety of oc cu pants in such a hot and hu mid cli mate. This work an a lyzes the ther mal com fort of a sta dium de signed for in ter na tional com pe ti tions in Doha, Qatar. The sta dium has a to tal ca pac ity of 47,000 spec ta tors. An ex ter nal façade pro tects the oc cu pants from ex po - sure to wind and sun light, and fresh air and day light en ter the sta dium through a semi - open roof. An air con - di tion ing sys tem con trols the tem per a ture and hu mid ity on each sta dium tier and on the foot ball pitch. Air noz zles in the up per tiers ex ploit the buoy ancy ef fect for the dis tri b u tion of cool air, thereby sav ing en ergy. A steady - state, multi - region con ju gate heat trans fer model sim u lates the in ter ac tion be tween the build ing and en vi ron ment us ing com pu ta tional fluid dy nam ics. Six sim u la tions are per formed to in ves ti gate the ther mal com fort in the sta dium for dif fer ent cli matic con di tions and duty cy cles of the air con di tion ing sys tem. All sim - u la tions mea sure the ther mal sen sa tion in the sta di um's sec tors based on the pre dicted mean vote and per cent - age of per sons dis sat is fied. They also as sess the wet - bulb global tem per a ture (WBGT) on the foot ball pitch for the safety of the play ers, as re quired by FIFA guide lines. The re sults re veal that, for an ex ter nal tem per a ture of up to 48 ° C and rel a tive hu mid ity of 70%, the air con di tion ing sys tem guar an tees a sen sa tion of ther mal neu -
tral ity, and the WBGT re mains within the safety limit. When the cool ing load is re duced by ap prox i mately 50%, most of the sta di um's zones main tain ther mal neu tral ity, and the risk of ther mal stress to the play ers re - mains ac cept able. Our re search find ings iden tify the con di tions nec es sary to en sure a neu tral ther mal sen sa - tion in semi - open sport ar chi tec tures, even in an ex treme cli mate with high risk of ther mal stress for the oc cu - pants.
1 . Introduction
The cli mate con di tions in side a foot ball sta dium af fect the re sult of the match through the com fort lev els of the oc cu pants [ 1 , 2 ]. This con - cern be comes more se ri ous for events ex pe ri enc ing ex treme con di - tions, in which con tin u ous ther mal stress poses a sig nif i cant risk to the health of the play ers and spec ta tors [ 3 , 4 ]. The next FIFA World Cup is sched uled for 2022 and will be hosted in Qatar, where the sum mer air tem per a ture and hu mid ity can rise to 48 o C and 70%, re -
spec tively [ 5 , 6 ]. This event rep re sents a chal leng ing case study for defin ing new de sign guide lines that guar an tee ther mal com fort in hot
and hu mid en vi ron ments, as well as for op ti miz ing the en vi ron men tal sus tain abil ity of sta di ums in such ex treme cli mates (e.g., Ref. [ 7 ]).
A sta dium is a semi - enclosed space [ 8 ], where hu man com fort de - pends on air tem per a ture, hu mid ity, so lar ra di a tion, and wind speed [ 9 ]. To un der stand how the ther mal be hav ior of build ing ty pol ogy af - fects these pa ra me ters, the de signer must ac count for sev eral com pli - ca tions that are char ac ter is tic of open and semi - open spaces:
• Outdoor and semi - outdoor spaces are exposed to highly transient environmental conditions, particularly solar radiation and wind speed [ 10 ];
* Corresponding author. ** Corresponding author.
E - mail addresses: g. losi001@ unibs. it (G. Losi), a. bonzanini001@ unibs. it (A. Bonzanini), andrea. aquino@ unibs. it (A. Aquino), pietro. poesio@ unibs. it (P. Poesio).
https://doi.org/10.1016/j.jobe.2020.101599
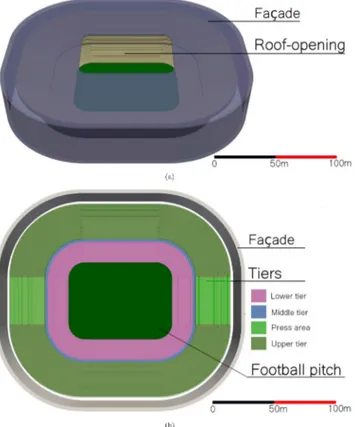
Fig. 1 . Geom e try of the sta dium: (a) ex ter nal view and (b) floor sec tion. The
dif fer ent tiers and zones are col ored as fol lows: the lower tier is vi o let, the mid dle tier is blue, the up per tier is green, and the press/ me dia area is light green. (For in ter pre ta tion of the ref er ences to color in this fig ure leg end, the reader is re ferred to the Web ver sion of this ar ti cle.)
Table 1
Co ef fi cients adopted in the Boussi nesq model and in the va por mass trans port equa tion.
T 0 x v 0 β T β x v D x v S c
300 K 0 0.61 0.53
Table 2
Ther mo phys i cal and ra dia tive prop er ties of the solid do mains. Part Material
tiers concrete 0.5 960 1500 0.6 0.95
pitch grass, soil 0.13 1480 1800 0.8 0.9
façade PTFE panels 0.3 950 2.1 ⋅10 − 3 0.35 0.8
ground asphalt 0.75 920 2200 0.85 0.92
• The temperature distribution in large spaces is not uniform, and the uncertainty in measuring the comfort parameters interferes with their control [ 11 ];
• Human thermal sensation depends on the metabolic rate related to ongoing activities [ 12 ], which are different in each building space (e. g., the football pitch is characterized by a higher risk of thermal stress owing to the intensive activity of the players [ 13 ]);
• Each human body tends to continuously adapt itself to the climate via unique physical, physiological, and psychological mechanisms [ 14 ].
Due to these com plex fea tures, a method ol ogy that guar an tees an ad e quate com fort level for large and open spaces is still an area of open in ves ti ga tion [ 15 ].
Sev eral au thors have pro posed new cli mate con trol meth ods based on a di rect on - site mea sure ment of the com fort pa ra me ters, which of - ten re quire ded i cated tech niques to be ap plied in large open are nas and sta di ums. Kang et al. [ 16 ] im ple mented a con trol scheme for the HVAC of an open - plan of fice. This sys tem up dates the room tem per a - ture tar get on the ba sis of the mean ra di ant tem per a ture (MRT) and the pre dicted mean vote (PMV), which em u lates how the hu man body adapts to en vi ron men tal con di tions. Zam petti et al. [ 17 ] pur sued the same method ol ogy, split ting a test room into sub zones where a pro - por tional in te gral de riv a tive logic reg u lates the air con di tion ing based on the PMV mea sured in each sub zone. Lee et al. [ 18 ] pre sented an in frared sam pling method to si mul ta ne ously mea sure the MRT in mul - ti ple zones of a sta dium us ing a sin gle in stru ment, mak ing the as sess - ment of ther mal com fort in large spaces more fea si ble (the high den - sity of the oc cu pants im pedes the mea sure ments). Fuertes et al. [ 19 ] pre sented an ex per i men tal and nu mer i cal analy sis to study the ef fects of build ing ma te r ial on the ther mal com fort of the oc cu pants. They clas si fied the build ing ma te ri als us ing a ther mal com fort pa ra me ter based on the tran si tory heat flow that oc curs when the ma te r ial comes into con tact with the hu man body.
A dif fer ent ap proach in forms the de sign choices by a the o ret i cal in ves ti ga tion of the in flu ence of the ar chi tec tural fea tures (e.g., sta - dium shape, open ing po si tion, roof geom e try) on the prin ci pal heat trans fer pa ra me ters. Bouyer et al. [ 20 ] con ducted a com pre hen sive mor pho log i cal clas si fi ca tion of sta di ums around the globe (both an - cient and mod ern) to in ves ti gate how the ar chi tec tural pa ra me ters (e.g., façade poros ity and roof open ing an gle) af fect the cli mate within the sta dium. They demon strated the im pact of the sta dium shape (es pe cially the roof) on the ther mal com fort by map ping the Phys i o log i cal Equiv a lent Tem per a ture (PET) [ 21 ] on two mod els scaled for wind tun nels.
Szucs et al. [ 22 ] fol lowed the same method ol ogy to an a lyze how the en vi ron ments of build ing sites af fect the aerother mal com fort. They showed that the cli mate com fort in sta di ums is mainly af fected by the mo tion of air within the bowl (i.e., the vol ume con fined by the spec ta tor tiers and the roof). They also stud ied how the build ing geom e try af fects this air flow through a para met ric analy sis of a wind tun nel model.
Com pu ta tional fluid dy nam ics (CFD) is a well - established tech - nique for the the o ret i cal in ves ti ga tion of ther mal com fort as well as HVAC de sign and op ti miza tion. Fo cus ing on large spaces, Nada et al. [ 23 ] pre sented a com pre hen sive CFD analy sis of hu man ther mal com - fort in a the ater. Their work re lated the main op er a tive pa ra me ters of two dif fer ent HVAC sys tems (one over head and an other un der the floor) to the ther mal com fort of the oc cu pants by study ing the ef fects of the air flow pat tern, ve loc ity, tem per a ture, and the room ar chi tec - ture (the ater height) on the PMV and per cent age of per sons dis sat is - fied (PPD) in dices.
The num ber of stud ies that ap ply CFD to sta di ums is in creas ing, but only a few of them have used sim u la tions to as sess hu man ther - mal com fort. There is a gap in the cur rent lit er a ture on this topic, es - pe cially for sta di ums lo cated in hot and hu mid cli mates. Van Hooff et al. [ 24 ] used La grangian Par ti cle Track ing to eval u ate how dif fer ent roof shapes pro tect the spec ta tors against wind - driven rain. Uchida et al. [ 25 ] ap plied a cus tom CFD model to the Tokyo Olympic Sta dium, but their analy sis was lim ited to the ef fects of wind on the build ing struc ture. Other CFD as sess ments have fo cused on are nas de signed for win ter sports [ 26 ], which re quire care ful de sign of the HVAC sys tem to en sure an ap pro pri ate tem per a ture for an ice rink or in door swim - ming pool and an ad e quate ther mal com fort level for the pub lic [ 27 ]. Anas ta sios et al. [ 28 ] pre sented a CFD - guided com fort as sess ment of a sta dium by cal cu lat ing the air ve loc ity and tem per a ture within the Galatsi Arena (built in Athens for the 2004 Olympics) us ing the CFX soft ware pack age [ 29 ] to map the PMV and PPD as com fort in dices. How ever, this work ex am ined a fully closed arena in a cli mate that is
Fig. 2 . Nu mer i cal do main and bound ary con di tions. The do main is ori ented
with its main axis along the NW – SE di rec tion.
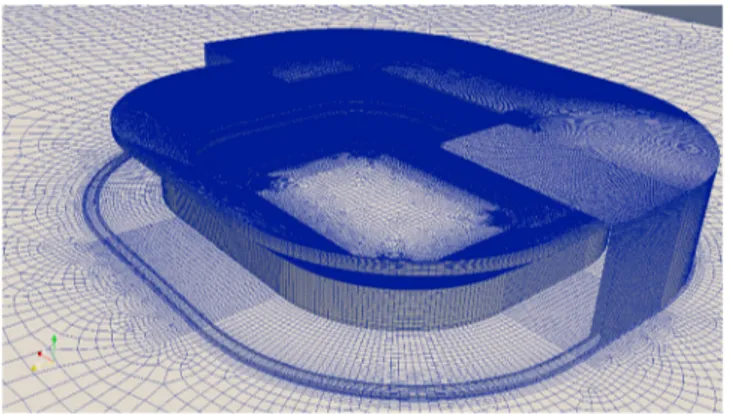
Fig. 3 . A closer look at the mesh near the sta dium. The ex ter nal façade has
been clipped to show the in ner area.
Fig. 4 . Wind pro file mod eled fol low ing the ABL ap proach.
much less se vere than that in Qatar. Ghani et al. [ 30 ] pre sented a case study of a foot ball field in Khal ifa (United Arab Emi rates), which is a hot and hu mid en vi ron ment. They an a lyzed the ther mal be hav ior of the field ex per i men tally and nu mer i cally, but they did not pro vide any re sults about the ther mal com fort of the spec ta tors and play ers.
This study sim u lates the ther mal be hav ior of a sta dium in Doha, Qatar, where the 2022 FIFA World Cup will be held. The aim is to de - velop a CFD model of the sta dium that sup ports the HVAC de sign by eval u at ing the ef fects of the air con di tion ing op er a tive pa ra me ters on the ther mal com fort of the oc cu pants. No sim i lar ap proaches are avail able in the cur rent lit er a ture, and the nov elty of our case study is due to the ex treme con di tions (a hot and hu mid cli mate) that are
stud ied, as well as the pro posed method ol ogy. Us ing CFD, we sim u - late the heat ex change that oc curs through con duc tion, ra di a tion, and con vec tion be tween the sta dium and the ex ter nal en vi ron ment. All sim u la tions take into ac count sev eral non - negligible en vi ron men tal fac tors, such as wind speed, tem per a ture, hu mid ity, and so lar ra di a - tion. They also ac count for the phys i cal prop er ties of the con struc tion ma te ri als and the de sign vari ables of the HVAC sys tem, such as the tem per a ture and flow rate of the cool ing air.
1. 1 . Case study
Our case study is char ac ter ized by dis tinc tive fea tures typ i cal of a foot ball sta dium for in ter na tional com pe ti tions [ 31 ]. Thus, the the o - ret i cal pre dic tions used for de sign pur poses are suit able for com par - isons with ex per i men tal data. The sta dium ( Fig. 1 ) is in an oval shape and al lows a to tal ca pac ity of 47,000 seated spec ta tors. The bleach ers run ning along the in ter nal perime ter are di vided into three dif fer ent lev els:
1. The lower tier (colored in violet), from pitch level to 10. 6 m high, can host 20, 000 spectators;
2. The middle tier (colored in blue), from 13. 75 m to 15 m high, can host 1000 spectators;
3. The upper tier, from 19 m to 39 m high, can host 26, 000 spectators and is divided into two areas, the public bleachers (25, 000 spectators, colored in green) and the press/ media area (1000 spectators, colored in light green).
The to tal in ter nal vol ume of the sta dium is about 1.5⋅10 6 m 3 , and
it is con fined by an ex ter nal shell that forms the open roof and the façade. The lat ter could be a thin wire grid, a fab ric mounted on metal sup ports, or a more com plex pan eled struc ture. De tails of the ma te ri als used for this analy sis are pro vided in Sec tion 3. 1 . The en - trance doors are mov ing pan els of the ex ter nal façade. How ever, we do not in clude them in the geo met ri cal do main be cause in all sim u la - tions, the match is on go ing, and the en trance doors are closed. The roof open ing is the only pos si ble en trance for the wind and so lar ra di - a tion that con tribute to the prop er ties of the air within the sta dium.
The ex te rior sta dium di men sions are 272 m × 250 m x 47 m. The sta dium is sit u ated in Doha, Qatar, where the 2022 FIFA World Cup will be held be tween No vem ber 21 and De cem ber 18. Dur ing win ter, the mean hu mid ity of Doha varies be tween 60 - 70%, and the tem per a - ture varies be tween 32 ° C and about 40 ° C (the high est recorded ob -
ser va tion [ 32 ]). Such con di tions ex pose the oc cu pants to high risk of ther mal stress; there fore, an HVAC sys tem con trols the cli mate on the tiers and the foot ball pitch to guar an tee ad e quate ther mal com fort in the sta dium. Cool ing air noz zles are in stalled in the up per tier to cool down the mid dle and lower tiers through the buoy ancy ef fect; the cooler air moves down ward and dis places the lighter lay ers of hot air, thereby es tab lish ing an in ter nal re cir cu la tion. The chilled air is sup - plied in side the sta dium at a tem per a ture be tween 19 - 23 °C af ter be - ing mois tur ized with a rel a tive hu mid ity of R H = 50% .
2 . Material and methods 2. 1 . Physics equations
Both the in side and out side of the sta dium are de scribed us ing a steady - state, multi - region con ju gate heat trans fer solver avail able in the Open FOAM soft ware pack age and mod i fied to ac count for va por frac tion trans port, buoy ancy ef fects, and so lar ra di a tion. We sim u late the heat trans fer due to con duc tion, con vec tion, and ra di a tion; there - fore, the com pu ta tional do main should ac count for both the solid and fluid re gions of the sta dium and the air it con tains. The cht Mul ti Re - gion Sim ple Foam Open FOAM solver is adopted as a start ing point. It is
Table 3
Cool ing noz zle air prop er ties: vol u met ric flow rate, DBT, and rel a tive hu mid - ity.
Simulation Wind conditions HVAC settings
T [ ] RH [ % ] T [ ] RH [ % ] Flow rate [ m 3 / s ] SIM01 30 70 19 50 108 SIM02 35 70 19 50 108 SIM03 40 60 19 50 108 SIM04 35 70 21 50 54 SIM05 35 70 23 50 54 SIM06 48 60 19 50 108 Table 4
Ac cept able range for the use of PMV/ PPD in dices [ 46 , 47 ].
Environmental parameter Unit Acceptable range
Air temperature ° C 10 – 30
Mean radiant temperature ° C 10 – 40
Relative air velocity m/s 0 – 1
Partial pressure of water Pa 0 – 2700
Individual parameter Unit Acceptable range
Metabolic rate MET (1 MET = 58.2 W/m 2 ) 0.8 – 4 Thermal resistance of clothing CLO (1 CLO = 0.55 m 2 K/W) 0 – 2
a steady - state solver for buoy ant, tur bu lent fluid flow and solid heat con duc tion with con ju gate heat trans fer be tween solid and fluid re - gions, with the op tion to model ra di a tion.
In the solid re gions (the ground, the tiers, the façade, and the pitch), heat trans fer is sim u lated by solv ing
(1) where T s is the tem per a ture in the solid do main, D T is the ther mal dif -
fu siv ity, and S T is a ther mal source term.
In the fluid re gion of the air, the en ergy equa tion is solved for the en thalpy h with
(2) where ρ rep re sents the fluid den sity, u is its ve loc ity, q is the ther mal flux, and S H is a source term, which is used to in clude the so lar ra di a -
tion in the equa tion. The spe cific heat c p is as sumed to be con stant be -
cause the tem per a ture range an a lyzed is small. At the in ter face be - tween the solid and fluid re gions, the heat bal ance is mod eled through cou pled bound ary con di tions. That is, equal tem per a tures are im posed on the cou pled patches.
The mass and mo men tum con ser va tion equa tion, solved in the fluid re gion, are
(3) (4) where u is the air ve loc ity, p is the pres sure, ν is the kine matic vis cos - ity, g is the ac cel er a tion due to grav ity, and ρ ' is the den sity vari a tion due to the dif fer ences in tem per a ture and va por mass con cen tra tion. The fluid phase is con sid ered com press ible. Fur ther more, the buoy - ancy forces are con sid ered by adopt ing the Boussi nesq ap prox i ma tion (as de scribed in 33), which is
ρ ' = − β T ( T − T 0 ) − β x v ( x v − x v 0 ), (5)
where T is the fluid tem per a ture; is the va por mass con - cen tra tion ( m a and m v are the mass of air and of va por, re spec tively);
T 0 and x v 0 are the tem per a ture and va por con cen tra tion ref er ences, re -
spec tively; and β T and β x v are the ther mal ex pan sion and va por ex pan -
sion co ef fi cients, re spec tively. The val ues of these co ef fi cients are re - ported in Table 1 , and they were orig i nally found in Ref. [ 33 ].
The va por con cen tra tion trans port equa tion is not im ple mented in the orig i nal solver avail able in Open FOAM. There fore, its so lu tion has been added to the solv ing al go rithm.
More over, in Open FOAM, only the buoy ancy ef fects given by tem - per a ture are pre sent. Hence, a source term (eq. (5) ) has been added in the mo men tum bal ance equa tion (eq. (4) ) to ac count for the con tri bu - tion of the va por con cen tra tion. The lat ter is trans ported in the fluid phase ac cord ing to
(6) where D x v is the va por dif fu sion co ef fi cient and S c is the Schmidt
num ber, both of which are re ported in Table 1 . The k - ω SST tur bu - lence model is now solved. The tur bu lent spe cific dis si pa tion rate (ω) is
(7) and the tur bu lent ki netic en ergy equa tion is
(8) The wall func tion adopted in this work is de rived from Ref. [ 34 ] and al lows the mod el ing of the At mos pheric Bound ary Layer (ABL) in each do main. In the orig i nal work of [ 34 ], the wall func tions for the tur bu lent ki netic en ergy ( k ) and the dis si pa tion rate (ε) are avail able, along with the one for wind ve loc ity. As the k − ω SST tur bu lence model is se lected as the most suit able for the sta bil ity of our sim u la - tion, we de rived the wall func tion for the miss ing spe cific dis si pa tion (ω) to have a com plete de scrip tion of the flow.
So lar ra di a tion is in cor po rated via the ra di a tion model so lar Load avail able in the Open FOAM pack age. The so lar fluxes are com puted fol low ing the Fair Weather Con di tions Method from the ASHRAE Hand book [ 35 ]. The pri mary so lar heat fluxes, their re flec tive fluxes on walls, and the dif fu sive sky ra dia tive fluxes are also in cluded. The lo ca tion of Doha is de scribed by its lo cal stan dard time merid ian, lon - gi tude, and lat i tude. As the FIFA World Cup will be played in win ter, De cem ber 15 and 4 p.m. are taken as a rea son able date and time, re - spec tively, for a pos si ble match, and this is in serted into the spec i fi ca - tions re quired to com pute the so lar ra di a tion fluxes. The air scat ter phe nom e non is also taken into ac count and mod eled as isotropic.
The ther mo phys i cal prop er ties (ther mal con duc tiv ity κ, spe cific heat c , and den sity ρ) and ra dia tive prop er ties (emis siv ity ε and ab - sorp tiv ity α) of the solid do mains (pitch, tiers, façade, and ground) are re ported in Table 2 . The ther mal dif fu siv ity D T , used in Eq. (1) , is
com puted from the ther mal con duc tiv ity, the spe cific heat, and the den sity as D T = k / ( c ρ ) . The ther mo phys i cal prop er ties of air, namely
the dy namic vis cos ity and spe cific heat at con stant pres sure, are
and , re spec tively.
The pre sented model solves the dif fer en tial equa tions by ap ply ing the fi nite vol ume method. It uses the Semi - Implicit Method for Pres - sure Linked Equa tions (SIM PLE) as the res o lu tion al go rithm and the Gauss ian in te gra tion as the dis cretiza tion scheme. The in ter po la tion scheme is lin ear. We check the ac cu racy of the so lu tions based on the resid u als of the fol low ing vari ables: pres sure, ve loc ity com po nents,
Fig. 5 . Sim u la tion of the air ve loc ity field: (a) the wind im pacts the build ing (stream wise com po nent of the wind ve loc ity field); (b) the air pen e trates from the
roof and af fects the cir cu la tion in side the sta dium; (c) the HVAC dis trib utes cool air from the up per tiers to the foot ball pitch.
Table 5
Risk of heat ill ness re lated to the WBGT in dex. WBGT [ ] Risk of thermal injury
24.0 – 29.3 Moderate
29.4 – 32.1 High
≥ 32.2 Extreme
en thalpy, and the k - ω tur bu lence pa ra me ters. In de tail, all so lu tions con verge af ter more than 45,000 it er a tions, when the resid u als are sta ble and be low the lim its of 4 ×10 − 4 (ve loc ity com po nents), 0.12
(pres sure), 4 ×10 − 3 (en thalpy), 5 ×10 − 6 (k), and 4 ×10 − 5 (omega).
Ow ing to the lack of ex per i men tal re sults, we can not val i date the pre - dic tions of our model. Ei ther the lim ited analy ses of the in door cli - mate in sta dia that are avail able in lit er a ture do not re late to the ther - mal com fort of the oc cu pant or they re fer to dif fer ent ar chi tec tures and cli mates than those con sid ered in our case study. How ever, this Open FOAM solver was suc cess fully used for the ther mal com fort as - sess ments of ex ist ing build ings (e.g., the semi - Olympic pool at Bish -
Fig. 6 . Cross sec tion of the sta dium (sun ex posed side on the right): (a) tem -
per a ture dis tri b u tion; (b) air strat i fi ca tion gen er ated by buoy ancy.
op's Uni ver sity [ 27 ], SC John son's For t aleza Hall [ 36 ], and a class - room in the Uni ver sity Col lege Cork [ 37 ]).
2. 2 . Numerical domain and boundary conditions
Ac cord ing to the clas si fi ca tion given by Ref. [ 38 ], this study falls into the cat e gory of mi cro - scale ur ban aero dy nam ics, as the max i mum hor i zon tal length scale ranges be tween 1 and 10 km. The ex ter nal do - main ( Fig. 2 ) rep re sent ing the bound ing box out side the sta dium struc ture is de signed ac cord ing to the guide lines given in Refs. [ 39 ]. This means that only one build ing is mod eled. Thus, the char ac ter is tic length scale is the height H of the sta dium, and all the di men sions of the bound ing box are scaled ac cord ingly. The ver ti cal ex ten sion of the do main is 5 H , and the width is 15 H , lead ing to a block age fac tor of 3% . The ap proach flow re gion (i.e., in front of the sta dium) is also 5 H , and the wake re gion (i.e., be hind the sta dium) is 15 H to al low the flow to re - establish it self af ter it passes over the ob sta cle. The di men - sions of the whole do main are 1272 m ×750 m ×250 m (length × width × height).
In or der to co her ently sim u late the flow out side and in side the sta - dium as well as the ef fect of wind on the large aper ture of the roof, the mass and en ergy ex changes be tween the ex ter nal and in ter nal spaces are si mul ta ne ously solved (i.e., us ing the cou pled ap proach),
mak ing the “sealed body as sump tion” no longer valid. Ow ing to the roof's aper ture, the ki netic en ergy of the ap proach ing wind is not dis - si pated, as pointed out in Ref. [ 40 ]. Sim i larly [ 41 ], found a strong in - ter ac tion be tween the in te rior and the ex te rior do mains. The main chal lenge of this method ol ogy is the re quire ment to ac count for all length scales of the do main, rang ing from 0.5 m (i.e., the height of the bleach ers) to ap prox i mately 1 km (the length of the outer do main). In this sit u a tion, pro duc ing a high - quality, high - resolution, and com pu ta - tion ally ef fi cient grid is very de mand ing, but it is nec es sary to ob tain ac cu rate re sults. The mesh ing tech nique de vel oped by Ref. [ 42 ] has been ap plied, pro duc ing a hy brid, struc tured - unstructured grid that en sures a high - quality re fine ment in the façade re gion. The grid also al lows a high res o lu tion for the bound ary layer, as it con forms to the com plex geom e try of the bleach ers and grad u ally be comes coarser in the far field ( Fig. 3 ). The el e ments are all hexa he dral, and the to tal num ber of cells is ap prox i mately 11×10 6 . If only the fluid do main is
con sid ered, the num ber of cells is ap prox i mately 6×10 6 .
In the sim u lated do main, two dif fer ent re gions are dis tin guished: the cen tral re gion, where the build ings and other pos si ble ob sta cles to the wind are mod eled ex plic itly, and the up stream and down stream zones (pre vi ously in tro duced as ap proach flow re gion and wake re - gion, re spec tively), where the ob sta cles are not mod eled ex plic itly but through their ef fect on the flow [ 43 ]. This work ex plic itly sim u lates the sta dium only, and no ob sta cles or other build ings are placed di - rectly in the do main. How ever, the rough ness due to small - scale ob - jects and small build ings is taken into ac count im plic itly by adopt ing wall func tions for the ABL. At the in let, the wind ve loc ity pro file is set fol low ing the spec i fi ca tions for an ur ban en vi ron ment. The mean wind ve loc ity at the build ing site is about 3.7 m/ s [ 32 ], and the ref er - ence wind ve loc ity is 2.1 m/ s at the ref er ence height of 5 m. The re - sult ing ve loc ity pro file is shown in Fig. 4 .
Me te o ro log i cal data [ 44 ] show that in De cem ber, the wind blows mainly from the north west in Doha. This fact has been mod eled by vary ing the an gle be tween the ve loc ity com po nents at the in let and the so lar po si tion. The rel a tive hu mid ity of the air at this time of the year ranges from 60% to 70% . Thus, these two val ues were de fined at the in let bound ary as trans ported by the wind. The mean max i mum tem per a tures in Doha in De cem ber from 1996 to 2013 ranged from
25 ∘ C to 30 ∘ C . How ever, con sid er ing re cent stud ies that found warm ing
trends in the re gion [ 45 ], we de cided to con sider higher tem per a tures as well. Hence, the Dry Bulb Tem per a ture (DBT), adopted as the in let wind tem per a ture, was as signed the val ues of 30 ∘ C , 35 ∘ C , 40 ∘ C , and
48 ∘ C .
The bound ary con di tion used for the air con di tion ing sys tem is a vol u met ric flow rate ap plied to se lected sur faces cor re spond ing to the ver ti cal walls of the up per - tier bleach ers and the sur face en com pass - ing the pitch. The air flow ing from the noz zles has a DBT of and has a rel a tive hu mid ity of 50% . Fi nally, the pres - ence of the spec ta tors in the sta dium is ac counted for by set ting a fixed tem per a ture ( 37 ∘ C ) on the seats fol low ing the method ol ogy
adopted by Van Hooff and Blocken (2010). The com bi na tion of the
Fig. 8 . Re sults of the sim u la tions, shown through the Givoni di a gram, along with the win ter com fort zone (CH), the sum mer com fort zone (CE), and the ven ti -
lated com fort zone (blue line). (For in ter pre ta tion of the ref er ences to color in this fig ure leg end, the reader is re ferred to the Web ver sion of this ar ti cle.)
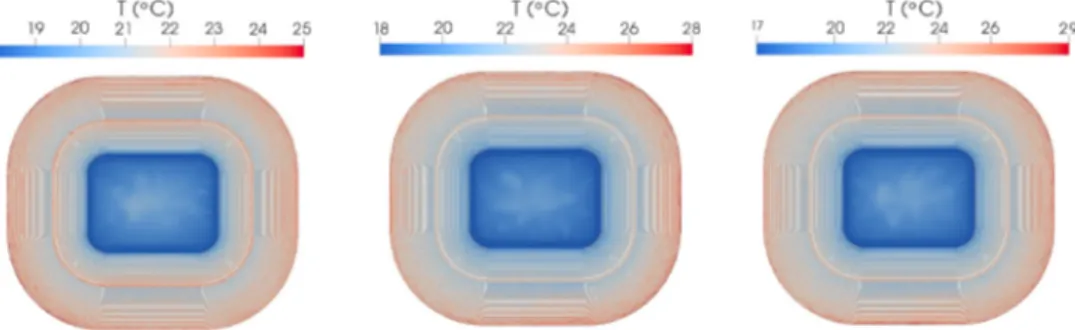
Fig. 9 . Tem per a ture field sam pled at a dis tance of 0.5 m from the sur face of the tiers and the pitch: SIM01 (left); SIM02 (mid dle); SIM03 (right).
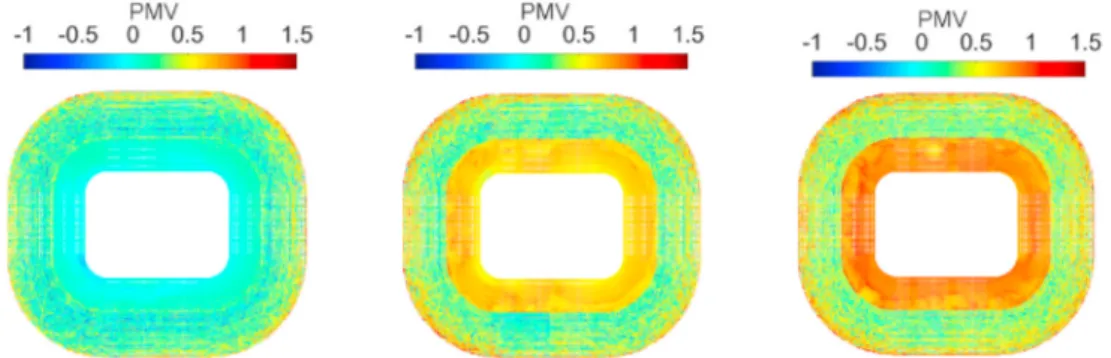
Fig. 10 . Vis i ble range of the PMV val ues on the tiers: SIM01 (left); SIM02 (mid dle); SIM03 (right).
wind char ac ter is tics and the cool ing sys tem con di tions are re ported in Sec tion 3. 3 .
2. 3 . Operating conditions and simulation steps
Six dif fer ent com bi na tions of wind and cool ing con di tions are sim - u lated ( Table 3 ). The wind tem per a ture has the val ues of 30 ∘ C , 35 ∘ C ,
40 ∘ C , and 48 ∘ C , and its rel a tive hu mid ity has the val ues of 60% and
70% . The val ues of the cool ing tem per a ture of the air from the cool - ing sys tem lo cated on the pitch level are 19 ∘ C , 21 ∘ C , and 23 ∘ C ,
whereas those of the flow rate are and ; the rel a tive hu mid ity is kept con stant at 50% . The cool ing sys tems lo cated on the up per tier and press/ me dia area are set to cool ing tem per a ture of
19 ∘ C and flow rates of and , re spec tively. These val -
ues are kept con stant in all five sim u la tions. The adopted vol u met ric flow rate es ti ma tions are based on the tier ca pac ity and the re quired cool ing of the pitch. In all sim u la tions, the oc cu pancy of the sta dium is at full ca pac ity, and we omit the build ing op er a tion sched ule be - cause it is not nec es sary to con sider it in our steady - state analy sis.
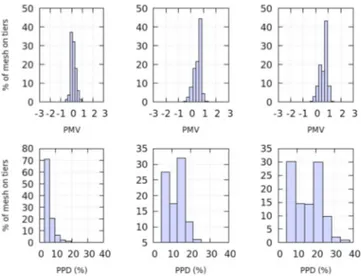
Fig. 11 . His tograms of the PMV and PPD in dices for SIM01, SIM02, and
SIM03 (left to right).
2. 4 . Thermal comfort indicators
The analy sis of ther mal com fort is lim ited to the sta di um's bowl, i.e., the space en veloped by the tiers, foot ball pitch, and open roof; this is a semi - outdoor space, where the cli mate is con trolled by me - chan i cal ven ti la tion (i.e., cen tral ized HVAC sys tem). We use the PMV and PPD in dices, de fined in the ISO Stan dard 7730 [ 46 ], to an a lyze the ther mal com fort at the tiers (i.e., the ther mal sen sa tion of the spec ta tors). The PMV is the mean value of the rat ings given by a suf fi - ciently large sam ple of peo ple for a range of ther mal sen sa tions. The range spans from - 3 to +3, where neu tral is rep re sented by zero, very cold is rep re sented by - 3, and very warm is rep re sented by +3. Once the PMV is known, the PPD is cal cu lated to de ter mine the per cent age of dis sat is fied peo ple (i.e., peo ple that vote a ther mal sen sa tion greater than or equal to 2 or less than or equal to - 2).
The PMV and PPD in dices de pend on six pa ra me ters: the meta bolic rate, ther mal re sis tance of cloth ing, air tem per a ture, MRT, rel a tive air ve loc ity, and rel a tive hu mid ity. These in dices are ap plic a ble only in mod er ate en vi ron ments [ 46 , 47 ], where the pa ra me ters men tioned above fall within the ranges re ported in Table 4 .
As in di vid ual - level pa ra me ters, we as sume a cloth ing value of 1.0 CLO and meta bolic rate of 1.2 MET. The MRT is equal to the mean tem per a ture of the sta di um's zone un der analy sis [ 48 ]. The other en - vi ron men tal pa ra me ters are sam pled from the CFD re sults at a dis - tance of 0.5 m from the sur face of the tiers; these re sults show that the en vi ron men tal pa ra me ters in our case study are within the ranges rec om mended in the tech ni cal reg u la tion (see the air tem per a ture, ve - loc ity, and hu mid ity in Figs. 5c, 8 and 9, 13 ); there fore, the as sess - ment of the ther mal com fort at the tiers based on the PMV and PPD in dices is jus ti fied.
An al ter na tive method ol ogy for the analy sis of ther mal com fort is adap tive the ory [ 49 ]; this method links the ex pressed ther mal sen sa - tion to the re sponse of the oc cu pants (i.e., how they adapt to the cli -
matic con di tions by in ter act ing with the en vi ron ment). The adap tive the ory de pends on the vari ables that in flu ence the in di vid ual re sponse [ 50 – 52 ]: the ef fects of the out door tem per a ture on the in door cli mate, the build ing use, ac cess of the oc cu pants to the ven ti la tion sys tem set - tings, and time - scale at which the in di vid ual re sponse oc curs. We can - not ap ply the adap tive the ory to our re search be cause the cur rent stan dards [ 53 – 59 ] are ap plic a ble only in nat u rally ven ti lated en vi ron - ments or when the HVAC is dis abled. The com fort as sess ment in this work fo cuses on a semi - closed en vi ron ment, i.e., the sta di um's bowl, which is con trolled by cen tral ized me chan i cal ven ti la tion. The HVAC de cou ples the in door cli mate from the ex ter nal en vi ron ment (re sults will show that the open roof con tributes only to the nat ural il lu mi na - tion of the space), and the oc cu pants can not ad just the ven ti la tion set - tings. Fur ther more, we use a CFD steady - state model that can not sim - u late any vari a tions in the cli mate and oc cu pan t's re sponse over time.
To eval u ate the ther mal con di tions on the pitch, we use the wet - bulb globe tem per a ture (WBGT) in dex, which is used in in dus try, the army, and sports to eval u ate the heat stress level of phys i cal ac tiv ity [ 60 ]. FIFA has de clared guide lines for the med ical teams, re ported in Ref. [ 61 ] and briefly pre sented in Table 5 , in di cat ing the risk of ther - mal in jury as func tion of the WBGT.
This in dex takes into ac count the ef fect of the air tem per a ture, so - lar ra di a tion, hu mid ity, and wind speed. It is com puted via a lin ear com bi na tion of the wet - bulb tem per a ture T w b , the globe tem per a ture
T g , and the dry - bulb tem per a ture T d b :
W B G T = 0. 7 T w b + 0. 2 T g + 0. 1 T d b . (9)
To com pute the WBGT on the pitch, the re sults of the nu mer i cal sim u la tions are sam pled at 0.5 m above its sur face. The wet - bulb tem - per a ture is com puted us ing the re la tion pro posed by Ref. [ 62 ], while the globe tem per a ture is es ti mated by em ploy ing the re la tion of [ 63 ]. 3 . Results and discussion
In this sec tion, the in ter ac tion be tween the sta dium and the en vi - ron ment are shown based on the re sults of SIM02. The analy sis of the ther mal com fort of the spec ta tors and play ers, and the tem per a ture dis tri b u tion on the pitch are de scribed in the fol low ing para graphs. First, the wind con di tions are var ied, and the cool ing set tings are held con stant (com par i son of SIM01, SIM02, and SIM03). Then, the cool ing con di tions im posed on the pitch are var ied while the wind char ac ter - is tics are kept con stant (com par i son of SIM02, SIM04, and SIM05). Fi - nally, the re sults for the ex treme cli mate con di tions in SIM06 are pre - sented.
3. 1 . Stadium and its environment
This sec tion il lus trates the ef fects of the en vi ron ment on the sta di - um's bowl based on qual i ta tive re sults that are avail able in all sim u la - tion cases, such as the ve loc ity field in side and out side the bowl, ef - fect of ra di a tion on the tiers and the ground, and air den sity dis tri b u - tion. As shown in Fig. 5 a, the ABL breaks be fore the sta dium and reat - taches be fore the end of the do main. When the wind en coun ters the
Fig. 13 . Tem per a ture field sam pled at a dis tance of 0.5 m from the sur face of the tiers and the pitch: SIM02 (left); SIM04 (mid dle); SIM05 (right).
Fig. 14 . Vis i ble range of the PMV val ues at the tiers: SIM02 (left); SIM04 (mid dle); SIM05 (right).
up per wind ward cor ner of the façade, a thin back flow is gen er ated along the ex ter nal sur face of the roof. The air ac cel er ates and changes its di rec tion to pen e trate into the sta dium bowl from the open ing on the roof. The stream lines in Fig. 5 b show that the wind ac tively con - tributes to the air dis tri b u tion in side the sta dium. The air flow sep a - rates into two hor i zon tal vor tices cen tered on the wind - oriented axis. It cir cu lates around the sta dium perime ter, reach ing all tier lev els and the en tire foot ball field. Fi nally, the cross sec tion in Fig. 5 c shows the cold air flow ing down from the up per tier to the lower tier, and then the warm air and cold air are mixed at the cen ter of the pitch.
The tem per a ture dis tri b u tion in the en tire do main is shown in Fig. 6 a. The av er age tem per a ture of the ground is 45 ∘ C , which is con sis -
tent with the tem per a ture in Qatar dur ing the late au tumn sea son. The parts of the ground di rectly ex posed to the so lar ra di a tion (right side) are at a higher tem per a ture than the shaded sides. Air strat i fi ca - tion oc curs in side the sta dium via the buoy ancy mech a nism; this ef - fect ac tively con tributes to a ho mo ge neous dis tri b u tion of the cool ing air, from the up per lev els of the tiers down to the foot ball pitch (see Fig. 6 b, where the vec tors rep re sent the ver ti cal com po nent of the ve - loc ity su per im posed on the den sity field). The air tem per a ture grad u - ally in creases from the cold est value on the foot ball pitch, thus re duc - ing the risk of ther mal in juries. In the in door spaces be low the tiers, the air move ment is lim ited to a thin layer on the in te rior of the ex ter - nal façade and no tem per a ture strat i fi ca tion oc curs. Hence, the par ti - tion ing of these zones into sub zones (e.g., as stores and of fices) is ir - rel e vant for the air dis tri b u tion in side the sta dium bowl.
The com bined ef fects of the wind and so lar ra di a tion are shown in Fig. 7 . The so lar ra di a tion in creases the tem per a ture on the façade ex - posed to the south west (i.e., it is di rectly ex posed to the so lar ra di a - tion), and the up wind part of the roof is cooled by the wind. The sun - light pen e trates in side the sta dium from the open roof, con tribut ing to the nat ural light ing of the sta dium bowl; how ever, the air con di tion - ing sys tem main tains the ir ra di ated area at a sim i lar tem per a ture to that of the ar eas not di rectly ex posed to the sun (see the tem per a ture at the tiers in Figs. 9 and 13 ).
3. 2 . Comfort assessment at the tiers
The Givoni di a gram [ 64 ] eval u ates the com fort in each spe cific re - gion of the tiers (i.e., the lower tier, mid dle tier, up per tier, and press seats). Be fore com par ing the re sults of the PMV and PPD, the ther mal com fort for all five sim u la tions are com pared us ing the Givoni di a - gram ( Fig. 8 ). The ar eas in side the green and blue lines rep re sent, re - spec tively, the win ter com fort area (CH), the sum mer com fort area (CE), and the com fort area in the case of ven ti la tion (AC). The points rep re sent the mean val ues of the tem per a ture and spe cific hu mid ity for each of the tier sec tions. The mid dle tier, the up per tier, and the press seats of SIM02 and SIM03 are in side the sum mer com fort zone, which also oc curs for the up per tier and the press seats of SIM04 and SIM05. In con trast, all the zones of SIM01 and the lower tiers of SIM02 and SIM03 are in the win ter com fort zone. This in di cates that these zones are com fort able, but their tem per a ture and spe cific hu - mid ity could be in creased, thereby re duc ing the cool ing costs by us ing a higher noz zle tem per a ture. The mid dle tiers and lower tiers of SIM04 and SIM05 are out side the sum mer com fort zone, but in side the ven ti lated com fort zone. How ever, the con di tion of the mid dle tier is bor der line, and it can be im proved. In the case of ex treme con di - tions (SIM06), all the tiers fall in side the sum mer com fort zone, which demon strates that the HVAC sys tem can pro vide a com fort able en vi - ron ment in harsh con di tions.
3. 2. 1 . Comfort assessment for varying wind conditions: SIM01, SIM02, and SIM03
The tem per a ture dis tri b u tions on the pitch and at the tiers are shown in Fig. 9 . The tem per a ture field is sam pled at 0.5 m above the pitch and above the three tiers of bleach ers. A com par i son is made be - tween the three tested wind tem per a tures, and the air con di tion ing sys tem pro vides the de sired tem per a tures. Even with an out side tem - per a ture of 40 ∘ C (SIM03), the tem per a ture range in side the build ing is
kept be low 30 ∘ C .
The cho sen set tings for the air con di tion ing sys tem pro vide a com - fort able en vi ron ment at all tiers of the bleach ers. The re sults in Fig. 10 show that ther mal neu tral ity oc curs every where at the tiers. For
Fig. 15 . His tograms of the PMV and PPD in dices in SIM02 (left col umn),
SIM04 (cen ter col umn), and SIM05 (right col umn).
any given wind con di tion, the re sult ing PMV is in the range of - 0.2 – 0.2. This re sult is con sis tent with the stan dards that rec om mend a PMV value of ap prox i mately zero and de vi a tion of ± 0.5 [ 65 ]. In SIM02 and SIM03, a PMV of roughly one is ob served on the higher seats of the up per tier, be cause the cold air from the noz zles is fo - cused on the lower lev els of the sta dium. More over, the com fort level is lower on the right side of the up per tier be cause of the wind en ter - ing the build ing. The his tograms in Fig. 11 pre sent the dis tri b u tions of PMV and PPD over the tiers, weighted on the mesh of the en tire sta - dium. In all tested cases, the most fre quently ob served val ues of the PMV and PPD are ap prox i mately zero and 5% , re spec tively; thus, the HVAC suc cess fully guar an tees a neu tral ther mal con di tion in the en - tire sta dium bowl.
Fi nally, the re sults in Fig. 12 in di cate that the WBGT is far be low the max i mum pre scribed tem per a ture of 32 ∘ C in all three sim u la tions,
ex cept for some spots in SIM03. How ever, for most of the pitch of the lat ter, the in dex is lower than 24 ∘ C , in di cat ing a low risk of ther mal
in jury.
Given the re sults pre sented in this sec tion and the con di tions pro - posed in SIM01, SIM02, and SIM03, it is pos si ble to guar an tee that a com fort able en vi ron ment ex ists on al most all the tiers and that the play ers are not ex posed to the risk of ther mal in juries. How ever, the mean DBT reg is tered on the pitch ( ) is low if it is com pared to the wind tem per a ture, and achiev ing this con di tion may be ex pen - sive. Thus, in the next sec tion, three ad di tional sim u la tions are com - pared for the fol low ing sce nario: the tem per a ture of the air flow ing from the cool ing noz zle lo cated on the pitch is in creased, but the wind tem per a ture is kept con stant.
3. 2. 2 . Comfort assessment for varying cooling conditions on the pitch: SIM02, SIM04, and SIM05
Re sults in Fig. 13 show the tem per a ture, sam pled at 0.5 m above the sur face, through out the sta dium. As the cool ing tem per a ture of
the pitch noz zles is in creased and the vol u met ric flow rate is re duced, the tem per a ture rises on the field and on the lower tier, as ex pected. How ever, in the whole sta dium, the tem per a ture is kept be low 30 ∘ C .
The PMV dis tri b u tions in the three sim u la tions are shown in Fig. 14 . With re spect to SIM02, the PMV in creases in the lower and up per tiers as the cool ing tem per a ture of the pitch noz zle in creases. This in - di cates that the ther mal sen sa tion of the spec ta tors at this level moves from neu tral (in SIM02, PMV ≈0 ) to slightly warm (PMV ≈0.6 and 0.9 in SIM04 and SIM05, re spec tively). Hence, the cool ing of the lower tier is also in flu enced by the pitch cool ing con di tions and does not rely only on the cool ing pro vided for the up per tiers.
The his tograms of the PMV in dex in Fig. 15 (top) show that the most fre quent PMV shifts from ≈0 to ≈0.8 , which is con sis tent with the changes in the cool ing tem per a ture of the pitch noz zles. More - over, the trend is vis i ble also for the PPD in dex in Fig. 15 (bot tom). The dis tri b u tion max i mum is around 5% in SIM02, whereas at higher cool ing tem per a tures, more spec ta tors ap pear to be dis sat is fied with the ther mal con di tions. How ever, this per cent age of dis sat is fied per - sons is ac cept able, con sid er ing the cost re duc tion achieved by in creas - ing the noz zle tem per a ture and by re duc ing the flow rate. In a fu ture study, these two pa ra me ters can be fur ther tuned to min i mize the cost and max i mize ther mal com fort.
The dis tri b u tion of the WBGT in dex on the pitch is re ported in Fig. 16 . As ex pected, this in dex rises as the air tem per a ture of the noz zles in creases. A mod er ate risk of ther mal in jury is ex pected in the case of SIM04 and SIM05, and, in par tic u lar, on the right side of the pitch in SIM05. The lat ter is due to the wind, which en ters the sta dium and car ries warm and hu mid air. In this case, the hu mid ity of the wind af - fects more than the tem per a ture in the WBGT in dex. Ac cu rate tun ing of the tem per a ture, vol u met ric flow rate, and hu mid ity of the air flow ing from the pitch noz zles should be car ried out in a fu ture study as well.
3. 2. 3 . Comfort assessment for extreme conditions: SIM06
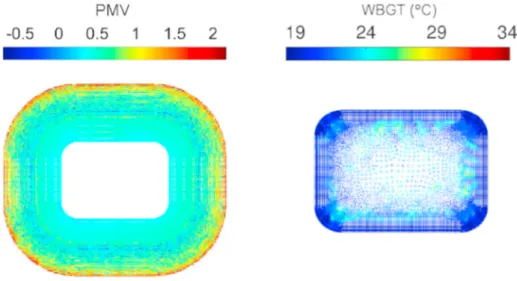
The eval u a tion of the ther mal com fort un der ex treme con di tions (SIM06) is re ported in Fig. 17 , which shows the PMV and PPD in dices at the tiers. The PMV varies be tween 0.4 − 1 in all the bleach ers, ex - cept for the high est zone of the up per tier, where the in dex rises to 2. This in di cates that the spec ta tors feel a slightly warm sen sa tion in the whole sta dium ex cept for the up per part, where the spec ta tors re port be ing un com fort able. A pos si ble ex pla na tion of this re sult is that the cold air sup plied by the HVAC sys tem de scends as the hot air en ters through the open roof. Hence, a ded i cated cool ing ap pa ra tus to sup ply cold air to the higher bleach ers could be nec es sary for these ex treme con di tions. The re sult ing WBGT dis tri b u tion on the field ( Fig. 17 ) shows that safe ther mal con di tions are en sured for the play ers even un der these ex treme con di tions, which is a re sult of the ded i cated HVAC sys tem lo cated around the pitch.
The his tograms of the PMV and PPD in dices ( Fig. 18 ) show that most of the spec ta tors are sat is fied with the ther mal con di tions. How - ever, the right - hand tails of the dis tri b u tions reach high val ues, which rep re sent the dis sat is fied per sons in the higher zones of the sta dium.
Fig. 17 . The vis i ble range of the PMV on the tiers (left) and the WGBT on the foot ball pitch (right) in SIM06.
Fig. 18 . Dis tri b u tions of PMV and PPD in dices in SIM06.
4 . Conclusions
A sat is fac tory ther mal sen sa tion within a sta dium is a pre req ui site for the safe ex e cu tion of the match and com fort of the oc cu pants. Fur - ther dif fi cul ties arise in hot and hu mid cli mates, where a com pre hen - sive analy sis of the in ter ac tion be tween the sta dium and the en vi ron - ment and how it af fects the in door com fort level be comes cru cial for the safety of the play ers and spec ta tors.
We pre sented a CFD - assisted analy sis of the ther mal com fort in a sta dium de signed for in ter na tional foot ball com pe ti tions. The case study was of the 2022 FIFA World Cup, which will be hosted in Doha, Qatar, a coun try with a hot and hu mid cli mate. To guar an tee the ther - mal com fort of the spec ta tors and the safety of play ers, we pro posed a tool that as sesses the ther mal sen sa tion in all sta dium zones, given the cli matic vari a tions and duty cy cle of the air con di tion ing sys tem.
A steady - state, con ju gate heat trans fer model sim u lated the heat and mass ex changes be tween the sta dium and the en vi ron ment. The model takes into ac count the va por frac tion trans port, buoy ancy ef - fects, tur bu lence, and so lar ra di a tion. The PMV and PPD in dices sig ni - fied the ther mal com fort of the spec ta tors in the sta dium bowl, a semi - closed en vi ron ment con trolled by a cen tral ized HVAC sys tem. The analy sis of the WBGT on the pitch ver i fied that the risk of ther - mal stress to the play ers was within the safety level given by the FIFA tech ni cal guide lines. By vary ing the op er at ing con di tions, six sim u la - tions were per formed to in ves ti gate the ef fects of the ex ter nal air tem -
per a ture and rel a tive hu mid ity on the in door ther mal sen sa tion. The ef fects of the op er at ing con di tions of the air con di tion ing sys tem were also ex am ined. In par tic u lar, SIM06 cal cu lated the ther mal com fort un der ex treme con di tions, when the ex ter nal tem per a ture was 48 ° C,
and the rel a tive hu mid ity was 60%.
The re sults of SIM02 il lus trated the qual ity of the model pre dic - tions and the in ter ac tions be tween the sta dium and the en vi ron ment. The mo tion of air and its strat i fi ca tion in the whole do main (both in - door and out door spaces) are si mul ta ne ous ef fects of the wind flow, the in ci dent so lar ra di a tion, the pres ence of spec ta tors, and the air sup plied by the HVAC sys tem. The re sults of the first sim u la tion set, SIM01 - SIM02 - SIM03, demon strated that the HVAC sys tem main tained ther mal neu tral ity at all lev els of the tiers for sev eral cli matic con di - tions: the PMV was ap prox i mately zero with a de vi a tion of ± 5% , the PPD was ap prox i mately 5% , and the av er age WBGT on the foot ball pitch was 24 ∘ C , which were well within the lim its rec om mended in
the FIFA guide lines for ther mal risk. SIM04 and SIM05 in ves ti gated the ef fects of re duc ing the cool ing load. When the in let flow rate of the HVAC de creased by 50%, there was an ac cept able per cent age of dis sat is fied per sons on all tiers (the most fre quent value of the PMV was 0.9 and PPD var ied be tween 15% − 20% ). The ther mal risk on the pitch in creased, but it re mained within the safety limit; the av er - age WBGT re mained be low the 30 ∘ C limit and only in some spots did
it in crease up to 32 ∘ C . Un der the most se vere cli mate con di tions
(SIM06), the HVAC guar an tees a sat is fac tory com fort level in the en - tire sta dium (PMV var ied be tween 0.4 − 1 ) ex cept at the high est tier, where it was high at 2 (an un com fort ably warm sen sa tion) and the PPD was be tween 70% − 80% . The pitch did not pre sent a risk of ther mal in jury to the play ers be cause it re mained be low the max i mum WBGT of < 30 ∘ C . Fi nally, the Givoni di a gram pre sented the qual ity of
ther mal com fort in all the dif fer ent zones of the tiers. All points (i.e., sim u la tion re sults) fell within the ven ti lated com fort zone. Ac cord ing to the cli mate and the tar get cool ing tem per a ture of the pitch, they were in the win ter and sum mer com fort zones. This di a gram could guide the de sign of the cool ing sys tem and the as sign ment of the op - er at ing tem per a ture and hu mid ity ac cord ing to the spe cific needs of each zone. All the re sults demon strated that the de signed air dis tri b u - tion sys tem scarcely cov ered the high est level near the roof, where the hot wind en tered the sta dium bowl. A sup ple men tary cool ing sys tem, in stalled at this up per level and used un der ex treme con di tions, could be a suit able so lu tion.
The pro posed method ol ogy can con tribute to a quan ti ta tive de - scrip tion of the cli mate com fort in sta di ums, and in gen eral, at out - door and semi - outdoor spaces, for which the o ret i cal mod els en counter
the most dif fi cul ties be cause of the re quire ment to con sider the in ter - ac tion be tween the build ing and the en vi ron ment.
Fu ture de vel op ments will over come the lim i ta tions of the cur rent work. The up grad ing of the cur rent steady - state solver to a tran sient - state solver will al low the cal cu la tion of the ther mal com fort in di ca - tors on a cus tomized time - interval (e.g., from a prepara tory phase to the en tire du ra tion of the match), tak ing into ac count the hourly vari - a tion of the so lar ra di a tion and wind speed. Fur ther more, a tran sient model can check the ther mal com fort of all daily ac tiv i ties within the build ing com plex, in clud ing in spaces such as stores, of fices, and dress ing rooms. We ne glected the lat ter in our model to fo cus on the ther mal com fort on the pitch and the tiers. Fi nally, the cou pling of this CFD analy sis to the en ergy and ex ergy analy sis of the air con di - tion ing can help op ti mize the en ergy use and eco nomic costs of the HVAC sys tem.
CRediT authorship contribution statement
Gi an luca Losi: Method ol ogy, Soft ware, Writ ing - orig i nal draft. Ar i anna Bon zanini: Method ol ogy, Soft ware, Writ ing - orig i nal draft. An drea Aquino: For mal analy sis, Writ ing - orig i nal draft, Writ ing - re view & edit ing. Pietro Poe sio: Su per vi sion, Pro ject ad min is tra tion. Declaration of competing interest
The au thors de clare that they have no known com pet ing fi nan cial in ter ests or per sonal re la tion ships that could have ap peared to in flu - ence the work re ported in this pa per.
Acknowledgments
This re search did not re ceive any spe cific grant from fund ing agen - cies in the pub lic, com mer cial, or not - for - profit sec tors. The au thors would like to thank the re view ers for their in sight ful com ments, which have re sulted in an im proved man u script.
References
[1] M. Ucuncu , D. Woolf , M. Zikri , Thermal Comfort of Spectators in Stadia Built in Hot Climates, Adapting to Change: New Thinking on Comfort , Windsor , UK , 2010 , p. 8 .
[2] L. Shi , R. An , An optimization design approach of football stadium canopy forms based on field wind environment simulation , Energy Procedia 134 ( 2017 ) 757 – 767 .
[3] K. Özgünen , S. Kurdak , R. Maughan , C. Zeren , S. Korkmaz , Z. Yazιcι , G. Ersöz , S. Shirreffs , M. Binnet , J. Dvorak , Effect of hot environmental conditions on physical activity patterns and temperature response of football players , Scand. J. Med. Sci. Sports 20 ( 2010 ) 140 – 147 .
[4] J. R. Brotherhood , Heat stress and strain in exercise and sport , J. Sci. Med. Sport 11 ( 1 ) ( 2008 ) 6 – 19 .
[5] Accuweather , [link]. URL 2019 . https:// www. accuweather. com/ en/ qa/ doha/ 271669/ july - weather/ 271669? .
[6] National Oceanic and Atmospheric Administration , [link]. URL 2019 . https:// www. noaa. gov/ .
[7] M. Manni , A. Petrozzi , V. Coccia , A. Nicolini , F. Cotana , Investigating alternative development strategies for sport arenas based on active and passive systems , J. Build. Eng. ( 2020 ) 101340 .
[8] J. Spagnolo , R. De Dear , A field study of thermal comfort in outdoor and semi - outdoor environments in subtropical sydney Australia , Build. Environ. 38 ( 5 ) ( 2003 ) 721 – 738 .
[9] L. Jin , Y. Zhang , Z. Zhang , Human responses to high humidity in elevated temperatures for people in hot - humid climates , Build. Environ. 114 ( 2017 ) 257 – 266 .
[10] S. Coccolo , J. Kämpf , J. - L. Scartezzini , D. Pearlmutter , Outdoor human comfort and thermal stress: a comprehensive review on models and standards , Urban Clim. 18 ( 2016 ) 33 – 57 .
[11] M. Arnesano , G. Revel , F. Seri , A tool for the optimal sensor placement to optimize temperature monitoring in large sports spaces , Autom. ConStruct. 68 ( 2016 ) 223 – 234 .
[12] T. Goto , J. Toftum , R. de Dear , P. O. Fanger , Thermal sensation and
thermophysiological responses to metabolic step - changes , Int. J. Biometeorol. 50 ( 5 ) ( 2006 ) 323 – 332 .
[13] C. Eiracle , Soccer injuries on the road to the World Cup Qatar 2022: main obstacles and challenges , J. Sci. Med. Sport 16 ( 1 ) ( 2013 ) e53 – e54 .
[14] M. Nikolopoulou , N. Baker , K. Steemers , Thermal comfort in outdoor urban spaces: understanding the human parameter , Sol. Energy 70 ( 3 ) ( 2001 ) 227 – 235 . [15] P. Sofotasiou , B. R. Hughes , J. K. Calautit , Qatar 2022: Facing the FIFA World Cup
climatic and legacy challenges , Sustain. Cities Soc. 14 ( 1 ) ( 2015 ) 16 – 30 . [16] D. H. Kang , P. H. Mo , D. H. Choi , S. Y. Song , M. S. Yeo , K. W. Kim , Effect of mrt
variation on the energy consumption in a pmv - controlled office , Build. Environ. 45 ( 9 ) ( 2010 ) 1914 – 1922 .
[17] L. Zampetti , M. Arnesano , G. Revel , Experimental testing of a system for the energy - efficient sub - zonal heating management in indoor environments based on pmv , Energy Build. 166 ( 2018 ) 229 – 238 .
[18] D. - S. Lee , E. - J. Kim , Y. - H. Cho , J. - W. Kang , J. - H. Jo , A field study on application of infrared thermography for estimating mean radiant temperatures in large stadiums , Energy Build. 202 ( 2019 ) 109360 .
[19] E. Enríquez , V. Fuertes , M. Cabrera , J. Seores , D. Muñoz , W. More , J. Fernández , Model to evaluate the thermal comfort factor: dynamic measurement of heat flow in building materials , J. Build. Eng. 20 ( 2018 ) 344 – 352 .
[20] J. Bouyer , J. Vinet , P. Delpech , S. Carre , Thermal comfort assessment in semi - outdoor environments: application to comfort study in stadia , J. Wind Eng. Ind. Aerod. 95 ( 9 – 11 ) ( 2007 ) 963 – 976 .
[21] P. Höppe , Different aspects of assessing indoor and outdoor thermal comfort , Energy Build. 34 ( 6 ) ( 2002 ) 661 – 665 .
[22] A. Szucs , S. Moreau , F. Allard , Aspects of stadium design for warm climates , Build. Environ. 44 ( 6 ) ( 2009 ) 1206 – 1214 .
[23] S. Nada , H. El - Batsh , H. Elattar , N. Ali , Cfd investigation of airflow pattern, temperature distribution and thermal comfort of ufad system for theater buildings applications , J. Build. Eng. 6 ( 2016 ) 274 – 300 .
[24] T. Van Hooff , B. Blocken , M. Van Harten , 3d cfd simulations of wind flow and wind - driven rain shelter in sports stadia: influence of stadium geometry , Build. Environ. 46 ( 1 ) ( 2011 ) 22 – 37 .
[25] T. Uchida , R. Araya , et al. , Practical applications of the large - eddy simulation technique for wind environment assessment around new national stadium, Japan (tokyo olympic stadium) , Open J. Fluid Dynam. 9 ( 2019 ) 269 04 .
[26] A. Palmowska , B. Lipska , Experimental study and numerical prediction of thermal and humidity conditions in the ventilated ice rink arena , Build. Environ. 108 ( 2016 ) 171 – 182 .
[27] A. Limane , F. H , N. Galanis , Three - dimensional OpenFOAM simulation to evaluate the thermal comfort of occupants, indoor air quality and heat losses inside an indoor swimming pool , Energy Build. 167 ( 2018 ) 49 – 68 . [28] I. A. Stamou , I. Katsiris , A. Schaelin , Evaluation of thermal comfort in Galatsi
arena of the Olympics “Athens 2004” using a CFD model , Appl. Therm. Eng. 10 ( 2008 ) 1206 – 1215 .
[29] ANSYS CFX - Solver Manager User’s Guide , [link]. URL 2019 . http:// read. pudn. com/ downloads500/ ebook/ 2077964/ cfx_ solv. pdf .
[30] S. Ghani , E. A. ElBialy , F. Bakochristou , S. M. A. Gamaledin , M. M. Rashwan , B. Hughes , Thermal performance of stadium’s Field of Play in hot climates , Energy Build. 139 ( 2017 ) 702 – 718 .
[31] UEFA stadium infrastructure regulation , [link]. URL 2019 . https:// it. uefa. com/ MultimediaFiles/ Download/ uefaorg/ Stadium& Security/ 01/ 48/ 48/ 85/ 1484885_ DOWNLOAD. pdf .
[32] weather2visit , [link]. URL 2019 . https:// www. weather2visit. com/ middle - east/ qatar/ doha - december. htm .
[33] P. Sosnowski , A. Petronio , V. Armenio , Numerical model for thin liquid film with evaporation and condensation on solid surfaces in systems with conjugated heat transfer , Int. J. Heat Mass Tran. 66 ( 2013 ) 382 – 395 .
[34] D. M. Hargreaves , N. G. Wright , On the use of the k - ω model in commercial CFD software to model the neutral atmospheric boundary layer , J. Wind Eng. Ind. Aerod. 95 ( 5 ) ( 2007 ) 355 – 369 .
[35] ASHRAE, Handbook of Fundamentals.
[36] J. Luo, D. N. O'Sullivan, A. Jackson, Assessing Thermal Comfort and Performance of the Airfloor Hvac System Using Multi - Software Coupled Modelling Method. [37] C. Mannion , H. Melvin , M. Geron , M. Keane , Analysis of User Comfort and
Thermal Behaviour of a Room under Forced Convection Conditions , Research Day , 2013 Schedule 37 .
[38] B. Blocken , C. Gualtieri , Ten iterative steps for model development and evaluation applied to computational fluid dynamics for environmental fluid mechanics , Environ. Model. Software 33 ( 2012 ) 1 – 22 .
[39] J. Franke , A. Hellsten , H. Schlünzen , B. Carissimo , Best Practice Guideline for the CFD Simulation of Flows in the Urban Environment , vol. 44 , 2007 .
[40] S. Kato , S. Murakami , T. Takahashi , T. Gyobu , Chained analysis of wind tunnel test and CFD on cross ventilation of large - scale market building , J. Wind Eng. Ind. Aerod. 67 – 68 ( 1997 ) 573 – 587 .
[41] P. Karava , T. Stathopoulos , A. K. Athienitis , Wind - induced natural ventilation analysis , Sol. Energy 81 ( 1 ) ( 2007 ) 20 – 30 .
[42] T. Van Hooff , B. Blocken , On the effect of wind direction and urban surroundings on natural ventilation of a large semi - enclosed stadium , Comput. Fluid 39 ( 7 ) ( 2010 ) 1146 – 1155 .
[43] B. Blocken , T. Stathopoulos , J. Carmeliet , CFD simulation of the atmospheric boundary layer: wall function problems , Atmos. Environ. 41 ( 2 ) ( 2007 ) 238 – 252 . [44] Qatar Meteorology Department , [link]. URL 2017 . http:// qweather. gov. qa/ index.
aspx .
[45] W. L. Cheng , A. Saleem , R. Sadr , Recent warming trend in the coastal region of Qatar , Theor. Appl. Climatol. 128 ( 1 – 2 ) ( 2017 ) 193 – 205 .
[46] BSI , Bs en iso 7730 , Ergonomics of the Thermal Environment. Analytical Determination and Interpretation of Thermal Comfort Using Calculation of the Pmv and Ppd Indices and Local Thermal Comfort Criteria , 2005 2005 . [47] F. Fantozzi , G. Lamberti , Determination of thermal comfort in indoor sport
facilities located in moderate environments: an overview , Atmosphere 10 ( 12 ) ( 2019 ) 769 .
[48] ASHRAE, Handbook of Fundamentals, Chapters 5 and 7.
[49] F. Nicol , M. Humphreys , S. Roaf , Adaptive Thermal Comfort: Principles and Practice , Routledge , 2012 , pp. 10 – 22 .
[50] R. De Dear, G. S. Brager, Developing an Adaptive Model of Thermal Comfort and Preference.
[51] R. de Dear , J. Xiong , J. Kim , B. Cao , A Review of Adaptive Thermal Comfort Research since 1998 , Energy and Buildings , 2020 109893 .
[52] J. F. Nicol , M. A. Humphreys , Adaptive thermal comfort and sustainable thermal standards for buildings , Energy Build. 34 ( 6 ) ( 2002 ) 563 – 572 .
[53] ASHRAE, Standard 55: Thermal Environmental Conditions for Human Occupancy. [54] ASHRAE, Standard 55: Thermal Environmental Conditions for Human Occupancy. [55] C. S. EN15251, et al., Indoor Environmental Input Parameters for Design and
Assessment of Energy Performance of Buildings Addressing Indoor Air Quality, Thermal Environment, Lighting and Acoustics, Thermal Environment, Lighting and Acoustics, European Committee for Standardization, Brussels.
[56] T. C. C. 156, Energy performance of buildings – part 1: indoor environmental input parameters for design and assessment of energy performance of buildings addressing indoor air quality, thermal environment, lighting and acoustics, Module M1 – 6 (EN 16798 – 1).
[57] A. Van der Linden , A. C. Boerstra , A. K. Raue , S. R. Kurvers , R. De Dear , Adaptive temperature limits: a new guideline in The Netherlands: a new approach for the
assessment of building performance with respect to thermal indoor climate , Energy Build. 38 ( 1 ) ( 2006 ) 8 – 17 .
[58] A. C. Boerstra , J. van Hoof , A. Van Weele , A new hybrid thermal comfort guideline for The Netherlands: background and development , Architect. Sci. Rev. 58 ( 1 ) ( 2015 ) 24 – 34 .
[59] B. Li , R. Yao , Q. Wang , Y. Pan , An introduction to the Chinese evaluation standard for the indoor thermal environment , Energy Build. 82 ( 2014 ) 27 – 36 . [60] T. E. Bernard , Prediction of workplace wet bulb global temperature , Appl. Occup.
Environ. Hyg 14 ( 2 ) ( 1999 ) 126 – 134 .
[61] FIFA , [link]. URL 2017 . http:// fifamedicinediploma. com/ topic/ environment - temperature - measurement/ .
[62] R. Stull , Wet - bulb temperature from relative humidity and air temperature , J. Appl. Meteorol. Climatol. 50 ( 2011 ) 2267 – 2269 .
[63] V. E. Dimiceli , S. F. Piltz , S. A. Amburn , Estimation of Black Globe Temperature for Calculation of the Wet Bulb Globe Temperature Index , WCECS 2011 , World Congress on Engineering and Computer Science , San Francisco, USA , 2011 2011 . [64] B. Givoni , Comfort, climate analysis and building design guidelines , Energy Build.
18 ( 1992 ) 11 – 23 .
[65] J. L. J. Liang , R. D. R. Du , Thermal comfort control based on neural network for HVAC application , Proceedings of 2005 IEEE Conference on Control Applications, 2005 , CCA 2005 , 2005 , pp. 819 – 824 .