© The Author(s) 2020.Open Access This article is licensed under a Creative Commons Attribution 4.0 International License (https://creativecommons.org/licenses/by/4.0/), which permits unrestricted use, sharing, adaptation, distribution and reproduction in any medium or format, for any purpose, even commercially, as long as you give appropriate credit to the original author(s) and the source, provide a link to the Creative Commons license, and indicate if changes were made.
High Temperature Compression Tests of A
Commercial Isotropic Ultrafine Grain Graphite
Lisa Centofante1,2, Alberto Monetti2, Giovanni Meneghetti3*
1Università degli Studi di Brescia - Dipartimento di Ingegneria Meccanica e Industriale, Brescia 38-25123, Italy. 2Istituto Nazionale di Fisica Nucleare, Laboratori Nazionali di Legnaro, Viale dell’Università, Padova 2-35020, Italy. 3Università degli Studi di Padova - Dipartimento di Ingegneria Industriale, Via Venezia, Padova 1-35131, Italy.
Correspondence to: Giovanni Meneghetti, Università degli Studi di Padova - Dipartimento di Ingegneria Industriale, Via Venezia, Padova 1-35131, Italy. E-mail: [email protected]
Cite this article: Centofante L, Monetti A, Meneghetti G. High Temperature Compression Tests of A Commercial Isotropic Ultrafine Grain Graphite. Adv Matl Sci Tech 2020;2:1:45-59.
Published: Jun 2020
Abstract
Graphite is often used to design components working at high temperature in a variety of industrial and research environments. It is therefore important to know the mechanical resistance of this material at high temperature. This work reports the compressive strength up to 2000 °C of an isotropic ultrafine grain graphite, the POCO EDM-3, which has not been analysed in the literature yet. This graphite is used to design components able to withstand extreme environmental conditions, due to the properties resulting from the uniform and isotropic microstructure of the material. A vacuum compression test equipment was developed, able to work above 2000 °C. Both cylindrical and hourglass-shaped specimens were tested and the influence of density was also evaluated. The influence of the materials in contact with the specimen ends was also analysed, but a negligible dependence was observed. The tests demonstrated that the compressive strength increases as the density and the temperature increase: at 2000 °C a 22% average increase of the compressive strength over its room-temperature value was noted.
Keywords
Graphite; compressive strength; high temperature; hourglass-shaped specimen 1. INTRODUCTION
Graphite is used in a wide field of industrial applications, thanks to high resistance at high temperature, low thermal expansion and high thermal conductivity, translating into excellent thermal shock resistance. For this reason, it is widely used in several industries, such as metallurgical or the renewable energy industries. However, it is also used in some cutting edge fields, such as aerospace or physical accelerators research facilities. A current example is given by the SPES project, presently in the installation phase at the Legnaro
Open Access
© The Author(s) 2020. www.omniscient.sg
Laboratories of INFN, Italy[1-3]. The project is aimed at the construction of a facility for the production of radioactive ion beams, for physical and medical research. Due to the severe conditions that will be achieved during operation, owing to the high temperature and severe stresses[4-6], graphite is chosen for designing several devices.
The increasing interest in the use of graphite as a high temperature structural material is also demonstrated by the numerous investigations on high-temperature mechanical and thermal properties of this material. Greenstreet[7], Green[8] and Price[9] presented a review about the published mechanical properties data for artificial graphite; Malmstrom et al.[10] and Wagner et al.[11] analysed some mechanical properties at high temperature; Smith[12] and Martens et al.[13] tested high temperature tensile strength, while Green[14] and Gillin[15] performed compressive tests over 2000 °C.
In these studies, different types of graphite have been used, as reported in Table 1. However, all results support the following conclusions:
• Resistance increases with temperature up to 2500 °C, where the highest strength value can be up to twice its room temperature value. At higher temperature, a significant decrease is observed.
• Resistance increases with density.
• Elastic modulus increases with temperature.
Even though many quantitative tensile test data are available, only Green[14] and Gillin[15] presented experimental results regarding the high temperature compressive strength of some anisotropic graphite. Moreover, the strength proved to be strictly dependent on the particular type of graphite. Therefore, while it is possible to compare results taken from different studies in order to highlight a general behaviour of this type of material, on the other hand it is necessary to perform a dedicated characterization for quantitative evaluation of a given graphite.
In particular, in the present work, the POCO EDM-3 isotropic ultrafine grain graphite used for the devices of SPES Project is studied. These devices are often subject to compressive stresses, due to restrained thermal expansions. The EDM-3 grade offers a uniform ultrafine microstructure: the particles are all the same small size, less than 5 µm. The pores are also small, typically less than 1 µm. This graphite has no preferred grain orientation and it is therefore isotropic.
46 of 59 Adv Matl Sci Tech 2020;2:1:45-59
Table 1. Designation and characteristics of graphite analysed in previous studies
Author Material Designation Manufacturer Description
Malmstrom et al.[10]
AGX National Carbon Company Extruded and graphitized at 2600 °C; anisotropic; ρ = 1.58 g/cm3
C-18 National Carbon Company Molded and graphitized at 2600 °C; anisotropic; ρ = 1.60 g/cm3
SA-25 National Carbon Company Molded and graphitized at 3000 °C; isotropic with small crystallites; ρ = 1.55 g/cm3
AUF National Carbon Company Extruded and graphitized at 3000 °C; anisotropic; ρ = 1.67 g/cm3
AWG National Carbon Company Molded and graphitized at 3000 °C; anisotropic; ρ = 1.76 g/cm3
Wagner et al.[11]
H4LM Great Lake Carbon Company Extruded; maximum particle size 838.2 µm; ρ = 1.72 g/cm3
CK Los Alamos Scientific Laboratories Molded; ρ = 1.71 g/cm3
LDH Los Alamos Scientific Laboratories Molded; Uranium content 125 mg/cm3 carbon; ρ = 1.73 g/cm3
LDC Los Alamos Scientific Laboratories Molded; Uranium content 250 mg/cm3 carbon; ρ = 1.66 g/cm3
Smith[12] H4LM Great Lake Carbon Company Extruded; maximum particle size 838.2 µm; ρ = 1.72 g/cm3
Martens et al.[13] 3499 Speer Carbon Company Molded and graphitized above 2260 °C; maximum particle size 127 µm; ρ = 1.57 g/cm3
H3LM Great Lake Carbon Company Extruded; maximum particle size 838.2 µm; ρ = 1.68 g/cm3
Green[14] AUF National Carbon Company Extruded and graphitized at 3000 °C; anisotropic; ρ = 1.67 g/cm3
Gillin[15] “Type A” UKAEA, Harwell Extruded and graphitized at 2700 °C; anisotropic; ρ = 1.74 g/cm 3
To date, no data regarding compressive strength at high temperature are available for the EDM-3 grade, because only a qualitative trend is available[16]. For this reason, compressive tests have been performed on specimens to assess the material mechanical property. Transferability of the present results generated from laboratory specimens to real, full-scale components is a further step of the design process, which has not been addressed in this paper.
2. MATERIALS AND METHODS
Numerous tests have been performed, in different test conditions, in order to highlight possible factors of influence. In particular, the influence of sample geometry and density has been analysed. The materials in contact with the specimens were also considered.
2.1. Testing equipment
The equipment designed for the experimental tests, shown in Figure 1, is housed inside an aluminium chamber, designed to operate in vacuum chamber.
The graphite specimen lies on the fixed punch and it is compressed by the movable punch. The punches present a tantalum end block, in order to withstand the high temperatures reached during the tests. Heating is obtained by Joule effect, by means of tantalum foils, attached to copper clamps. The maximum temperature on the specimen cross section surface is measured by means of an optical pyrometer, aligned to an observation window. A bellows maintains the vacuum, of the order of 10-5 mbar, inside the chamber to avoid oxidation caused by high temperatures.
An HBM-U9C 10 kN tension-compression load cell has been used for measuring the compressive force and it has been installed thanks to two threaded connections.
The load is applied by using a manual handling: a joint allows the rotation of a screw, which is brazed to a steel component that loads two axial bearings. Four bushes, fixed on a plate, convert the screw rotary motion to a linear motion. A cylindrical nut, coaxial to the screw, transfers the axial load to the force sensor and then to the specimen.
2.2. Specimen Design
Particular attention was paid to specimen geometry, by considering both testing standards and previous studies reported in the literature, regarding graphite and also ceramic materials. In particular, two main types of specimens have been considered: cylindrical and hourglass shaped.
According to ASTM C695-15[17], graphite specimens should present a cylindrical geometry, with a ratio of height to diameter (H/D) equal to two. Lankford[18] performed uniaxial compressive tests with Alumina and Silicon Carbide (SiC) samples at different temperatures. Cylindrical specimens with polished surfaces were used. Thin steel discs have been placed between the specimen and the punches to reduce the barrel effect. Dunlay et al.[19] performed uniaxial compressive tests on different ceramic materials. In order to improve the tests, two Tungsten Carbide punches were used. The hourglass shaped specimens allowed to increase the ratio between the compressive stresses and the radial and hoop tensile stresses. Cosculluela[20] tested several types of specimen geometries. Alumina samples have been compressed with Tungsten Carbide punches. Forquin et al.[21] performed uniaxial compressive tests with Silicon Carbide samples, where an hourglass geometry was used. Bezerra et al.[22] carried out numerical studies and experimental tests on concrete and mortar in order to assess the most suitable geometry for compression tests. The results demonstrated an apparently higher compressive strength of hourglass specimens than cylindrical ones, due to a reduced influence of the contact effects between sample and punch. The study reports that, in cylindrical geometry, stress distribution is altered by the contact and friction phenomena between specimen and punches, triggering failure in the contact area; contrary to this situation, the favourable net- to–gross area ratio of the hourglass specimens implies lower specimen-punch contact stresses for the same applied compressive stress, which leads to failure in the net-section of the specimen. Hence, the studies reported in the literature seem to suggest that the choices of specimen geometry
and of material in contact with the sample strongly affect the compressive strength results. The material density can also influence the compressive strength, besides other graphite mechanical properties, such as tensile strength and hardness; the higher the density, the higher will be the ultimate strength[16].
In the present study, both cylindrical and hourglass specimens have been tested. Moreover, specimens have been taken from two different lots, with different densities. The first one is a rod with diameter of 10 mm and length of 30 mm. The second lot is a rectangular plate, 15 mm thick by 30 mm wide and 20 mm long. One rectangular sample for each lot has been measured: the material density has been calculated as ratio between its mass (m) and its volume (V). Lot 1 presents a density equal to 1.67 g/cm3, while for Lot 2 the density is equal to 1.72 g/cm3. Accordingly, Lot 2 should be stronger than Lot 1.
Thermo-electrical simulations have been performed by means of the FE code ANSYS®, in order to assess the temperature distribution along the specimen. In fact, the optical pyrometer used for the measurements requires a 3-mm-long area with uniform temperature for delivering a correct measure.
In the simulations, axisymmetric constraints were defined. The sample, the tantalum end block and the steel punch, up to the lower bellow flange, have been modelled. An input fixed current was imposed where the tantalum foils have been fixed to the end block. By taking advantage of the symmetry of the sample, a voltage constraint of 0 V was imposed at the centre. Electric and thermal contact resistances were set equal to zero. Radiation heat transfer was applied on specimen lateral surface to the surrounding space, at a fixed temperature of 25 °C, with emissivity as reported in Figure 2.
An example of simulation results is reported in Figure 3 for two geometries, relevant to a current of 150 A. Figure 1. Experimental apparatus developed to apply the compressive forces for the tests.
The results show higher temperatures for the same current in the hourglass specimen, owing to the higher current density and the increasing electrical resistivity with temperature. On the other hand, simulations demonstrate a more uniform temperature distribution in the cylindrical one. Therefore, geometrical parameters have been varied, in order to achieve the best compromise between high temperatures (for proper material characterisation) and uniform distribution (for meaningful temperature measurement by means of the pyrometer).
These analyses allowed also to assess the temperature reached by the Tantalum end blocks and by the steel punches. To ensure the structural integrity of these components, a maximum temperature of 1980 °C[23] for Tantalum and of 925 °C[24] for AISI316 was considered. After the previous considerations, five geometries have been chosen [Figure 4].
Particular attention was paid to the hourglass shape, due to the stress triaxiality that takes place in the reduced section. In fact, the elementary stress formulas typically used are based on members having a constant section. The hourglass specimen presents instead a different stress distribution, with a stress concentration localized in the reduced section and measured by the stress concentration factor Kt, following the equation:
(1)
Where σmax is the maximum stress in the sample and σnom is the nominal stress. At present, the effect of multiaxial stresses in graphite is not fully defined. Several experimental studies have been made regarding graphite strength under multiaxial stress states and results have been interpreted with different criteria. Jortner[25] studied an isotropic graphite in the tension-tension and tension-compression quadrants, and concluded that in Figure 2. Some EDM-3 physical properties used in thermo-electrical simulations: thermal conductivity (a), emissivity (b) and electrical resistivity (c)[16].
compressive state the data follow approximately a maximum shear stress (Tresca) criterion. Broutman et al.[26] found that the tension-compression failure envelope was in fair agreement with the Coulomb-Mohr theory. Ely[27] proposed an alternative modification of the maximum strain energy criterion, in which the three principal stresses are normalized according to the corresponding ultimate strength for the same direction. Babcock[28] stated that the compressive fracture stress data could be approximated by either the Coulomb-Mohr theory or Norris modification of the Von Mises criterion. However, only Jortner performed high temperature tests up to 2200 °C and a suitable criterion has not been defined for all the quadrants. Therefore, in order to assess the maximum stress, the third principal stress has been considered in equation (1). Due to the hourglass radius, also a second principal stress (the hoop stress) originates in the hourglass specimen; however, it is only 6% with respect to the third principal stress. Therefore, the compressive strength has been computed by considering only the third principal stress. However, if the Von Mises criterion were preferred, the difference between the Von Mises stress and the uniaxial compressive stress (third principal stress) would be approximately only 4%. In order to calculate the stress value leading to the sample fracture, it was necessary to perform a structural analysis in ANSYS®: axisymmetric constraints were defined and the horizontal displacement on the upper edge were coupled.
A uniform compression stress of 1 Pa was applied to the sample. In Figure 5 the constraints and the resulting Von Mises stress distribution for the Hourglass I geometry are presented.
The Kt was evaluated as:
(2)
in the case of Hourglass I specimens, while it resulted 1.17 for Hourglass II specimens. Since the material is expected to exhibit a brittle behaviour, the linear elastic stress concentration factor Kt was used to evaluate the compression strength.
2.3. Testing Conditions
The experimental tests have been performed at different temperatures, in order to investigate the behaviour of graphite. In particular, the samples have been tested at room temperature, at 1000 °C and at 2000 °C.
Figure 3. Temperature distribution in two different geometries (I = 150 A).
Some tests were performed by interposing discs in different materials between the specimen and the punch. In particular, discs in Silicon Carbide and graphite have been used. Silicon Carbide discs are able to withstand contact stresses developed by both cylindrical and hourglass geometries; however, their high electrical resistivity prevents sufficient heating of the sample by Joule effect. Therefore, they have been used only in room temperature tests. Graphite discs offer lower resistivity and therefore are suitable for high temperature tests. On the other hand, they are not compatible with the cylindrical samples because the higher contact stresses developed with this geometry can lead to the graphite disc break. For this reason, they have been used only with hourglass specimens, both at room temperature and at high temperatures.
2.4. Testing Procedure
Specimens have been machined in a lathe from the two different lots. Each sample was carefully measured by means of an optical profilometer. Then the specimen was placed inside the chamber, on the Tantalum end block of the fix punch or, when foreseen, over the discs in different materials. In particular, for the hourglass geometry, two samples have been tested with SiC and five with graphite discs; conversely, only one cylindrical sample has been tested with SiC discs.
When a vacuum of 10-5 mbar was reached, a pressure was applied to the sample, corresponding to approximately 20 MPa on the reduced section. The compressive load allowed to decrease the electrical resistivity of the surfaces in contact and facilitated the current flow. The desired heat power was then slowly and gradually reached. An optical pyrometer, aligned to the observation window, checked the temperatures during the test. After the desired temperature was reached, the sample was maintained in this condition for some minutes, as suggested by the testing standard[17]. It was then possible to start the compressive test, by applying slowly the load up to failure. The load cell allowed to obtain the compressive strength that was calculated using the following equation:
Geometry D (mm) d (mm) H (mm) l (mm) R (mm) N° samples RT 1000 oC 2000 oC Hourglass I 6 4 16 8 8.5 12 4 7 Hourglass II 6 3 14 6 3.75 1 - -Cylindrical I 4 - 8 - - 1 - -Cylindrical II 6 - 12 - - 2 1 -Cylindrical III 5 - 10 - - 2 -
(3)
with σCR being the ultimate compressive strength (MPa), σnom the nominal stress (MPa), Kt the stress concentration factor, Fr the force that led to failure (N), and A the specimen reduced section (mm2).
3. RESULTS 3.1. Failure Modes
Failure modes are presented in Table 2. Five cylindrical specimens have been tested at room temperature while only one cylindrical sample has been tested at 1000 °C. The specimens often broke abruptly, showing no particular failure pattern. Moreover, failure due to contact and friction stresses arose during testing the cylindrical geometries, both at room temperature and at 1000 °C. Similar behaviour of cylindrical samples have been encountered by Bezerra et al.[22] in his study on mortar and concrete compressive mechanical tests. For this reason, no further tests have been performed with this geometry.
In hourglass specimens failure always started at the reduced cross section and exhibited two different modes. In the first one, the fracture plane was oriented at a 45° plane with respect to the load direction (shear plane). The second mode consisted in interacting shear planes with a co-axial fracture plane starting from the re-entrant corner (interacting planes). In particular, most samples tested at room temperature exhibited an interacting planes failure while most samples tested at high temperature exhibited the shear plane mode. As opposed to cylindrical specimens, hourglass specimens were not subjected to sudden rupture, but they gradually broke by progressive crack propagation, which initiated at middle height.
In Figures 6 and 7, fracture surfaces have been analysed by means of a Scanning Electron Microscope. Two hourglass specimens, tested at room temperature and at 2000 °C, respectively, have been compared. The scans have been performed in different positions along the fracture surfaces of the samples. In Figure 8 the comparison between a cylindrical and an hourglass specimen tested at 1000 °C is reported. Both at room temperature and at high temperature, two different fracture surface morphologies can be observed in the specimens. The first one is characterized by indented surfaces, while in the second one smooth platelets can be recognized. In Figures 6 and 7 an example for each type of morphology, denominated Indented and Platelets respectively, is reported. Apparently, no clear sign of plastic deformation can be observed in the images. This seems to be in agreement with the results obtained by Green[14] in his study on high temperature compression tests on the anisotropic AUF grade graphite (National Carbon Company). Brittle fractures occurred at Figure 5. Constraints applied in the structural simulation for the Kt calculation (on the left) and stress distribution (on the right) for the Hourglass I geometry.
temperatures from 20 °C to about 2000 °C, without any sign of creep damage. On the contrary, Gillin[15], while studying the compressive strength of two anisotropic nuclear grade graphite, observed an increasing plastic strain starting from approximately 1500 °C and fracture planes oriented at 45° to the compression axis. The available studies on compressive strength at high temperature are therefore in disagreement about the behaviour of graphite at 2000 °C. Moreover, neither the indented surfaces nor the platelets-like morphology seem to be definitely attributable to a material ductility rather than a brittle behaviour. Moreover, data at high temperature are not available for the POCO-EDM3 graphite and data in literature[16] suggest a brittle behaviour of this graphite at room temperature. Since it is possible to observe the same fracture surface morphologies both at room temperature and at 2000 °C, the results of this study seem to suggest a brittle fracture also at high temperature.
3.2. Compressive Strength
Cylindrical specimens have been tested at room temperature using the tantalum end blocks and, in one case, interposing the SiC discs. The results in Figure 9 show higher strength for specimens with higher density (Lot 2). Contact material does not seem to influence the result.
Also hourglass specimens were tested at room temperature, interposing different contact materials. The results and the comparison with cylindrical geometries are reported in Figure 10. Strength values for hourglass specimens have been evaluated using equation (3), where the third principal stress has been chosen as maximum stress.
Also for this type of geometry, no influence of the contact material could be observed while the influence of density on the strength is evident. Moreover, the hourglass specimens present higher resistance with respect to the cylindrical geometries. In particular, the strength of hourglass samples is approximately 30% higher than the cylindrical ones.
For this reason, the hourglass geometry was preferred for the high temperature tests. The results obtained with the cylindrical samples were not considered for determining the final compressive strength of the graphite material, neither at room temperature nor at high temperature.
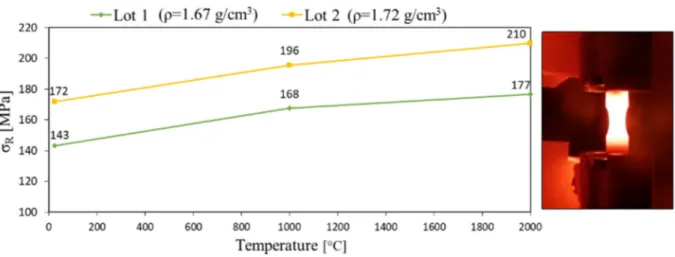
Figure 11 presents the average trend of the compressive strength with temperature, evaluated testing Hourglass I geometry.
Table 2. Geometries failure modes
Specimen geometry Failure mode Remarks
Cylindrical H/D = 2
• Cylindrical I
• Cylindrical II
• Cylindrical III
No defined failure pattern. The specimens often broke abruptly.
• Failure due to contact and friction stresses arose during testing;
• Fragments expulsion at contact surface during the tests. Hourglass:
• Hourglass I
• Hourglass II
shear plane interacting planes • No failure due to contact and friction stresses arose during testing, performed both at room temperature and at high temperature;
• Most samples tested at room temperature exhibited an interacting planes failure;
• Most samples tested at high temperature exhibited a shear plane failure.
As temperature increases, also the strength increases. In particular, at 2000 °C a 22% average increase over the room temperature value was noted. Moreover, for the same test temperature, the influence of density can be Figure 6. SEM micrographs of fracture surface of an hourglass specimen tested at room temperature (RT). Two different fracture surface morphologies can be observed: Indented (a) and Platelets (b).
Figure 7. SEM micrographs of fracture surface of an hourglass specimen tested at 2000 °C. Two different fracture surface morphologies can be observed: Indented (a) and Platelets (b).
appreciated: a 3% increase of the density leads approximately to a 20% increase in strength. 4. DISCUSSION
4.1. Influence of Density
Previous results suggest that density influences the compressive strength of the samples. Both at room temperature and at high temperature, the lot with the higher density presented higher strength, no matter the geometry. This result confirms the behaviour described by the manufacturer, the POCO Company[16], and they are in agreement with the data in literature[7,10,15].
4.2. Comparison of Failure Modes
While hourglass specimens could be tested under nearly pure uniaxial compression, cylindrical geometries were affected by an uncontrolled off-axis loading during testing. The root cause was attributed to the higher contact stresses developed in cylindrical specimens than in hourglass specimens for the same net-section stress. Local failures at the specimens ends due to contact and friction stresses accompanied by expulsion of fragments of material were observed in cylindrical specimens. The resulting damaged surface on top of the sample prevented to keep alignment of the specimen with the loading axis, resulting in uncontrolled off-axis loading. The upper punch was then laterally dragged off-axis by the eccentrically loaded sample [Figure 12], which caused a non uniform stress distribution on the cross section of the specimen. Eventually an apparently lower strength was evaluated.
As opposed to the previous case, in the hourglass geometries the net-section is subject to a well higher stress level than the gross parts of the specimen. Therefore, these specimens were not affected by local failures caused by the contact stresses between specimen’s end surfaces and tantalum punches. They gradually broke with propagation of cracks starting from the net-section, without off-axis loading effects [Figure 13]. For this reason, hourglass geometry has been considered suitable for compressive tests on graphite. Similar conclusions were suggested by Bezerra et al.[22].
Figure 8. SEM micrographs of fracture surfaces of an hourglass specimen (a) and a cylindrical specimen (b) tested at 1000 °C, with a magnification of 100 × and 400 ×.
4.3. Strength Increase with Temperature
The tests demonstrated that as the temperature increases, the compressive strength increases: at 2000 °C there was an average increase of 22% over its room-temperature value. This behaviour was previously observed for the tensile strength[7,10-13], it is consistent with the POCO indications and it is in agreement with data in literature for other types of graphite[14,15], as shown in Table 3. However, to the authors’ best knowledge, the present study reports the first data of compressive strength at 2000 °C for this type of graphite.
5. CONCLUSIONS
In this study high temperature compressive tests on an isotropic ultrafine grain graphite, the POCO EDM-3, have been presented. The results show an increase in strength with temperature. In particular, the tests demonstrated that the compressive strength increases as the density and the temperature increase: at 2000 °C a 22% average increase of the compressive strength over its room-temperature value was noted. Moreover, a 3% increase of the density led approximately to a 20% increase in strength. These results are in line with other data in literature. Concerning the sample geometry, the hourglass shape is considered suitable for compressive tests: stress concentration at the reduced cross section decreases the contact-surface effects. Failure always occurred at middle height, promoting only two modes of failure, i.e., shear plane or interacting planes. On the contrary, Figure 9. Strength data for cylindrical specimens at room temperature, obtained from Lot 1 and Lot 2 respectively.
Figure 10. Compressive strength at room temperature for cylindrical and hourglass specimens, varying the contact material and the Lot.
cylindrical specimens proved to be unsuitable for compressive test, because failure is caused by the contact and friction stresses at the specimen-punch interface. As things stand today, the hourglass specimens are therefore recommended for compressive tests.
Figure 11. Average compressive strength with temperature in Hourglass I specimens. On the right, an Hourglass I specimen at 1000 °C, shortly before break.
Figure 12. Sequence of images shortly before failure of a Cylindrical I specimen. In frame b), a fragment expulsion and the resulting uncontrolled off-axis loading can be appreciated. In frame c), the damaged surface of the specimen can be observed.
Figure 13. Sequence of images shortly before failure of a Hourglass I specimen. No fragment expulsion, nor uncontrolled off-axis loading occurred. Hence, the loading axes of the two punches were kept aligned.
Table 3. Comparison between outcomes of present paper and previous studies
Average ultimate compressive strength σCR (MPa)
Author Graphite
designation Behaviour Specimen Geometry Density (g/cm3) Orientation to extrusion direction
RT 1000
(°C) 2000 (°C) ΔσRT-1000CR % ΔσRT-2000CR % Gillin[15] “type A” Anisotropic Cylindrical 1.74 // 29.4 30.4 35.3 3,4 20,1
⊥ 30.4 30.4 36.3 0 19.4
“isotropic” Anisotropic Cylindrical 1.70 // 50 52.5 68.6 5.0 37.2
⊥ 45.1 48 64.7 6.4 43.5
Green[14] AUF grade
(National Carbon Company)
Anisotropic Cylindrical 1.67 // 33 40 50 21.2 51.5
Present paper EDM-3 (POCO
Entegris) Isotropic Hourglass 1.671.72 143172 168196 177210 17.514.0 23.822.1
REFERENCES
[1] Andrighetto A, Biasetto L, Manzolaro M, Scarpa D, Montano J, Stanescu J, Benetti P, Cristofolini I, Carturan MS, Colombo P. Production of High-Intensity RIB at SPES. Nucl Phys A 2010,834(1–4):754c-757c.
[2] Monetti A, Andrighetto A, Petrovich C, Manzolaro M, Corradetti S, Scarpa D, Rossetto F, Martinez Dominguez F, Vasquez J, Rossignoli M. The RIB Production Target for the SPES Project. Eur Phys J A 2015,51(10).
[3] Scarpa D, Biasetto L, Corradetti S, Manzolaro M, Andrighetto A, Carturan S, Prete G, Zanonato P, Stracener DW. Neutron-Rich Isotope Production Using the Uranium Carbide Multi-Foil SPES Target Prototype. Eur Phys J A 2011,47(3):1–7.
[4] Monetti A, Bark RA, Andrighetto A, Beukes P, Conradie JL, Corradetti S, Fourie D, Lussi C, Manzolaro M, Meneghetti G. On-Line Test Using Multi-Foil SiC Target at IThemba LABS. Eur Phys J A 2016,52(6):1–10.
[5] Manzolaro M, Corradetti S, Andrighetto A, Ferrari L. A Steady-State High-Temperature Method for Measuring Thermal Conductivity of Refractory Materials. Rev Sci Instrum 2013,84(5).
[6] Corradetti S, Andrighetto A, Manzolaro M, Scarpa D, Vasquez J, Rossignoli M, Monetti A, Calderolla M, Prete G. Research and Development on Materials for the SPES Target. EPJ Web Conf 2014,66:4–7.
[7] Greenstreet WL. Mechanical Properties of Artificial Graphites - A Survey Report; Oak Ridge, Tennessee, 1968.
[8] Green L. Observations on the High-Temperature Elastic and Inelastic Properties of Polycrystalline Graphites. In Proceedings of the Fourth Carbon Conference 1959;497–509.
[9] Price RJ. Mechanical Properties of Graphite for High-Temperature Gas-Cooled Reactors: A Review. 1975.
[10] Malmstrom C, Keen R, Green L. Some Mechanical Properties of Graphite at Elevated Temperatures. J Appl Phys 1951,22(5):593– 600.
[11] Wagner P, Driesner AR. High-Temperature Mechanical Properties of Graphite. I. Creep in Compression. J Appl Phys 1959,30(2):148– 151.
[12] Smith MC. Effects of Temperature and Strain Rate on Transverse Tensile Properties of H4Lm Graphite Tested in Helium and in Vacuum. Carbon N Y 1964,1:47–153.
[13] Martens HE, Button DD, Fischbach DB, Jaffe LD. Tensile and Creep Behavior of Graphites above 3000°F. In Proceedings of the Fourth Carbon Conference 1960:511–531.
[14] Green L. High Temperature Compression Tests on Graphite. J Appl Mech 1952,20(2):289–294. [15] Gillin LM. Deformation Characteristics of Nuclear Grade Graphites. J Nucl Mater 1967,23(3):280–288. [16] POCO Graphite. Properties and Characteristics of Graphite; 2015. https://doi.org/10.1002/ejoc.201200111.
[17] ASTM C695-15. Standard Test Method for Compressive Strength of Carbon and Graphite. ASTM B Stand 2015:1–3. [18] Lankford J. Compressive Strength, Hardness, and Indentation Damage in Ceramic Materials; San Antonio, Texas, USA, 1982. [19] Dunlay WA, Tracy CA. A Proposed Uniaxial Compression Test for High Ceramics. U.S. Army Mater Technol Lab MTL-TR-89-89
1989,29.
[20] Cosculluela A. Plasticite, Endommagements et Ruptures Des Alumines Sous Sollicitations Dynamiques Triaxiales: Influence de La Taille Des Grains (In French), University of Bordeaux 1, France, 1992.
[21] Forquin P, Denoual C, Cottenot CE, Hild F. Experiments and Modelling of the Compressive Behaviour of Two SiC Ceramics. Mech Mater 2003,35(10):987–1002.
[22] Bezerra UT, Alves SMS, Barbosa NP, Torres SM. Hourglass-Shaped Specimen : Compressive Strength of Concrete and Mortar (Numerical and Experimental Analyses ). Rev IBRACON Estruturas e Mater 2016,9(4):510–524.
[23] AZO Materials. Properties: Tantalum - An Overview. Available from: https://www.azom.com/properties.aspx?ArticleID=1207 [24] SSINA: Stainless Steel Information Center. High temperature properties. Available from: http://www.ssina.com/composition/
temperature.html
[25] Jortner J. Biaxial Mechanical Properties of AXF-5Q Graphite to 4000°F. In Proceedings of the Conference on Continuum Aspects of Graphite Design 1972;541–532.
[26] Broutman J, Krishnakumar SM, Mallick PK. Effects of Combined Stresses on Fracture of Alumina and Graphite. J Am Ceram Soc 1970,53(12):649–654.
[27] Ely RE. Sterngth of Magnesium Silicate and Graphite Under Biaxial Stresses. Ceram Bull 1968,47(5):37–41.
[28] Babcock SG. Dynamic Biaxial and Elevated-Temperature Properties of ATJ-S Graphite. In Proceedings of the Conference on Continuum Aspects of Graphite Design 1972;50.