A
A
l
l
m
m
a
a
M
M
a
a
t
t
e
e
r
r
S
S
t
t
u
u
d
d
i
i
o
o
r
r
u
u
m
m
–
–
U
U
n
n
i
i
v
v
e
e
r
r
s
s
i
i
t
t
à
à
d
d
i
i
B
B
o
o
l
l
o
o
g
g
n
n
a
a
DOTTORATO DI RICERCA IN
Scienze Veterinarie
Ciclo 29
Settore Concorsuale di afferenza: 07/G1 – SCIENZE E TECNOLOGIE ANIMALI Settore Scientifico disciplinare: AGR/20 – ZOOCOLTURE
TITOLO TESI
Development of innovative feed products and
feed concepts for marine species in
aquaculture
Presentata da:
Erika Bonvini
Coordinatore Dottorato
Relatore
Prof. Arcangelo Gentile Prof. Alessio Bonaldo
Development of innovative
feed products and feed concepts
for marine species
in aquaculture
PhD Thesis
Erika Bonvini
Summary
The sustainability challenges of the aquaculture sector will probably be closely linked with continuing interest in ingredients as alternatives to fishmeal for use within aquafeeds. Among the many protein sources available, plant proteins appear to be the most appropriate alternatives. Different aspects on the health implications of using vegetable feed ingredients on the digestive tract, plus possible effects on quality of the fish, are some of the most relevant problems currently confronting the aqua industry.The need to understand this phenomenon leads to the present thesis, in which the investigation on the feasibility of the inclusion of plant protein in aquafeed was undertaken through a multidisciplinary approach.
The first study highlighted that inclusion of soybean meal in combination with different blends of plant protein maintains optimal growth in 20% fish meal dietary level for the on-growing of European sea bass. Despite fiber is considered as a component that cannot be utilized by most fish, inclusion up to 9.3% has no effects on growth, feed efficiency and digesta transit time in European sea bass. It was encouraging to note that inclusion of high levels of plant protein sources and fiber did not affect health and nutritional status of the animals. When replacing fish meal in aquafeeds, besides the research on alternative ingredients, also the nutritional profile should be considered. In the third study, it was demonstrated that taurine is a required nutrient for juvenile Southern flounder. The fourth study, highlighted that increasing the inclusion of plant ingredients, in substitution of fish meal, had no effects on quality traits of the commercial product.
However, it is not yet an easy or economically feasible task to reduce the aquaculture dependence from marine feedstuff, the present thesis has contributed to provide some insights on
Table of contents
Introduction . . . .1
References . . . 8
Chapter 1 . . . 11
Effects of feeding low fishmeal diets with increasing soybean meal levels on growth, gut histology and plasma biochemistry of European sea bass (Dicentrarchus labrax) Abstract . . . 12
1.1 Introduction . . . 13
1.2 Materials & Methods . . . 14
1.2.1 Experimental diets . . . 14
1.2.2 Fish and feeding trial . . . 15
1.2.3 Sampling . . . 16 1.2.4 Calculations . . . 16 1.2.5 Histology . . . 17 1.2.6 Analytical methods . . . 18 1.2.7 Statistical analysis . . . 18 1.3 Results . . . 19 1.3.1 Growth . . . 19 1.3.2 Blood biochemistry . . . 20 1.3.3 Histology . . . 21
1.4 Discussion . . . 22
References . . . 28
Chapter 2 . . . 34
Feeding European see bass (Dicentrarchus labrax) with increasing dietary fiber levels: impact on growth, blood biochemistry, gut histology, gut evacuation Abstract . . . 35
2.1 Introduction . . . 37
2.2 Materials & Methods . . . 37
2.2.1 Experimental diets . . . 37
2.2.2 Fish and feeding trial . . . 38
2.2.3 Sampling . . . 39
2.2.4 Calculations . . . 40
2.2.5 Histology . . . 41
2.2.6 Gastric evacuation, time and digesta characteristics . . . 41
2.2.6.1 Stomach gastric evacuation pattern calculation . . . 42
2.2.6.2 Foregut and hindgut gastric evacuation pattern calculation 42 2.2.6.3 Digesta characteristics calculations . . . 43
2.2.7 Analytical methods . . . 43
2.2.8 Statistical analysis . . . 44
2.3 Results . . . 44
2.3.1 Growth and blood biochemistry . . . 44
2.3.3 Gut evacuation rate and time . . . 47
2.4 Discussion . . . 50
References . . . 55
Chapter 3 . . . 61
Effect of different dietary taurine levels in plant protein based diets on growth performance in juvenile Southern flounder (Paralichthys lethostigma) Abstract . . . 62
3.1 Introduction . . . 63
3.2 Materials & Methods . . . 64
3.2.1 Experimental diets . . . 64
3.2.2 Fish and feeding trial . . . 64
3.2.3 Sampling . . . 66 3.2.4 Calculations . . . 66 3.2.5 Analytical methods . . . 66 3.2.6 Statistical analysis . . . 67 3.3 Results . . . 67 3.4 Discussion . . . 69 References . . . 72
Chapter 4 . . . 76
Feeding European see bass (Dicentrarchus labrax) with different dietary plant protein levels: impact on growth and quality
Abstract . . . 77
4.1 Introduction . . . 78
4.2 Materials & Methods . . . 79
4.2.1 Experimental diets . . . 79
4.2.2 Fish and feeding trial . . . 80
4.2.3 Sampling . . . 81
4.2.4 Calculations . . . 81
4.2.5 Quality assessment . . . 82
4.2.5.1 Determination of fillet pH, Liquid holding capacity (LHC) and Allo-Kramer shear . . . 82
4.2.5.2 Skin and fillet color . . . 83
4.2.6 Analytical methods . . . 84 4.2.7 Statistical analysis . . . 84 4.3 Results . . . 85 4.3.1 Growth . . . 85 4.3.2 Quality assessment . . . 85 4.4 Discussion . . . 88 References . . . 92
Overall considerations . . . 97
In developing the vision of aquaculture, a focus on the global challenge of doubling food production is fundamental, to feed in a sustainable manner the nine billion people predicted to be on the planet in 2050. Global aquaculture production has more than doubled since 2000, increasing from 41.7 million tonnes to a new high of over 90.4 million tonnes in 2012, with production growing at an annual average rate of 6.7% since then (FAO, 2014). For the finfish and crustacean aquaculture sector to maintain its current growth rate, the supply of nutrient and feed inputs will have to grow at a similar rate (Tacon and Metian, 2015). In fact, aquaculture, as like other intensive terrestrial animal production activities, is totally dependent upon the external provision of feed or nutrient inputs to the culture system (Tacon and Metian, 2008).
In particular, continued growth and intensification of the world finfish production depends upon the development of sustainable protein sources to replace fish meal in aquafeeds (Gatlin et al., 2007). For several years, there has been continuing interest in identifying and developing ingredients as alternatives to fish meal for use within aquafeeds in particular due to the concern raised about the negative impact of fish meal production on global fish stocks has heightened this interest (Tacon et al., 1998; Naylor et al., 2000). Notwithstanding the above, fish meal and fish oil are not essential feed ingredients per se, but rather represent ideal feed ingredients for the aquaculture sector by possessing a nutritional profile approximating to the nutritional requirements of most farmed aquatic species (Tacon and Metian, 2015).
Fish diets of the future will include a wider range of alterative ingredients to fishmeal, therefore is currently the case to identify new ingredients as a potential alternative to fishmeal for use in aquafeed. Among the many protein sources available for animal feeds, plant proteins appear to be the most appropriate alternatives for fish meal in fish diets (Fournier et al., 2004).
There are several key components that should be considered in ingredient assessment including ingredient characterization, ingredient digestibility, palatability, nutrient utilization, functionality and trade commodities/market availability. Ingredient nutritional characterization is the first part of any evaluation process. As reported by Glencross (2007), chemical composition, variability in composition, source and species of origin are all important factors that need to be documented so as to allow any meaningful assessment and reporting of that assessment. Determination of ingredient palatability is the second key component of knowledge required about an ingredient before it can be successfully used. Palatability is defined as the combination of both attractiveness and ingestion of a diet and therefore of most relevance to feed development. This is important because, irrespective of how digestible and available the nutrients and energy from an ingredient might be, if the ingredient reduces feed intake then it will have limited value (Glencross 2007). Commonly, a decrease of feed intake is observed in fish fed diets containing plant protein, due to a reduced feed palatability. Ingredient functionality is another crucial aspect of ingredient evaluation. If an ingredient cannot be functionally introduced into a feed in a manner that allows its processing in a suitable manner, then it is of diminished value as a feed ingredient. Alternatively, some ingredients may add additional value to a diet, based on some functionality features that they contribute to a formulation (Glencross, 2007). Trade commodities are another aspect to be considered in aquafeed formulation. Feed production relies on a basket of common input plant protein ingredients, and other sectors compete for same feed resources (such as animal husbandry or human consumption) (Rana et al., 2009). Since many key ingredients traditionally used in recipes for commercial feeds are internationally traded commodities, aquafeed production is also subjected to any common global market shocks and volatility, thus the increase in the cost of raw ingredients for commercially manufactured or on-farm
aquafeeds resulted in an increase in aquafeed prices (Rana et al., 2009; Lall and Dumas, 2015). Thus, feed ingredient selection by aquaculture feed compounders is usually based upon series of different considerations, these ranging from market availability and cost, nutritional composition and quality, processing/handling requirements and limitations, target species acceptability, to market acceptability for use (Tacon and Metian, 2015). Once identified some products as alternative ingredients, a key area of investigation includes the evaluation of varying proportions and combinations of these ingredients to identify mixtures and formulation that can be modeled based on sustainability, availability and price volatility of ingredients (Tacon and Metian, 2015; De Santis et al., 2016).
Besides the cost of feed, there is substantial pressure to develop formulations that maintain efficient growth at lower cost per unit gain (Hardy, 2010). Thus, with a growing interest in non-fishmeal protein sources for aquafeeds there are several challenges that must be overcome to maintain and enhance growth rates and feed efficiency values at higher levels of substitution of fishmeal (Li et al., 2009).
Moreover, proper nutrition is critical not only to achieve optimal growth rates but also to maintain the health of cultured fish (Sealey and Gatlin, 2001). In the past, in the aquaculture industry relatively little attention has been given so far to the optimal functioning of the digestive system of fish and shrimp and the fish nutrition field focused mainly on establishing the minimum nutrient requirements for normal growth of different fish species (NRC, 2011). Many aquafeed formulations were mainly focused on nutritional specifications and ingredient choices, whereas the optimal utilization of the nutrients by the fish and the health status of the digestive tract are two areas that are not often taken into account. Indeed, nowadays some of the most relevant problems currently confronting the aqua industry are related to the fish health status. The gastro intestinal tract adjusts to changing diet composition, and the mucosal defence system provided by the gastro
intestinal tract must protect the body from injurious agents and at the same time develop oral tolerance to antigens from the diet and commensal microbiota (Chehade and Mayer, 2005). Furthermore, in farmed species, dry diets impose an extra osmotic stress on the intestine, triggering post-prandial drinking and water influx in the chyme from the extracellular fluid in order to moisturize feed to an adequate level for its digestion (Ruohonen et al., 1997; Kristiansen and Rankin, 2001). Histology of the digestive system is one of the tool used to evaluate the health status of fish because it can assess pathological changes that can be induced by nutritional factors. Histopathology can provide additional information on the zootechnical performances to better explore mechanisms involved in digestion, feed utilization, metabolism, and monitoring the overall health of reared fish.
Besides the study of blood metabolites, histological analysis of the digestive system is considered a valid tool to evaluate the health status of fish and the effects of diet formulation on haematological parameters recently have received particular attention. For terrestrial animals, with the development of routine blood tests, evaluation of nutritional status became more practical, sophisticated and precise, allowing an earlier detection of impaired malnutrition and health. Indeed, for terrestrial animals, blood analysis is usually one of the routine evaluation tools, providing important diagnostic and prognostic information of pathological and metabolic disorders and of therapeutic approaches (Kerr, 2008). In fish, impair feeding, specific nutritional deficiencies, stress and disease induce changes in the blood constituents. Thus, the use of blood biochemistry as diagnostic is becoming a useful tool to assess the nutritional condition of animal under intensive aquaculture conditions, also for its characteristics of not being lethal and non-invasive.
With the growth of global aquaculture production, another aspect to be considered is the effect of commercial feeds on fish quality, since consumers are raising their
expectations on quality, nutritional value, healthiness, taste and freshness. It is generally accepted that farmed fish quality can be influenced by the formulation of composition of their feed. As reported by Hardy and Lee (2010), this is a potential advantage for farmed fish over wild fish, but one that the aquaculture industry has been slow to exploit. By using science-based nutritional approaches, farmed fish can be produced to meet target quality characteristics on a consistent basis. Altering nutrient content of feed has an important impact on several parameters, directly influencing the quality of the fish, such as colour and appearance, smell and taste, texture, nutritional quality, shelf life, and level of contaminants (Lie, 2001). The quality of farmed fish can be controlled to a large extent by feeding level, nutrient level in feed, ingredient selection, and protein/lipid ratio of the feed during the latter stages of production.
Given these considerations, behind the importance to find sustainable protein sources to replace fish meal in aquafeed, is necessary to consider all the aspects of these ingredients, with a particular attention to health status and the quality of the animals.
The overall objective of this thesis was to gain further knowledge on the development of innovative feed products and feed concepts for marine species in aquaculture with estimation of the nutritional value of different plant protein ingredients. The diet manipulation can actively play a role in reducing the fish meal content and the products derived from soybean are some of the most studied plant feedstuffs. On the other hand, soybean meal has been found to induce a variety of histological and functional changes in the gastrointestinal tracts of some finfish species. Thus, the first study in this thesis was the evaluation of varying proportions and combinations of soy ingredients to identify mixtures that are more efficiently utilized by the fish. In Chapter 1, the effects of increasing levels of soybean meal by replacing a mix of plant ingredients (wheat meal, wheat gluten, corn gluten and sunflower meal) in low fishmeal diets, on growth, blood
biochemistry profile and gut histology in European sea bass (Dicentrarchus labrax) were investigated.
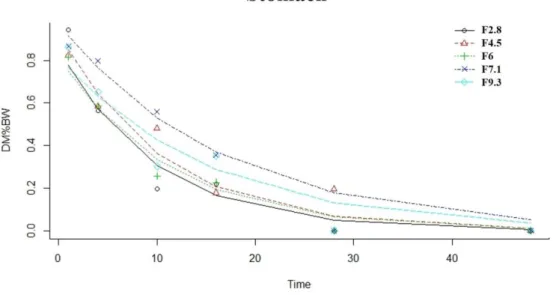
Changing trends in fish feed formulation, with progressively higher inclusion levels of plant ingredients, will invariably introduce more fiber despite this part of the carbohydrate component of plant ingredients cannot be utilized by most fish. Thus, the effects of increasing the dietary fiber level (2.8-9.3%) on growth, nutrient utilization, blood parameters and gut health in European sea bass (Dicentrarchus labrax L.) were studied over 117 days (Chapter 2). Moreover, investigation on digesta transit time through gastrointestinal evacuation pattern and on digesta characteristics was conducted.
Commercial food producers have been trying to substitute fishmeal using alternative plant protein sources, but these products are often devoid or contain very low concentrations of Taurine compared to fishmeal. This amino acid is considered an essential nutrient in some teleost species and comparison among finfish species leads to the conclusion that the response to dietary taurine seems to be species specific. Hence, the following chapter (Chapter 3) was focusing on the understanding of the role of taurine in Southern flounder (Paralichthys lethostigma), an important cultured fish species both for stock enhancement and food fish production, in order to evaluate if this amino acid is an essential nutrient for this species.
It is generally accepted that farmed fish quality can be influenced by the formulation of composition of their feed. For this reason, besides the nutritional properties, another aspect to be considered is if a novel dietary formulation could affect certain quality attributes of the whole fish or flesh, since consumers are raising their expectations on nutritional value, healthiness, taste and freshness. Therefore, in Chapter 4 were studied the effects of increasing levels of a blend of plant proteins, in substitution of fish meal, on growth and quality indexes.
References
Chehade, M., Mayer, L., 2005. Oral tolerance and its relation to food hypersensitivities. The Journal of Allergy and Clinical Immunology 115, 3-12.
De Santis, C., Tocher, D.R., Ruohonen, K., El-Mowafi, A., Martin, S.A.M., Dehler, C.E., Secombes, C.J., Crampton, V., 2016. Air-classified faba bean protein concentrate is efficiently utilized as a dietary protein source by post-smolt Atlantic salmon (Salmo
salar). Aquaculture 452, 169-177.
FAO, (Food and Agriculture Organization), 2014. Rome: FAO Fisheries Department, Fishery Information, Data and Statistics Unit. FishStatJ: a tool for fishery statistics analysis, Release 2.0.0. Universal software for fishery statistical time series. Global capture and aquaculture production: Quantities 1950-2012; Aquaculture values 1984-2012.
Fournier, V., Huelvan, C., Desbruyeres, E., 2004. Incorporation of a mixture of plant feedstuffs as substitute for fish meal in diets of juvenile turbot (Psetta maxima). Aquaculture 236, 451-465.
Gatlin, D.M., Barrows, F.T., Brown, P., Dabrowski, K., Gaylord, T.G., Hardy, R.W., Herman, E., Hu, G., Krogdahl, A., Nelson, R., Overturf, K., Rust, M., Sealey, W., Skonberg, D., Souza, E.J., Stone, D., Wilson, R., Wurtele, E., 2007. Expanding the utilization of sustainable plant products in aquafeeds: a review. Aquaculture Research 38, 551-579.
Glencross, D.B., Booth, M., Allan, G.L., 2007. A feed is only as good as its ingredients – a review of ingredient evaluation strategies for aquaculture feeds. Aquaculture Nutrition 13,17-34.
Hardy, R.W., 2010. Review Article. Utilization of plant proteins in fish diets: effects of global demand and supplies of fishmeal. Aquaculture Research 41, 770-776.
Hardy, R.W., Lee, C.S., 2010. Aquaculture feed and seafood quality. Bulletin of Fisheries Research Agency 31, 43-50.
Kerr, M.G., 2008. Veterinary laboratory medicine: Clinical biochemistry and haematology. 2nd Edition. Blackwell Science Ltd, London.
Kristiansen, H.R., Rankin, J.C., 2001. Discrimination between endogenous and exogenous water sources in juvenile rainbow trout fed extruded dry feed. Aquatic Living Resources 14, 359-366.
Lall, S.P., Dumas, A., 2015. Nutritional requirements of cultured fish: Formulating nutritionally adequate feeds. In: D. Davis, editor, Feed and Feeding Practices in Aquaculture. Elsevier p. 53-109.
Li, P., Mai, K., Trushenski, J., Wu, G., 2009. Review Article. New developments in fish amino acid nutrition: towards functional and environmentally oriented aquafeeds. Amino Acids 37, 43-53.
Lie, Ø., 2001. Flesh quality – the role of nutrition. Aquaculture research 32, 341-348. Naylor, R.L., Goldburg, R.J., Primavera, J.H., Kautsky, N., Beveridge, M.C.M., Clay, J.,
Folke, C., Lubchenco, J., Mooney, H., Troell, M., 2000. Effect of aquaculture on world fish supplies. Nature 405, 1017-1024.
NRC (National Research Council), 2011. Nutrient Requirements of Fish and Shrimp. The National Academies Press, Washington, DC.
Rana, K.J., Siriwardena, S., Hasan, M.R., 2009. Impact of rising feed ingredient prices on aquafeeds and aquaculture production. FAO Fisheries and Aquaculture Technical Paper. No. 541. Rome, FAO. 63p.
Ruohonen, K., Grove, D.J., McIlroy, J.T., 1997. The amount of food ingested in a single meal by rainbow trout offered chopped herring, dry and wet diets. Journal of Fish Biology 51, 93-105.
Sealey, W.M., Gatlin, D.M., 2001. Overview of nutritional strategies affecting the health of marine fish. In: Lim, C., Webster, C.D. (Eds.), Nutrition and Fish Health. Food Products Press, Binghamton, N.Y., pp. 103-118.
Tacon, A.G.J., Dominy, W.G., Pruder, G.D., 1998. Global trends and challenges in aquafeeds for marine shrimp. AquaFeed International 4, 28-35.
Tacon, A.G.J., Metian, M., 2008. Global overview on the use of fish meal and fish oil in industrially compounded aquafeeds: Trends and future prospects. Aquaculture 285, 146-158.
Tacon, A.G.J., Metian, M., 2015. Feed matters: satisfying the feed demand of aquaculture. Reviews in Fisheries Science & Aquaculture 23, 1-10.
Chapter 1
Effects of feeding low fishmeal diets
with increasing soybean meal levels on growth,
gut histology and plasma biochemistry
of European sea bass (
Dicentrarchus labrax
)
Under review in “Animal”
Erika Bonvini1,Alessio Bonaldo1, Luciana Mandrioli1, Rubina Sirri1, Francesco Dondi1, Carlo Bianco1, Ramon Fontanillas2, Fulvio Mongile, PierPaolo Gatta1, Luca Parma1
1Department of Veterinary Medical Sciences, University of Bologna, Ozzano Emilia, Italy 2Skretting Aquaculture Research Centre, Stavanger, Norway
Abstract
The aquaculture industry depends upon the development of sustainable protein sources to replace fishmeal (FM) in aquafeeds and the products derived from soybeans are some of the most studied plant feedstuffs. A key area of investigation for continuing to improve modern aquafeeds includes the evaluation of varying proportions and combinations of plant ingredients to identify mixtures that are more efficiently utilized by the fish. This study investigated the effects of increasing soybean meal (SBM) by replacing a mix of plant ingredients in low FM (20%) diets on growth, blood biochemistry profile and gut histology on European sea bass. Five isonitrogenous and isolipidic experimental diets were formulated: four diets containing increasing SBM levels (0, 10, 20 and 30%; 0SBM, 10SBM, 20SBM and 30SBM, respectively) with a low content of FM (20%) and one control diet (CD) (0% SBM; 35% FM). Diets containing SBM brought to comparable performance and protein utilization to CD, while 0SBM had negative impact on feed conversion rate and protein utilization. Blood parameters suggested an optimal nutritional status under all feeding treatments, even though slightly decreased values were reported at increasing dietary SBM. Histology examination did not show any changes indicative of soy-induced enteritis. We can conclude that for European sea bass: i) different blends of plant protein did not affect feed intake despite the 20% FM dietary level; ii) the inclusion of SBM maintains optimal growth and feed utilization in low FM diets; iii) blood biochemistry profile showed a good nutritional status under all feeding regimes; iv) no evidence of soy-induced enteritis was reported in any group fed low FM diets. For formulation of practical diets in on-growing of European sea bass, SBM up to 30% can be successfully incorporated into feeds containing low FM inclusion.
1.1 Introduction
For several years, there has been continuing interest in identifying and developing ingredients as alternatives to fish meal (FM) for use within aquafeeds, resulting in a substantial decrease of this ingredient in the feed formulation of many species (Tacon et al., 1998). Nowadays aquaculture relies on a basket of common input plant protein ingredients such as soybean meal (SBM), gluten, sunflower meal, for which it competes in the marketplace with the animal husbandry sector as well as with use for direct human consumption (Rana et al., 2009). Based on evidence indicating that mixed dietary plant proteins outperform single sources, a key area of investigation for continuing to improve modern aquafeeds includes the evaluation of varying proportions and combinations of plant ingredients to identify mixtures that are more efficiently utilized by the fish (De Santis et al., 2016). Among the different plant ingredients, SBM is one of the most interesting alternatives to FM because of the advantages of supply, price, protein and amino acid composition (Rossi et al., 2013; Parma et al., 2016). However, SBM has been found to induce a variety of histological and functional changes in the gastrointestinal tracts of several species, especially in salmonids, such as subacute enteritis of the distal epithelial mucosa including morphological alteration and inflammation (Krogdahl et al., 2010).
To our knowledge, only a few studies have explored in European sea bass (Dicentrarchus labrax) the effects of increasing levels of soybean meal on performance, and most of the data in the literature were restricted to replacing FM with SBM. Hence, this study investigated the effects of increasing SBM by replacing a mix of plant ingredients (wheat meal, wheat gluten, corn gluten and sunflower meal) in low fishmeal FM diets, on growth, blood biochemistry profile and gut histology in European sea bass.
1.2 Materials and methods
1.2.1 Experimental diets
Five isonitrogenous and isolipidic experimental diets were formulated: four diets containing increasing SBM levels (0, 10, 20 and 30%; 0SBM, 10SBM, 20SBM and 30SBM, respectively) with a low content of FM (20%) and one control diet (CD) (0% SBM; 35% FM). Ingredients and proximate composition of the experimental diets are presented in Table 1.1.
SBM was replaced by adding a combination of wheat meal, wheat gluten, corn gluten and sunflower meal, as recently described by Parma et al. (2016) on gilthead seabream (Sparus
aurata L.). The diets were produced by Skretting Aquaculture Research Centre, Stavanger,
Norway. According to the feed manufacturer, protein and lipid levels were within the range of commercial diets for sea bass. The high FM level (35%) in the CD group, was
Table 1.1. Ingredients and proximate composition of the experimental diets.
Experimental diets
CD 0SBM 10SBM 20SBM 30SBM
Ingredient, % of the diet
FM North-Atlantic 35.00 20.00 20.00 20.00 20.00 Hi-pro SMB 0.00 0.00 10.00 20.00 30.00 Wheat 21.43 19.31 15.13 10.94 6.75 Corn gluten 12.00 18.00 16.00 14.00 12.00 Wheat gluten 12.05 18.07 15.98 13.89 11.80 Sunflower meal 4.00 8.00 6.00 4.00 2.00 Fish oil North-Atlantic 15.02 16.12 16.40 16.67 16.95 Vit/Min premix1 0.50 0.50 0.50 0.50 0.50 Proximate composition2 Protein 45.41 46.10 47.00 46.63 46.57 Lipid 19.56 19.13 19.19 19.83 20.17 Ash 5.64 4.42 4.72 5.00 5.31 Moisture 6.26 6.61 6.66 6.30 7.22 Energy (MJ) 22.0 22.4 21.9 22.1 22.0
1Vitamin and mineral premix; Skretting, Stavanger, Norway (fulfilling recommendations for marine fish species given by
NRC, 2011).
designed as a low plant protein control diet compared to the rest of experimental diets. The diameter of the pellet was 4 mm.
1.2.2 Fish and feeding trial
The experiment was carried out at the Laboratory of Aquaculture, Department of Veterinary Medical Sciences of the University of Bologna, Cesenatico, Italy. European sea bass juveniles were obtained from Ecloserie Marine de Gravelines (Gravelines, France). One week before the beginning of the trial, fish were fed with a mixture of the five experimental diets. At the beginning of the trial, 60 fish (initial average weight 68.9 ± 1.7 g) per tank were randomly distributed into fifteen 1000 L square tanks with a conical bottom. Each diet was administered to triplicate groups, assigned in a completely random manner, over 91 days. Tanks were provided with natural seawater and connected to a closed recirculation system (overall water volume: 18 m3). The rearing system consisted of a mechanical sand filter (Astralpool, Spain), ultraviolet lights (Philips, the Netherlands) and a biofilter (Astralpool, Spain). The water exchange rate within each tank was 100% every hour, while the overall water renewal amount in the system was 5% daily. During the trial, the temperature was kept constant at 22 ± 1.0 °C and the photoperiod was maintained at 12 h light and 12 h dark through artificial light. The oxygen level was kept constant at 100% saturation by a liquid oxygen system regulated by a software program (B&G Sinergia snc, Chioggia, Italy). Ammonia (total ammonia nitrogen ≤ 0.1 ppm), nitrite (≤ 0.2 ppm) and salinity (25 g L−1) were spectrophotometrically monitored daily
(Spectroquant Nova 60, Merck, Lab business, Darmstadt, Germany). Sodium bicarbonate was added on a daily basis to keep pH constant at 7.8–8.0. Feed was provided to 10% overfeeding by automatic feeders, twice a day for six days a week, while one meal was supplied on Sundays, as reported by Mongile et al. (2014). Each meal lasted 1 hour, after
that the uneaten pellets in each tank were gathered, dried overnight at 105°C, and their weight was deducted for overall calculation.
1.2.3 Sampling
At the beginning and at the end of the experiment, all the fish in each tank were anesthetized and individually weighed. In case of any mortality, fish were immediately removed and the weight was recorded for overall calculation. Specific growth rate, voluntary feed intake and feed conversion rate were calculated. Survival rate was calculated as a percentage of the initial number of fish. The proximate composition of the carcasses was determined at the beginning of the trial on a pooled sample of 10 fish and on pooled samples of 5 fish per tank at the end of the trial. Protein efficiency rate, gross protein efficiency and gross lipid efficiency were calculated. Furthermore, at the end of the trial, wet weight, viscera, liver and visceral fat weight were individually recorded for 5 fish per tank to determine viscerosomatic index, hepatosomatic index, fat index and fillet yield. At the end of the trial five fish per tank (15 fish per dietary treatment) were sampled for intestine histology examination. After the end of the trial, the fish left were kept in the same rearing and feeding conditions for three more days and then were sampled to perform blood analyses of hematocrit, serum total protein, triglycerides and cholesterol. Blood from 5 fish per tank was collected 5 h postprandial from the caudal vein. Samples were then centrifuged (3000g for 10 min at 4°C) and serum aliquots were stored at 4°C and analyzed during the same day.
All experimental procedures were evaluated and approved by the Ethical-Scientific Committee for Animal Experimentation of the University of Bologna, in accordance with European directive 2010/63/UE on the protection of animals used for scientific purposes.
1.2.4 Calculations
Specific growth rate (SGR) (% day-1) = 100 * (ln FBW- ln IBW) / days (where FBW and
IBW represent the final and the initial body weights). Voluntary Feed Intake (VFI) (g feed fish-1) = g feed ingested / fish number. Feed conversion ratio (FCR) = feed intake / weight
gain. Viscerosomatic index (VSI) (%) = 100 * (viscera weight / body weight). Hepatosomatic index (HSI) (%) = 100 * (liver weight / body weight). Mesenteric fat index (MFI) (%) = 100 * (mesenteric fat weight / body weight). Fillet yield (FY) (%) = 100 * (fillet weight / body weight). Protein efficiency rate (PER) = (FBW – IBW) / protein intake. Gross protein efficiency (GPE) (%) = 100 * [(% final body protein * FBW) - (% initial body protein * IBW)] / total protein intake fish. Gross lipid efficiency (GLE) (%) = 100 * [(% final body lipid * FBW) - (% initial body lipid * IBW)] / total lipid intake fish.
1.2.5 Histology
After euthanasia, the gut was removed and the intestine was divided into three segments (proximal, intermediate and distal). From each segment, a 5 mm-long piece was sectioned and fixed in 10% buffered formalin. Samples were then processed for routine histology to obtain a transversal section, which was stained with hematoxylin and eosin (H&E). Sections were evaluated blind under a light microscope (Nikon Eclipse 80i, Nikon Corporation, Japan) for degenerative and inflammatory changes. Regarding diet CD and 30SBM, also morphometry and scoring were conducted for proximal and distal tracts. Morphometry consisted in measurements at 100x magnification of five randomly selected fields per intestinal tract. Width of lamina propria, width of mucosal layer in the middle of the folds, height of mucosal layer at the base of the folds and height of submucosa were measured. Goblet cells were counted in three fields per intestinal tract at 40x magnification. A continuous scale scoring system, with the range of scores set at 0–3, was used for evaluation of inflammatory cells infiltration, number of mast cells and number of intraepithelial lymphocytes. This scoring system was adapted from that used for Atlantic
salmon by Penn et al. (2011). Values of each separate parameter of scoring and morphometry were calculated by averaging.
1.2.6 Analytical methods
Diets and whole body were analyzed for proximate composition. Moisture content was obtained by weight loss after drying samples in a stove at 105 °C until a constant weight was achieved. Crude protein was determined as total nitrogen (N) by using the Kjeldahl method and multiplying N by 6.25. Total lipids were determined according to Bligh and Dyer’s (1959) extraction method. Ash content was estimated by incineration to a constant weight in a muffle oven at 450 °C. Gross energy was determined by a calorimetric bomb (Adiabatic Calorimetric Bomb Parr 1261; PARR Instrument, IL, USA).
The hematocrit value was obtained as packed cell volume % using microhematocrit tubes on a dedicated centrifuge (Hettich Haematokrit 210, Tuttingen, Germany). Serum total protein, cholesterol and triglycerides were measured using colorimetric methods (Total protein OSR6232, Cholesterol OSR6216, Triglyceride OSR61118; Beckman Coulter, Brea, CA, USA) on an automated analyzer (AU 400, Beckman Coulter, Brea CA, USA).
1.2.7 Statistical analysis
All data are presented as mean ± standard deviation (SD). Tank was used as the experimental unit for analyzing growth and performance, a pool of five sampled fish was considered the experimental unit for analyzing carcass composition, whereas individual fish was used for analyzing VSI, HSI, FaI, FY and all blood parameters. All data, except for histological, were analyzed by a one-way ANOVA followed by a Tukey’s multiple comparison test. All statistical analyses were performed using GraphPad Prism 6.0 for Windows (Graph Pad Software, San Diego, CA, USA). The differences among treatments were considered significant at P ≤ 0.05. Histological data were analyzed using software Statistica 8 (StatSoft Inc., Tulsa, Oklahoma). Normal distribution was tested by
Shapiro-Wilk. If normality criteria were not met, Mann-Whitney U-testing was run. Significance was set at P ≤ 0.05.
1.3 Results
1.3.1 Growth
Growth performances are summarized in Table 1.2.
Table 1.2. Growth performance, intake and survival of European sea bass fed experimental diets over
91 days. Experimental diets CD 0SBM 10SBM 20SBM 30SBM P value IBW (g) 68.2 ± 1.3 68.7 ± 0.4 70.0 ± 0.9 69.4 ± 3.2 68.3 ± 2.1 0.7138 FBW (g) 231.6 ± 8.0 219.3 ± 2.5 230.7 ± 3.4 228.3 ± 4.4 228.4 ± 10.4 0.2239 SGR (day-1) 1.34 ± 0.06 1.28 ± 0.01 1.31 ± 0.03 1.31 ± 0.03 1.33 ± 0.04 0.3275 VFI 210 ± 2.9 211 ± 4.5 219 ± 4.8 210 ± 3.7 215 ± 7.7 0.1586 FCR 1.28a ± 0.06 1.38b ± 0.03 1.35ab ± 0.02 1.31ab ± 0.02 1.35ab ± 0.01 0.0234 Survival (%) 100 ± 0.0 100 ± 0.0 100 ± 0.0 100 ± 0.0 99 ± 1.0 0.4516 Data are given as the mean (n=3) ± SD. In each line, different superscript letters indicate significant differences among treatments (P ≤ 0.05).
IBW = Initial body weight. FBW = Final body weight.
SGR = Specific growth rate (% day-1) = 100 * (ln FBW- ln IBW) / days (where FBW and IBW represent the final and the initial body
weights).
VFI = Voluntary Feed Intake (g feed/fish) = g feed ingested/fish FCR = Feed conversion rate = feed intake / weight gain.
No significant differences between treatments were found in final body weight, specific growth rate and voluntary feed intake. Fish fed diet CD showed lower feed conversion rate in comparison to those fed diet 0SBM. No significant differences were recorded in survival rate among groups.
Data on biometric indices, body composition and nutritional indices are shown in Table 1.3. No significant differences were found in viscerosomatic indices, fat index and fillet yield. Within the groups fed low FM, hepatosomatic index significantly decreased from 0SBM to 20SBM, while fish fed diet CD showed higher value in comparison to that fed 10SBM, 20SBM and 30SBM. No significant differences were found in the whole body
proximate composition. Fish fed diet CD showed higher protein efficiency rate in comparison to those fed diet 0SBM and 10SBM and higher gross protein efficiency in comparison to 0SBM. No significant differences among treatments were found in gross lipid efficiency.
Table 1.3. Biometric indices, body composition and nutritional indices of European sea bass fed
the experimental diets.
Experimental diets CD 0SBM 10SBM 20SBM 30SBM P value Biometric indices VSI 12.7 ± 1.9 12.4 ± 2.2 11.8 ± 1.7 11.0 ± 2.3 12.1 ± 2.0 0.2000 HIS 2.2d ± 0.3 2.1cd ± 0.4 1.9bc ± 0.3 1.6a ± 0.3 1.7ab ± 0.4 <0.0001 MFI 9.2 ± 1.6 9.2 ± 2.3 8.4 ± 2.0 7.8 ± 1.9 8.4 ± 1.8 0.2413 FY 48.5 ± 2.0 47.5 ± 1.4 49.0 ± 1.7 47.7 ± 4.7 49.0 ± 3.5 0.2625
Whole body composition, as-is basis
Protein 16.1 ± 0.3 16.0 ± 0.4 16.2 ± 0.4 16.3 ± 0.2 16.0 ± 0.6 0.8391 Lipid 18.5 ± 1.1 19.0 ± 1.2 18.6 ± 1.0 18.8 ± 1.2 17.8 ± 0.3 0.6606 Ash 3.4 ± 0.3 3.0 ± 0.2 3.1 ± 0.2 3.3 ± 0.2 3.2 ± 0.1 0.7511 Moisture 59.2 ± 0.9 59.2 ± 0.9 58.7 ± 1.3 59.9 ± 1.3 57.9 ± 3.6 0.3324 Nutritional indices PER 1.72b ± 0.08 1.55a ± 0.04 1.56a ± 0.02 1.63ab ± 0.02 1.60ab ± 0.04 0.0105 GPE 26.6b ± 0.96 23.6a ± 0.35 24.3ab ± 1.08 25.7ab ± 0.26 24.6ab ± 1.46 0.0210 GLE 79.1 ± 6.69 77.0 ± 5.21 76.3 ± 5.65 77.9 ± 6.43 69.5 ± 2.83 0.3023
Data are given as the mean (n=3; n=15 for VSI, HSI, FaI, FY) ± SD. In each line, different superscript letters indicate significant differences among treatments (P ≤ 0.05).
VSI = Viscerosomatic index (%) = 100 * (viscera weight/body weight). HSI = Hepatosomatic index (%) = 100 * (liver weight/body weight). MFI = Mesenteric fat index (%) = 100 * (mesenteric fat weight / FBW). FY = Fillet yield (%) = 100 * (fillet weight / FBW).
PER = Protein efficiency ratio = ((FBW-IBW)/protein intake).
GPE = Gross protein efficiency = (100*[(%final body protein * FBW)-(%initial body protein * IBW)]/total protein intake fish -1).
GLE = Gross lipid efficiency = (100*[(%final body lipid * FBW)-(%initial body lipid * IBW)]/total lipid intake fish-1).
1.3.2 Blood biochemistry
Hematocrit, serum total protein, triglycerides and cholesterol levels are shown in Table 1.4. No significant differences among treatments were found in hematocrit (P=0.0503) and cholesterol (P=0.0666) levels, even though the values decreased with the increasing of SBM inclusion within low FM diets (0SBM, 10SBM, 20SBM, 30SBM). Fish fed diet CD showed higher serum total protein in comparison to 30SBM and lower serum triglycerides in comparison to 0SBM and 20SBM.
Table 1.4. Hematocrit, serum total protein, triglycerides and cholesterol concentrations of European sea
bass fed the experimental diets.
Experimental diets CD 0SBM 10SBM 20SBM 30SBM P value Hematocrit (%) 44.3 ± 4.5 46.2 ± 5.5 45 ± 4.5 41.7 ± 7.0 41.4 ± 3.6 0.0503 Total Protein (g/dl) 5.7b ± 0.8 5.6ab ± 0.6 5.3ab ± 0.4 5.5ab ± 0.5 5.1a ± 0.4 0.0293 Triglycerides (mg/dl) 923a ± 370 1885b ± 809 1630ab ± 746 1649b ± 826 1339ab ± 638 0.0042 Cholesterol (mg/dl) 335 ± 65 369 ± 108 354 ± 81 350 ± 78 288 ± 56 0.0666
Each value is mean from 15 samples ± SD. In each line, different superscript letters indicate significant differences between treatments (P ≤ 0.05).
1.3.3 Histology
Inflammatory and/or degenerative changes indicative of soy-induced enteritis were not present in any histological section from all subjects examined (Fig. 1.1).
Fig 1.1. Histomorphology of the proximal and distal intestine of sea bass fed the control diet CD (a,c) and 30SBM diet (b,d). Sections shows a normal architecture of the mucosal (regular columnar epithelium with polarized and basally located nuclei), submucosal (loose connective tissue rich in capillary network) and muscular layer for both treatments (H&E, bar=100 µm).
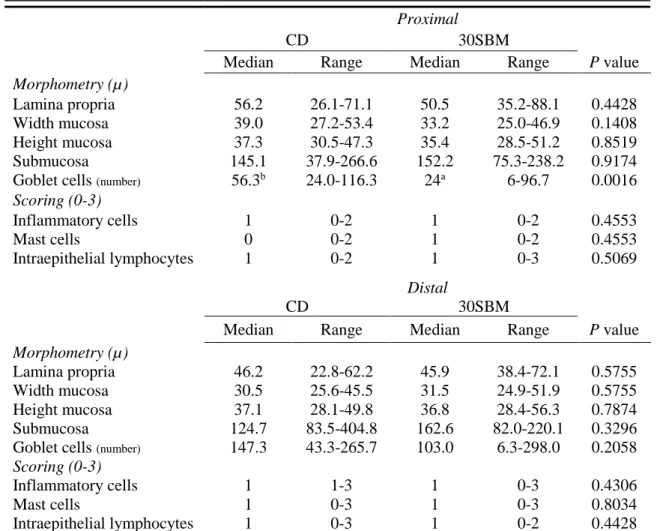
Regarding proximal tract, no differences were recorded for morphometry and scoring while a depletion of goblet cells was found in animals fed 30SBM in comparison to CD. Considering distal tract, no differences were recorded for all the parameters evaluated. All data are shown in Table 1.5.
Table 1.5. Morphometry and histopathological scoring of European sea bass fed diets CD and
30SBM.
Proximal
CD 30SBM
Median Range Median Range P value Morphometry (µ)
Lamina propria 56.2 26.1-71.1 50.5 35.2-88.1 0.4428 Width mucosa 39.0 27.2-53.4 33.2 25.0-46.9 0.1408 Height mucosa 37.3 30.5-47.3 35.4 28.5-51.2 0.8519 Submucosa 145.1 37.9-266.6 152.2 75.3-238.2 0.9174 Goblet cells (number) 56.3b 24.0-116.3 24a 6-96.7 0.0016
Scoring (0-3) Inflammatory cells 1 0-2 1 0-2 0.4553 Mast cells 0 0-2 1 0-2 0.4553 Intraepithelial lymphocytes 1 0-2 1 0-3 0.5069 Distal CD 30SBM
Median Range Median Range P value Morphometry (µ)
Lamina propria 46.2 22.8-62.2 45.9 38.4-72.1 0.5755 Width mucosa 30.5 25.6-45.5 31.5 24.9-51.9 0.5755 Height mucosa 37.1 28.1-49.8 36.8 28.4-56.3 0.7874 Submucosa 124.7 83.5-404.8 162.6 82.0-220.1 0.3296 Goblet cells (number) 147.3 43.3-265.7 103.0 6.3-298.0 0.2058
Scoring (0-3)
Inflammatory cells 1 1-3 1 0-3 0.4306 Mast cells 1 0-3 1 0-3 0.8034 Intraepithelial lymphocytes 1 0-3 1 0-2 0.4428
Each value is median from 15 samples. In each line, different superscript letters indicate significant differences between treatments (P < 0.05).
1.4 Discussion
Few studies have investigated the utilization of plant dietary inclusion in European sea bass, but mainly as a FM replacement. To our knowledge, this is the first study to compare the effects of diets containing the same amount of FM (20%) and different plant protein blends, on the performance of European sea bass.
As reported by Médale and Kaushik (2009), a blend of plant protein sources can replace 75 to 95% of FM in almost all species, thus reducing the pressure of aquaculture on marine resources. The authors also reported that to limit the negative effects of each raw material, the strategy adopted is to replace FM with a mixture of vegetable protein sources. Kaushik et al. (2004) observed that an almost total replacement of FM by a mixture of several plant protein sources had no influence on final weight at commercial size in European sea bass. In the same direction, Geay et al. (2011) found that European sea bass fed an exclusively vegetable-based diet exhibited significantly lower final weight and daily growth index than those fed a fish-based diet. Overall, one of the reasons of reduced growth in fish fed diets containing plant protein is a decrease of feed intake, due to a reduced feed palatability. Interestingly, in the present study no differences were recorded in voluntary feed intake among all feeding regimes. As reported by Fournier et al. (2004) The use of several mixtures of plant protein could reduce the potential inhibition of feed consumption due to the specific effect of a single ingredient (Fournier et al., 2004; Bonaldo et al., 2011; Bonaldo et al, 2015). Hence, in our study, despite the low FM level, the inclusion of different blends of different plant feedstuff did not cause palatability problems in European sea bass.
Considering the low FM treatments, all the diets containing SBM brought to comparable performance and protein utilization to CD. On the other hand, the diet without SBM (0SBM) had negative impact on feed conversion rate and protein utilization. Previous studies reported that SBM can substitute up to 25% of the total protein of the diet without any negative effect on European sea bass performance (Lanari and D’Agaro, 2005). As reported by Bonaldo et al. (2008), SBM was successfully incorporated up to a level of 30% without any deleterious effects on feed intake, growth and protein utilization in commercial diets for European sea bass juveniles with 35% of FM. According to our
results, even in diets containing 20% FM the inclusion of SBM up to 30% maintains optimal growth and feed utilization.
No significant differences were found in VSI and this result is in agreement with those previously reported for this species (Kaushik et al., 2004). The authors reported no differences in VSI in European sea bass fed diets containing different levels of FM incorporation. Geay et al. (2011) suggested no influence on VSI in European sea bass fed a plant-based diet, but it seems that this index was regulated only by genetic factors. Instead, HSI values decreased on increasing the inclusion of SBM. Geay et al. (2011) found lower HSI values in European sea bass fed vegetable-based diets in comparison to fish-based diets; on the contrary, Kaushik et al. (2004) reported no differences in European sea bass fed diets with graded levels of FM replacement. Another possible explanation of the trend in HSI, found in our study, can be related to the decrease in level of wheat in SBM diets. As reported by Bonaldo et al. (2008), increasing starch level can increase HSI values, related to an inverse proportion between wheat and SBM in the diets. Carnivorous fish may seem, in general, to have limited capability to digest and utilize dietary starch. Diets high in digestible carbohydrates have been found to increase liver glycogen in salmon and rainbow trout (Krogdahl et al., 2004). In European sea bass, an increase in liver glycogen content with the increase of dietary starch level is usually observed (Enes et al., 2011).
Information on the nutritional status and health in fish species can be achieved through the study of blood metabolites (Peres et al., 2014; Bonvini et al., 2015). To our knowledge, few studies have assessed blood parameters in response to SBM inclusion in low FM diets in marine species. In aquaculture, this practice is not widely spread and it is to be expected that, as occurs in relation to land animals, blood analysis will become a useful tool (Peres et al., 2014). Data obtained in our study are within the ranges reported for European sea bass under good nutritional status (Coeurdacier et al. 2011; Peres et al.
2014; Faggio et al., 2014). However, we found some differences between feeding treatments. Hematocrit averaged between 41.4 and 46.2. Even though no statistical differences were reported (P=0.0503), lower values were found in fish fed diet 20SBM and 30SBM. As reported for Persian sturgeon (Acipenser persicus) (Imanpoor et al., 2010) and juvenile beluga (Huso huso) (Hosseini and Khajepour, 2013), hematocrit was significantly lowered by increasing SBM of diets. On the contrary, Moradi et al. (2013) reported that hematocrit concentration decreased parallel to plant protein inclusion in diet in Cyprinus
carpio. In rats, raw soy bean reduced red cell osmotic fragility and could also reduce
hematocrit depending on the processing methods applied (Olaleye et al. 1999; Hosseini and Khajepour, 2013). These effects were ascribed to the presence of trypsin inhibitor in soy protein. On the other hand, Alada et al. (2004), reported that consumption of soya bean diet preparations by rats caused gradual but significant increases in hematocrit as the concentration of soya bean in the diet increased. Plasma proteins averaged between 5.7 and 5.1 g dl-1, with the lowest value recorded in diet 30SBM (5.1±0.4 g/dl). Plasma protein level is usually very stable in well-nourished animals but decreases under fasting conditions (Coeurdacier et al. 2011; Peres et al., 2014). Indeed, under malnutrition or stress conditions, altered plasma total protein levels often occur as a consequence of amino acid oxidation or peripheral proteolysis (Peres et al., 2014). There are no clear relationships between the level of SBM in the diet and change in blood protein level of the cultured fish; further investigations will be necessary to determine and understand the effects of the diets on variations of this parameter. Triglycerides and cholesterol levels are in agreement with previously reported values for this species (Couto et al., 2015; Guerreiro et al., 2015), but higher than those reported by Peres et al. (2014). In low FM diets, triglycerides concentration slightly decreased with the increasing of SBM. It has been reported that dietary soy product suppresses lipogenic enzyme activities and may consequently lower
liver and plasma triglyceride levels in different fish species (Dias et al., 2005; Lim and Lee, 2009; Lim et al., 2011). Regarding cholesterol, no statistical differences were detected (P=0.0666), even though the values decreased with the increasing of SBM inclusion within low FM diets. Indeed, several researches reported that soybean components have a hypocholesterolemic effect in fish (Kaushik et al., 1995; Gómez-Requeni et al., 2004), including European sea bass (Couto et al., 2015; Guerreiro et al., 2015).
Regarding histology, no inflammatory and/or degenerative changes were recorded in any of the histological sections. Soybean meal has been found to induce a variety of histological/functional changes in the gastrointestinal tracts of salmonids (Krogdahl et al., 2010). European sea bass seems to be less sensitive to certain soy-anti-nutritional factors, which induce intestinal disturbances in salmonids (Tibaldi et al., 2006). Bonaldo et al. (2008) too reported no evidence of soy-induced enteritis in European sea bass juveniles fed diets with 35% of FM and 30% of SBM. Our results support the thesis that SBM, even at the high inclusion rate of 30% in a diet with only 20% of FM, did not lead to soy-induced enteritis in European sea bass. Further, no differences were recorded in measurement and scoring in proximal and distal tracts in CD and 30SBM diets, and a slight depletion of goblet cells in proximal tracts in 30SBM diet was the only difference reported. Few references are available on this subject. Olsen et al. (2007) observed in cod (Gadus
morhua) goblet cell hypertrophy and hyperplasia in the distal parts of the gastrointestinal
tract in fish fed high plant protein levels. Notwithstanding the above, few studies reported a depletion in number of goblet cells in fish fed a diet with other vegetable raw materials like Jojoba meal (Saleh and Toutou, 2015) and vegetable oil (Perez-Sanchez et al., 2013), but to our knowledge the reasons for this decrement are still unknown. Further investigations will be necessary to determine and understand the effects of the diets on the depletion of these cells.
In conclusion, from our findings we can assess that for European sea bass: i) different blends of plant protein did not affect feed intake despite the 20% FM dietary level; ii) the inclusion of SBM maintains optimal growth and feed utilization in low FM diets; iii) blood biochemistry profile showed a good nutritional status under all feeding regimes; iv) no evidence of soy-induced enteritis was reported in any group fed low FM diets. For formulation of practical diets in on-growing of European sea bass, SBM up to 30% can be successfully incorporated in low FM.
Acknowledgments
References
Alada A.R.A., Akande, O.O., Ajayt, F.F., 2004. Effect of soya bean diet preparations on some haematological and biochemical indices in the rat. African Journal of Biomedical Research 7, 71-74.
Bligh, E.G., Dyer, W.J., 1959. A rapid method of total lipid extraction and purification. Canadian Journal of Biochemistry and Physiology 37, 911-917.
Bonaldo, A., Roem, A.J., Fagioli, P., Pecchini, A., Cipollini, I., Gatta, P.P., 2008. Influence of dietary levels of soybean meal on the performance and gut histology of gilthead sea bream (Sparus aurata L.) and European sea bass (Dicentrarchus
labrax L.). Aquaculture Research 39, 970-978.
Bonaldo, A., Parma, L., Mandrioli, L., Sirri, R., Fontanillas, R., Badiani, A., Gatta, P.P., 2011. Increasing dietary plant proteins affects growth performance and ammonia excretion but not digestibility and gut histology in turbot (Psetta maxima) juveniles. Aquaculture 318, 101-108.
Bonaldo, A., Di Marco, P., Petocchi, T., Marino, G., Parma, L., Fontanillas, R., Koppe, W., Mongile, F., Finoia, M.G., Gatta, P.P., 2015. Feeding turbot juveniles Psetta
maxima L. with increasing dietary plant protein levels affects growth performance
and fish welfare. Aquaculture Nutrition 21, 401-413.
Bonvini, E., Parma, L., Mandrioli, L., Sirri, R., Brachelente, C., Mongile, F., Gatta, P.P., Bonaldo, A., 2015. Feeding common sole (Solea solea) juveniles with increasing dietary lipid levels affects growth, feed utilization and gut health. Aquaculture 449, 87-93.
Coeurdacier, J.L., Dutto, G., Gasset, E., Blancheton, J.P., 2011. Is total serum protein a good indicator for welfare in reared sea bass (Dicentrarchus labrax)? Aquatic Living Resources 24, 121-127.
Couto, A., Kortner, T.M., Penn, M., Østby, G., Bakke, A.M., Krogdahl, Å., Oliva-Teles, A., 2015. Saponins and phytosterols in diets of European sea bass (Dicentrarchus
labrax) juveniles: effects on growth, intestinal morphology and physiology.
Aquaculture Nutrition 21, 180-193.
De Santis, C., Tocher, D.R., Ruohonen, K., El-Mowafi, A., Martin, S.A.M., Dehler, C.E., Secombes, C.J., Crampton, V., 2016. Air-classified faba bean protein concentrate is efficiently utilized as a dietary protein source by post-smolt Atlantic salmon (Salmo
salar). Aquaculture 452, 169-177.
Dias, J., Alvarez, M., Arzel, J., Corraze, G., Diez, A., Bautista, J., Kaushik, S., 2005. Dietary protein source affects lipid metabolism in the European seabass (Dicentrarchus labrax). Comparative Biochemistry and Physiology A 142, 19-31. Enes, P., Panserat, S., Kaushik, S., Oliva-Teles, A., 2011. Dietary carbohydrate utilisation
by European sea bass (Dicentrarchus labrax L.) and Gilthead Sea Bream (Sparus
aurata L.) juveniles. Reviews in Fisheries Science 19, 201-215.
Faggio, C., Piccione, G., Marafioti, S., Arfuso, F., Trischitta, F., Fortino, G., Fazio, F., 2014. Monthly variations of haematological parameters of Sparus aurata and
Dicentrarchus labrax reared in Mediterranean land off-shore tanks. Cahiers de
Biologie Marine 55, 437-443.
Fournier, V., Huelvan, C., Desbruyeres, E., 2004. Incorporation of a mixture of plant feedstuffs as substitute for fish meal in diets of juvenile turbot (Psetta maxima). Aquaculture 236, 451-465.
Geay, F., Ferraresso, S., Zambonino-Infante, J.L., Bargelloni, L., Quentel, C., Vandeputte, M., Kaushik, S., Cahu, C.L., Mazurais, D., 2011. Effects of the total replacement of fish-based diet with plant-based diet on the hepatic transcriptome of two European
sea bass (Dicentrarchus labrax) half-sibfamilies showing different growth rates with the plant-based diet. BMC Genomics 12:522.
Gómez-Requeni, P., Mingarro, M., Calduch-Giner, J.A., Médale, F., Martin, S.A.M., Houlihan, D.F., Kaushik, S., Pérez-Sánchez, J., 2004. Protein growth performance, amino acid utilisation and somatotropic axis responsiveness to fish meal replacement by plant protein sources in gilthead sea bream (Sparus aurata). Aquaculture 232, 493-510.
Guerreiro, I., Oliva-Teles, A., Enes, P., 2015. Improved glucose and lipid metabolism in European sea bass (Dicentrarchus labrax) fed short-chain fructooligosaccharides and xylooligosaccharides. Aquaculture 441, 57-63.
Hosseini, S.A., Khajepour, F., 2013. Effect of partial replacement of dietary fish meal with soybean meal on some hematological and serum biochemical parameters of juvenile beluga, Huso huso. Iranian Journal of Fisheries Science 12, 348-356. Imanpoor, M.R., Bagheri, T., Azimi, A., 2010. Serum Biochemical Change Induced by
Soybean Meal in Diet on Persian Sturgeon, Acipenser persicus. Global Veterinaria 5(1), 61-64.
Kaushik, S.J., Cravedi, J.P., Lalles, J.P., Sumpter, J., Fauconneau, B., Laroche, M., 1995. Partial or total replacement of fish meal by soybean protein on growth, protein utilization, potential estrogenic or antigenic effects, cholesterolemia and flesh quality in rainbow trout, Oncorhynchus mykiss. Aquaculture 133, 257-274.
Kaushik, S.J., Covès, D., Dutto, G., Blanc, D., 2004. Almost total replacement of fish meal by plant protein sources in the diet of a marine teleost, the European seabass,
Krogdahl, Å., Sundby, A., Olli, J.J. 2004. Atlantic salmon (Salmo salar) and rainbow trout (Oncorhynchus mykiss) digest and metabolize nutrients differently. Effects of water salinity and dietary starch level. Aquaculture 229, 335-360.
Krogdahl, Å., Penn, M., Thorsen, J., Refstie, S., Bakke, A.M., 2010. Important antinutrients in plant feedstuffs for aquaculture: an update on recent findings regarding responses in salmonids. Aquaculture Research 41, 333-344.
Lanari, D., D’AgaroE., 2005. Alternative plant protein sources in sea bass diets. Italian Journal of Animal Science 4, 365-374.
Lim, S.J., Lee, K.J., 2009. Partial replacement of fishmeal by cottonseed meal and soybean meal with iron and phytase supplementation for parrot fish Oplegnathus fasciatus. Aquaculture 290, 283-289.
Lim, S.J., Kim, S.S, Ko, G.Y., Song, J.W., Oh, D.H., Kim, J.D., Kim, J.U., Lee, K.J., 2011. Fish meal replacement by soybean meal in diets for Tiger puffer, Takifugu
rubripes. Aquaculture 313, 165-170.
Médale, F., Kaushik, S., 2009. Les sources protéiques dans les aliments pour les poissons d’élevage. Cahiers Agricultures 18, 103-111.
Mongile, F., Bonaldo, A., Fontanillas, R., Mariani, L., Badiani, A., Bonvini, E., Parma, L., 2014. Effects of dietary lipid level on growth and feed utilisation of gilthead seabream (Sparus aurata L.) reared at Mediterranean summer temperature. Italian Journal of Animal Science 13, 30-35.
Moradi, N., Imanpoor, M., Taghizadeh, V., 2013. Hematological and Biochemical Changes Induced by Replacing Fish Meal with Plant Protein in the Cyprinus carpio Linnaeus (1785). Global Veterinaria 11(2), 233-237.
NRC (National Research Council), 2011. Nutrient Requirements of Fish and Shrimp. The National Academies Press, Washington, DC.
Olaleye, S.B., Iranloye, B.O., Salami, H.A., Elegbe, R.A., 1999. Erythrocyte osmotic fragility and other blood parameters in rats fed with diets containing raw and processed soyabeans (Glycine max). Bioscience Research Communications 11, 107-112.
Olsen, R.E., Hansen, A.C., Rosenlund, G., Hemre, G.I., Mayhew. T.W., Knudsen, D.L., Eroldogan, O.T., Myklebust, R., Karlsen, Ø., 2007. Total replacement of fish meal with plant proteins in diets for Atlantic cod (Gadus morhua L.) II: Health aspects. Aquaculture 272, 612-624.
Parma, L., Candela, M., Soverini, M., Turroni, S., Consolandi, C., Brigidi, P., Mandrioli, L., Sirri, R., Fontanillas, R., Gatta, P.P., Bonaldo, A., 2016. Next-generation sequencing characterization of the gut bacterial community of gilthead sea bream (Sparus aurata, L.) fed low fishmeal based diets with increasing soybean meal levels. Animal Feed Science and Technology 222, 204-216.
Penn, M. H., E. Å. Bendiksen, P. Campbell, and Å. Krogdahl. 2011. High level of dietary pea protein concentrate induces enteropathy in Atlantic salmon (Salmo salar L.). Aquaculture 310, 267-273.
Peres, H., Santos, S., Oliva-Teles, A., 2014. Blood chemistry profile as indicator of nutritional status in European seabass (Dicentrarchus labrax). Fish Physiology and Biochemistry 40, 1339-1347.
Perez-Sanchez, J., Estensoro, I., Redondo, M.J., Calduch-Giner, J.A., Kaushik, S., Sitja-Bobadilla, A., 2013. Mucins as Diagnostic and Prognostic Biomarkers in a Fish-Parasite Model: Transcriptional and Functional Analysis. PLoS ONE 8(6):e65457. Rana, K.J., Siriwardena, S., Hasan, M.R., 2009. Impact of rising feed ingredient prices on
aquafeeds and aquaculture production. FAO Fisheries and Aquaculture Technical Paper. No. 541. Rome, FAO. 63p.
Rossi, W., Moxley, D., Buentello, A., Pohlenz, C., Gatlin, D., 2013. Replacement of fishmeal with novel plant feedstuffs in the diet of red drum Sciaenops ocellatus: an assessment of nutritional value. Aquaculture Nutrition 19, 72-81.
Saleh, N.E., Toutou, M.N., 2015. Effects of Replacing Soybean Meal with Jojoba Meal in Sea Bream (Sparus aurata) Diets on Fish Performance. American Journal of Life Sciences 3, 62-68.
Tacon, A.G.J., Dominy, W.G., Pruder, G.D., 1998. Global trends and challenges in aquafeeds for marine shrimp. AquaFeed International 4, 28-35.
Tibaldi, E., Hakim, Y., Uni, Z., Tulli, F., de Francesco, M., Luzzana, U., Harpaz, S., 2006. Effects of the partial substitution of dietary fish meal by differently processed soybean meals on growth performance, nutrient digestibility and activity of intestinal brush border enzymes in the European sea bass (Dicentrarchus labrax). Aquaculture 261, 182-193.
Chapter 2
Feeding European see bass (
Dicentrarchus labrax
)
with increasing dietary fiber levels:
impact on growth, blood biochemistry,
gut histology, gut evacuation
Under review in “Animal feed science and technology”
Erika Bonvini1, Luca Parma1, Luciana Mandrioli1, Rubina Sirri1, Cinzia Viroli2,Ramon Fontanillas3, PierPaolo Gatta1, Alessio Bonaldo1
1Department of Veterinary Medical Sciences, University of Bologna, Ozzano Emilia, Italy 2Department of Statistical Sciences “Paolo Fortunati”, University of Bologna, Bologna,
Italy