© ProCon Ltd., www.procon.bg. This article cannot be reprinted, published on-line or sold without written permission by ProCon. Calderoni, Skillicorn & Zheng, v. 31, 2014, 49-66 http://dx.doi.org/10.11610/isij.3102
INDUCTIVE DISCOVERY OF CRIMINAL GROUP
STRUCTURE USING SPECTRAL EMBEDDING
Francesco CALDERONI, David SKILLICORN, and Quan ZHENG
Abstract: Social network analysis has often been applied to the communications
within criminal groups to understand their internal structure and dynamics. While ac-cess to the content of communications may be restricted by constitutional and proce-dural constraints, this article applies advanced network analysis techniques based on spectral embedding to telephone communications data. Spectral embedding facilitates deeper analysis by embedding the graph representing a social network in a geometric space such that Euclidean distance reflects pairwise node dissimilarity. This enables drawing a network in ways that accurately reflect the structure of the underlying group, and computing properties directly from the embedding. We illustrate spectral ap-proaches for two Ndrangheta drug-smuggling networks, and extend them to a) examine triad structure (through the identification of the Simmelian backbone), which elicits key members, and b) to display temporal properties, which illustrates changing group structure. The results show that the two groups, although having the same pur-pose and coming from the same criminal milieu, have substantially different internal structure which was not detectable using conventional social-network approaches. The techniques presented in this study may support law enforcement in the early stages of an investigation.
Keywords: Organised crime, Italian Mafia, social network analysis, Simmelian
backbone, network evolution
Introduction
In the last decade, law enforcement agencies have increasingly applied network analysis methods, often available in intelligence software such as I2’s Analyst or Palantir Technologies’ Palantir.1 In the field of criminal justice, network analysis of
criminal groups has always been associated with the idea of identifying the most important individuals in a criminal network.2
However, application of network analysis is limited because the interception of per-sonal communications is restricted by constitutional and procedural guarantees. Law enforcement, counterterrorism, and counterintelligence can obtain data about the in-teractions of their targets more easily than data about the content of these inin-teractions.
Data about which telephones called which others, which people met one another, or which email addresses communicated with other email addresses can often be ob-tained without a warrant; and such data are therefore of interest in the early phases of an investigation when it may not be clear who the members of some criminal, terror-ist, or espionage group are. Also, intelligence agencies may use these data to identify key individuals and contacts to gather important information. Furthermore, such data are often preserved for some time, so that retroactive data are often available.
Visualising group structure through spectral embedding
There are many ways to understand a social network, for example from properties such as diameter, centrality measures, average path lengths, and community structure. One way that plays to human strengths is to visualise the network. In this paper, we show the extent to which visualisations based on spectral embedding are able to display the structure of groups and subgroups based on the superficial data about interactions between pairs. This is not novel, but it is underutilised. Our results may encourage others to further use this approach.
In the real world, two individuals form a connection which, if repeated, becomes a relationship; and it is natural to consider the strength of a relationship in terms of, for example, how much the two individuals communicate. This relationship can be represented using a node for each individual and a weighted edge to represent the existence and strength of the relationship between them. The social network of a group is the collection of all of these nodes and edges into a graph. The benefit of social network analysis is that non-obvious structures of the graph are emergent from the local, pairwise relationships that formed it.
Properties of the graph such as the average node degree, the diameter, and the be-tweenness centrality of each node provide a qualitative view of a given social net-work, but they are perhaps more useful for comparing social networks to one another rather than understanding a particular network. Computing such properties of a graph is often expensive, and a single change in the graph can completely change these global properties, requiring expensive recomputation.
One useful way to understand a network is to visualise (draw) it. Most graphs do not have a trivial two-dimensional visualisation, let alone one that accurately reflects their structures in the most obvious way. Drawing a graph in a way that accurately displays its essential structure is a difficult problem. Most techniques to do this are based on placing well-connected nodes centrally, connecting nodes with elastic edges that reflect the strengths of the pairwise connections between them, and then relaxing this structure until it reaches stability. This is reasonably effective, but long-range or global structure is captured only by the transitivity of the pairwise connections. Spectral embedding addresses both of these drawbacks, at the expense of more complex mathematics. Any graph can be represented by an adjacency matrix. If the graph has n nodes, this is an n × n matrix where the ij-th entry represents the weight
associated with the edge connecting nodes i and j. If there is no connection, then the corresponding entry is 0.
An n × n matrix has a natural representation in n˗1 dimensional space by placing each node at the point whose coordinates are given by the corresponding row of the matrix. A spectral embedding, intuitively, rotates this space to find the k directions from which the graph structures are most visible, and then projects the embedding into these k dimensions. The mathematical procedure that discovers these interesting directions is called eigendecomposition.
Obviously, removing some dimensions produces a representation that does not cap-ture the full richness of the graph. However, the effect of eigendecomposition and projection is to place nodes at positions that reflect the global relationships between them. It is also the most faithful representation possible in the k dimensions selected.3 In particular, nodes that are close together in the embedding are those that are most similar in the social network. Similar nodes are not necessarily strongly connected to one another; rather, similarity means that the view of the rest of the network from each is approximately the same. Thus similarity can signal that the nodes play the same role in the network.
A spectral embedding derived from an adjacency matrix suffers from a serious draw-back: when a node has many connections, its row of the adjacency matrix contains many non-zero entries, and so it is embedded far from the centre in the n˗1 dimen-sional space, and so in almost all projections from it. Conversely, a node with few connections will be placed close to the centre. This is exactly the opposite of what a natural visualisation of a social network should do.
The solution is to convert the adjacency matrix to a Laplacian matrix, using a simple transformation.4 A Laplacian matrix is a kind of normalisation of an adjacency ma-trix, turning the graph “inside out” so that projections will place well-connected nodes towards the centre, and poorly connected nodes towards the periphery.
In an embedding, a pair of nodes is placed close to one another if they are similar to one another, even if they are not directly connected. Other social-network analysis measures can be approximated directly in the geometry of the embedding, rather than being computed over paths in the graph itself. Nodes that are connected to other well-connected nodes (often those that are most important or significant in the network) tend to be embedded close to the centre. Nodes that are fairly well connected to one another, but not so well connected to the important nodes tend to be embedded close to one another but not so close to the centre, and so appear as “arms” extending from the centre. Distance from the centre is therefore a surrogate for overall group im-portance (the more central the more important); and direction from the centre distinguishes subgroups from one another. Thus, a visualisation can reveal how many subgroups exist, how they are related to one another, and can give some sense of their relative importance.
Finding the significant members through Simmelian backbones
A major challenge that analysts face is how to identify the most important individuals in a social network. In a law enforcement or counterterrorism setting, these individu-als provide the greatest reward for focused attention. For example, warranted inter-ception could then be used to obtain the content of their communications. For this goal, classic visualisation techniques are somewhat limited and may require a deeper analysis of the social network. We propose a new approach, leveraging derived net-works based on triangle participation, called Simmelian backbones.
The notion of the importance of each individual provided by a visualisation of an entire group (how close to the centre they are embedded) can give a useful—but still superficial—impression of where the power in a group lies. For example, an individual’s only strong connection may be to one of the important members, and so their node may be placed quite close to the centre. Interpreting the significance of such a person is difficult: on the one hand, he may simply be a close friend or relative of the important member, but otherwise insignificant; on the other hand, he may be an
éminence gris, who is extremely significant but deliberately concealing it by using
someone else as a front. Not everyone who is placed close to the centre is equally significant. On the other hand, not everyone who is placed farther from the centre is insignificant. Such an individual may have few connections, but may act as liaison between other significant subgroups.
Simmelian backbones are based on the intuition that triads are a critical structure for cohesion in human relationships, an idea that can be traced back to Georg Simmel, although his view of triads was quite negative. The significance of triads has received new life from studies of businesses showing that the presence of triads is a strong sig-nal of business health.5 Triads, and their instantiation as triangles in social networks, have two functional strengths. First, a triangle guarantees two paths between each pair of its members, providing some resilience to communication. Second, each partici-pant can mediate disputes that may occur between the other two, providing a measure of robustness in the presence of human behaviour. Triangles appear naturally in social settings as one person introduces two of his/her acquaintances to one another. Empirical work in social networks has shown that a network with n nodes normally contains n1.6 triangles.6 This is a substantial number: a social network with 1000 members is expected to contain more than 60,000 triangles.
Everyone would agree that not every edge is of equal importance, but the subtler point is that not every edge of equal weight is of equal importance, as the examples above show. To address H2, we construct a new graph, called the Simmelian back-bone,7 from a given social network. The nodes of the new network are the nodes of the original network. For each edge of the original graph, we compute how many tri-angles it is part of. If this number exceeds some given threshold, m, we add an edge to the new network between the same pair of nodes, but with its edge weight given by the triangle count. Nodes that are not connected in the new graph are discarded. For example, if a node is connected to the rest of the original social network by a single
edge, then that edge cannot be part of any triangle, and so neither the edge nor the node will appear in the new graph. The new graph (Simmelian backbone graph) con-tains only those nodes and edges that were robustly connected in the original social network.
The process of creating a triangle in a social network has costs, since an individual who introduces two of his neighbours to one another puts his reputation at stake, and exhibits a certain level of trust (for example, that they will not exclude him from ongoing relationship benefits). It also requires giving up some human capital since he is no longer required as middleman if the two neighbours can benefit one another.8 Social networks grow because of new pairwise relationships established between individuals, and shrink when such relationships atrophy. In criminal, terrorist, and intelligence networks, a countervailing force is in play: individuals must consider the impact of their new connections on the security of the network (e.g. its resilience to communication interception or arrest). This has been called the security versus efficiency tradeoff.9
In a criminal network, individuals may have low levels of trust, and may wish to hoard the human capital that their connections represent. On the other hand, research-ers have argued that criminal organisations, including mafias, must reflect the proper-ties of markets.10 The individuals in a criminal organisation may find themselves pulled between an instinct not to share connections and the needs of the larger organi-sation that requires cooperation. This suggests that the following hypothesis is worth investigating.
H1: In criminal networks, there will be many fewer triangles than in typical so-cial networks.
If triangles are signals of robust communication and cooperation, then areas of the social network that are rich in triangles should reflect individuals who are crucial to group operations, either because they carry out an essential function or because they manage the group. In an ordinary social network, there are so many triangles that varying density of triangle participation may be a weak signal. However, if H1 is sup-ported, it is plausible that triangle participation in criminal networks is a much strong-er signal. This suggests that the following hypothesis H2 is also worth investigating.
H2: Regions of criminal social networks in which edges (relationships) are part of many triangles will be those that are critical to the management and operation of the criminal group.
If H2 is supported, it immediately suggests a new strategy for finding the most im-portant or significant members of a social network, and so it has direct payoff for law enforcement and intelligence analysts.
The Simmelian backbone graph can be embedded using exactly the same spectral techniques, providing a visualisation of the core of a group – those nodes (and edges) that are well-connected, in a triad sense, to others. This enables us to evaluate H2 by
comparing the Simmelian backbone of a criminal organisation to its command and control structure derived from exogenous knowledge – in this case, from information gleaned by law enforcement from the content of intercepted communications and meetings.
Exploring evolution through time
Most social networks evolve over time, as members come and go, and as the strength of connections between pairs of members change. Tracking these changes can reveal the dynamics of a social network, both external, as it reacts to the stresses of its ac-tivities, and internal – as members interact with one another. For example, Morselli and Petit showed how a criminal network evolves when under constant pressure by law enforcement agencies.11 The network decentralises and the authority of the most central node (the leader) is increasingly questioned by other participants, with other subjects gaining more central positions. More recent analysis of the same network using spectral techniques was able to show not only how relationships changed, but which participants were driving these changes.
It is possible to embed the graphs representing the social networks at different times (using the techniques of the previous section), but this does not allow comparisons across time, since how the geometry in which each graph is embedded depends on the
structure of the graph itself. Thus, each network is embedded in a geometry that is
incomparable with the others. To enable comparisons across time, it is necessary to form the graphs from different time periods into a single monolithic graph, by con-necting the versions of each node together with added edges. The result is a network in which the snapshot of the social network over each time period is represented by a ‘layer’ and the layers are connected together by edges that join the versions of the same individual at different times. The weights on these added edges can be chosen in a principled way.12
The resulting embedding contains embeddings of each of the subnetworks from each time period, but also allows the trajectory of individuals or groups to be tracked across time in a consistent way. Thus, it becomes possible to infer that, say, two indi-viduals are becoming more similar with time, or that one subgroup is moving away from another.
Methods
Two datasets derived from the judicial documents of two investigations (called
Operation Chalonero and Operation Stupor Mundi) of two drug trafficking groups,
which were part of the ‘Ndrangheta, were used. The ‘Ndrangheta is a mafia organisa-tion that originated in Calabria, in Italy, in the 19th century and recently expanded across Italian regions and into other countries such as Germany, Canada, and Aus-tralia. It is divided into groups called ‘ndrine whose members tend to come from a geographically limited region and are supported by a strong internal culture.13
Operation Chalonero lasted for several years until arrests in 2007, but the data used here covers the period from August 2003 to June 2004. The targeted group brought cocaine from South America to Italy via Spain.
Operation Stupor Mundi lasted for nearly five years ending in 2007, while the data used here covers the period from June 2002 to April 2004. This group also imported cocaine from South America to Italy but via both Spain and The Netherlands. A great deal of information about the operation of these groups was known to investi-gators because they had access to the content of telephone conversations (and, in fact, meetings as well). It was therefore clear who the most powerful members of the group were, and how influence was wielded. To demonstrate the power of spectral methods, and their applicability at earlier stages of a criminal investigation, we use this data in a more limited way: we assume only access to the fact of telephone communication. We then consider the extent to which it is possible to recreate the significant structure of the group from only such superficial data, and then validate these structures using information from the law enforcement investigations. These datasets have been previ-ously analysed, but primarily to address the question of whether functional structures in these networks match the hierarchical structure that would be expected in an ‘Ndrangheta organisation, and whether network positioning impacts the judicial outcome of the case.14
From the data about phone calls between individuals, we construct an adjacency matrix (reflecting the social network). We then convert this into a Laplacian matrix, carry out an eigendecomposition, and visualise the resulting embedding of each net-work. For both networks we show the trajectories of some significant group members over time.
To investigate H1, we compute the number of triangles present in each of these net-works and compare that to the expected number in a social network of the same size. To investigate H2, we construct the Simmelian backbones of each of these networks, and determine how well they overlap with the key membership and relationships known from other aspects of the law enforcement investigation.
Results
Chalonero
Overall Structure
Figure 1 shows the embedding of the group (of size 66) based on telephone calls. There is a dense central core with four separate subgroups: a substantial one down and to the left, one up and to the right, a small one to the left, and a few similar individuals to the right. The edges from one group to another indicate when there is a cross-group connection, but there are only a few of them. This macroscopic view identifies the major subgroups within the social network, but it can be misleading to the human viewer because the visualisation tends to emphasise the extremal groups, and the extremal members within them. For example, N54 is the least important member of the group that extends up and to the right.
Figure 1: Embedding of the Chalonero social network derived from telephone calls (box shows region zoomed in in next figure).
Figure 2 zooms in to the centre of this embedding, and shows details of the structure involving the important group members. Since, in an embedding, proximity is a surrogate for similarity for all pairs of nodes, the edges are omitted from this version. The alignment in this figure is the same as in Figure 1. Thus N86 is the most im-portant member of the group extending down and to the left in Figure 1, and the group between N2 and N87 is the most important part of the group extending up and to the right (and this is clearly the largest and most important subgroup). The remain-ing groups have no members central enough to appear in this figure. N21, N83, and N86 are a small independent group that is obscured in Figure 1.
Figure 2: Zoomed-in centre of the embedding of the Chalonero social network derived from telephone calls.
Core group
In an ordinary social network of size 66, the expected number of triangles is 815. The actual number of triangles in the network is 68, i.e. about 8 percent of the predicted number. This is not unexpected, but it is striking.
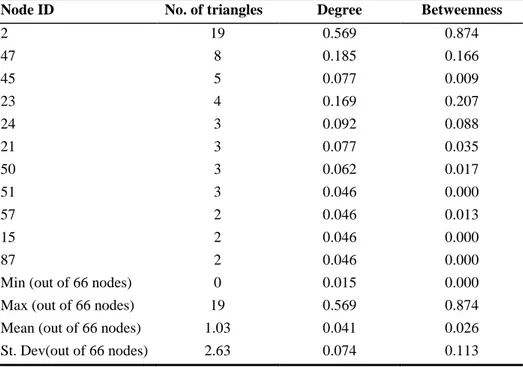
The degree, betweenness, and number of triangles that well-connected individuals participate in are shown in Table 1, sorted in decreasing order of triangle participa-tion. There is clearly some correlation between degree and triangle participation, but there are some striking differences in rankings derived from the two properties. For example, N45 participates in more triangles than his degree would indicate (so he communicates less frequently but to well-connected people); there is a difference of a factor of two between N24 and N51’s telephone calls, but they are connected to the same number of well-connected people.
Figure 3 shows the embedding of the social network determined by those edges that participate in more than 1 triangle: the Simmelian backbone with a threshold of 1. This embedding captures all of the significant group members, and makes their relationships clear. Indeed, nearly all the key individuals in the drug trafficking Table 1: Total edge weight and triangle participation for important nodes in the
Cha-lonero dataset. Degree and betweenness centrality are expressed as fractions of the maximum possible value for the network (and so do not sum to 1).
Node ID No. of triangles Degree Betweenness
2 19 0.569 0.874 47 8 0.185 0.166 45 5 0.077 0.009 23 4 0.169 0.207 24 3 0.092 0.088 21 3 0.077 0.035 50 3 0.062 0.017 51 3 0.046 0.000 57 2 0.046 0.013 15 2 0.046 0.000 87 2 0.046 0.000
Min (out of 66 nodes) 0 0.015 0.000
Max (out of 66 nodes) 19 0.569 0.874
Mean (out of 66 nodes) 1.03 0.041 0.026
network (i.e. N1, N2, N23, N24, N45, and N47) are included in the Simmelian backbone. N1 is not included but it is clear why – he was a fugitive at the time and did not participate to phone conversations to avoid detection.
Figure 3: Simmelian backbone for the Chalonero dataset with threshold 2 (known important individuals are indicated by filled hexagons).
Evolution through time
Figure 4 shows the embedding of the overall graph obtained by binding together 11 subgraphs representing the social networks during successive month-long time periods, based on telephone calls. The figure shows the trajectories of the five individuals (N2, N23, N24, N45, and N47) known to be most important from the police investigation, with each trajectory shown in a different colour. The labels are the time periods concerned.
Figure 4: Trajectories of important nodes over time (Chalonero dataset. N2: black, N23: blue, N24: red, N45: cyan, N47: magenta; points labelled with time step).
N47 remains at the left-hand side of the figure but moves away from the centre over time, while N45 remains at the right-hand side but moves towards to centre over time. These two individuals were traffickers connected with powerful ‘Ndrangheta families who got involved in the drug trafficking operations of Chalonero. Their posi-tion follows the different consignments and deals they were involved in. N24 is initially towards the left but gradually moves right; N23 moves in a similar way. These were two brothers. N23 lived in Bolivia with the purpose of providing oppor-tunities for smuggling cocaine to Italy. N24 mostly lived in Calabria and was the main reference for the brother. N2 can be seen moving around the centre of the em-bedding in a circular way, a vivid demonstration of virtual “managing by wandering around.” Indeed, N2 was the key trafficker in Chalonero, managing different operations with all the above mentioned partners. This temporal view gives some insight into changing power relationships with time.
Stupor Mundi
We now repeat the analysis for the group that was the target of the Stupor Mundi operation. This group is about the same size as the one targeted by Chalonero.
Overall structure
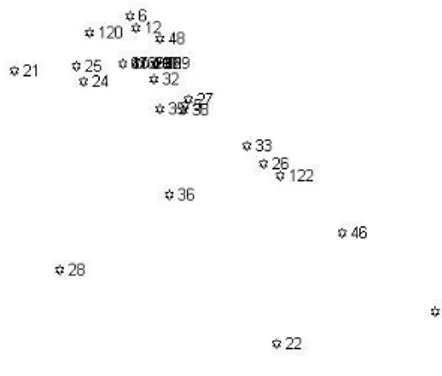
Figure 5 shows the structure of the group that was the target of the Stupor Mundi operation based on telephone calls among 65 individuals. There is a clear central core running from top left to bottom right, with two other subgroups, one to the right and one to the left, both reasonably well connected into the more central groups. As before, this view reveals the macroscopic group structure but can be misleading about which individuals are significant.
Figure 6 shows a zoomed in version of the same figure, with the same orientation. These are the best-connected members of the group, again shown without graph edges since proximity corresponds directly to similarity. This figure shows that the central structure is quite different to the extremal groups that are visible in Figure 5.
Figure 6: Zoomed-in centre of the embedding of the Stupor Mundi social network derived from telephone calls (the region covered is the dense region just below 43 in figure 5). Core group
In a network of size 65, the expected number of triangles is 796. The actual number of triangles in the network is 311, slightly less than half the expected number. This il-lustrates a substantial difference between this group and the previous one – the Stupor Mundi target organisation is much more richly connected.
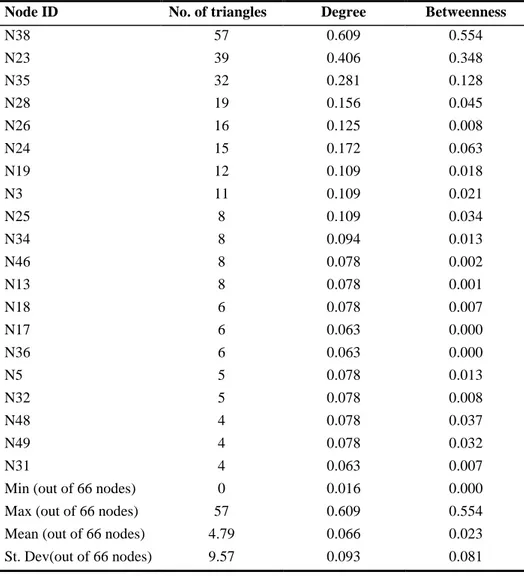
The structure of the group derived from triangles is helpful in explicating the centre of this organisation. Table 2 shows the distribution of degrees, betweenness and triangles for the best-connected nodes, in decreasing order of triangle participation. In Stupor Mundi, the key individuals were N23, N24, N35, N38, and N46. Three of the most important nodes (N38, N23, and N35) appear at the top of the list based on triangle participation. N26 did not play a crucial role in the drug trafficking activities, but was a well-respected senior member of the ‘Ndrangheta. His importance emerges more from triangle participation than from telephone communications, as he would have been ranked 8th on the basis of phone calls, but is ranked 5th on the basis of triangle participation. A number of other individuals are ranked much more highly on the basis of their phone calls than their triangle participation would indicate, notably N19 and N5.
N46 is an interesting case. He was the leader of an ‘Ndrangheta family, and generally supervised most operations conducted by the Stupor Mundi network. However, he purposely remained far from the operational management criminal activities, provid-ing financial resources and dispute settlement instead.15 He would have ranked 19th on the basis of phone calls, but moves up to 12th when triangle participation is included.
Figure 7 shows the core group derived by embedding the graph formed from the edges that appear in more than 5 triangles. This core structure contains all of the
Table 2: Total edge weight and triangle participation for important nodes in the Stupor Mundi dataset (See Table 1 for definitions).
Node ID No. of triangles Degree Betweenness
N38 57 0.609 0.554 N23 39 0.406 0.348 N35 32 0.281 0.128 N28 19 0.156 0.045 N26 16 0.125 0.008 N24 15 0.172 0.063 N19 12 0.109 0.018 N3 11 0.109 0.021 N25 8 0.109 0.034 N34 8 0.094 0.013 N46 8 0.078 0.002 N13 8 0.078 0.001 N18 6 0.078 0.007 N17 6 0.063 0.000 N36 6 0.063 0.000 N5 5 0.078 0.013 N32 5 0.078 0.008 N48 4 0.078 0.037 N49 4 0.078 0.032 N31 4 0.063 0.007
Min (out of 66 nodes) 0 0.016 0.000
Max (out of 66 nodes) 57 0.609 0.554
Mean (out of 66 nodes) 4.79 0.066 0.023
St. Dev(out of 66 nodes) 9.57 0.093 0.081
important nodes (except N46 for the obvious reasons). This network is much more robustly connected than the Chalonero one, and so a much higher threshold is needed to reveal the core structure.
Evolution through time
Figure 8 shows the embedding of the overall graph obtained by binding together 13 subgraphs representing the social networks during successive 4-month time periods,
Figure 7: Simmelian backbone for the Stupor Mundi dataset with threshold 5 (known important individuals are indicated by filled hexagons).
based on telephone calls. The figure shows the trajectories of the five individuals (N23, N24, N35, N38, and N46) known to be most important from the police investigation, with each trajectory shown in a different colour. The labels are the time periods concerned.
Figure 8: Trajectories of important nodes over time (Stupor Mundi dataset. N23: black, N24: red, N35: blue, N38: cyan; N46: magenta. Points labelled with time step, 4-month intervals starting in June 2002).
The three figures N24, N35, and N38 remain closely associated throughout the entire time sequence, although there is a slight trend towards the right in the figure. N23 is not closely coupled with these three, but also shows little variability over the entire time sequence. N46 changes connectivity to the rest of the network much more
significantly, although not in ways that relate to these other core members. He is trying to stay aloof from the rest of the network, and so stays far from the core group, but interacts with other parts of the network (that are not shown in the figure) – another instance of managing by wandering around.
Discussion and conclusions
This paper analysed two criminal networks focusing exclusively on the traffic data of intercepted telephone calls. The results suggest that the analysis of these metadata can provide interesting insight on the structure and the functioning of a criminal organisa-tion independently of the content of the conversaorganisa-tions. This may be relevant for law enforcement, counterterrorism, and counterintelligence, which may apply network analysis methods for early identification of the group structure, of significant indi-viduals, and understanding the evolution of the group structure.
Spectral embedding provides a way to examine the global structure of a graph by em-bedding it in a geometry that preserves the relationships and is as well possible in a space of a given dimensionality. This is a useful way to find the groups within a so-cial network: a central subgroup reveals itself as a cluster close to the centre, while other groups appear as radial arms that may or may not be well connected to the cen-tre. These particular criminal groups have strong central clusters as well as smaller, less connected clusters, sometimes driven by functional needs such as product acqui-sition.
While spectral embedding is useful for identifying subgroups, it is less useful for identifying individuals who play a significant role in the social network. That is because the node representing an individual is placed approximately in the centre of the points to which it is connected, weighted by the strength of those connections (and distorted by the need to represent a high-dimensional structure in only a few di-mensions). Hence, a node whose role is to act as a bridge between subgroups may not stand out because it is positioned away from both of them. This illustrates a signifi-cant weakness of eigenvector centrality. Thus, visualisation does not completely solve the problem of finding the most significant members of a group. We have argued that participation in triads, and so in triangles in the social network, is a strong signal of functional or management importance, and have created embeddings of Simmelian backbones to find such signals.
Hypothesis H1 is that there will be fewer triangles in criminal networks than are ex-pected to be present in more conventional social networks. This is strongly supported from this data. The number of triangles present is much smaller than would be ex-pected for a social network of corresponding size, supporting the idea that criminal networks do not have the same levels of trust as typical social networks. The models of Logan et al.16 suggest that criminal organisations are, partly for this reason, quite dysfunctional. Hence it is reasonable to assume that localised participation in trian-gles is quite a strong structural signal in a criminal social network.
Hypothesis H2 is that those individuals, who do participate in many triangles, are likely to be the significant members of a criminal group. This is also strongly sup-ported. The construction of the Simmelian backbone of a criminal network has been shown to discover almost all of the key members of each of these groups. The exceptions are cases where the individual has explicitly worked to remain decoupled from the social network as much as possible. Thus, the use of Simmelian backbones has considerable potential to examine a large social network to find those parts that represent a kind of core group: those who trust each other, or work together coopera-tively far more than typical members. In other words, degree is not sufficient to establish importance: whom a person communicates with is as important as how often they communicate. This is an immediately actionable result: law enforcement and intelligence analysts can use this approach to reliably identify those who are critical members of a criminal social network.
The surprising result of this analysis is how different the two groups are. They are superficially very similar—from the same cultural and criminal milieu, of a similar size and with similar distributions of centrality measures—but the triangle structure reveals that they are very different inside. The group targeted by Stupor Mundi has a much greater fraction of triangles among its members than Chalonero; as a result, a much greater threshold is required to produce a Simmelian backbone of comparable size. This much more robust connection structure makes this group much more re-sistant to disruption by the arrests of a few members. Previous analyses on the two groups based on more traditional network analysis measures and content analysis of conversations were not able to capture this structural difference between the two organisations. This suggests that the exploration of the topology of a criminal net-work, in addition to overall network-level and node-level metrics, should include also analysis of the network at intermediate scale.
Notes
1
See Paul Duijn, Victor Kashirin, and Peter Sloot, “The Relative Ineffectiveness of Criminal Network Disruption,” Scientific Reports 4 (February 2014), http://dx.doi.org/10.1038/srep 04238.
Paul Duijn, and Peter Klerks, “Social Network Analysis Applied to Criminal Networks: Recent Developments in Dutch Law Enforcement,” in Networks and Network Analysis for
Defence and Security, ed. Anthony Masys (Cham: Springer International Publishing
Swit-zerland, 2014), 121-159, http://dx.doi.org/10.1007/978-3-319-04147-6_6.
2
Peter Lupsha, “Steps Toward a Strategic Analysis of Organized Crime,” The Police Chief (May 1980): 36–38.
Peter Lupsha, “Networks vs. Networking: Analysis of an Organized Crime Group,” in
Career Criminals, ed. Gordon P. Waldo (Beverly Hills, CA: Sage, 1983).
Roger Davis, “Social Network Analysis: An Aid in Conspiracy Investigations,” FBI Law
Enforcement Bulletin 50, no. 12 (1981): 11–19, available at www.ncjrs.gov/App/
Francis Ianni, and Elizabeth Reuss-Ianni, “Network Analysis,” in Criminal Intelligence
Analysis, ed. Paul P. Andrews and Marilyn B. Peterson (Loomis, CA: Palmer Enterprises,
1990), 67–84.
Malcolm Sparrow, “Network Vulnerabilities and Strategic Intelligence in Law Enforce-ment,” International Journal of Intelligence and CounterIntelligence 5, no. 3 (1991), 255– 74, http://dx.doi.org/10.1080/08850609108435181.
Malcolm Sparrow, “The Application of Network Analysis to Criminal Intelligence: An As-sessment of the Prospects,” Social Networks 13, no. 3 (1991): 251–274, http://dx.doi.org/ 10.1016/0378-8733(91)90008-H.
Janet Jackson and Janet Herbrink, Profiling Organised Crime: The Current State of the Art WE96-01, Report NSCR (Leiden: Netherlands Institute for the Study of Criminality and Law Enforcement /NISCALE/, 1996).
Janet Jackson, Janet Herbrink, and Robert Jansen, “Examining Criminal Organizations: Possible Methodologies,” Transnational Organized Crime 2, no. 4 (1996): 83–105. Duncan McAndrew, “The Structural Analysis of Criminal Networks,” in The Social
Psy-chology of Crime: Groups, Teams and Networks, ed. David Canter and Laurence Alison
(Aldershot, UK: Ashgate, 1999).
Jeffrey McIllwain, “Organized Crime: A Social Network Approach,” Crime, Law and
Social Change 32, no. 4 (1999), 301-323, http://dx.doi.org/10.1023/A:1008354713842.
3
Daniel Spielman, “Spectral Graph Theory,” in Combinatorial Scientific Computing, ed. Uwe Naumann and Olaf Schenk (Boca Raton: CRC Press, 2012), 495–524.
4
There are a number of Laplacian matrices, which make varying assumptions about the desired outcomes of the spectral embedding. The simplest, the combinatorial Laplacian, puts the sum of each row in the corresponding diagonal entry and negates all of the original entries. Hence the row sum of every row of the Laplacian is zero. See Ulrike Von Luxburg, “A Tutorial on Spectral Clustering,” Statistics and Computing 17, no. 4 (2007), 395–416.
5 Dave Logan, John King, and Halee Fischer-Wright, Tribal Leadership: Leveraging Natural
Groups to Build a Thriving Organization, Reprint edition (New York: HarperBusiness,
2011).
6
Charalmpos Tsourakakis, “Fast Counting of Triangles in Large Real Networks: Algorithms and Laws,” in IEEE International Conference on Data Mining (ICDM’08), 2008, 608–617, http://dx.doi.org/10.1109/ICDM.2008.72.
7
Bobo Nick, Lee Conrad, Pádraig Cunningham, and Ulrik Brandes, “Simmelian Backbones: Amplifying Hidden Homophily in Facebook Networks,” in Proceedings of the 2013
IEEE/ACM International Conference on Advances in Social Networks Analysis and Mining, 2013, 525-532, http://dx.doi.org/10.1145/2492517.2492569.
8
Carlo Morselli, “Career Opportunities and Network-Based Privileges in the Cosa Nostra,”
Crime, Law and Social Change 39, no. 4 (June 2003): 383–418, http://dx.doi.org/10.1023/
A:1024020609694.
9
Carlo Morselli, Cynthia Giguère, and Katia Petit, “The Efficiency/security Trade-off in Criminal Networks,” Social Networks 29, no. 1 (2007): 143–53, http://dx.doi.org/10.1016/ j.socnet.2006.05.001.
10
See Peter Reuter, and John Haaga, The Organization of High-Level Drug Markets: An
Exploratory Study (Santa Monica, CA: RAND); Letizia Paoli, “The Paradoxes of
Organized Crime,” Crime, Law and Social Change 37, no. 1 (January 2002): 51–97, http://dx.doi.org/10.1023/A:1013355122531.
11
Carlo Morselli, and Katia Petit, “Law-Enforcement Disruption of a Drug Importation Network,” Global Crime 8, no. 2 (2002): 109-130, http://dx.doi.org/10.1080/17440570 701362208.
12
David Skillicorn, Quan Zheng, and Carlo Morselli, “Modelling Dynamic Social Networks Using Spectral Embedding,” Social Network Analysis and Mining 4 (2014): 182.
13
Letizia Paoli, “An Underestimated Criminal Phenomenon: The Calabrian ’Ndrangheta,”
European Journal of Crime, Criminal Law and Criminal Justice 2, no. 3 (1994): 212-238;
Letizia Paoli, Mafia Brotherhoods: Organized Crime, Italian Style (Oxford: Oxford University Press, 2003).
Francesco Calderoni, “Identifying Mafia Bosses from Meeting Attendance,” in Networks
and Network Analysis for Defence and Security, ed. Anthony Masys (Cham: Springer
International Publishing Switzerland, 2014), 27-48.
14
Francesco Calderoni, “The Structure of Drug Trafficking Mafias: The ‘Ndrangheta and Cocaine,” Crime, Law and Social Change 58, no. 3 (2012): 321-349, http://dx.doi.org/ 10.1007/s10611-012-9387-9; Francesco Calderoni, “Strategic Positioning in Mafia Networks,” in Crime and Networks, ed. Carlo Morsselli (New York: Routledge, 2014), 163–181.
15
Francesco Calderoni, “The Structure of Drug Trafficking Mafias: The ‘Ndrangheta and Cocaine.”
16
Logan, King, and Fischer-Wright, Tribal Leadership: Leveraging Natural Groups to Build
a Thriving Organization.
Francesco CALDERONI works on Transcrime in the Università Cattolica del Sacro Cuore, Milan, Italy. E-mail: [email protected].
David SKILLICORN and Quan ZHENG are with the School of Computing, Queen's University, Kingston, Canada. E-mail: {skill; quan}@cs.queensu.ca.