Alma Mater Studiorum - Università degli Studi di Bologna
Dottorato di Ricerca in Farmacologia e Tossicologia Area Disciplinare BIO14
EFFECTS OF CANNABIDIOL AND CANNABIS
EXTRACTS IN MODELS OF CONVULSION AND
EXCITOTOXICITY
TESI DI DOTTORATO Presentata da: Dott.ssa Aneli Utan Coordinatore:
Chiar.mo Prof.
GIORGIO CANTELI FORTI
Relatore: Chiar.ma Prof.ssa ESTER SPERONI
XX CICLO
Nothing in this world is to be feared... only understood.
Marie Curie
Science is a wonderful thing if one does not have to earn one's living at it.
Index
INTRODUCTION
Cannabis sativa L. pag. 1
The endocannabinoid system pag. 2
Endocannabinoids release and deactivation pag. 2 CB1 receptor pharmacology in the CNS pag. 3 CB2 receptor pharmacology in the CNS pag. 6 Glutamatergic transmission and excitotoxicity
Glutamate and excitatory neurotransmission pag. 6 Glutamate ionotropic receptors: NMDA receptors pag. 7 Glutamate ionotropic receptors: kainate receptors pag. 8 Glutamate ionotropic receptors: AMPA receptors pag. 8 Glutamate metabotropic receptors pag. 9
Excitotoxicity pag. 10
Neuroprotective properties of cannabinoids pag. 11
Cannabinoids and epilepsy pag. 13
AIM OF THE STUDY pag. 16
IN VIVO METHODS
Plant material and extracts pag. 17
Pentylentetrazol (PTZ) induced seizures pag. 17 Extracts and drugs administration pag. 18
Data analysis pag. 18
IN VITRO METHODS
Cell culture pag. 20
NMDA induced excitotoxicity and Ca imaging protocol pag. 20 3-NP intoxication protocol and
cell death determination with PI/Calcein kit pag. 21
Drug application pag. 22
PTZ induced seizures study pag. 25
IN VITRO RESULTS
Ca imaging study pag. 29
3-NP study pag. 57
DISCUSSION
Discussion of the in vivo study pag. 63
Discussion of the in vitro study pag. 66
CONCLUSIONS pag. 76
Acknowledgements pag. 77
Introduction
INTRODUCTION
Cannabis sativa L.
Cannabis sativa is an herb that has been used by humans for millenniums for its fibre, known as hemp, for its psychological and physiological effects and for the nourishment of its oil-bearing seeds. The fibre of the plant, cultivated as hemp, has numerous textile uses. Its seed is a valuable source of protein and unsaturated oils. The flowers (and to a lesser extent the leaves and stems) contain psychoactive and physiologically active chemical compounds known as cannabinoids that are consumed for recreational, medicinal, and spiritual purposes. When so used, preparations of flowers (marijuana) and leaves and preparations derived from resinous extract (hashish) are consumed by smoking, vaporizing and oral ingestion. The major biologically active chemical compound in Cannabis is Δ-9-tetrahydrocannabinol, commonly referred to as THC. The major difference between the variety grown for industrial use and the one primarily used for production of recreational and medicinal drugs, is the amount of Δ-9-tetrahydrocannabinol (THC) secreted in a resinous mixture by epidermal hairs called glandular trichomes.
Ingestion of Cannabis sativa preparations results in an intoxication characterized by sedation, cognitive dysfunction, failure to consolidate short-term memory, alteration in time assessment, perceptual changes, motor in-coordination and poor executive function (reviewed in Abood and Martin, 1992; Dewey, 1986; Hollister, 1986; Pertwee, 1988). Most of these effects are due to the action of THC, the main psychoactive substance found in the Cannabis plant. THC was isolated by Raphael Mechoulam and co-workers in 1964, and its mechanism of action was disclosed in 1990, when the first cannabinoid receptor (CB1) was cloned (Matsuda et al., 1990) In fact many of the pharmacological actions of THC result from its binding to the cannabinoid receptor CB1. The four symptoms that are often used to define cannabinoid intoxication in the rodent - hypothermia, rigid immobility,
analgesia and decreased motor activity (Adams and Martin, 1996) - are absent in mice in which the cb1 gene has been deleted by targeted recombination (Ledent et al., 1999; Zimmer et al., 1999). Cannabinoids are the most distinctive and specific class of compounds known to exist only in the cannabis plant. They are a group of terpenophenolic compounds, with very low solubility in water, but good solubility in most organic solvents. Other natural cannabinoids are cannabinol (CBN), cannabidiol (CBD), one of the most promising cannabinoid the researchers are investigating on, cannabigerol (CBG), cannabichromene (CBC), and delta-8-tetrahydrocannabinol (Δ-8-THC).
The endocannabinoid system
The endocannabinoid system is made up of two cannabinoid receptors, called CB1 and CB2, their endogenous ligands, called the endocannabinoids, the proteins for their synthesis and inactivation, and other molecular targets for the endocannabinoids. The endocannabinoids known by far are anandamide (N-arachidonoyl-ethanolamine, AEA) and 2-arachidonoyl-glycerol (2-AG) discovered in the 1990s, whilst arachidonyl-glyceryl ether (noladin, 2-AGE), O-arachidonoyl-ethanolamine (virhodamine) and N-arachidonoyl-dopamine (NADA) have been proposed as cannabinoid receptor agonists in this decade (De Petrocellis et al., 2004).
Endocannabinoids release from neurons and their deactivation
Endocannabinoids synthesis is stimulated by intracellular Ca2+ elevation (Bisogno et al., 1997; Cadas et al., 1996; Di Marzo et al., 1994). Anandamide and 2-AG are hydrophobic compounds, so they tend to remain associated with lipid membranes where they are produced. They can approach the CB1 receptors by lateral membrane diffusion, but it is likely that some extracellular lipid-binding proteins help to deliver endocannabinoids to their cellular targets (Piomelli, 2003). Reuptake of endocannabinoids by a yet
Introduction
uncharacterized carrier and intracellular hydrolysis are the two mechanisms, which cooperate in attenuating endocannabinoid signalling in the brain (Piomelli, 2003). A series of pharmacological transport inhibitors have been synthesized; these molecules - the prototype of which is AM404 - (Beltramo et al., 1997; Beltramo et al., 2000; Piomelli et al., 1999), helped to unmask important roles of the endocannabinoid system in the regulation of neurotransmission and synaptic plasticity. Fatty acid amide hydrolase, FAAH, is an intracellular membrane-bound serine hydrolase that breaks down anandamide into arachidonic acid and ethanolamine (Cravatt et al., 1996; Schmid et al., 1985). FAAH is widely distributed in the rat brain, where it is expressed at high concentrations in cell bodies and dendrites of principal neurons (Egertova et al., 2003; Tsou et al., 1998). Monoacylglycerol lipase (MGL), which is responsible for the hydrolysis of 2-AG, has a broad distribution in the central nervous system, which partially overlaps with that of FAAH; however, whereas FAAH is predominantly found in postsynaptic structures, MGL might be mostly associated with nerve endings (Dihn et al., 2002).
CB1 receptors pharmacology in the CNS
The cannabinoid receptor type 1, CB1, is a G protein-coupled receptor that is found in the brain and is activated by THC, anandamide and 2-AG (Pazos 2005). The receptor is coupled to a Gi/o protein, and upon its stimulation several intracellular signal transduction pathways are activated: inhibition of the enzyme adenylate cyclase, inhibition of N- and P/Q-type calcium channels, activation of inwardly rectifying potassium channels, and activation of mitogen-activated protein kinases (Fowler, 2003). CB1 receptors are thought to be the most widely expressed G protein-coupled receptors in the brain. Varying levels of CB1 expression can be detected in the olfactory bulb, cortical regions (neocortex, pyriform cortex, hippocampus, and amygdala), several parts of basal ganglia, thalamic and hypothalamic nuclei and other
subcortical regions, cerebellar cortex, and brainstem nuclei (e.g. the periaqueductal gray) (Howlett et al., 2002). In these structures CB1 receptors demonstrate a presynaptic location, and this characteristic suggests that the endocannabinoid system could play an important role in synaptic neurotransmission (so-called “endocannabinoid retrograde signalling”). The hippocampus has an essential role in the formation of new memories, and endocannabinoids play an important role in the modulation of memory in this area of the brain (Robinson et al., 2004). Depolarization-induced suppression of inhibition (DSI), is a very common form of short-term plasticity in which the depolarization of a pyramidal neuron in the CA1 field of the hippocampus, induces a reduction in GABA inhibitory inputs. DSI is mediated by endocannabinoids (Alger, 2002; Kreitzer and Regehr, 2001; Ohno-Shosaku et al., 2001; Wilson and Nicoll, 2001; Yoshida et al., 2002), and has been shown to occur in other areas of the brain (i.e. cerebellum) (Kreitzer and Regehr, 2001; Trettel and Levine, 2003). Cannabinoid agonists seem to have an influence on affective states (Viveros et al., 2005), and inactivation of CB1 receptors causes anxiety-like and aggressive responses in rodents (Martin et al., 2002; Navarro et al., 1997). Cannabinoids might contribute to the regulation of the basal ganglia function (Fernández-Ruiz and Gonzáles, 2005), and may be involved in the modulation of motor activity (Giuffrida et al., 1999; Kettunen et al., 2005; Kyriakatos and Manira, 2007). Beside their actions in the amygdala, which seems to be the site of cannabinoid central analgesia (Katona et al., 2001; Macdonald and Mascagni, 2001; Martin et al., 1999), cannabinoid agonists can influence the central processing of pain in hindbrain (Jennings et al., 2001; Lichtman et al., 1996; Meng et al., 1998), and systemic administration of CB1 antagonists produces hyperalgesia in rats and mice (Calignano et al., 1998; Richardson et al., 1997; Strangman et al., 1998). Though central and peripheral actions could underlie the analgesic properties of cannabinoid drugs (Cravatt and Lichtman, 2004; Iversen and Chapman, 2002), recent findings seem to indicate the CB1
Introduction
receptors expressed on the peripheral axons of primary sensory neurons, as the main target for substantial analgesia for somatic and visceral pain, as well as in inflammatory and neuropathic pain (Agarwal et al., 2007).
Endocannabinoid-mediated retrograde transmission is also involved in the depolarization-induced suppression of excitation (DSE), in principal neurons in hippocampus and cerebellum. Similarly to DSI, DSE is induced by neuronal depolarization, and consists of a transient depression in neurotransmitter release. DSE targets glutamatergic axon terminals, and thus reduces excitatory input to the affected cell (Alger 2002; Ohno-Shosaku, 2002; Kreitzer and Regehr, 2001).
The ability of cannabinoid agonists to inhibit the release of neurotransmitters in the CNS is not restricted to glutamate and GABA. Acetylcholine release is reduced by cannabinoids both in vitro and in vivo, and is enhanced by inactivation of CB1 receptors (Degroot et al., 2006; Gessa et al., 1998; Gifford and Ashby, 1996; Schlicker and Kathmann, 2001). Since acetylcholine release in the neocortex and hippocampus facilitates learning and memory, its endocannabinoids-mediated decrease might contribute to the negative effects of cannabinoid drugs on cognition.
The endocannabinoid system is also involved in long-term regulation of synaptic plasticity. Long-term depression (LTD), is the weakening of a neuronal synapse that lasts from hours to days, and is induced (in hippocampus) by a persistent weak synaptic stimulation. Evidences that striatal LTD is absent in CB1-deficient mice and is blocked by the CB1 antagonist rimonabant suggest that endocannabinoids are involved in this phenomenon; moreover CB1 agonists can induce LTD (Chevaleyre and Castillo, 2003; Kreitzer and Malenka, 2007; Gerdeman et al., 2002; Ronesi et al., 2004).
The possible postsynaptic location of CB1 receptors is still under debate. Several reports suggested that these receptors could exhibit a postsynaptic
location (Marsicano et al., 2003; Rodriguez et al., 2001) in rat brain, whereas other works are against these data (Freund et al., 2003).
CB2 receptors pharmacology in the CNS
CB2 receptors are mainly expressed in the immune system, and they modulate cytokine release and immune cell migration (Howlett et al., 2002). CB2 receptors are also expressed on peripheral nerve terminals (Howlett et al., 2002). In the brain they are expressed by microglia and astrocytes, where their role remains unclear (Fernández-Ruiz et al., 2007), on neurons in several brain regions (Onaivi et al., 2006), and in the spinal cord. They have been attributed anti-nociceptive potential (Jhaveri et al., 2007). Activation of CB2 receptors inhibits adenylyl cyclase (Slipetz et al., 1995) and activates mitogen-activated protein kinase (Bouaboula et al., 1996) through Gi/o protein.
Glutamatergic transmission and excitotoxicity Glutamate and excitatory neurotransmission
Glutamate is the most abundant excitatory neurotransmitter in the mammalian nervous system. It contributes to synaptic neurotransmission, and also to complex physiological processes like memory, learning, plasticity, and neuronal cell death (Dingledine et al., 1999; Ozawa et al., 1998). Glutamate is synthesized in the cytoplasm and stored in synaptic vesicles by the vesicular glutamate transporters (VGLUTs). Following its exocytotic release, glutamate activates ionotropic glutamate receptors for fast excitatory neurotransmission and metabotropic receptors for slower modulatory effects on transmission. To terminate the action of glutamate, Na+-dependent high affinity glutamate transporters (excitatory amino acid transporters: EAATs) located on the plasma membrane of neurons and glial cells rapidly remove glutamate from the extracellular space (Balcar, 2002; Danbolt, 2001). Most of
Introduction
the glutamate is released synaptically and transits through the glutamate– glutamine cycle before being stored into synaptic vesicles (Hamberger et al., 1979).Glutamate taken up into glial cells is metabolized to glutamine, which is then transported back into neurons, converted to glutamate and sequestered into synaptic vesicles by the VGLUTs. In brain injury or disease, glutamate transporters can work in reverse and glutamate can accumulate outside cells (Shigeri et al., 2004). Glutamate receptors are transmembrane receptors located on neuron membranes. There are two basic types of glutamate receptor: ionotropic (NMDA receptor, kainate receptor, and AMPA receptor), and metabotropic (mGluR1, mGluR2, mGluR3, mGluR4, mGluR5, mGluR6, mGluR7, mGluR8).
Glutamate ionotropic receptors: NMDA receptors
The NMDA receptor (NMDAR) is an ionotropic receptor for glutamate (N-methyl D-aspartate, NMDA, is the agonist its name refers to). Activation of NMDA receptors results in the opening of an ion channel that is nonselective to cations: it allows flow of Na+ and small amounts of Ca2+ ions into the cell, and K+ out of the cell. Calcium flux through NMDARs is thought to play a critical role in synaptic plasticity. The NMDA receptor forms a heterodimer between NR1 and NR2 subunits. Multiple receptor isoforms with distinct brain distributions and functional properties have been identified. Each receptor subunit contains two globular structures in the extracellular domain: a modulatory domain and a ligand binding domain. NR1 subunits bind the co-agonist glycine and NR2 subunits bind the neurotransmitter glutamate. The membrane domain consists of three trans-membrane segments and a loop, it is responsible for the receptor's conductance, high-calcium permeability, and voltage-dependent magnesium block. Each subunit has also a cytoplasmic domain, which residues can be modified by protein kinases and protein phosphatases, and can interact with a large number of proteins. Activation of NMDA receptors requires binding of glutamate (or aspartate), and also
requires the binding of the co-agonist glycine. D-serine has also been found to co-agonize the NMDA receptor. In addition, a third requirement is membrane depolarization. A positive change in transmembrane potential will open the ion channel by expelling the Mg2+ ion that blocks the channel (Dingledine et al., 1999; Wolosker, 2007).
Glutamate ionotropic receptors: kainate receptors
Kainate receptors, or KARs, are non-NMDA ionotropic receptors, which respond to the neurotransmitter glutamate. They were first identified as a distinct receptor type through their selective activation by the agonist kainate. There are five types of kainate receptor subunits, GluR5, GluR6, GluR7, KA1 and KA2, arranged in different ways to form a tetramer. The ion channel formed by kainate receptors is permeable to Na+ and K+ ions. Kainate receptors play a role in both pre- and postsynaptic neurotransmission. They have a somewhat more limited distribution in the brain compared to AMPA and NMDA receptors, and their function is not well defined. They are involved in epilepsy, excitotoxicity, and synaptic transmission of noxious stimuli (Pinheiro and Mulle, 2006).
Glutamate ionotropic receptors: AMPA receptors
The α-amino-3-hydroxy-5-methylisoxazole-4-propionic acid receptor (also known as AMPA receptor, AMPAR, or quisqualate receptor) is a non-NMDA-type ionotropic transmembrane receptor for glutamate that mediates fast synaptic transmission. Its name is derived from its ability to be activated by the artificial glutamate analog, AMPA. AMPARs are found in many parts of the brain and are the most commonly found receptor in the nervous system. AMPARs are composed of four types of subunits, designated as GluR1, GluR2, GluR3, and GluR4, which combine to form tetramers. Most AMPARs are either homo-tetramers of GluR1 or GluR4, or symmetric 'dimer of dimers' of GluR2 and either GluR1, GluR3 or GluR4. Each AMPAR has four sites to
Introduction
which a molecule of the agonist can bind, one in each subunit; the channel can open when two or more sites are occupied. AMPARs open and close quickly, and are thus responsible for most of the fast excitatory synaptic transmission in the central nervous system. The permeability of AMPAR to Ca2+ and other cations, such as Na+ and K+, is governed by the GluR2 subunit (if an AMPAR lacks a GluR2 subunit, then it will be permeable to Na+, K+ and Ca2+). The principal ions gated by AMPARs are Na+ and K+. The subunit composition of the AMPAR is also important for the way this receptor is modulated. If an AMPAR lacks GluR2 subunits, then it is susceptible to being blocked in a voltage-dependent manner by polyamines, which prevent the flux of K+ ions through the channel pore at depolarized membrane potential (Dingledine et al., 1999).
Glutamate metabotropic receptors
Metabotropic glutamate receptors (mGluRs) are members of the G protein-coupled receptor (GPCR) superfamily and they have been shown to play an important role in processes requiring synaptic plasticity, such as learning and memory, neuronal development, and neurodegeneration. mGluRs have been divided into 3 subgroups based on sequence similarities, signal transduction pathways and pharmacology (Conn and Pin, 1997; Dale et al., 2003). They are Group I (mGluR1 and mGluR5), Group II (mGluR2 and mGluR3) and Group III (mGluR4, mGluR6, mGluR7, and mGluR8). In contrast to ionotropic glutamate receptors, which mediate fast synaptic transmission at glutamatergic synapses, mGluRs often modulate ongoing activity. Postsynaptic mGluRs may modulate membrane properties by second messenger interactions, while presynaptic mGluRs have been shown to control synaptic release; depending on the specific mGluR and its position within brain circuits, the resulting modulation may be facilitatory or inhibitory (Alexander and Godwin, 2006). All mGluRs have seven transmembrane domains, with the intracellular loop between domains 3 and 4
binding a G-protein. Group I mGluRs (mGluR1 and 5) couple to Gq to stimulate phosphoinositide hydrolysis and phospholipase C. Group II (mGluR2 and 3) and Group III mGluRs (mGluR4, 6, 7, and 8) couple to Gi/Go to inhibit cAMP. In addition to these second messenger pathways, mGluRs can signal by uncoupling of the βγ subunits from the heterotrimeric G protein to directly modulate ion channels. In general, Group I mGluRs are excitatory, acting to enhance neurotransmitter release, potentiate ionotropic glutamate receptors responses and modulate various depolarizing currents. Group II and III mGluRs generally act to reduce neurotransmitter release, and within the axon terminal G-protein effects may include inhibition of high threshold calcium channels, activation of potassium channels and direct inhibition of transmitter release machinery. All mGluRs are expressed on neurons, and mGluR3 and 5 are additionally found on glial cells (De Blasi et al., 2001; Kew and Kemp, 2005).
Excitotoxicity
Excitotoxicity was first described by Olney in the 1970s (Olney, 1969). It consists in a pathological process where an overactivation of receptors for the excitatory neurotransmitter glutamate leads to neuronal death. In physiological conditions, the presence of glutamate in the synapse is regulated by active ATP-dependent transporters in neurons and glia. The induction of excitotoxic neuronal death depends on Ca2+ influx through NMDA receptors (Choi, 1992; Limbrick et al., 2001; Randall and Thayer, 1992). In physiological conditions, Ca activates a number of Ca2+-dependent enzymes that influence a wide variety of cellular components, like cytoskeletal proteins or second messenger synthases. However, overactivation at NMDA receptors triggers an excessive entry of Ca2+, initiating a series of cytoplasmic and nuclear processes that promote neuronal cell death: activation of proteolytic enzymes, activation of Ca2+/calmodulin kinase II (with increased activity of phosphorylated enzymes), activation of
Introduction
Ca2+-dependent endonucleases, and expression of transcription factors such as c-Fos, c-Jun or c-Myc. Mitochondrial dysfunction resulting from pathologic receptor activation plays a central role in the delayed necrotic death of the neuron (Budd and Nicholls, 1996; Wang and Thayer, 1996). In fact recent findings have shown that the initial Ca2+ loading into the cytoplasm and Ca elevation are not neurotoxic per se, as long as the mitochondria are depolarized (Stout et al., 1998).In contrast, the further uptake of intracellular Ca2+ into the mitochondria creates a condition that results in an irreversible failure of cytoplasmic Ca2+ extrusion (Limbrick et al., 2001); this delayed failure of cytoplasmic Ca2+ homeostasis seems to be involved in activation of neuronal death pathways (Casthilo et al., 1999; Nicholls et al., 2007).
Neuroprotective properties of cannabinoids
Brain injury results in neurodegenerative events within the nervous system; in fact, traumatic events like stroke, physical trauma, inflammatory reactions, can trigger neurotoxic cascades, ultimately leading to neuronal death. Excitotoxicity takes center stage in the pathologic sequelae after stroke or traumatic brain injury (DeLorenzo et al., 2006; Lipton, 1999; Siesjö, 1992; Siesjö and Bengtsson, 1989), and has been implicated in the slow progression of neurodegenerative disorders such as multiple sclerosis, Alzheimer's disease, amyotrophic lateral sclerosis, Parkinson's disease, and Huntington's disease (Kim et al., 2002; LaFerla, 2002; Mattson et al., 2000; Missiaen et al., 2000).
The events that lead to excitotoxic cell death can be initiated at many levels: by ATP depletion secondary to oxygen and glucose deprivation; by mitochondrial disorders (Pang and Geddes, 1997); by exogenous administration of glutamate receptor agonists (Dijkhuizen et al., 1996); by removing the voltage-sensitive Mg2+ blockade from the NMDA-receptor (Zeevalk and Nicklas, 1992); by blocking glutamate-uptake (Velasco et al., 1996); by pharmacologically inhibiting Na+/K+-ATPase thereby directly
inducing depolarisation, etc. Regardless of the point of initiation, the neurotoxic events self-amplify, and ultimately lead to cell death. Several mechanisms are considered the rational basis of neuroprotective properties of cannabinoids (Drysdale and Platt, 2003):
a) reduction and regulation of transmitter release ; b) modulation of calcium homeostasis and excitability; c) antioxidant properties;
d) modulation of immune response.
Cannabinoids showed neuroprotection against brain injury resulting from injected toxins, hypoxia and head trauma: endocannabinoids (AEA and 2-AG) synthesis is strongly enhanced after brain injury, and there is evidence that these compounds reduce the secondary damages (reviewed in Mechoulam et al., 2002; van der Stelt et al., 2002). Some plant and synthetic cannabinoids (CBD, HU-211), have also been shown to be neuroprotective with mechanisms different from the cannabinoid receptors binding, possibly through their direct effect on the excitatory glutamate system and/or as antioxidants (Mechoulam et al., 2002). Researchers have found protective effects from endogenous cannabinoids in models of multiple sclerosis (Baker et al., 2001; Croxford et al., 2008; Ligresti et al., 2006). Anandamide levels in the brains of rats rise after kainate administration and protect against excitotoxicity (Marsicano et al., 2003), and the cannabinoid system may play a primary role in limiting brain damage (Mechoulam and Lichtman, 2003). The mechanisms by which the cannabinoids reduce damage to the brain are related to enhanced GABAergic tone, reducing glutamate activity, as well as to inhibition of nitric oxide and TNFα production (Molina-Holgado et al., 1997). Neuroprotective effects of the CB1 agonists WIN55212-2 and CP55940 have also been demonstrated against neuronal death induced by glutamate in vitro, via CB1 receptor (Hampson and Grimaldi, 2001; Shen and Thayer, 1998). Similar results are reported with the cannabinoid agonist WIN55212-2 inhibiting glutamate release in an in vivo model of
hypoxia-Introduction
ischemia in newborn rats. This effect is mediated by both CB1 and CB2 receptors (Martinez-Orgado et al., 2003; Fernández-López D et al., 2007). WIN55212-2 is also known to inhibit certain calcium channels, (Hampson and Grimaldi, 2001), and the production of cytokines (Sheng et al., 2005). Neuroprotective effects of THC and CBD, and of CB1 agonists may also involve their antioxidant properties. (El-Remessy et al., 2003; Hampson et al., 1998; Marsicano et al., 2002).
Some in vitro and in vivo studies do not support a neuroprotective action of cannabinoids (van der Stelt et al., 2002).
Cannabinoids and epilepsy
Epilepsy is one of the most common diseases of the brain, characterized by the periodic and unpredictable occurrence of epileptic seizures, which are caused by an abnormal discharge of cerebral neurons. Many different types of seizures can be identified on the basis of their clinical phenomena. These clinical characteristics, along with their electroencephalographic (EEG) features, can be used to categorize seizures in partial and generalized ones. Partial focal, local seizures have a localized onset in a portion of one hemisphere, while generalized seizures are those in which evidence for a localized onset is lacking. In the absence of a specific etiological understanding in any of the epilepsies or epileptic syndromes, approaches to drug therapy of epilepsy must necessarily be directed at the control of symptoms, i.e. the suppression of seizures (Löscher, 1997). In fact, all currently available drugs are anticonvulsant - antiseizure rather than antiepileptic. In most patients with epilepsy the prognosis for seizure control is very good. Since a significant proportion of individuals with epilepsy suffer from pharmacoresistant epilepsy, there is a clear need for new drugs or new strategies of therapeutic management (Löscher and Schmidt, 2002), and also new drugs with benefits in terms of side effects and tolerability are needed (Schmidt and Kramer, 1994). Relatively high densities of CB1 receptors are
localized in areas such as the hippocampus, amygdala, and cerebral cortex, areas known to subserve various kinds of seizures (Adams et al., 1997). Thorough investigations on the anticonvulsant activity of phytocannabinoids were made during the 1970s, around one decade after CBD and THC had been isolated from Cannabis sativa and characterized, but before the endocannabinoid system had been discovered. CBD (and cannabinol) showed to possess an anticonvulsant activity comparable to that of THC in the maximal electroshock test in mice (Karler et al., 1973; Karler et al., 1974a,b), and tolerance to this activity developed only for THC. Pure THC was compared to clinically used anti-epileptic drugs (diphenylhydantoin, phenobarbital and chlordiazepoxide) demonstrating that it increased the latency of tonic convulsion in the pentylentetrazol-induced seizures in mice, but along with diphenylhydantoin at high dosages enhanced the effect of the chemoconvulsant (Sofia et al., 1976). During the 1980s small clinical trials were made to assess therapeutic effect of CBD in patients suffering from epilepsy. “Beneficial effect” in patients refractory to all known antiepileptic drugs was reported, and CBD was considered acting as an antiepileptic drug with no sign of toxicity (Carlini and Cuhna, 1981). In the same period, the three-dimentional structures of CBD and phenytoin were compared and both drugs showed to be “in line with the stereochemical requirements suggested for anticonvulsant drug action” (Tamir et al., 1980). Later CBD was suggested to act preferentially to reduce the spread of seizures activity irrespective to their focal origin in the CNS (Consroe et al., 1982). Many studies on CBD, THC, and their analogs in animal seizure models have been performed, showing that they are largely inactive in animal models of absence seizures produced by electroshock or chemoshock methods (Consroe, 1998). On the other hand, they are generally effective against partial seizures produced by topical application of convulsant metals, limbic seizures produced by kindling, and generalized maximal seizures induced in genetically epileptic animals or produced in animals by electroshock or
Introduction
GABA-inhibiting drugs (Consroe and Snider, 1986). Anticonvulsant mechanisms of phytocannabinoids appear to involve a reduction of the spread of the generalized maximal seizures and, in limbic seizure models, an increase in the threshold for seizures. The anticonvulsant effects of CBD seem not to be stereoselective, and devoids of toxic effects, whereas THC seems to show stereoselectivity, and in some model shows proconvulsant or convulsant activity (Mechoulam et al., 1992).
This pro-convulsive activity might be explained by the fact that CB1 receptors expressed on inhibitory GABAergic neurons are activated by THC, leading to a decreased release of GABA, and to the increase in seizure susceptibility. On the other hand, CB1 receptors expressed on excitatory glutamatergic neurons mediate the anti-convulsive activity of endocannabinoids (Lutz, 2004); moreover, systemic activation of CB1 receptors by exogenous cannabinoids is anti- or pro-convulsive, depending on the seizure model used (Mechoulam and Lichtman, 2003). A promising strategy to alleviate seizure frequency might be the enhancement of endocannabinoid levels by inhibiting the uptake and the degradation of these endogenous compounds (Lutz, 2004).
AIM OF THE STUDY
In vivo
During the XIX century, western medicine adopted the use of Cannabis sativa for its antiemetic, analgesic and anticonvulsant properties. The psychoactive effects of its preparations have been largely ascribed to the presence of Δ-9-tetrahydrocannabinol (THC), but it is also well known that other cannabinoids exhibit a range of pharmacological activities. One of the more widely investigated cannabinoids is cannabidiol (CBD), which greatly contributes to the attenuation of the side effects of THC, when co-administered to patients. The aim of the in vivo study was to assess the potential anticonvulsant activity of three different extracts of hemp aerial parts, harvested by genetically selected genotypes (one rich in THC, one rich in CBD, and one devoid of cannabinoids).
In vitro
Excitotoxicity, caused by the excess activation of glutamate receptors and subsequent accumulation of intracellular Ca2+, initiates a cascade of events that ultimately leads to neuronal death and thus takes centre stage in many CNS disorders such as stroke, traumatic brain injury and neurodegenerative diseases. Intracellularly, mitochondria provide ATP as the source of cellular energy and maintain Ca2+ levels. Hence, alterations of the mitochondrial physiology cause irreversible neuronal injury due to the inability to sustain homeostasis. The aim of the in vitro study was to investigate the possible protection offered by the non-psychoactive cannabinoid cannabidiol (CBD) and the non-competitive NMDA receptor antagonist memantine in models of excitotoxicity and mitochondrial dysfunction.
Methods
IN VIVO METHODS
Plant material and extracts
Cannabis sativa L. aerial parts, harvested by three different genotypes, were kindly supplied by the ISCI (Research Institute for Industrial Crops, C.R.A., Via Amendola, 82, I-45100 Rovigo, Italy). One chemovar is rich in Δ-9-tetrahydrocannabinol (THC rich), one chemovar is rich in cannabidiol (CBD rich), one chemovar devoids of cannabinoids (cannabinoid-free). 100 g of each dried drug was macerated in 2 L of ethanol 95%, at 55 °C, for 12 hours. The ethanolic solution was filtered, concentrated to 100 mL with rotavapor and then filtred with a buchner. The final solution was dried with rotavapor to obtain a resinous extract. The THC- and CBD-rich crude extracts were titrated respectively in Δ-9-THC and CBD by Dr. Grassi G.
Pentylentetrazol (PTZ) induced seizures
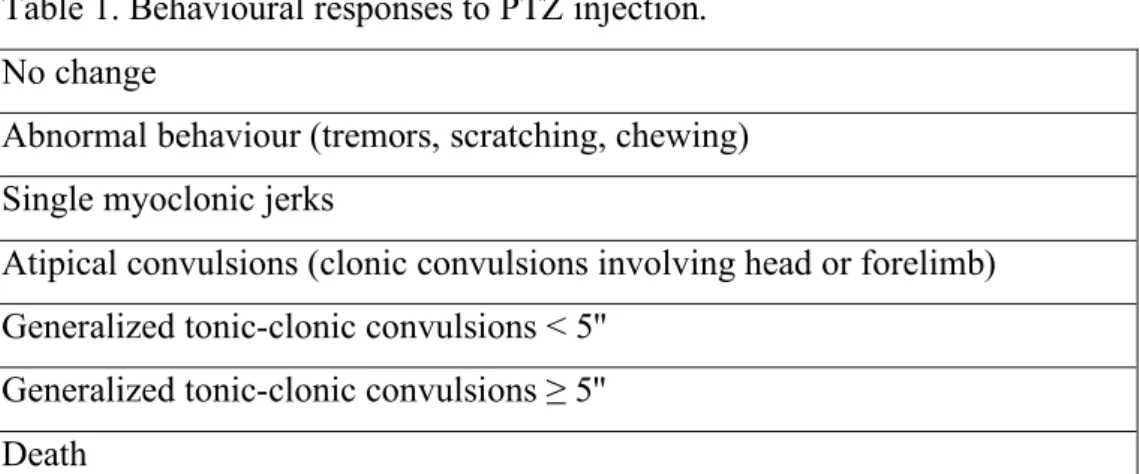
To characterize the anticonvulsant activity of the Cannabis extracts, an experimental model for grand-mal seizures was used (Shafaroodi et al., 2004). Male CD1 mice (Harlan, Italy, weighting 25 ± 5 g), were housed under controlled conditions, 12 h light: 12 h dark cycle, 22 °C, 60% humidity. Food and water were supplied ad libitum. Procedures and animal comfort were controlled by the University Veterinary Service. The animals were divided in groups (n ≥ 8) and treated i.p. with the drugs or extracts under investigation. After 60 minutes they were all injected with the chemoconvulsant PTZ (85 mg/kg i.p.). Each animal was placed in an individual cage (this procedure is necessary to avoid aggregation effects on the animals behaviour) (Löscher et al., 1991) and observed for 30 minutes (cut off time). Behavioural responses to PTZ injection (see description in Table 1) were carefully recorded to evaluate the incidence and the latency of generalized convulsions and lethality.
Table 1. Behavioural responses to PTZ injection. No change
Abnormal behaviour (tremors, scratching, chewing) Single myoclonic jerks
Atipical convulsions (clonic convulsions involving head or forelimb) Generalized tonic-clonic convulsions < 5''
Generalized tonic-clonic convulsions ≥ 5'' Death
Extracts and drugs administration
Three dosages of the different Cannabis extracts were investigated in this model: THC rich extract, 10, 25, 50 mg/kg (the dose refers to the concentration of THC in the extract); CBD rich extract, 100, 200, 300 mg/kg (the dose refers to the concentration of CBD in the extract); cannabinoid-free extract, 300, 400 mg/kg (the dose refers to the amount of extract suspended in vehicle). They were all suspended in the same vehicle: 10% propylen glycol, 1% tween 80, in saline. Chlordiazepoxide (Sigma) 10 mg/kg was used as positive control, and dissolved in saline.
Data analysis
Data are presented as latency time to onset of generalized tonic-clonic convulsions and latency to lethal effect. A latency of 1800 seconds was counted for animals which did not show generalized convulsions. Statistical analysis was performed using Graphpad Prism (Version 4.01; GraphPad Software, San Diego, CA, USA). Significance of differences between drug or extract treated groups and controls was determined using Kruskal-Wallis test followed by Dunn's Multiple Comparison Test, due to the non-parametric distribution of the data. Differences were considered significant for P<0.05. Incidence of death subsequent to PTZ i.p. injection was expressed as number
Methods
of animals surviving to the treatment, and percentage of survived. The incidence was compared among groups using Fisher’s exact test. P < 0.05 was considered the significance level between groups.
IN VITRO METHODS
Cell culture
Hippocampal cultures were prepared from 1 to 3 day old Sprague Dawley rat pups after cervical dislocation, in accordance with Home Office and institute regulations, as described previously (e.g. Drysdale et al., 2006). The brain was quickly removed, hippocampi were isolated, cut out, and placed in ice-cold filtered HEPES buffered solution (HBS composition in mM: NaCl 130; KCl 5.4; CaCl2 1.8; MgCl2 1; HEPES 10; glucose 25). Cold tissue was placed in 1 mg/ml type X and XIV protease solution, and chopped into fine pieces. After 40 minutes, the tissue was rapidly washed in HBS, triturated several times, and centrifuged twice. Before the last centrifugation, HBS was replaced with 90% Minimum Essential Medium (MEM; Gibco, Paisley, UK) with 10% foetal bovine serum (FBS; Helena Biosciences, Sunderland, UK) and 2 mM L-glutamine. Cells were then plated, and kept in a humidified incubator at 37ºC and in 5% CO2. The cultures were allowed to mature for 48 h prior to replacement of MEM with Neurobasal Medium (Gibco, Paisley, UK), supplemented with 2% B27, 2mM glutamine, and 25mM L-glutamate. All compounds used here, apart from media and serum, were from Sigma, Poole, UK. This tissue culture procedure produces mixed cultures that contain glia (~60%, of these: oligodendrocytes <10%, microglia <10% and astrocytes 80–90%); and neurones (~40%). Culture dishes were used for experimentation at days 4–10 in vitro (DIV).
NMDA induced excitotoxicity and Ca imaging protocol
For Ca imaging experiments, hippocampal cultures were washed with HBS at room temperature and loaded with the cell-permeable fluorescent calcium indicator Fura-2-AM (10µm, Molecular Probes, OR, USA) for 1 h in the dark. Cultures were perfused with low Mg2+ high Ca2+ HBS (composition in
Methods
mM: NaCl, 130; KCl, 5.4; CaCl2, 5.0; MgCl2, 0.1; HEPES, 10; glucose, 25; compounds from Sigma), maintaining a flow rate of 1–2 mL ⁄ min, with a gravity perfusion system. Ratiometric imaging was performed with imaging systems fitted onto an Olympus microscope. The system used the Improvision software package Openlab (version 4.03) using a DG-4 illumination system (Sutter Instruments Company, CA, USA) and Hamamatsu Orca-ER CCD camera. The ratio of the two wavelengths emitted (340 nm and 380 nm) is directly proportional to intracellular calcium levels in the cells. Thus, following background fluorescence subtraction, this value was plotted for all neurons and glia after identification of regions of interest (ROI), with frames captured every 5 s. A minimum of four experiments were conducted for each group of treatment, each on cells from a different culture. A control dish was conducted at each session of experiment to make sure that the daily response of the culture to the NMDA insult was consistent with the previous experiments.
Excitotoxicity was induced by application of 1 mM NMDA (in the presence of 100 µM glycine, co-agonist of the NMDA receptor) for 5 minutes in low Mg2+ high Ca2+ HBS solution. The parameters determined were the response to NMDA, the recovery, and the secondary Ca dysregulation (see data analysis section for details). Measurement ended after a washout of 40 minutes after NMDA application.
3-NP intoxication protocol and cell death determination with PI/Calcein kit Between 4 and 10 DIV, cultures were selected and subdivided into treatment group categories, maintaining uniform culture quality, composition and cell density. Cultures were treated for 72 hrs with 1 mM of the mitochondrial toxin 3-NP (3-nitropropionic acid) in NB medium in the presence or absence of CBD or memantine (see below). All treatment solutions were prepared and allowed to temperature- and gas-equilibrate in the aforementioned incubated environment for a period of at least 30 min. Incubation solutions were
prepared with final concentrations of either memantine or CBD in NB medium. The choice of concentrations was based on earlier experiments performed with these substances. Solutions were adjusted to physiological pH immediately prior to sterile-filtered application to cultures. Dishes were stained with live/dead cell staining kit (purchased from Sigma) Calcein-AM is converted to green fluorescent calcein in viable cells only. Propidium iodide (PI) intercalates with DNA of dead cells only after passing through disordered areas in cell membrane of dead cells only. Images were visualised using an Axioskop 2 plus microscope (Carl Zeiss, Germany) with a 40x phase contrast water immersion objective, and were captured using an AxioCam HRc camera, controlled by AxioVision software (Version 3.1). In order to identify the dish’s cellular composition, a brightfield image was initially captured, followed by image acquisition using Rhodamine (for PI) and FITC (for calcein-AM) filters. Free-hand count of Calcein-AM-stained cells led to the determination of the total number of live cells, and the merged transmission image allowed selection of neurons (three-dimensional and halo in phase contrast) versus glia (flat in appearance). Cells with PI staining were then highlighted to illustrate non-viable cells. Cell viability according to cell type was calculated as percentage survival. Each experiment was repeated at least three times, each on dishes from a different culture. Three dishes were used per culture, and three images were snapped for each dish. This ensured that a suitable number of replicates (n = 9 dishes) were sampled for each treatment for statistical analysis. Means and S.E.M. of percentage survival were calculated for each dish, as the average of the three snaps. This value was then exported to Prism.
Drug application
Calcium imaging. NMDA (Ascent), CBD (a gift from GW Pharmaceuticals / Prof. Pertwee), and memantine (Tocris) used in these studies are pure drugs. The eCBD used in the post treatment protocol, is a CBD-rich Cannabis
Methods
extract (GW Pharmaceuticals) containing 64.6% CBD and 2.5% Δ-9-tetrahydrocannabinol (THC) (see Ryan et al., 2006 for further details).
The first set of experiments consisted in a 10 minutes perfusion with CBD 1µM, 100nM, memantine 10µM, or eCBD 1µM straight after the application of NMDA. In one experiment, CBD 1µM was applied for 5 minutes (instead of 10) straight after the application of NMDA.
The second set of experiments, a 5 minutes perfusion of CBD 1µM or memantine 10µM together with NMDA was applied to the cells. Straight after this, CBD 1µM or memantine 10µM were applied for further 5 minutes without NMDA.
In the last set of experiments, CBD 1µM or memantine 10µM were applied to the cells for 10 minutes straight before the application of NMDA without any other drug.
3-NP toxicity. 3-nitropropionic acid (Sigma), CBD 1µM, 10µM, and memantine 10µM used in these studies are pure drugs. 3-NP 1mM dosage was chosen after a toxicity pilot study on three different dosages (data not shown).
Data analysis
Ca imaging. Data were exported to Excel. Ratiometric values obtained from Openlab were plotted against time, and the time course of the fluorescence for each ROI was analysed. Comparisons of pre-NMDA baseline fluorescence and fluorescence values at the end of the washout were expressed as ratio units (340/380nm). The response to NMDA, CBD, or memantine was determined as percentage change from pre-drug baseline fluorescence (% ΔF/F), the values of the response being taken at the maximum rise of the fluorescence within the 5 minutes of the NMDA application. Recovery of basal levels of [Ca2+] of each ROI was calculated as a ratio between the maximum rise in fluorescence registered within NMDA application minus the
pre-NMDA baseline fluorescence, and the maximum rise in fluorescence registered within NMDA application minus the baseline at the end of the measurement - exact formula used was [(NMDA response - baseline pre-NMDA)/(NMDA response – recovery baseline)]: values between 0.9 and 1.1 were considered full recovery; between 1.1 and 2.0 were considered 50% recovery; values > 2.0 were set as no recovery. These values where then expressed as % of neurons showing the recovery. The working hypothesis assumes that more protective treatment leads to a higher percentage of neurons that show a full or partial recovery. The late amplitude values were calculated as the difference between the fluorescence at the end of the measurement and the pre-NMDA fluorescence. The occurrence of secondary Ca dysregulation was also measured, as it is a sign of excitotoxicity: the neurons showing an increase of [Ca2+]I after the NMDA perfusion, were
counted and the occurrence was expressed as % of neurons showing the dysregulation. The rise in [Ca2+]I within 15′ from NMDA application was
considered as early secondary Ca dysregulation, whereas late secondary Ca dysregulation was the increase in [Ca2+]I later than 15 minutes from NMDA
application.
Statistical analysis was performed using Graphpad Prism (Version 4.01; GraphPad Software, San Diego, CA, USA). Normality tests on raw data and on % ΔF/F responses, confirmed absence of normal distribution of data. Therefore, a Kruskal–Wallis test with Dunn’s post hoc test was used for group comparisons. For paired comparison Mann-Whitney U test was used. Significance was set at P < 0.05.
3-NP toxicity. Statistics were calculated using GraphPad Prism. Mean survival rates (in %) and S.E.M.s were calculated for each group and cell type. Survival rates were calculated for each control group and one-way analysis of variance (ANOVA) was performed for between-group comparisons, followed by post hoc analysis (Dunnett’s multiple comparison). P < 0.05 values were considered significant.
Results
IN VIVO RESULTS
PTZ induced seizures studyThough Cannabis sativa has been long investigated for its anticonvulsant properties, it is not fully understood whether its possible anticonvulsant activity is due only to the presence of ∆-9-THC, or it can also be attributed to the presence of CBD, or other cannabinoids and non-cannabinoid compounds. In order to investigate this hypothesis an experimental model for grand-mal seizures was used.
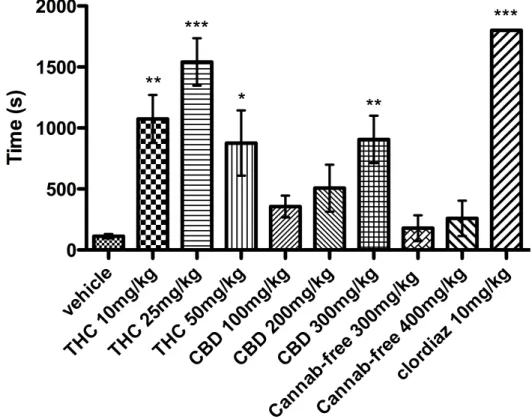
When the three different dosages of THC-rich extract were administered to mice (n = 8) 1h before PTZ injection, all animals showed behavioural effects due to THC presence: motor depression and catalepsy, as well as hypothermia. When PTZ 85 mg/kg was injected, 100% of the animals showed generalized convulsions. As it is shown in Fig. 1, THC-rich extract at the dose of 10 mg/kg and 50 mg/kg significantly (P < 0.01 and P < 0.05 respectively) prolonged the latency for the onset of first generalized tonic-clonic convulsions 8 times. THC-rich at 25 mg/kg significantly (P < 0.001) prolonged the latency to first generalized tonic-clonic convulsions more than 10 times; values of latency to onset are summarized in Tab. 2. As it is shown in Fig. 2, THC-rich extract at the dose of 10 mg/kg significantly (P < 0.05) increased the survival of the animals after PTZ treatment from 12.5% to 87.5%, and at the dose of 25 mg/kg significantly (P < 0.01) increased the survival of the animals after PTZ treatment from 12.5% to 100%.
When the three different dosages of CBD rich extract were administered to mice (n = 8) 1 h before PTZ injection, none of the animals seemed to show signs of Cannabis intoxication, as the extract contained only traces of THC. When PTZ was injected, 100% of the animals showed generalized convulsions. CBD-rich extract 300 mg/kg significantly (P < 0.01) prolonged
the latency to first generalized tonic-clonic convulsions (Fig. 1) 8 times. CBD-rich extract at 300 mg/kg significantly (P < 0.05) increased the survival of the animals after PTZ treatment, from 12.5% to 75% (Fig. 2).
When the two dosages of cannabinoid-free extract were administered to mice (n = 8) 1h before PTZ injection, none of the animals seemed to show signs of Cannabis intoxication, as this extract contained traces of THC. When PTZ was injected, 100% of the animals showed generalized convulsions, and none of doses were able to protect the animals from the effects of PTZ (Fig. 1 and 2).
When clordiazepoxide 10 mg/kg was administered none of the animals (n =8) showed convulsions or jerks. Latencies of 1800 seconds were counted for this group (Fig. 1, Fig. 2 and Table 2).
Values of latencies to first generalized tonic-clonic convulsion are summarized in Tab. 2.
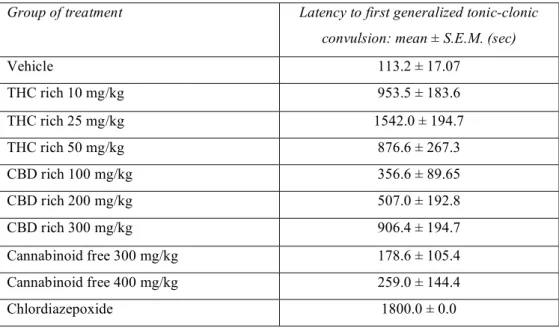
Table 2. Latencies to first generalized tonic-clonic convulsion following i.p. injection of PTZ 85 mg/kg.
Group of treatment Latency to first generalized tonic-clonic convulsion: mean ± S.E.M. (sec)
Vehicle 113.2 ± 17.07 THC rich 10 mg/kg 953.5 ± 183.6 THC rich 25 mg/kg 1542.0 ± 194.7 THC rich 50 mg/kg 876.6 ± 267.3 CBD rich 100 mg/kg 356.6 ± 89.65 CBD rich 200 mg/kg 507.0 ± 192.8 CBD rich 300 mg/kg 906.4 ± 194.7 Cannabinoid free 300 mg/kg 178.6 ± 105.4 Cannabinoid free 400 mg/kg 259.0 ± 144.4 Chlordiazepoxide 1800.0 ± 0.0
Results
Figure 1. Latency for the onset of first generalized tonic-clonic seizure in animals injected with PTZ 85 mg/kg i.p. and pre-treated with different Cannabis extracts (THC, CBD, Cannab-free) and in control groups. Clordiazepoxide (clordiaz) group represents positive control. Data are presented as mean ± S.E.M. of latency for the onset. * P < 0.05; ** P < 0.01; *** P < 0.001 compared to vehicle group.
Figure 2. Comparison between lethal effect incidence following i.p. injection of PTZ (85 mg/kg) in animal pre-treated with different Cannabis extracts (THC and CBD) and in control groups, vehicle and clordiazepoxide (clordiaz). The data are presented as number of animals surviving PTZ treatment. (Fisher’s exact test *P < 0.05; **P < 0.01). The percentage of mice survived to PTZ treatment for each group, is shown above the columns.
Results
IN VITRO RESULTS
Ca imaging study
The typical response of neurons of a naïve dish to the application of NMDA (1mM) for 5 minutes is shown in Figure 1. The NMDA application provoked an immediate elevation in [Ca2+]I levels, as represented in the chart by a large increase of the fluorescence. The levels of [Ca2+]I remained high within the 5 minutes of application, the average response being 339.0 ± 17.2% ΔF/F (n = 124). When NMDA was removed, the fluorescence rapidly dropped to a lower level, and [Ca2+]I tended to recover to baseline values. During the 40 minutes of washout, some neurons showed a secondary rise in [Ca2+]I. The incidence of this feature was calculated and expressed as secondary Ca dysregulation: the percentage of neurons showing early secondary Ca dysregulation was 13.6 ± 6.2%, whereas 18.9 ± 5.8% of neurons showed late dysregulation (Tab. 1). The percentage of neurons showing full recovery or 50% recovery at the end of the measurement was 1.9 ± 0.9% and 51.1 ± 7.6% respectively; 47.3 ± 7.8% of neurons showed no recovery. At the very end of the measurement only few neurons showed [Ca2+]I levels similar to pre-NMDA baseline, the late amplitude was 0.58 ± 0.03 ratio units. One neuron (0.8%) showed fluorescence lower than pre-NMDA baseline.
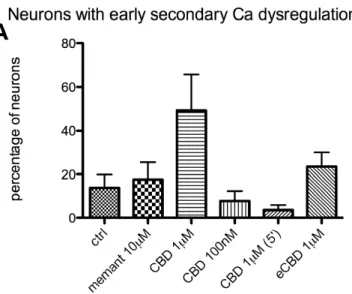
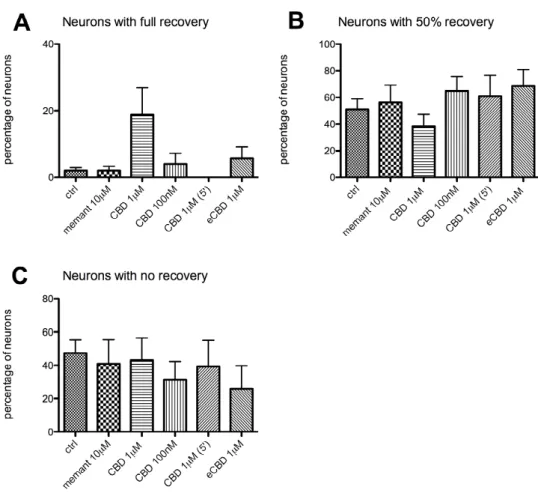
The first set of experiments assessed the ability of CBD and memantine to aid recovery when applied after NMDA. The time course of the fluorescence (Fig. 2), when CBD (1µM) was applied, followed a pattern similar to that of controls: neurons tended to recover to baseline [Ca2+]I levels within washout time. Some neurons showed a secondary rise in [Ca2+]I level: in particular, 49.2 ± 16.5% of neurons (n = 97) demonstrated early secondary Ca dysregulation (Fig. 3A) and 12.2 ± 6.5% late Ca dysregulation (Fig. 3B). The percentage of neurons showing full recovery (Fig. 4A) or 50% recovery (Fig. 4B) was 18.7 ± 8.1% and 38.1 ± 9.0% respectively; 43.1 ± 13.2% of neurons
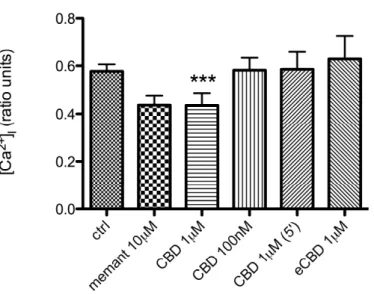
showed no recovery (Fig. 4C). At the very end of the measurement only few neurons showed [Ca2+]I level similar to pre-NMDA baseline: the late amplitude was significantly (P < 0.001) lowered by 24% (from 0.58 ± 0.03 ratio units to 0.44 ± 0.05 ratio units compared to controls; Fig. 5); 4 neurons (4.1%) showed fluorescence lower than pre-NMDA baseline.
When a lower dose of CBD (100nM) was applied (chart not shown) the response of neurons was similar to controls. The 7.7 ± 4.4% of neurons (n = 73) show early secondary Ca dysregulation (Fig. 3A), and 11.3 ± 7.9% of neurons late dysregulation (Fig. 3B). Recoveries to this treatment were characterized by 4.0 ± 3.1% of neurons showing full recovery (Fig 4A), 64.8 ± 10.6% showing 50% recovery (Fig 4B), and 31.2 ± 11.1% no recovery (Fig. 4C). The late amplitude at the end of washout was 0.58 ± 0.05 ratio units (Fig. 5).
When the time of application was changed and CBD (1µM) was applied for 5′ (chart not shown), 3.5 ± 2.2% of neurons showed early secondary Ca dysregulation (Fig 3A), and 30.0 ± 15.5% of neurons showed late Ca dysregulation (Fig 3B). The treatment did not help neuronal recovery: none of neurons (n = 42) showed full recovery (Fig. 4A), the percentage of neurons showing 50% recovery (Fig. 4B) was 60.8 ± 15.7%, and no recovery was 39.2 ± 15.7% (Fig. 4C). At the end of the washout, the late amplitude was 0.59 ± 0.07 ratio units (Fig. 5).
When eCBD 1µM was applied after NMDA for 10′ (chart not shown), it did not alter the parameters analysed. The percentage of neurons (n = 51) showing early dysregulation (Fig. 3A) was 23.6 ± 6.4%, and 5.4 ± 5.4% showed late dysregulation (Fig. 3B). Full recovery was shown by 5.7 ± 3.5% of neurons (Fig. 4A), and 50% recovery by 68.4 ± 12.7% (Fig. 4B). A percentage of 26.0 ± 13.8% showed no recovery (Fig. 4C). [Ca2+]I at the end of the washout was characterized by a late amplitude of 0.62 ± 0.10 ratio units (Fig. 5).
Results
The response of neurons to the application of memantine 10µM after NMDA, is shown in Figure 6. The time course of fluorescence did not seem to differ much from that of controls, and neurons tended to recover to baseline [Ca2+]I levels within washout period with a pattern similar to controls. During the 40 minutes of washout, some neurons showed a secondary rise in the [Ca2+]I level. The percentage of neurons (n = 46) showing early secondary Ca dysregulation (Fig. 3A) was 17.6 ± 8.1%, whereas 13.8 ± 4.0% of neurons showed late dysregulation (Fig. 3B). The percentage of neurons showing full recovery (Fig. 4A) or 50% recovery (Fig. 4B) was 1.9 ± 1.3% and 56.0 ± 13.0% respectively; 40.9 ± 14.2% of neurons showed no recovery (Fig. 4C). At the very end of the measurement only few neurons showed [Ca2+]I similar to the pre-NMDA baseline: the late amplitude was 0.44 ± 0.04 ratio units (Fig. 5).
The second set of experiments assessed the ability of CBD and memantine to alter NMDA response and aid recovery when applied contemporary to NMDA.
The response of neurons to the application of CBD (1µM) is shown in Figure 7. The time course of fluorescence showed that the rise in [Ca2+]I due to NMDA application did not seem to be altered by the presence of CBD (394 ± 24% ΔF/F; Fig. 8). As it is shown in Fig. 9 A and B, the percentage of neurons (n = 86) showing early secondary Ca dysregulation was 15.7 ± 9.5%, whereas 7.9 ± 3.9% of neurons showed late dysregulation. The percentage of neurons showing full recovery (Fig. 10A) or 50% recovery (Fig. 10B) was 2.3 ± 1.5% and 58.8 ± 6.5% respectively; 38.9 ± 6.1% of neurons showed no recovery (Fig. 10C). At the very end of the measurement only few neurons showed [Ca2+]I level similar to pre-NMDA baseline: the late amplitude was 0.91 ± 0.11 ratio units (Fig. 11); 2 neurons (2.3%) showed a fluorescence lower than pre-NMDA baseline.
In comparison, application of memantine (10µM) along with NMDA, had an effect on the parameters analysed, as this drug is a NMDA receptor
antagonist. As it is shown in the chart in Fig. 12, simultaneous application of memantine dampened the response of neurons to NMDA application. As it is shown in Fig. 8, memantine significantly (P < 0.05) lowered the response of neurons (n = 64) by 23% (from 339 ± 17% ΔF/F to 262 ± 10% ΔF/F); moreover, memantine effect on NMDA response was significantly (P < 0.001) different from that of CBD. Memantine did not alter secondary Ca dysregulation: early dysregulation (Fig. 9A) was 22.8 ± 14.4%, whereas 3.2 ± 1.9% of neurons showed late dysregulation (Fig. 9B). As it is predictable by the effect on NMDA response, memantine significantly (P < 0.01) increased the percentage of neurons showing full recovery (from 1.9 ± 0.9% to 29.6 ± 12.2%; Fig. 10A), and significantly (P < 0.05) lowered the percentage of neurons that did not recover (from 47.3 ± 7.8% to 11.6% ± 9.6%; Fig. 10C). 50% recovery was not altered by the presence of memantine (58 ± 7.7%; Fig. 10B). The application of memantine significantly (P < 0.001) lowered the [Ca2+]I measured at the end of washout by 79%: the late amplitude dropped
from 0.58 ± 0.03 ratio units to 0.12 ± 0.02 ratio units (Fig. 11); memantine effect on late amplitude was significantly (P < 0.001) different from that of CBD. One neuron (1.6%) showed fluorescence lower than pre-NMDA baseline.
The last set of experiments assessed the ability of CBD and memantine to alter NMDA response and aid recovery when applied before NMDA insult. The response of neurons to application of CBD (1µM) for 10 minutes, is shown in Figure 13: CBD induced a significant (P < 0.001) increase in [Ca2+]I
by 16% (from 0.237 ± 0.002 to 0.2831 ± 0.007; Fig. 14A) in neurons perfused (n = 64), with a maximum response of 26.16 ± 2.78% ΔF/F (Fig. 14B). This response to CBD was significantly different (P < 0.001; Fig. 14A) from that of memantine, which did not produce any increase in fluorescence when applied to neurons (see below); the intensity of CBD response was also significantly different (P < 0.001; Fig. 14B) from that of NMDA, when these drugs were applied to naïve dishes. When NMDA was applied after CBD, the
Results
response of neurons (n = 64) was significantly (P < 0.001) lowered by 24% from 658 ± 27 % ΔF/F to 503 ± 23% ΔF/F (Fig. 15). The percentage of neurons showing Ca dysregulation did not seem to be altered by pre-application of CBD: early secondary Ca dysregulation (Fig. 16A) occurred in 1.0 ± 1.0% of neurons, whereas 3.4 ± 2.4% of neurons showed late dysregulation (Fig. 16B). The percentage of neurons showing full recovery (Fig. 17A) or 50% recovery (Fig. 17B) was 8.7 ± 5.6% and 86.3 ± 7.9% respectively; 5.0 ± 2.5% of neurons showed no recovery (Fig. 17C). At the very end of the measurement the late amplitude was 0.28 ± 0.03 ratio units (Fig. 18).
The response of neurons to application of memantine (10µM) for 10 minutes is shown in Figure 19: the drug did not seem to produce any alteration of [Ca2+]I in neurons (Fig. 14A). On the other hand, when NMDA was applied after memantine, the response of neurons (n = 61) was significantly (P < 0.001) lowered by 21% (from 658 ± 27% ΔF/F to 517 ± 25% ΔF/F; Fig. 15). The percentage of neurons showing early secondary Ca dysregulation (Fig. 16A) was 4.4 ± 4.4%, whereas 2.5 ± 2.5% of neurons showed late dysregulation (Fig. 16B). The percentage of neurons showing full recovery is 34.1 ± 14.1%, and percentage of neurons showing 50% recovery was 56.2 ± 11.9%; 9.7 ± 4.2% of neurons show no recovery (Fig. 17). Memantine significantly (P < 0.001) lowered the [Ca2+]i measured at the end of washout by 48%: the late amplitude dropped from 0.29 ± 0.03 ratio units to 0.15 ± 0.05 ratio units (Fig. 18); memantine effect on late amplitude was significantly (P < 0.001) different from that of CBD. One neuron (1.6%) showed fluorescence lower than pre-NMDA baseline.
Tables 1, 2, and 3 summarize all the effects of CBD and memantine on the different parameters analyzed.
Figure 1. Time course of NMDA induced [Ca2+]I response in a population of neurons perfused with low Mg2+ high Ca2+ HBS solution. [Ca2+]I is expressed as ratio units. Each track represents the time course of one neuron.
Results
Figure 2. Time course of the [Ca2+]I response induced by CBD 1µM application after NMDA for 10′, in a population of neurons perfused with low Mg2+ high Ca2+ HBS solution. [Ca2+]I is expressed as ratio units. Each track represents the time course of one neuron.
Figure 3. Occurrence of early secondary Ca dysregulation (A) and of late secondary Ca dysregulation (B) in neurons treated with memantine (memant) 10µM, CBD 1µM, 100nM, or eCBD 1µM, applied after NMDA for 10 minutes. In one experiment, CBD 1µM was applied for 5 minutes (instead of 10) as it is indicated by brackets. Data are expressed as average percentage of neurons showing dysregulation.
Results
Figure 4. Occurrence of full recovery (A), 50% recovery (B), and no recovery (C) in neurons treated with memantine (memant) 10µM, CBD 1µM, 100nM, or eCBD 1µM, applied after NMDA for 10 minutes. In one experiment, CBD 1µM was applied for 5 minutes (instead of 10) as it is indicated by brackets. Data are expressed as average percentage of neurons showing recovery.
Figure 5. Late amplitudein neurons treated with memantine (memant) 10µM, CBD 1µM, 100nM, or eCBD 1µM, applied for 10 minutes after NMDA. In one experiment, CBD 1µM was applied for 5 minutes (instead of 10) as it is indicated by brackets. Data are expressed as ratio units. *** P<0.001 compared with control group using Kruskal–Wallis test with Dunn’s post hoc test.
Results
Figure 6. Time course of the [Ca2+]I response induced by memantine 10µM applied for 10′ after NMDA treatment, in a population of neurons perfused with low Mg2+ high Ca2+ HBS solution. [Ca2+]I is expressed as ratio units. Each track represents the time course of one neuron.
Figure 7. Time course of the [Ca2+]I response induced by CBD 10µM applied contemporary to NMDA in a population of neurons perfused with low Mg2+ high Ca2+ HBS solution. [Ca2+]I is expressed as ratio units. Each track represents the time course of one neuron.
Results
Figure 8. Comparison of NMDA response in control neurons and in neurons perfused with memantine (memant) 10µM, and CBD 1µM contemporary to NMDA application. * P < 0.05 compared with control group using Kruskal– Wallis test with Dunn’s post hoc test. ### P < 0.001 Mann-Whitney paired test.
Figure 9. Occurrence of early secondary Ca dysregulation (A) and of late secondary Ca dysregulation (B) in neurons treated with memantine (memant) 10µM, and CBD 1µM, applied contemporary to NMDA. Data are expressed as average percentage of neurons showing dysregulation.
Results
Figure 10. Occurrence of full recovery (A), 50% recovery (B), and no recovery (C) in neurons treated with memantine (memant) 10µM, and CBD 1µM, applied contemporary to NMDA. Data are expressed as average percentage of neurons showing recovery. * P < 0.05 compared with control group using Kruskal–Wallis test with Dunn’s post hoc test.
Figure 11. Late amplitude in neurons treated with memantine (memant) 10µM, and CBD 1µM applied contemporary to NMDA. Data are expressed as ratio units. ***P < 0.001 compared with control group using Kruskal– Wallis test with Dunn’s post hoc test. ### P < 0.001 Mann-Whitney paired test.
Results
Figure 12. Time course of the [Ca2+]I response induced by memantine 10µM applied contemporary to NMDA in a population of neurons perfused with low Mg2+ high Ca2+ HBS solution [Ca2+]I is expressed as ratio units.
Figure 13. Effect of the [Ca2+]I response induced by CBD 1µM application before NMDA for 10' in a population of neurons perfused with low Mg2+ high Ca2+ HBS solution. [Ca2+]I is expressed as ratio units.
Results
Figure 14A. Comparison of [Ca2+]I values (expressed as ratio units) in naïve neurons and in neurons perfused with memantine (memant) 10µM, and CBD 1µM. Memantine did not evoke any response in neurons, whereas CBD produced a significant response: *** P<0.001 compared with baseline levels using Kruskal–Wallis test with Dunn’s post hoc test. ### P < 0.001 Mann-Whitney paired test.
Figure 14B. Comparison between the response produced in neurons by the application of NMDA 1mM and CBD 1µM. *** P<0.001 Mann-Whitney paired test.
Results
Figure 15. Comparison of NMDA response in controls neurons and in neurons perfused with memantine (memant) 10µM, and CBD 1µM before NMDA application. *** P<0.001, ** P<0.01 compared with control group using Kruskal–Wallis test with Dunn’s post hoc test.
Figure 16. Occurrence of early secondary Ca dysregulation (A) and of late secondary Ca dysregulation (B) in neurons treated with memantine (memant) 10µM, and CBD 1µM, applied before NMDA insult. Data are expressed as average percentage of neurons showing dysregulation.
Results
Figure 17. Occurrence of full recovery (A), 50% recovery (B), and no recovery (C) in neurons treated with memantine (memant) 10µM, and CBD 1µM, applied before NMDA for 10 minutes. Data are expressed as average percentage of neurons showing recovery.
Figure 18. Late amplitude in neurons treated with memantine (memant) 10µM, and CBD 1µM, applied before NMDA for 10 minutes. Data are expressed as ratio units. *** P<0.001 compared with control group using Kruskal–Wallis test with Dunn’s post hoc test. ### P < 0.001 Mann-Whitney paired test.
Results
Figure 19. Time course of the [Ca2+]I response induced by memantine 10µM application before NMDA for 10′ in a population of neurons perfused with low Mg2+ high Ca2+ HBS solution. [Ca2+]I is expressed as ratio units.

![Figure 1. Time course of NMDA induced [Ca 2+ ] I response in a population of neurons perfused with low Mg 2+ high Ca 2+ HBS solution](https://thumb-eu.123doks.com/thumbv2/123dokorg/8229768.128673/38.892.187.730.303.566/figure-course-induced-response-population-neurons-perfused-solution.webp)
![Figure 2. Time course of the [Ca 2+ ] I response induced by CBD 1µM application after NMDA for 10′, in a population of neurons perfused with low Mg 2+ high Ca 2+ HBS solution](https://thumb-eu.123doks.com/thumbv2/123dokorg/8229768.128673/39.892.187.732.290.566/figure-response-induced-application-population-neurons-perfused-solution.webp)
![Figure 6. Time course of the [Ca 2+ ] I response induced by memantine 10µM applied for 10′ after NMDA treatment, in a population of neurons perfused with low Mg 2+ high Ca 2+ HBS solution](https://thumb-eu.123doks.com/thumbv2/123dokorg/8229768.128673/43.892.191.728.320.585/response-memantine-applied-treatment-population-neurons-perfused-solution.webp)
