R E S E A R C H A R T I C L E
Open Access
A transcriptomic approach to study the
effect of long-term starvation and diet
composition on the expression of
mitochondrial oxidative phosphorylation
genes in gilthead sea bream
(
Sparus aurata)
Jonás I. Silva-Marrero
1†, Alberto Sáez
1†, Albert Caballero-Solares
2, Ivan Viegas
3,4, María Pilar Almajano
5,
Felipe Fernández
2, Isabel V. Baanante
1and Isidoro Metón
1*Abstract
Background: The impact of nutritional status and diet composition on mitochondrial oxidative phosphorylation (OXPHOS) in fish remains largely unknown. To identify biomarkers of interest in nutritional studies, herein we obtained a deep-coverage transcriptome by 454 pyrosequencing of liver and skeletal muscle cDNA normalised libraries from long-term starved gilthead sea bream (Sparus aurata) and fish fed different diets.
Results: After clean-up of high-throughput deep sequencing reads, 699,991 and 555,031 high-quality reads allowed de novo assembly of liver and skeletal muscle sequences, respectively (average length: 374 and 441 bp; total megabases: 262 and 245 Mbp). An additional incremental assembly was completed by integrating data from both tissues (hybrid assembly). Assembly of hybrid, liver and skeletal muscle transcriptomes yielded, respectively, 19,530, 11,545 and 10,599 isotigs (average length: 1330, 1208 and 1390 bp, respectively) that were grouped into 15,954, 10,033 and 9189 isogroups. Following annotation, hybrid transcriptomic data were used to construct an
oligonucleotide microarray to analyse nutritional regulation of the expression of 129 genes involved in OXPHOS in S. aurata. Starvation upregulated cytochrome c oxidase components and other key OXPHOS genes in the liver, which exhibited higher sensitive to food deprivation than the skeletal muscle. However, diet composition affected OXPHOS in the skeletal muscle to a greater extent than in the liver: most of genes upregulated under starvation presented higher expression among fish fed a high carbohydrate/low protein diet.
Conclusions: Our findings indicate that the expression of coenzyme Q-binding protein (COQ10), cytochrome c oxidase subunit 6A2 (COX6A2) and ADP/ATP translocase 3 (SLC25A6) in the liver, and cytochrome c oxidase subunit 5B isoform 1 (COX5B1) in the liver and the skeletal muscle, are sensitive markers of the nutritional condition that may be relevant to assess the effect of changes in the feeding regime and diet composition on fish farming. Keywords: Transcriptome, Microarray, Starvation, Diet composition, Oxidative phosphorylation, Sparus aurata
* Correspondence:[email protected]
†Equal contributors
1Secció de Bioquímica i Biologia Molecular, Departament de Bioquímica i Fisiologia, Facultat de Farmàcia i Ciències de l’Alimentació, Universitat de Barcelona, Joan XXIII 27-31, 08028 Barcelona, Spain
Full list of author information is available at the end of the article
© The Author(s). 2017 Open Access This article is distributed under the terms of the Creative Commons Attribution 4.0 International License (http://creativecommons.org/licenses/by/4.0/), which permits unrestricted use, distribution, and reproduction in any medium, provided you give appropriate credit to the original author(s) and the source, provide a link to the Creative Commons license, and indicate if changes were made. The Creative Commons Public Domain Dedication waiver (http://creativecommons.org/publicdomain/zero/1.0/) applies to the data made available in this article, unless otherwise stated.
Background
A major advantage of next-generation sequencing (NGS) technology is the ability to provide a huge amount of gene expression data due to its high throughput [1–3]. Among NGS approaches, massive 454 sequencing has become a feasible method for increasing sequencing depth and coverage. Following the pyrosequencing method [4], sequencing error levels in the 454 platform are low (< 1%), arising primarily because of homopoly-mer runs, but these errors tend to be resolved with suffi-cient coverage depth to allow assembly of overlapping reads. Expressed sequence tag (EST) projects in fish started in the late 90s with the model species zebrafish, Danio rerio[5, 6] and medaka, Oryzias latipes [7]. More recently, transcriptomic analyses have been developed for fish species of interest in aquaculture such as Atlan-tic cod, Gadus morhua [8–10], AtlanAtlan-tic salmon, Salmo salar [11, 12], common carp, Cyprinus carpio [13], rain-bow trout, Oncorhynchus mykiss [14], Senegalese sole, Solea senegalensis, and common sole, Solea solea [15], and gilthead sea bream larvae, Sparus aurata [16–18], among others. S. aurata is the most cultured marine fish in Europe, accounting for 46% of total aquaculture pro-duction of marine fish in 2015 [19]. Despite the com-mercial interest of S. aurata production, currently available transcriptomic data for S. aurata provide par-tial information and limited support to identify genes of potential biotechnological interest in nutritional studies. Remarkable efforts to obtain transcriptomic data from S. auratajuveniles have been carried out by Calduch-Giner et al. [20] through sequencing 454 normalised libraries of skeletal muscle, intestine, blood and head kidney (prior and post exposure to infection with the myxos-porean parasite Enteromyxum leei) RNA samples of S. auratafed with commercial diets, combined with previ-ous data obtained from animals exposed to confinement stress, parasite infection and nutritional stress by essen-tial fatty acid deficiency. The authors yielded 125,263 unique sequences with an average length of 727 bp en-coding for 21,384 gene descriptions. Assembled contigs ranged from 7808 to 14,008 depending on the tissue li-brary. Additional contributions were performed by Gar-cia de la Serrana et al. [21], who analysed the skeletal muscle transcriptome of fish fed a commercial diet and submitted to short-term fasting at various rearing tem-peratures; Vieira et al. [22], who analysed the skeleton transcriptome by sequencing RNA samples from verte-brae and gill arches; and Sarropoulou et al. [18], who se-quenced brain samples of S. aurata submitted to early-life events during the larval phase. To our knowledge, no tissues from S. aurata kept under different nutri-tional conditions such as long-term starvation and par-tial substitution of dietary protein by carbohydrates and lipids have been included for the generation of cDNA
libraries and sequencing of ESTs collections using NGS. Therefore, current publicly available data for S. aurata is most likely to underrepresent genes involved in meta-bolic adaptation to long-term starvation and changes in the composition of dietary nutrients.
Oxidative phosphorylation (OXPHOS) is essential for transferring energy from substrate oxidation to ATP pro-duction in mitochondria, providing approximately 90% of the cellular energy. The OXPHOS system comprises com-plexes I to IV of the respiratory electron transport chain, which generates an electrochemical proton gradient by pumping protons across the inner mitochondrial mem-brane with the aid of ubiquinone (CoQ) and cytochrome c as mobile electron carriers, and the reversible proton pump F1F0-ATP synthase (complex V), which couples proton re-flux into the mitochondrial matrix to generate ATP from ADP and phosphate. Cytochrome c oxidase (or complex IV) catalyses the terminal step of the electron transport chain (reduction of molecular oxygen to water), which is thought to be the rate-limiting reaction of the pathway [23, 24]. Starvation increases the rate of oxygen consumption at about 20% in the rat liver [25], and enhances cyto-chrome c oxidase activity in the liver of mice [26]. Starva-tion increases OXPHOS activity in the liver of mice by stimulating the transcription and efficiency of OXPHOS genes in a process triggered by glucagon/cAMP signalling [27]. Similarly, starvation impairs the glycolytic flux, re-duces the ATP/AMP ratio and significantly enhances the activity of cytochrome c oxidase in human fibroblasts [28]. Indeed, the ATP/ADP ratio is considered a major regulator of the phosphorylation status and activity of cytochrome c oxidase [24]. In fish, knowledge of the effect of starvation on the OXPHOS pathway remains limited. In a recent re-port, Bermejo-Nogales et al. [29] reported the effect of 10 days of starvation on the expression of 88 genes of the OXPHOS pathway in the liver, white skeletal muscle and cardiac muscle of S. aurata juveniles. In contrast to previ-ous observations in mammals, 10 days of starvation down-regulated most of OXPHOS genes in the liver of food-deprived fish, while upregulated the expression of some OXPHOS genes in the white skeletal muscle and cardiac muscle.
Little is currently known about the effect of macronu-trient composition of the diet on the expression of OXPHOS genes. Accumulating evidence indicates that high-fat diets decrease the expression, activity and assembly of the five OXPHOS complexes in the liver and skeletal muscle of mice [30–32], and partial substi-tution of dietary protein and fat by starch significantly increases mRNA levels of OXPHOS markers such as ubiquinol-cytochrome c reductase subunit 2 (UCR2) and cytochrome c oxidase subunit 4 (COX4) in the liver of rainbow trout (Oncorhynchus mykiss), although with ex-pression changes <2-fold in both cases [33].
The aim of the present study was to perform massive 454 sequencing of liver and white skeletal muscle cDNA libraries from S. aurata juveniles submitted to different nutritional conditions (long-term starvation and feeding diets differing in nutrient composition) in order to pro-vide a deep-coverage RNA sequencing data for develop-ing nutritional studies in fish. The resultdevelop-ing database was used to design an oligonucleotide microarray and analyse the effect of nutritional status and diet compos-ition on the expression of genes involved in OXPHOS in S. aurata.
Methods
Animals, feeding trial, sampling and growth performance
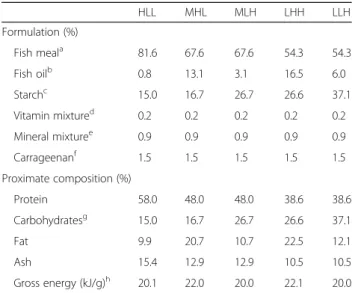
Gilthead sea bream (S. aurata) juveniles were obtained from Piscimar (Burriana, Castellón, Spain), transported to the laboratory, and distributed into 260 L aquaria maintained at 21 °C and supplied with running seawater in a closed system with active pump filter and UV lamps. The photoperiod was adjusted to a 12 h: 12 h dark-light cycle. Acclimation to our facilities and maintenance pro-cedures were as previously described [34]. Previous to sampling and to maximise representation and diversity of transcripts of nutritional interest in the cDNA librar-ies used for 454-pyrosequencing, fish were submitted to six different nutritional conditions. Five groups of fish were fed at a ration of 25 g/kg body weight once a day (10 a.m.) for 23 days with diets that were formulated to cover a range of macronutrients above and below the levels in commercially available diets. Nutrient compos-ition was adjusted to achieve similar energy levels (20 to 22 kJ/g). Diets were named HLL, MHL, MLH, LHH and LLH, where the first, second and third letters indicate the levels of protein, lipids and carbohydrates, respect-ively (H: high; M: medium; L: low). The composition of the experimental diets is shown in Table 1. A sixth group of fish was deprived of food during the same period of time. To prevent stress during tissue sampling, fish were anesthetised with MS-222 (1:12,500) before handling (9:30 a.m.) and killed by cervical section. Blood was collected and tissue samples (liver and white skeletal muscle extracted from the middle/dorsal region) were dissected out, immediately frozen in liquid N2, and kept
at −80 °C until use. Specific growth rate (SGR, %/day) was calculated according to the following expression: SGR = (ln Wf − ln Wi) * 100/T, where Wf and Wi are final and initial weight in grams, respectively, and T is time in days.
RNA extraction, cDNA library construction, normalisation and 454 sequencing
Total RNA was extracted from 30 mg of liver or white skeletal muscle using the RNeasy tissue and RNeasy fibrous tissue, respectively, mini kits (Qiagen,
Hilden, Germany) according to the manufacturer’s in-structions. RNA concentration and purity was deter-mined spectrophotometrically at 260/280 nm using Nanodrop ND-1000 (Thermo Fischer Scientific, Wal-tham, MA, USA). RNA integrity was determined with an Agilent 2100 bioanalyzer (Agilent Technologies, Santa Clara, CA, USA). Only samples with RNA Integrity Number (RIN) > 9.2 were used for subse-quent studies. Pools consisting of 1 μg of total RNA isolated from 6 individuals per condition (fasting and feeding with diets HLL, MHL, MLH, LHH and LLH; 36 fish and RNA samples in total) were used to con-struct liver and white skeletal muscle cDNA libraries. The dsDNA synthesis was performed using a MINT-Universal cDNA synthesis kit (Evrogen, Moscow, Russia). To increase the presence of rare transcripts, the cDNAs libraries were normalised using TRIM-MER cDNA normalization kit (Evrogen, Moscow, Russia) following manufacturer’s instructions. Sequen-cing of cDNAs libraries was performed using a GS FLX 454 platform (Roche, Basel, Switzerland) at the CCiTUB of the Universitat de Barcelona (Barcelona, Spain).
Table 1 Composition of the diets supplied in this study to S. aurata HLL MHL MLH LHH LLH Formulation (%) Fish meala 81.6 67.6 67.6 54.3 54.3 Fish oilb 0.8 13.1 3.1 16.5 6.0 Starchc 15.0 16.7 26.7 26.6 37.1 Vitamin mixtured 0.2 0.2 0.2 0.2 0.2 Mineral mixturee 0.9 0.9 0.9 0.9 0.9 Carrageenanf 1.5 1.5 1.5 1.5 1.5 Proximate composition (%) Protein 58.0 48.0 48.0 38.6 38.6 Carbohydratesg 15.0 16.7 26.7 26.6 37.1 Fat 9.9 20.7 10.7 22.5 12.1 Ash 15.4 12.9 12.9 10.5 10.5 Gross energy (kJ/g)h 20.1 22.0 20.0 22.1 20.0 a
Corpesca S.A. Super-Prime fish meal (Santiago de Chile, Chile)
b
Fish oil from A.F.A.M.S.A. (Vigo, Spain)
c
Pregelatinised corn starch from Brenntag Química S.A. (St. Andreu de la Barca, Barcelona, Spain)
d
Vitamin mixture provided (mg/Kg): choline chloride, 1200; myo-inositol, 400; ascorbic acid, 200; nicotinic acid, 70; all-rac-tocopherol acetate, 60; calcium pantothenate, 30; riboflavin, 15; piridoxin, 10; folic acid, 10; menadione, 10; thiamin-HCl, 8; all-trans retinol, 2; biotin, 0,7 cholecalciferol, 0.05; cyanocobalamin, 0.05
e
Mineral mixture provided (mg/Kg): CaHPO4.2H2O, 7340; MgO, 800; KCl, 750;
FeSO4.7H2O, 60; ZnO, 30; MnO2, 15; CuSO4.5H2O, 1.7; CoCl2.6H2O, 1.5; KI, 1.5;
Na2SeO3, 0.3 f
Iota carrageenan (Sigma-Aldrich)
g
Carbohydrates were calculated by difference
h
Calculated from gross composition (protein 24 kJ/g, lipids 39 kJ/g, carbohydrates 17 kJ/g)
Transcriptome assembly and annotation
Pre-processing of raw reads to remove low quality bases, primers and adapters and quality control were per-formed using Cutadapt [35], Prinseq [36] and FastQC (Babraham Bioinformatics, Cambridge, UK). The reads were de novo assembled using the GSAssembler soft-ware (Roche, Basel, Switzerland). Three assemblies were performed: one for sequence data from liver, another for white skeletal muscle, and an incremental assembly using both liver and white skeletal muscle data (hybrid assembly). Gene annotation of unique sequences for the three assemblies was performed with local BLASTx and BLASTn searches against non-redundant protein and nucleotide sequence databases of the NCBI’s QBLAST using GPRO software [37] with a significant threshold of E-value <1e-4. Gene names and putative functions were assigned to each sequence based on the highest align-ment score among BLAST best 10 matches. GPRO soft-ware was also used to perform functional analysis by mapping annotated unique sequences to the Gene Ontology (GO) database. The number of sequences as-sociated to GO terms was calculated under the categor-ies of biological process, molecular function and cellular component.
Microarray design, hybridization and data analysis
An Agilent custom high-density oligonucleotide micro-array (8 × 60 k; ID 079501; Agilent Technologies, Santa Clara, CA, USA) was designed to contain 2 different 60-mer probes for each of the 25,392 assembled unique se-quences present in the S. aurata hybrid transcriptome. Labelling, hybridisation and scanning were performed using the Two-Color Microarray-Based Gene Expression Analysis v. 6.5 protocol (Agilent Technologies, Santa Clara, CA, USA) according to the manufacturer’s in-structions. The microarray analysis was performed using total RNA isolated from liver and skeletal muscle from four fish per condition (starved fish and fish fed diets HLL, MHL and LLH). Briefly, for each sample 200 ng of total RNA was labelled with Cy3 or Cy5 using Low Input Quick Amp Labeling Kit. The Two-Color and RNA Spike-In Kit, Two-Colorwas used to monitor microarray workflow for linearity, sensitivity and accuracy. Labelled cRNA was purified with the RNeasy Mini Kit (Qiagen, Hilden, Germany) and quantified using a NanoDrop spectrophotometer (Thermo Scientific, Waltham, MA, USA). After assessing successful dye incorporation and sample integrity, 2.5 μg of each labelled sample was hybridised to the custom-made oligo-microarray at 65 ° C for 17 h following Gene Expression Hybridization Kit instructions. A double loop hybridisation with dye swap experimental design was adopted with n = 4 fish per condition (starvation and feeding with diets HLL, MHL and LLH) and a total of 16 hybridisations (8 per tissue)
[38]. Scanning was performed using an Agilent Micro-array ScannerG2565BA. Outlier spots and spot intensity for Cy3 and Cy5 channels were extracted using Agilent Feature Extraction software version 10.7. Loess and Aquantile normalisation for within-and inter-array nor-malisation, respectively, was applied using the R-Bioconductor package [39, 40]. Data analysis was only considered for transcriptomic annotations of OXPHOS genes with E-value <1e-10 and HSP/hit >30. A linear model analysis using Limma [41] was conducted to se-lect differentially expressed genes between conditions.
Quantitative real-time RT-PCR
One microgram of total RNA isolated from liver or white skeletal muscle of S. aurata was reverse-transcribed to cDNA using Moloney murine leukemia virus RT (Life Technologies, Carlsbad, CA, USA) for 1 h at 37 °C in the presence of random hexamer primers. The cDNA product was used for subsequent quantitative real-time PCR (qPCR). The mRNA levels of S. aurata NADH dehydro-genase [ubiquinone] 1 beta subcomplex subunit 8 (NDUFB8), NADH ubiquinone oxidoreductase 75 kDa subunit (NDUFS1), coenzyme Q-binding protein COQ10 (COQ10), cytochrome b-c1 complex subunit 10 isoform A (UQCR11A), cytochrome c oxidase subunit 5B isoform 1 (COX5B1), cytochrome c oxidase subunit 6A2 (COX6A2), ATP synthase subunit beta (ATP5B) and ADP/ATP translocase 3 (SLC25A6), were determined in a StepOnePlus Real-Time PCR System (Applied Biosystems, Foster City, CA, USA) using 0.4μM of each primer, 10 μl of SYBR Green (Applied Biosystems Foster City, CA, USA), and 1.6μl of the diluted cDNA product in a final volume of 18μl. Primers to perform qPCR analysis of the genes of interest (Table 2) were designed from sequence data obtained in the transcriptomic analysis after filtering for E-value <1e-10 and HSP/hit >30. To validate the amp-lification efficiency of primers, standard curves with con-secutive dilutions of a cDNA test sample were generated, and PCR products were separated electrophoretically on 2% agarose gel for band size confirmation. 18S ribosomal RNA (18S) and elongation factor 1 alpha (EF1α) were selected to normalise the amount of mRNA for the genes of interest in each sample using primer pairs shown in Table 2. Variations in gene expression were calculated by the standardΔΔCt method.
Statistics
Data obtained by performing qPCR were analysed by one-way ANOVA using the SPSS software Version 22 (IBM, Armonk, NY, USA) and are represented as mean ± standard deviation. When statistical significance was found for ANOVA, the Student-Newman-Keuls post hoc test was used to determine differences among treatments.
Results
454 pyrosequencing and assembly
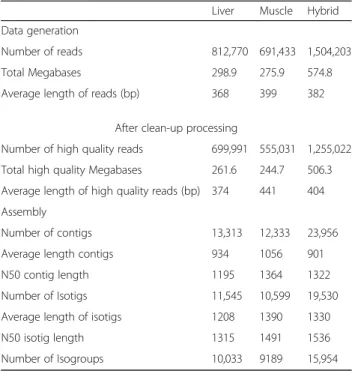
To obtain a deep-coverage database useful for develop-ing nutritional studies in S. aurata, total RNA pools were made from the liver and skeletal muscle of 23-day starved fish or fish fed with five different diets for the same time period. The experimental diet HLL (High protein, Low lipids, Low carbohydrates) has a macronu-trient composition similar to the diet of wild S. aurata. The other diets presented partial substitution of protein by lipids and/or carbohydrates. Liver and white skeletal muscle cDNA libraries were constructed, normalised to increase the presence of rare transcripts, and subse-quently sequenced using the 454 FLX technology. Two sequencing runs of liver and skeletal muscle libraries yielded 812,770 and 691,433 reads, respectively. After clean-up and removal of primers and adapter sequences, sequencing of liver and white skeletal muscle libraries generated 699,991 and 555,031 high-quality reads with an average length of 374 and 441 bp and a total of 262 and 245 Mbp sequence data, respectively. Three assem-blies were performed: liver, white skeletal muscle and an incremental assembly by integrating data from liver and white skeletal muscle (hybrid transcriptome). A sum-mary of the 454 assemblies is listed in Table 3. Unique reads represented 96.8 and 96.4% of total reads of liver
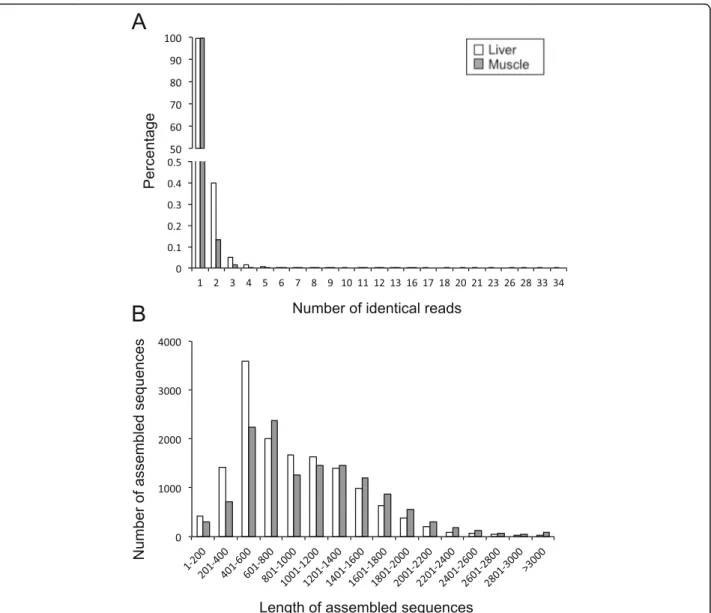
and skeletal muscle sequencing results, respectively (Fig. 1a). Assembly of the hybrid transcriptome was per-formed by aligning 1,119,088 reads (89.2% of high qual-ity reads), which generated 23,956 contigs with average and N50 lengths of 901 bp and 1322 bp, respectively, and 102,569 singletons. Contigs were grouped into 19,530 isotigs with average and N50 lengths of 1330 and 1536 bp, respectively, and isotigs were further grouped into 15,954 isogroups. For the liver and skeletal muscle, aligned reads (88.6% and 91.2% of high quality reads, re-spectively) generated 13,313 and 12,333 contigs with an average length of 934 bp (N50 = 1195 bp) and 1056 bp (N50 = 1364 bp), and 43,460 and 30,302 singletons, re-spectively. The number of isotigs constructed was 11,545 with average and N50 lengths of 1208 bp and 1315 bp, respectively, for the liver, and 10,599 isotigs with average and N50 lengths of 1390 bp and 1491 bp, respectively, for the skeletal muscle. Isogroups in the liver and skeletal muscle transcriptomes were 10,033 and 9189, respectively (Table 3). Length distribution of assembled unique sequences is shown in Fig. 1b. Liver and white skeletal muscle transcriptomes presented 76.1 and 86.4% of unique sequences above 500 bp.
Annotation and gene ontology
In the present study, 64.3%, 73.9% and 83.1% unique se-quences of liver, skeletal muscle and hybrid transcrip-tomes, respectively, were annotated using BLASTx and BLASTn against the NCBI non-redundant protein and nucleotide collection database. To categorise gene prod-ucts, 6162, 5581 and 4793 unique sequences of liver,
Table 2 Primers used to analyse gene expression by qPCR
Gene Accession
no. (GenBank) Name of primer
Sequence (5′ to 3′)
NDUFB8 MF438220 JA1511 ATATCCCGACAAAGGCGAGGGC
NDUFB8 JA1512 AGGTCAGGGTGGTCCCACTTGT
NDUFS1 MF438168 ASA205F ACCATTGCTCAGAACGCCAGAAC
NDUFS1 ASA205R GGCTTTCTTTAGGCAGGTCAGCT
COQ10 MF438156 JA1505 CCAGCAAAACGACTCCACTCCTC
COQ10 JA1506 CCCACAGGAGCCCAAGTTTCT
UQCR11A MF438251 JA1509 TATTCTGAGGGCGTGGGTGC
UQCR11A JA1510 TCGAGAAATAAGCGCCAGTCTGT
COX5B1 MF438221 JA1513 CCTTCCTGCGGTTCCCACTA
COX5B1 JA1514 CATGAAGGAGGCAAATATGAATGC
COX6A2 MF438235 JS1703 GGGTTCGTGTGAGGGTTGTGG
COX6A2 JS1704 CATCCCTGGTGTTACTGTCTGC
ATP5B MF438166 JA1507 GGGCAGGGTCAGTCAAATCGTCAG
ATP5B JA1508 CAACATCTTCCGCTTCACACAGGCT
SLC25A6 MF438196 JA1503 CTGTGTTTCGTCTACCCCCTCG
SLC25A6 JA1504 CTTCACCAAACAGTCTCCCAGGC
18S AM490061 JDRT18S TTACGCCCATGTTGTCCTGAG
18S DTRT18AS AGGATTCTGCATGATGGTCACC
EF1α AF184170 AS-EF1Fw CCCGCCTCTGTTGCCTTCG
EF1α AS-EF1Rv CAGCAGTGTGGTTCCGTTAGC
Table 3 Summary statistics of 454 sequencing and assembly
Liver Muscle Hybrid
Data generation
Number of reads 812,770 691,433 1,504,203
Total Megabases 298.9 275.9 574.8
Average length of reads (bp) 368 399 382
After clean-up processing
Number of high quality reads 699,991 555,031 1,255,022
Total high quality Megabases 261.6 244.7 506.3
Average length of high quality reads (bp) 374 441 404 Assembly
Number of contigs 13,313 12,333 23,956
Average length contigs 934 1056 901
N50 contig length 1195 1364 1322
Number of Isotigs 11,545 10,599 19,530
Average length of isotigs 1208 1390 1330
N50 isotig length 1315 1491 1536
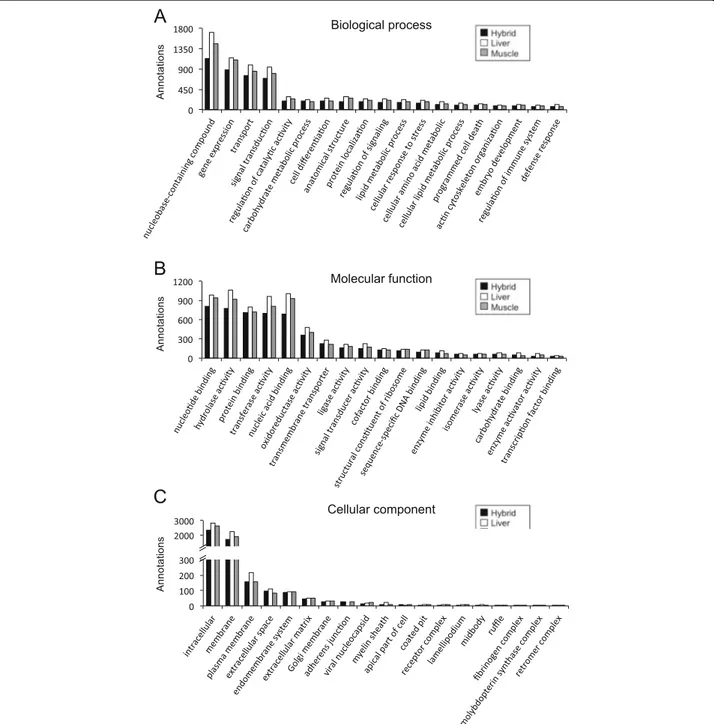
skeletal muscle and hybrid transcriptomes, respectively, were annotated with specific GO terms. Figure 2 sum-marises GO terms for the assembled transcriptomes at fourth level for the categories of biological process and cellular components, and at third level for molecular function GO terms. GO terms distribution was similar for the liver, skeletal muscle and hybrid transcriptomes. Terms describing biological process were most abundant for nucleobase-containing compound metabolic process (GO:0006139; 17–19%), gene expression (GO:0010467; 13–14%), transport (GO:0006810; 11–12%), and signal transduction (GO:0007165; 10–11%) (Fig. 2a). GO terms describing molecular function were highest for nucleo-tide binding (GO:0000166; 12–14%), hydrolase activity (GO:0016787; 13%), protein binding (GO:0005515; 10–
12%), transferase activity (GO:0016740; 12%), and nu-cleic acid binding (GO:0003676; 11–13%) (Fig. 2b). Most abundant GO terms describing the results for cellular components were intracellular (GO:0005622; 50–52%), membrane (GO:0016020; 37–39%), plasma membrane (GO:0005886; 3–4%), extracellular space (GO:0005615; 2%), and endomembrane system (GO:0012505; 2%) (Fig. 2c).
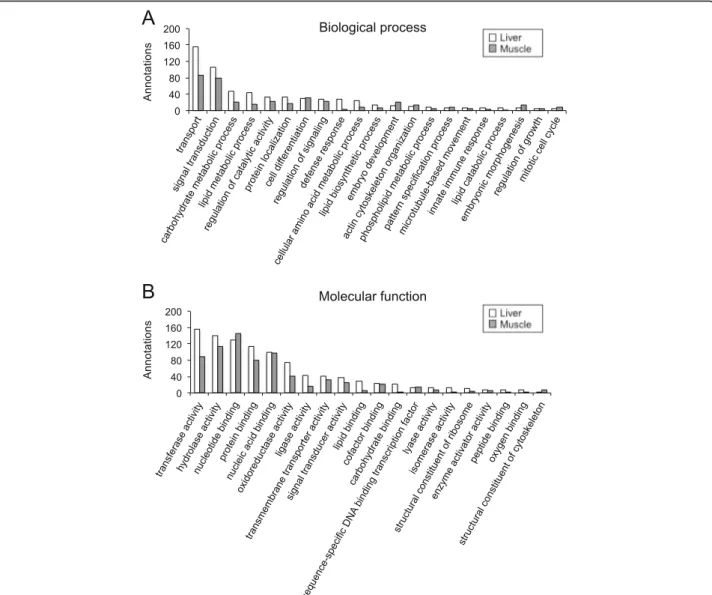
GO analysis was also conducted on annotated se-quences that were exclusively present either in the liver transcriptome (2457 sequences out of 19,494) or in the skeletal muscle transcriptome (2174 sequences out of 17,935). GO terms in the categories of biological process (level 4) and molecular function (level 3) are shown in Fig. 3. The more remarkable biological process GO
Fig. 1 Characteristics of 454-pyrosequencing reads and unique sequences for S. aurata liver and skeletal muscle transcriptomes. a Frequency dis-tribution of identical 454-pyrosequencing reads of liver and skeletal muscle samples. b Average length disdis-tribution of assembled unique se-quences of liver and skeletal muscle transcriptomes
terms showing different percentage of annotated se-quences in liver versus skeletal muscle were transport (GO:0006810; 23.6 vs. 20.7%), carbohydrate metabolic process (GO:0005975; 7.1 vs. 5.0%), lipid metabolic process (GO:0006629; 6.5 vs. 3.8%), defense response (GO:0006952; 4.1 vs. 0.7%), cellular amino acid meta-bolic process (GO:0006520; 3.6 vs. 2.1%), cell differenti-ation (GO:0030154; 4.5 vs. 7.6%), embryo development (GO:0009790; 1.7 vs. 4.8%), actin cytoskeleton organisa-tion (GO:0030036; 1.5 vs. 3.1%), pattern specificaorganisa-tion
process (GO:0007389; 1.1 vs. 2.1%), embryonic morpho-genesis (GO:0048598; 0.9 vs. 3.1%), and mitotic cell cycle (GO:0000278; 0.6 vs. 1.9%). With regard to molecular function, GO terms with different percentage of anno-tated sequences in liver and skeletal muscle included transferase activity (GO:0016740; 15.8 vs. 12.3%), oxido-reductase activity (GO:0016491; 7.5 vs. 5.7%), ligase ac-tivity (GO:0016874; 4.3 vs. 2.3%), lipid binding (GO:0008289; 2.8 vs. 0.7%), carbohydrate binding (GO:0030246; 2.1 vs. 0.3%), nucleotide binding
Fig. 2 Functional gene ontology classification of S. aurata liver, skeletal muscle and hybrid transcriptomes. The 4th level of GO terms was used for biological process (a), the 3rd level for molecular function (b), and the 4th level for cellular component (c)
(GO:0000166; 13.0 vs. 20.0%), and nucleic acid binding (GO:0003676; 9.9 vs. 13.4%).
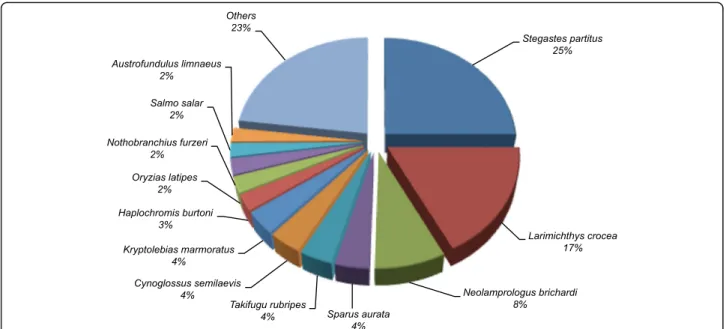
A BLAST top-hit species distribution of gene annota-tions in the hybrid S. aurata transcriptome showed the highest homology with NCBI non-redundant database sequences from Stegastes partitus (23.5%), followed by Larimichthys crocea (16.3%), Neolamprologus brichardi (7.5%), Sparus aurata (3.6%), Takifugu rubripes (3.5%), Cynoglossus semilaevis(3.5%) and Kryptolebias marmor-atus(3.4%) (Fig. 4).
Microarray and gene expression analysis
With the aim of identifying new biomarkers related to OXPHOS of interest for nutritional studies in S. aurata, we used the obtained transcriptomic data for designing an oligonucleotide microarray to further analyse changes in gene expression due to long-term starvation or
feeding diets differing in macronutrient composition. To this end, three groups of fish were fed 23 days on diets HLL (High protein, Low lipids, Low carbohydrates; with a macronutrient composition similar to the diet of wild S. aurata), MHL (Medium protein, High lipids, Low car-bohydrates; with a composition similar to commercial diets for S. aurata culture) and LLH (Low protein, Low lipids, High carbohydrates; with partial substitution of protein by carbohydrate compared to the HLL diet). A fourth group of fish was deprived of food for the same period. Growth performance of starved fish and fish fed diets HLL, MHL and LLH, expressed as mean SGR (%/day) ± SD, was −0.89a ± 0.54, 2.54c ± 0.21, 2.07bc ± 0.33, and 1.43b ± 0.51, respectively (different superscript letters indicate significant differences, p< 0.05; n = 3 groups of 8 fish each). The expression of a total of 129 genes involved in mitochondrial
Fig. 3 Functional gene ontology classification of annotations exclusively present in the liver and the skeletal muscle. The 4th of GO terms was used for biological process (a), and the 3rd level for molecular function (b)
respiratory chain, oxidative phosphorylation and ATP translocation across the mitochondrial inner membrane were analysed in the liver and skeletal muscle of S. aur-ata(Additional file 1). Despite recent efforts to increase transcriptomic data concerning genes involved in the OXPHOS pathway in S. aurata [29], 38 out of 129 genes analysed in the present study are newly described genes for S. aurata that have not been previously reported in public databases. Long-term starvation deeply affected the expression of an important part of analysed genes. Considering statistical significance with an adjusted P value <0.05, 24–38 genes (depending on the diet sup-plied) out of 129 were significantly upregulated in the liver of starved fish, while food restriction downregu-lated 10–14 genes. Differentially expressed genes in the liver included 8 upregulated and 5 downregulated sub-units out of 42 genes associated to NADH:ubiquinone oxidoreductase (complex I of the electron transfer chain), 1 upregulated and 2 downregulated subunits out of 7 from succinate dehydrogenase (complex II), 4 up-regulated subunits out of 14 from ubiquinol-cytochrome c reductase (complex III), 15 upregulated and 4 down-regulated subunits out of 34 from cytochrome c oxidase (complex IV), 5 upregulated and 2 downregulated sub-units out of 19 from F1F0-ATP synthase (OXPHOS complex V), and 2 upregulated genes out of 3 ADP/ATP translocases (Additional file 2). Food deprivation resulted in 17–40 upregulated and 21–28 downregulated OXPHOS genes in the skeletal muscle (Additional file 3).
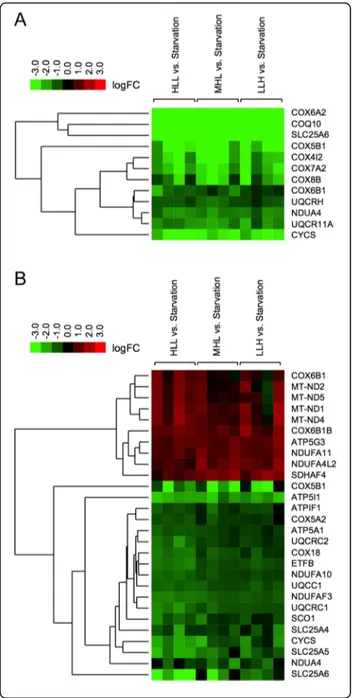
Figure 5 shows a heat map hierarchical clustering of differentially expressed genes (fish fed with diets HLL, MHL or LLH versus starved fish) with an adjusted P value <0.05 and with a difference of at least 2-fold in the
normalised intensity ratio (Cy5/Cy3 or Cy3/Cy5) for one or more feeding conditions. With a fold change greater than 2, all differentially expressed genes were upregu-lated by starvation in the liver of S. aurata, and 6 genes corresponded to cytochrome c oxidase subunits (COX6A2, COX5B1, COX4I2, COX7A2, COX8B and COX6B1). Indeed, 4 cytochrome c oxidase components (COX6A2, COX5B1, COX4I2 and COX7A2) showed a fold change greater than 4 regardless of the diet supplied (fold change ranging from 4.9 to 86.7). In addition to cytochrome c oxidase subunits, SLC25A6 and COQ10 were also found among upregulated genes with greater fold change expression in the liver of starved fish (SLC25A6: 44.9 to 60.1 fold change depending on the diet supplied; and COQ10: 14.4 to 19.6 fold change). In contrast, starvation resulted in both upregulated and downregulated genes, 18 and 10 respectively, with a fold change greater than 2 in the skeletal muscle. The magni-tude of expressional changes due to starvation was lower in the skeletal muscle than in the liver. No genes in the skeletal muscle showed a fold change greater than 4 when compared starved fish versus fish fed diets HLL, MHL and LLH. Remarkably, diet composition affected the expression of OXPHOS genes in the skeletal muscle to a greater extent than in the liver. As a general trend, fish fed LLH exhibited higher mRNA levels than fish fed HLL for the majority of significantly upregulated genes in the skeletal muscle of starved fish (Additional file 3).
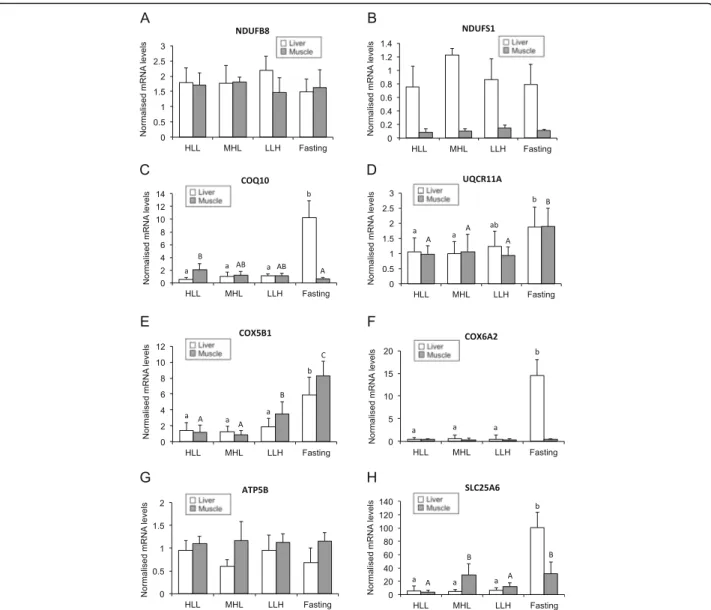
To validate microarray data, the mRNA levels of sev-eral genes involved in OXPHOS were determined by RT-qPCR in liver and skeletal muscle samples from S. aurata submitted to long-term starvation or fed diets differing in macronutrient composition. The mRNA
abundance of eigth genes involved in mitochondrial electron transfer chain (NDUFB8, NDUFS1, COQ10, UQCR11A, COX5B1 and COX6A2), ATP synthesis (ATP5B) and ADP/ATP translocation (SLC25A6) were analysed. The mRNA levels of NDUFB8 and NDUFS1, components of NADH:ubiquinone oxidoreductase, were not affected by the nutritional condition in the liver and the skeletal muscle. (Fig. 6a and b). The expression of COQ10, a protein required for coenzyme Q activity in the electron transport chain [42], was also determined in tissue samples of treated fish. In the liver, COQ10 mRNA significantly increased after starvation, reaching values 17-fold higher than fish fed diet HLL, and 9.3 and 10.2-fold higher than fish fed diets LLH and MHL, re-spectively. A different regulation of COQ10 expression was observed in the skeletal muscle by the nutritional condition: a significant 3-fold decrease was found in starved fish compared to those fed a high protein/low carbohydrate diet (HLL) (Fig. 6c).
Fig. 5 Heat map image of differentially transcribed genes involved in OXPHOS. Three groups of fish were fed 23 days at a daily ration of 25 g/kg body weight with diets HLL, MHL or LLH. A fourth group of animals was fasted for the same period. Hierarchical clustering of differentially expressed genes in the liver a and the skeletal muscle b is represented from microarray data obtained from tissue samples of S. aurata fed with diets HLL, MHL or LLH versus starved fish) with an adjusted P value <0.05 and a difference of at least 2-fold in the normalised intensity ratio (Cy5/Cy3 or Cy3/Cy5) for one or more diet-ary conditions. Results are presented as logFC mean value (n = 4 fish); logFC is the log2 transformed fold change. Green colour de-notes downregulated genes and red colour upregulated genes in fed animals. ATP synthase subunit alpha (ATP5A1), ATP synthase F(0) complex subunit C3 (ATP5G3), ATP synthase subunit e isoform 1 (ATP5I1), ATPase inhibitor (ATPIF1), coenzyme Q-binding protein COQ10 (COQ10), cytochrome c oxidase subunit 4 isoform 2 (COX4I2), cytochrome c oxidase subunit 5A isoform 2 (COX5A2), cytochrome c oxidase subunit 6A2 (COX6A2), cytochrome c oxidase subunit 7A2 (COX7A2), cytochrome c oxidase subunit 5B isoform 1 (COX5B1), cytochrome c oxidase subunit 6B1 (COX6B1), cytochrome c oxidase subunit 6B isoform 1B (COX6B1B), cytochrome c oxidase subunit 8B (COX8B), mitochondrial inner membrane protein COX18 (COX18), cytochrome c (CYCS), electron transfer flavoprotein subunit beta (ETFB), ubiquinone oxidoreductase chain 1 (MT-ND1), NADH-ubiquinone oxidoreductase chain 2 (MT-ND2), NADH-NADH-ubiquinone ox-idoreductase chain 4 (MT-ND4), NADH-ubiquinone oxox-idoreductase chain 5 (MT-ND5), NADH dehydrogenase [ubiquinone] 1 alpha sub-complex subunit 4 (NDUFA4), NADH dehydrogenase [ubiquinone] 1 alpha subcomplex subunit 4-like 2 (NDUFA4L2), NADH dehydrogen-ase [ubiquinone] 1 alpha subcomplex subunit 10 (NDUFA10), NADH dehydrogenase [ubiquinone] 1 alpha subcomplex subunit 11 (NDUFA11), NADH dehydrogenase [ubiquinone] 1 alpha subcomplex assembly factor 3 (NDUFAF3), protein SCO1 homolog (SCO1), succin-ate dehydrogenase assembly factor 4 (SDHAF4), ADP/ATP translo-case 1 (SLC25A4), ADP/ATP translotranslo-case 2 (SLC25A5), ADP/ATP translocase 3 (SLC25A6), ubiquinol-cytochrome-c reductase complex assembly factor 1 (UQCC1), cytochrome b-c1 complex subunit 10 isoform A (UQCR11A), cytochrome b-c1 complex subunit 1 (UQCRC1), cytochrome b-c1 complex subunit 2 (UQCRC2), cyto-chrome b-c1 complex subunit 6 (UQCRH)
The mRNA abundance of UQCR11A and COX5B1, components of ubiquinol-cytochrome c reductase and cytochrome c oxidase, respectively, of the respiratory chain, showed a similar behaviour as a result of starva-tion or feeding different diets. Starvastarva-tion significantly in-creased the expression of both proteins in the liver (UQCR11A: 1.8 and 1.9-fold compared to fish fed HLL and MHL, respectively; and COX5B1: 3.2 to 4.5-fold compared to fed fish regardless of the diet) and the skel-etal muscle (1.8 to 2.0-fold for UQCR11A and 2.4 to 9.2-fold for COX5B1 compared to fed fish regardless of the diet). Diet composition did not affect UQCR11A ex-pression, while COX5B1 mRNA levels significantly increased 2.9 and 3.9-fold in the skeletal muscle of fish
fed diet LLH compared to those fed HLL and MHL, re-spectively (Fig. 6d and e).
Another component of cytochrome c oxidase, COX6A2, was also greatly affected by food deprivation in the liver. Starvation significantly increased the hepatic mRNA levels of COX6A2 23.1 to 34.6-fold, depending on the diet sup-plied. In contrast, COX6A2 expression was not affected by the nutritional condition in the skeletal muscle (Fig. 6f). Neither starvation nor diet composition significantly affected the expression of ATP5B, a subunit of the cataly-tical core of F1F0-ATP synthase, in the skeletal muscle (Fig. 6g). SLC25A6, also known as ADP/ATP translocase 3, is a member of the solute carrier family 25 that facili-tates the exchange of ADP and ATP across the
Fig. 6 Effect of starvation and diet composition on the expression of OXPHOS genes. Three groups of fish were fed 23 days at a daily ration of 25 g/kg body weight with diets HLL, MHL or LLH. A fourth group of animals was fasted for the same period. Expression levels in the liver and the skeletal muscle are shown for NDUFB8 (a), NDUFS1 (b), COQ10 (c), UQCR11A (d), COX5B1 (e), COX6A2 (f), ATP5B (g) and SLC25A6 (h). Expression levels for each gene were normalised using 18S and EF1α as housekeeping genes. Results are presented as mean ± SD (n = 5 fish). Different letters (lowercase for the liver; uppercase for the skeletal muscle) indicate significant differences among conditions (p < 0.05)
mitochondrial inner membrane by an antiport mechanism [43]. In the liver, starvation significantly increased 14.3 to 19.3-fold the expression of SLC25A6 compared to fed fish. The effect of starvation depended on the diet composition in the skeletal muscle: fish fed diet HLL presented the lower SLC25A6 mRNA levels, which were 7.6 and 8.2-fold higher in fish fed diet MHL and starved fish, respectively (Fig. 6h).
Discussion
Transcriptomic analysis
The goal of the present study was to increase currently available transcriptomic data for S. aurata and identify OXPHOS genes affected by the nutritional status in this species. 454 sequencing of liver and white skeletal muscle cDNA normalised libraries from S. aurata juve-niles submitted to starvation or feeding on five selected diets allowed us to generate transcriptomes for liver, skeletal muscle and a hybrid transcriptome integrating data from both tissues. The number of isotigs (19,530), contigs (23,956) and average isotig and contig length (1330 bp and 901 bp, respectively) of the hybrid tran-scriptome indicates that effective data assemblies were carried out compared to values reported for other fish species of interest in aquaculture [44]. In contrast to previous studies, prior to 454 pyrosequencing we con-structed normalised libraries using tissue samples from long-term starved fish and fish fed five diets differing in macronutrient composition to allow maximal represen-tation of transcripts abundance and diversity in regard to dietary condition. Furthermore, the present study reports the first liver transcriptome for S. aurata ob-tained using NGS technology. In regard of the skeletal muscle, assembly of five cDNA libraries from the fast skeletal muscle of fed and short-term fasted fish submit-ted to various rearing temperatures allowed Garcia de la Serrana et al. [21] to identify 50,515 isotigs with an aver-age length of 454 bp (11,545 isotigs with an averaver-age length of 1208 bp in the present study), while Calduch-Giner et al. [20] obtained 7808 contigs with an average length of 968 bp for the same tissue (12,333 contigs with an average length of 1056 bp in the present study). The length of assembled sequences of the present study allowed annotation of a significant part of unique se-quences, improving transcriptome depth.
Functional annotation allowed us to analyse frequency of GO terms in assembled transcriptomes and within annotated sequences exclusively expressed in the liver or the skeletal muscle. Concerning GO terms, liver, skeletal muscle and hybrid transcriptomes exhibited an overall similar functional profiling. However, after filtering com-mon sequences present in the liver and skeletal muscle transcriptomes, marked differences in GO term fre-quency were found between both transcriptomes for
biological process and molecular function categories. Consistent with the plasticity and complexity of the hep-atic metabolism, the liver transcriptome presented a higher number of GO terms describing biological pro-cesses such as transport, carbohydrate metabolic process, lipid metabolic process, defense response and cellular amino acid metabolic process, and molecular functions related to enzyme activity. During growth skel-etal muscle develops an adaptive response that includes tissue repair, cytoskeleton organization and remodeling processes [45]. Consistent with a higher growth rate in S. auratajuveniles than in adults [46], GO terms associ-ated with biological processes involved in development and morphogenesis, such as cell differentiation, embryo development and actin cytoskeleton organisation, were more abundant in the skeletal muscle transcriptome from S. aurata juveniles.
BLAST similarity analysis of unique sequences in the S. aurata hybrid transcriptome against NCBI non-redundant database showed higher homology to genes from ten fish species belonging to the Percomorphaceae subdivision (68.3% of annotations), as it is the case for S. aurata [47]. The low number of annotations matching sequences from S. aurata highlights the limited genomic information available for this species in the NCBI database.
Nutritional regulation of OXPHOS inS. aurata
Transcriptomic data obtained in the present study was further used to identify biomarker genes of interest for nutritional studies by analysing the effect of nutritional status and diet composition on the expression of genes involved in OXPHOS and ATP translocation across the mitochondrial inner membrane in S. aurata. Given that starvation periods can induce compensatory growth in commercial fish farming [48], we studied the effect of long-term starvation on the expression of OXPHOS genes in S. aurata. Microarray analysis and validation of microarray data by qPCR pointed to a marked increase in the mRNA levels of a high proportion of OXPHOS genes as a result of long-term starvation in the liver of S. aurata. In the skeletal muscle, starvation upregulated the majority of OXPHOS genes displaying changes in expression >2-fold change, although at a considerably smaller magnitude than in the liver. In contrast to the liver, food deprivation downregulated also a significant amount of OXPHOS genes in the skeletal muscle of S. aurata. Thus, our findings indicate that the OXPHOS process in the liver is more sensitive to long-term starva-tion. In support of this hypothesis, mitochondrial-related changes in fasted mice are also greater in the liver than in the skeletal muscle [49]. Indeed, it was reported that fasting does not affect the expression of OXPHOS genes in the skeletal muscle of humans [50].
Bearing in mind that cytochrome c oxidase is consid-ered to be the rate-limiting reaction of the electron transfer chain [23, 24], the fact that starvation markedly increased the expression of multiple components of cytochrome c oxidase is consistent with upregulation of OXPHOS in the liver of food-deprived S. aurata (15 out of 35 genes significantly upregulated with an adjusted P value <0.05; 6 of them with a fold change >2). Our find-ings are in agreement with previous evidences highlight-ing increased OXPHOS activity as an important physiological adaptation in the liver during starvation. Similarly as in S. aurata, starvation increases cyto-chrome c oxidase activity and the transcription of OXPHOS genes in the liver of mice [26, 27], and en-hances the activity of cytochrome c oxidase in human fibroblasts [28]. Moreover, a microarray analysis con-ducted on liver samples of mice indicated that 75% of diet restriction results in a modest but significant in-creased expression of an important number of OXPHOS genes [51]. In contrast to our findings, a recent report addressing the effect of 10 days of starvation on the ex-pression of 88 genes of the OXPHOS pathway in S. aur-ata juveniles concluded that food-deprivation mostly downregulated the expression of OXPHOS genes in the liver, while starvation upregulated a number of OXPHOS genes in the white skeletal muscle and cardiac muscle, in most cases with a fold change <2 [29]. The starvation period (10 days versus 23 days in the present study) may explain striking differences among studies. Indeed, long periods of starvation are frequent during the life cycle of many fish species as a result of migration, reproduction and food availability [52]. Hence, metabolic adaptation to food deprivation includes a gradual depletion of hepatic glycogen levels in S. aurata, and starvation periods longer than 18 days are required to decrease the liver glycogen content to barely detectable levels [53, 54]. Therefore, it is not surprising that the expression of OXPHOS genes in S. aurata tissues could exhibit different patterns depending on the starvation period. In agreement with this hypoth-esis, three weeks of starvation were necessary to promote a significant increase in the protein content of succinate dehydrogenase, cytochrome c oxidase and F1F0-ATP syn-thase in the skeletal muscle of fine flounder (Paralichthys adspersus) [55]. Thus, stimulation of OXPHOS in the liver of S. aurata by long-term starvation may result from a metabolic adaptation that would involve increased lipoly-sis, enhanced hepatic fatty acid oxidation and ketogenelipoly-sis, and reduced glucose uptake and oxidation in peripheral tissues. Consistently, starvation stimulates ATP-dependent processes in the liver, such as gluconeogenesis and urea-genesis, andβ-oxidation of fatty acids to provide ketogenic substrates [56]. Therefore, increased OXPHOS activity may be essential to facilitate substrate oxidation and sup-ply ATP in the liver of long-term starved S. aurata.
Among cytochrome c oxidase components signifi-cantly upregulated in the liver of starved S. aurata, COX6A2 and COX5B1 were more sensitive to food deprivation. Both components may exert an important role in cytochrome c oxidase activity during starvation. In fact, the expression of COX5B, which enhances cyto-chrome c oxidase activity [57], is repressed by high con-centrations of glucose in Saccharomyces cerevisiae [58]. The hypothesis that COX6A2 expression may be rele-vant under food deprivation is supported by the fact that COX6A2−/− mice are very sensitive to food deprivation and loose more weight during starvation than wild type mice [59]. Consistent with an increased expression of cytochrome c oxidase, the mRNA levels of cytochrome c (CYCS), a small one-electron carrier that shuttles elec-trons from ubiquinol-cytochrome c reductase to cyto-chrome c oxidase, also increased markedly in the liver of starved fish.
In addition to CYCS and cytochrome c oxidase compo-nents, upregulation of two critical proteins in mitochon-drial respiration such as COQ10 and SLC25A6 closely fits with an increased OXPHOS function in the liver of starved S. aurata. COQ10 is a member of the steroido-genic acute regulatory protein (StAR)-related lipid transfer (START) domain superfamily that is located in the mito-chondrial inner membrane, where binds ubiquinone in its hydrophobic pocket [60]. Deletion of COQ10 gene causes respiratory deficiency and the inability to oxidise NADH and succinate in yeast, while overexpression of COQ10 re-stores respiratory electron transport in the yeast COQ10 null mutant [42, 61–63]. These observations led to hypothesise that COQ10 is essential for mitochondrial respiration by facilitating ubiquinone biosynthesis and act-ing as a chaperone for the transport of ubiquinone be-tween electron transfer chain complexes [42, 60, 63]. SLC25A6 is an ADP/ATP translocase that is ubiquitously expressed at levels that are proportional to the respiratory activity of the tissue [64]. As a core component of the mitochondrial permeability transition pore, SLC25A6 can strongly induce apoptosis in cultured human-derived cells [65, 66]. ADP/ATP translocases are integral proteins that supply cellular energy by coupling mitochondrial respir-ation with ADP/ATP exchange across the mitochondrial inner membrane. Presence of different ADP/ATP translo-cases in eukaryotic organisms may enable control of ex-pression levels in response to a variety of stimulus and energy requirements, rather than displaying functional dif-ferences [43]. Thus, since long-term starvation caused modest effects on other ADP/ATP translocases (SLC25A4 and SLC25A5) in the liver of S. aurata, our findings sug-gest that increased mRNA levels of SLC25A6 may be crit-ical to support ATP-dependent processes in the liver during starvation. The fact that starvation markedly up-regulated COQ10, COX6A2 and SLC25A6 in the liver,
while they were barely affected in the skeletal muscle, in-dicates that the hepatic expression of COQ10, COX6A2 and SLC25A6 can therefore be used as sensitive markers of the nutritional status in S. aurata.
In contrast with sensitivity of the expression of OXPHOS genes in the liver of long-term starved S. aur-ata, diet composition did not cause significant changes in the expression pattern of OXPHOS genes. Neverthe-less, the expression of OXPHOS genes in the skeletal muscle was more affected by macronutrient dietary composition. Compared to fish fed HLL, the supply of a low-protein/high-carbohydrate diet (LLH) promoted a trend to upregulate mRNA levels of most of the genes whose expression significantly increased in the skeletal muscle of starved fish, such as COX5B1. Given that macronutrient composition of LLH is far from the diet-ary composition of wild S. aurata and resulted in the lowest SGR values among fed fish, our findings are con-sistent with the fact that partial substitution of dietary protein by carbohydrates reduces weight gain and results in expression levels of appetite-regulating peptides close to the values observed in starved S. aurata [67].
Conclusions
Four hundred fifty-four sequencing of liver and skeletal muscle samples from long-term starved S. aurata juveniles and fish fed diets differing in macronutrient composition allowed us to obtain a deep-coverage transcriptome. Tran-scriptomic data was further used to construct an oligo-nucleotide microarray to analyse the effect of starvation and diet composition on the expression of OXPHOS com-ponents. Our findings support the notion that long-term starvation enhances cytochrome c oxidase and OXPHOS in the liver of S. aurata. Among differentially expressed genes, COQ10, COX6A2 and SLC25A6 in the liver and COX5B1 in the liver and the skeletal muscle were remark-ably sensitive to changes in the nutritional status, and could be useful for monitoring the impact of changes in the feeding regime and diet composition in fish.
Additional files
Additional file 1: OXPHOS-related genes analysed in microarrays. (DOCX 151 kb)
Additional file 2: Differentially expressed genes with and adjusted P value <0.05 in the liver of starved Sparus aurata versus at least one group of fed fish (diets HLL, MHL and LLH). (DOCX 128 kb)
Additional file 3: Differentially expressed genes with and adjusted P value <0.05 in the skeletal muscle of starved Sparus aurata versus at least one group of fed fish (diets HLL, MHL and LLH). (DOCX 136 kb)
Abbreviations
18S:18S ribosomal RNA; ATP5A1: ATP synthase subunit alpha; ATP5B: ATP synthase subunit beta; ATP5G3: ATP synthase F(0) complex subunit C3; ATP5I1: ATP synthase subunit e isoform 1; ATPIF1: ATPase inhibitor; COQ10: Coenzyme Q-binding protein COQ10; COX18: Mitochondrial inner
membrane protein COX18; COX4: Cytochrome c oxidase subunit 4; COX4I2: Cytochrome c oxidase subunit 4 isoform 2; COX5A2: Cytochrome c oxidase subunit 5A isoform 2; COX5B1: Cytochrome c oxidase subunit 5B isoform 1; COX6A2: Cytochrome c oxidase subunit 6A2;
COX6B1: Cytochrome c oxidase subunit 6B1; COX6B1B: Cytochrome c oxidase subunit 6B isoform 1B; COX7A2: Cytochrome c oxidase subunit 7A2; COX8B: Cytochrome c oxidase subunit 8B; CYCS: Cytochrome c;
EF1α: Elongation factor 1 alpha; EST: Expressed sequence tag; ETFB: Electron transfer flavoprotein subunit beta; GO: Gene ontology; MT-ND1: NADH-ubiquinone oxidoreductase chain 1; MT-ND2: NADH-NADH-ubiquinone
oxidoreductase chain 2; MT-ND4: NADH-ubiquinone oxidoreductase chain 4; MT-ND5: NADH-ubiquinone oxidoreductase chain 5; NDUFA10: NADH dehydrogenase [ubiquinone] 1 alpha subcomplex subunit 10;
NDUFA11: NADH dehydrogenase [ubiquinone] 1 alpha subcomplex subunit 11; NDUFA4: NADH dehydrogenase [ubiquinone] 1 alpha subcomplex subunit 4; NDUFA4L2: NADH dehydrogenase [ubiquinone] 1 alpha subcomplex subunit 4-like 2; NDUFAF3: NADH dehydrogenase [ubiquinone] 1 alpha subcomplex assembly factor 3; NDUFB8: NADH dehydrogenase [ubiquinone] 1 beta subcomplex subunit 8; NDUFS1: NADH ubiquinone oxidoreductase 75 kDa subunit; NGS: Next-generation sequencing; OXPHOS: Oxidative phosphorylation; qPCR: Quantitative real-time PCR; SCO1: Protein SCO1 homolog; SDHAF4: Succinate dehydrogenase assembly factor 4; SGR: Specific growth rate; SLC25A4: ADP/ATP translocase 1; SLC25A5: ADP/ATP translocase 2; SLC25A6: ADP/ATP translocase 3; START: Steroidogenic acute regulatory protein (StAR)-related lipid transfer; UCR2: cytochrome c reductase subunit 2; UQCC1: Ubiquinol-cytochrome-c reductase complex assembly factor 1; UQCR11A: Cytochrome b-c1 complex subunit 10 isoform A; UQCRC1: Cytochrome b-c1 complex subunit 1; UQCRC2: Cytochrome b-c1 complex subunit 2;
UQCRH: Cytochrome b-c1 complex subunit 6
Acknowledgements
The authors thank Piscimar (Burriana, Castellón, Spain) for providing S. aurata juveniles, and the Aquarium of Barcelona (Barcelona, Spain) for supplying filtered seawater.
Funding
The present study was supported by the AGL2012–33305 and AGL2016– 78124-R grants (MEC, Spain; co-funded by the European Regional Develop-ment Fund, ERDF, EC).
Availability of data and materials
Transcriptome sequencing data have been deposited to the NCBI Sequence Read Archive (SRA) database and corresponds to BioProject number PRJNA391557. Gene expression data supporting the results of this article are available in the Gene Expression Omnibus (GEO) repository with the number GSE100744. The nucleotide sequence of analysed genes was submitted to the GenBank database under the accession numbers shown in
Additional file 1.
Authors’ contributions
JIS-M and AS performed most of the experiments. AC-S, IV, MPA, FF, IVB and IM participated in the obtention of experimental data. FF, IVB and IM con-ceived and designed the study. JIS-M, AS, IVB and IM analysed the data. IVB and IM wrote the paper. All authors read and approved the final manuscript.
Ethics approval and consent to participate
All experimental procedures were approved by the University of Barcelona’s Animal Welfare Committee (proceeding #461/16), in compliance with local and EU legislation.
Consent for publication Not applicable.
Competing interests
The authors declare that they have no competing interests.
Publisher’s Note
Springer Nature remains neutral with regard to jurisdictional claims in published maps and institutional affiliations.
Author details
1Secció de Bioquímica i Biologia Molecular, Departament de Bioquímica i Fisiologia, Facultat de Farmàcia i Ciències de l’Alimentació, Universitat de Barcelona, Joan XXIII 27-31, 08028 Barcelona, Spain.2Departament d’Ecologia, Facultat de Biologia, Universitat de Barcelona, Diagonal 645, 08028 Barcelona, Spain.3Center for Neuroscience and Cell Biology (CNC), University of Coimbra, Largo Marquês de Pombal, 3004-517 Coimbra, Portugal.4Center for Functional Ecology (CFE), Department Life Sciences, University of Coimbra, Calçada Martins de Freitas, 3000-456 Coimbra, Portugal.5Departament d’Enginyeria Química, Universitat Politècnica de Catalunya, Diagonal 647, 08028 Barcelona, Spain.
Received: 6 July 2017 Accepted: 2 October 2017
References
1. Mutz K-O, Heilkenbrinker A, Lönne M, Walter J-G, Stahl F. Transcriptome analysis using next-generation sequencing. Curr Opin Biotechnol. 2013; 24:22–30.
2. Goodwin S, McPherson JD, McCombie WR. Coming of age: ten years of next-generation sequencing technologies. Nat Rev Genet. 2016;17:333–51. 3. Nkili-Meyong AA, Bigarré L, Labouba I, Vallaeys T, Avarre J-C, Berthet N.
Contribution of next-generation sequencing to aquatic and fish virology. Intervirology. 2017;59:285–300.
4. Ronaghi M, Karamohamed S, Pettersson B, Uhlen M, Nyren P. Real-time DNA sequencing using detection of pyrophosphate release. Anal Biochem. 1996;242:84–9.
5. Gong Z, Yan T, Liao J, Lee SE, He J, Hew CL. Rapid identification and isolation of zebrafish cDNA clones. Gene. 1997;201:87–98.
6. Gong Z. Zebrafish expressed sequence tags and their applications. Methods Cell Biol. 1999;60:213–33.
7. Hirono I, Aoki T. Expressed sequence tags of medaka (Oryzias latipes) liver mRNA. Mol Mar Biol Biotechnol. 1997;6:345–50.
8. Morais S, Edvardsen RB, Tocher DR, Bell JG. Transcriptomic analyses of intestinal gene expression of juvenile Atlantic cod (Gadus morhua) fed diets with Camelina oil as replacement for fish oil. Comp Biochem Physiol Part B Biochem Mol Biol. 2012;161:283–93.
9. Lanes CFC, Bizuayehu TT, de Oliveira Fernandes JM, Kiron V, Babiak I. Transcriptome of Atlantic cod (Gadus morhua L.) early embryos from farmed and wild broodstocks. Mar Biotechnol. 2013;15:677–94.
10. Małachowicz M, Kijewska A, Wenne R. Transcriptome analysis of gill tissue of Atlantic cod Gadus morhua L. from the Baltic Sea. Mar Genomics. 2015;23:37–40.
11. Adzhubei AA, Vlasova AV, Hagen-Larsen H, Ruden TA, Laerdahl JK, Hoyheim B. Annotated expressed sequence tags (ESTs) from pre-smolt Atlantic salmon (Salmo salar) in a searchable data resource. BMC Genomics. 2007;8:209.
12. De Santis C, Bartie KL, Olsen RE, Taggart JB, Tocher DR. Nutrigenomic profiling of transcriptional processes affected in liver and distal intestine in response to a soybean meal-induced nutritional stress in Atlantic salmon (Salmo salar). Comp Biochem Physiol Part D Genomics Proteomics. 2015;15:1–11.
13. Li G, Zhao Y, Liu Z, Gao C, Yan F, Liu B, et al. De novo assembly and characterization of the spleen transcriptome of common carp (Cyprinus carpio) using Illumina paired-end sequencing. Fish Shellfish Immunol. 2015; 44:420–9.
14. Olsvik PA, Hemre G-I, Waagbø R. Exploring early micronutrient deficiencies in rainbow trout (Oncorhynchus mykiss) by next-generation sequencing technology– from black box to functional genomics. PLoS One. 2013;8: e69461.
15. Benzekri H, Armesto P, Cousin X, Rovira M, Crespo D, Merlo M, et al. De novo assembly, characterization and functional annotation of Senegalese sole (Solea senegalensis) and common sole (Solea solea) transcriptomes: integration in a database and design of a microarray. BMC Genomics. 2014; 15:952.
16. Ferraresso S, Vitulo N, Mininni AN, Romualdi C, Cardazzo B, Negrisolo E, et al. Development and validation of a gene expression oligo microarray for the gilthead sea bream (Sparus aurata). BMC Genomics. 2008;9:580. 17. Yúfera M, Halm S, Beltran S, Fusté B, Planas JV, Martínez-Rodríguez G.
Transcriptomic characterization of the larval stage in gilthead Seabream (Sparus aurata) by 454 pyrosequencing. Mar Biotechnol. 2012;14:423–35.
18. Sarropoulou E, Tsalafouta A, Sundaram AYM, Gilfillan GD, Kotoulas G, Papandroulakis N, et al. Transcriptomic changes in relation to early-life events in the gilthead sea bream (Sparus aurata). BMC Genomics. 2016; 17:506.
19. FAO Fishery Statistics Web Page. FAO Fisheries and Aquaculture Department [online]. Food and Agriculture Organization of the United Nations. Rome. http://www.fao.org/fishery/statistics/en. Accessed 11 Jun 2017.
20. Calduch-Giner JA, Bermejo-Nogales A, Benedito-Palos L, Estensoro I, Ballester-Lozano G, Sitjà-Bobadilla A, et al. Deep sequencing for de novo construction of a marine fish (Sparus aurata) transcriptome database with a large coverage of protein-coding transcripts. BMC Genomics. 2013;14:178. 21. Garcia de la Serrana D, Estévez A, Andree K, Johnston IA. Fast skeletal
muscle transcriptome of the Gilthead sea bream (Sparus aurata) determined by next generation sequencing. BMC Genomics. 2012;13:181.
22. Vieira FA, Thorne MAS, Stueber K, Darias M, Reinhardt R, Clark MS, et al. Comparative analysis of a teleost skeleton transcriptome provides insight into its regulation. Gen Comp Endocrinol. 2013;191:45–58.
23. Kadenbach B. Intrinsic and extrinsic uncoupling of oxidative phosphorylation. Biochim Biophys Acta. 2003;1604:77–94.
24. Hüttemann M, Lee I, Grossman LI, Doan JW, Sanderson TH. Phosphorylation of Mammalian Cytochrome c and Cytochrome c Oxidase in the Regulation of Cell Destiny: Respiration, Apoptosis, and Human Disease. In: Kadenbach B, editor. Advances in experimental medicine and biology. New York: Springer; 2012. p. 237–64.
25. Matsumura T, Thurman RG. Measuring rates of O2 uptake in periportal and pericentral regions of liver lobule: stop-flow experiments with perfused liver. Am J Phys. 1983;244:G656–9.
26. Casas F, Pineau T, Rochard P, Rodier A, Daury L, Dauça M, et al. New molecular aspects of regulation of mitochondrial activity by fenofibrate and fasting. FEBS Lett. 2000;482:71–4.
27. Liu L, Nam M, Fan W, Akie TE, Hoaglin DC, Gao G, et al. Nutrient sensing by the mitochondrial transcription machinery dictates oxidative
phosphorylation. J Clin Invest. 2014;124:768–84.
28. Marini C, Bianchi G, Buschiazzo A, Ravera S, Martella R, Bottoni G, et al. Divergent targets of glycolysis and oxidative phosphorylation result in additive effects of metformin and starvation in colon and breast cancer. Sci Rep. 2016;6:19569.
29. Bermejo-Nogales A, Calduch-Giner JA, Pérez-Sánchez J. Unraveling the molecular signatures of oxidative Phosphorylation to cope with the nutritionally changing metabolic capabilities of liver and muscle tissues in farmed fish. PLoS One. 2015;10:e0122889.
30. Sparks LM, Xie H, Koza RA, Mynatt R, Hulver MW, Bray GA, et al. A high-fat diet coordinately downregulates genes required for mitochondrial oxidative phosphorylation in skeletal muscle. Diabetes. 2005;54:1926–33.
31. García-Ruiz I, Solís-Muñoz P, Fernández-Moreira D, Grau M, Colina F, Muñoz-Yagüe T, et al. High-fat diet decreases activity of the oxidative
phosphorylation complexes and causes nonalcoholic steatohepatitis in mice. Dis Model Mech. 2014;7:1287–96.
32. Li R, Jia Y, Pan S, Li X, Song H, Zhao R. Glucocorticoid receptor mediates the effect of high-fat diet on mitochondrial oxidative Phosphorylation in mouse liver. DNA Cell Biol. 2016;35:51–8.
33. Figueiredo-Silva AC, Saravanan S, Schrama JW, Kaushik S, Geurden I. Macronutrient-induced differences in food intake relate with hepatic oxidative metabolism and hypothalamic regulatory neuropeptides in rainbow trout (Oncorhynchus mykiss). Physiol Behav. 2012;106:499–505. 34. Fernández F, Miquel AG, Cordoba M, Varas M, Metón I, Caseras A, et al.
Effects of diets with distinct protein-to-carbohydrate ratios on nutrient digestibility, growth performance, body composition and liver intermediary enzyme activities in gilthead sea bream (Sparus aurata, L.) fingerlings. J Exp Mar Bio Ecol. 2007;343:1–10.
35. Martin M. Cutadapt removes adapter sequences from high-throughput sequencing reads. EMBnetjournal. 2011;17:10.
36. Schmieder R, Edwards R. Fast identification and removal of sequence contamination from genomic and metagenomic datasets. PLoS One. 2011;6: e17288.
37. Futami R, Muñoz-Pomer A, Viu J, Dominguez-Escribá L, Covelli L, Bernet G, et al. GPRO: the professional tool for annotation, management and functional analysis of omic databases. Biotechvana Bioinforma. 2011;2011–SOFT3. 38. Kerr MK, Churchill GA. Experimental design for gene expression microarrays.
39. Gentleman RC, Carey VJ, Bates DM, Bolstad B, Dettling M, Dudoit S, et al. Bioconductor: open software development for computational biology and bioinformatics. Genome Biol. 2004;5:R80.
40. R Core Team. R: A Language and Environment for Statistical Computing. Vienna. 2013. http://www.R-project.org/. Accessed 11 June 2017. 41. Smyth GK. Linear models and empirical Bayes methods for assessing
differential expression in microarray experiments. Stat Appl Genet Mol Biol. 2004;3:1–25.
42. Allan CM, Hill S, Morvaridi S, Saiki R, Johnson JS, Liau W-S, et al. A conserved START domain coenzyme Q-binding polypeptide is required for efficient Q biosynthesis, respiratory electron transport, and antioxidant function in Saccharomyces cerevisiae. Biochim Biophys Acta. 1831;2013:776–91. 43. Kunji ER, Aleksandrova A, King MS, Majd H, Ashton VL, Cerson E, et al. The
transport mechanism of the mitochondrial ADP/ATP carrier. Biochim Biophys Acta - Mol Cell Res. 2016;1863:2379–93.
44. Chen X, Mei J, Wu J, Jing J, Ma W, Zhang J, et al. A comprehensive Transcriptome provides candidate genes for sex determination/
differentiation and SSR/SNP markers in yellow catfish. Mar Biotechnol. 2015; 17:190–8.
45. Calduch-Giner JA, Davey G, Saera-Vila A, Houeix B, Talbot A, Prunet P, et al. Use of microarray technology to assess the time course of liver stress response after confinement exposure in gilthead sea bream (Sparus aurata L.). BMC Genomics. 2010;11:193.
46. Hadj-Taieb A, Ghorbel M, Hadj-Hamida NB, Jarboui O. Sex ratio,
reproduction, and growth of the gilthead sea bream, Sparus aurata (Pisces: Sparidae), in the Gulf of Gabes, Tunisia. Ciencias. 2013;39:101–12. 47. Betancur-R R, Broughton RE, Wiley EO, Carpenter K, López JA, Li C, et al. The
tree of life and a new classification of bony fishes. PLoS Curr 2013;5; doi:10. 1371/currents.tol.53ba26640df0ccaee75bb165c8c26288.
48. Caruso G, Denaro MG, Caruso R, De Pasquale F, Genovese L, Maricchiolo G. Changes in digestive enzyme activities of red porgy Pagrus pagrus during a fasting-refeeding experiment. Fish Physiol Biochem. 2014;40:1373–82. 49. Nesteruk M, Hennig EE, Mikula M, Karczmarski J, Dzwonek A, Goryca K, et al.
Mitochondrial-related proteomic changes during obesity and fasting in mice are greater in the liver than skeletal muscles. Funct Integr Genomics. 2014;14:245–59.
50. Wijngaarden MA, van der Zon GC, van Dijk KW, Pijl H, Guigas B. Effects of prolonged fasting on AMPK signaling, gene expression, and mitochondrial respiratory chain content in skeletal muscle from lean and obese individuals. Am J Physiol Endocrinol Metab. 2013;304:E1012–21.
51. Renaud HJ, Cui JY, Lu H, Klaassen CD. Effect of diet on expression of genes involved in lipid metabolism, oxidative stress, and inflammation in mouse liver-insights into mechanisms of hepatic steatosis. PLoS One. 2014;9: e88584.
52. Day RD, Tibbetts IR, Secor SM. Physiological responses to short-term fasting among herbivorous, omnivorous, and carnivorous fishes. J Comp Physiol B. 2014;184:497–512.
53. Metón I, Mediavilla D, Caseras A, Cantó E, Fernández F, Baanante IV. Effect of diet composition and ration size on key enzyme activities of glycolysis-gluconeogenesis, the pentose phosphate pathway and amino acid metabolism in liver of gilthead sea bream (Sparus aurata). Br J Nutr. 1999;82: 223–32.
54. Metón I, Fernández F, Baanante IV. Short- and long-term effects of refeeding on key enzyme activities in glycolysis–gluconeogenesis in the liver of gilthead seabream (Sparus aurata). Aquaculture. 2003;225:99–107. 55. Fuentes EN, Safian D, Einarsdottir IE, Valdés JA, Elorza AA, Molina A, et
al. Nutritional status modulates plasma leptin, AMPK and TOR activation, and mitochondrial biogenesis: implications for cell metabolism and growth in skeletal muscle of the fine flounder. Gen Comp Endocrinol. 2013;186:172–80.
56. Soeters MR, Soeters PB, Schooneman MG, Houten SM, Romijn JA. Adaptive reciprocity of lipid and glucose metabolism in human short-term starvation. Am J Physiol Endocrinol Metab. 2012;303:E1397–407.
57. Waterland RA, Basu A, Chance B, Poyton RO. The isoforms of yeast cytochrome c oxidase subunit V alter the in vivo kinetic properties of the holoenzyme. J Biol Chem. 1991;266:4180–6.
58. Hodge MR, Singh K, Cumsky MG. Upstream activation and repression elements control transcription of the yeast COX5b gene. Mol Cell Biol. 1990; 10:5510–20.
59. Quintens R, Singh S, Lemaire K, De Bock K, Granvik M, Schraenen A, et al. Mice deficient in the respiratory chain gene Cox6a2 are protected against
high-fat diet-induced obesity and insulin resistance. PLoS One. 2013;8: e56719.
60. Murai M, Matsunobu K, Kudo S, Ifuku K, Kawamukai M, Miyoshi H. Identification of the binding site of the Quinone-head group in mitochondrial Coq10 by Photoaffinity labeling. Biochemistry. 2014;53:3995–4003.
61. Barros MH, Johnson A, Gin P, Marbois BN, Clarke CF, Tzagoloff A. The Saccharomyces cerevisiae COQ10 gene encodes a START domain protein required for function of coenzyme Q in respiration. J Biol Chem. 2005;280: 42627–35.
62. Cui T-Z, Kawamukai M. Coq10, a mitochondrial coenzyme Q binding protein, is required for proper respiration in Schizosaccharomycespombe. FEBS J. 2009;276:748–59.
63. Jenkins BJ, Daly TM, Morrisey JM, Mather MW, Vaidya AB, Bergman LW. Characterization of a plasmodium falciparum Orthologue of the yeast Ubiquinone-binding protein, Coq10p. PLoS One. 2016;11:e0152197. 64. Stepien G, Torroni A, Chung AB, Hodge JA, Wallace DC. Differential expression
of adenine nucleotide translocator isoforms in mammalian tissues and during muscle cell differentiation. J Biol Chem. 1992;267:14592–7.
65. Zamora M, Granell M, Mampel T, Viñas O. Adenine nucleotide translocase 3 (ANT3) overexpression induces apoptosis in cultured cells. FEBS Lett. 2004; 563:155–60.
66. Guo X, Huang Y, Qi Y, Liu Z, Ma Y, Shao Y, et al. Human cytomegalovirus miR-UL36-5p inhibits apoptosis via downregulation of adenine nucleotide translocator 3 in cultured cells. Arch Virol. 2015;160:2483–90.
67. Babaei S, Sáez A, Caballero-Solares A, Fernández F, Baanante IV, Metón I. Effect of dietary macronutrients on the expression of cholecystokinin, leptin, ghrelin and neuropeptide Y in gilthead sea bream (Sparus aurata). Gen Comp Endocrinol. 2017;240:121–8.
• We accept pre-submission inquiries
• Our selector tool helps you to find the most relevant journal • We provide round the clock customer support
• Convenient online submission • Thorough peer review
• Inclusion in PubMed and all major indexing services • Maximum visibility for your research
Submit your manuscript at www.biomedcentral.com/submit