SCUOLA DOTTORALE IN GEOLOGIA DELL’AMBIENTE E DELLE RISORSE
(SDIGAR)
SEZIONE GEOLOGIA DELLE RISORSE NATURALI
- XXVI CICLO-
A crystal-chemical study of cordierite, synthesis and
stability at variable H
2
O and CO
2
concentration:
geological and technological applications
PhD Candidate
Francesco Radica
Advisor: Prof. Giancarlo Della Ventura Co-advisors : Dr. Fabio Bellatreccia
Dr. Carmela Freda
Thesis reviewers: Dr. Gianluca Iezzi and Dr. Jannick Ingrin
Defense committee: Prof. G. Diego Gatta, Dr. Roberto Sulpizio and Dr. Luca Aldega
Head of the Doctoral School: Prof. Claudio Faccenna
A
I MIEI NONNI
“Though we cannot SEE angles, we can INFER them, and this with great
precision. Our sense of touch, stimulated by necessity, and developed by long
training, enables us to distinguish angles far more accurately than your sense of
sight, when unaided by a rule or measure of angles.”
Table of contents
Acknowledgments ... i
Abstract ... iii
Riassunto ... v
Introduction ... 1
1. Structural details of cordierite and beryl and their relevance on technology ... 1
2. The petrological relevance of cordierite ... 4
3. Advances in FTIR micro-spectroscopy ... 7
Summary ... 10
Section I: Structural and spectroscopic characterization of cordierite (Chapters 1 and 2). ... 10
Section II: In-situ HT-IR spectroscopy and kinetic study of CO2 expulsion from cordierite (Chapters 3 and 4). ... 13
Section III: Experimental diffusion of CO2 in cordierite and beryl at different PTt conditions (Chapter 5). ... 17
Section IV: The diffusion of volatiles in hourglass zoned beryl, the coordination environment of H2O in low-water samples and comments on the geological storage of CO2 in beryl (Chapters 6, 7 and 8). ... 21
Chapter 1: Quantitative analysis of H2O and CO2 in cordierite using polarized FTIR spectroscopy .. 25
Abstract ... 25
1. Introduction ... 26
2. Samples and analytical methods ... 28
3. X-ray diffraction, optical properties and microchemistry ... 30
4. Single-crystal FTIR spectroscopy ... 33
5. Interpretation of polarized FTIR spectra ... 36
6. The distribution of H2O and CO2 in the studied samples ... 40
7. Calibration of a molar absorption coefficient to quantify H2O and CO2 in cordierite using FTIR spectroscopy ... 42
8. Conclusions ... 45
Acknowledgements ... 47
Chapter 2: Spectroscopy and X-ray structure refinement of sekaninaite from Dolnì Bory (Czech Rep.) ... 48
Abstract ... 49
1. Introduction ... 49
3. Chemical composition ... 54
4. Single-crystal X-ray results ... 55
5. Optical properties... 58
6. FTIR spectroscopy... 58
7. FTIR band assignment ... 62
8. Unpolarized Raman spectroscopy ... 63
9. Calibration of a molar absorption coefficients of H2O and CO2 in sekaninaite ... 64
10. Conclusions ... 65
Acknowledgements ... 66
Chapter 3: HT-FTIR micro-spectroscopy of cordierite I: the CO2 absorbance as a function of T from in situ and quenched experiment ... 67
Abstract ... 67
1. Introduction ... 68
2. Studied samples ... 70
3. Experimental methods ... 72
4. FTIR spectra of the studied cordierite sections: preliminary considerations on the H2O and CO2 bands ... 73
5. Experimental Results ... 75
5.1 In situ HT-FTIR measurements: the (001) section ... 75
5.2 In situ HT-FTIR measurements: the (010) section ... 78
5.3 Measurements at RT on quenched samples ... 80
5.4 The intensity variation of in situ vs quenched data ... 81
6. Discussion ... 83
6.1 The thermal behavior of CO2 bands ... 83
6.2 The effect of channel orientation on volatile loss ... 85
7. Conclusions ... 87
Chapter 4: HT-FTIR micro-spectroscopy of cordierite II: the diffusion kinetics of CO2 ... 89
Abstract ... 89
1. Introduction: ... 90
2. Studied sample ... 91
3. Experimental methods ... 92
3.1 FTIR polarized-light isothermal heating experiments ... 93
4. Polarized-light FTIR spectroscopy of cordierite and band assignment ... 95
5. Results ... 98
5.2 Reaction kinetics ... 101
6. Discussions: Kinetic of CO2 extraction ... 109
7. Conclusions ... 113
Chapter 5: Kinetics of incorporation of CO2 in cordierite and beryl: an FTIR-FPA spectroscopy study ... 114
Abstract ... 114
1. Introduction ... 115
1.1 Cordierite and beryl: structural details ... 119
2. Experimental and analytical procedure ... 121
2.1 Starting materials ... 121
2.2 Experimental procedure ... 125
2.3 Analytical methods ... 127
3. Results ... 130
3.1 Run products ... 130
3.2 CO2 diffusion in cordierite and beryl: preliminary considerations ... 133
3.3 CO2 contents ... 134
4. Diffusion coefficients of CO2 for cordierite and beryl ... 138
5. Discussion ... 142
5.1 The solubility of CO2 in cordierite and beryl ... 142
5.2 The effect of fractures on the CO2 content ... 144
5.3 The CO2 diffusion in microporous structures ... 146
6. Conclusions ... 148
Chapter 6: The diffusion of CO2 and H2O in a synthetic sector-zoned beryl: a multi-analytical study ... 149
Abstract ... 149
1. Introduction ... 150
2. Materials and Methods ... 152
3. Results ... 155
3.1 TOF-SIMS mapping ... 155
3.2 Polarized-light FTIR spectra, band assignment, and volatile contents ... 156
3.2 Polarized-light FPA imaging ... 159
4. Discussion ... 161
4.1 Hourglass zoning and CO2 diffusion ... 161
Chapter 7: Speciation and diffusion profiles of H2O in water-poor beryl: Comparison with cordierite
... 167
Abstract ... 167
1. Introduction ... 168
2. Experimental methods and studied materials ... 169
3. FTIR-FPA imaging ... 172
4. Polarized FTIR measurements ... 173
5. The coordination of H2O in beryl and cordierite ... 178
6. Conclusions ... 181
Chapter 8: The permanent storage of CO2 in mesoporous minerals: experiments with beryl ... 183
Abstract ... 183
Acknowledgments ... 190
Final Remarks... 191
A
CKNOWLEDGMENTS
This project couldn’t have been accomplished without the help of many precious people that have accompanied me through these years of work and amusement.
First and foremost, I want to express all my gratitude to my supervisor Prof. Giancarlo Della Ventura who guided and supported me during these years, in particular during the last year for helping me with my terrible English and trying to decipher my thoughts and express them in the text.
My sincere gratitude goes to my co-supervisors for their precious help: Fabio Bellatreccia for his advices and for fulfilling my continuous doubts and solving my problems with great patience, and to Carmela Freda for introducing me to the world of experimental petrology. A special thanks goes to Matteo Masotta, who transferred me all the secrets of the
QuickPress, for the great time spent inside and outside the INGV laboratory and for being a good friend.
I’m deeply indebted to all people that supported me during the experiments and the analysis at INGV: Piergiorgio Scarlato, Valeria Misiti, Silvio Mollo, Andrea Cavallo, Elisabetta del Bello, Serena Granati and all people gravitating or passing by the HP-HT laboratory for helping me out with advices and joyful company.
Sincere thanks are due to several people I met at INFN-LNF: Claudio Marcelli, Mariangela Cestelli Guidi, Antonio, Agostino, Diego Sali, for solving all problems I had with the FTIR spectrometer …and the OPUS software.
A special thanks goes to Dr. Gianfelice Cinque and all people at Diamond Light Source for their help with the synchrotron-beam work.
Heartfelt regards are due to Prof. Harald Behrens for his willingness to hosting me in Hannover, and to all people I met during my stay in Germany: Sara, Juan Carlos, Simone, Gabriele, Paola and so on.
Thanks to Dr. Mikey Gunter (Moscow, Idaho) transmitted me the secrets and the beauty of optical mineralogy and in particular of the use of the spindle stage to orient the crystals for
ii
FTIR polarized-light measurements; most of this thesis would have been impossible without this elegant, unfortunately almost lost, technique.
I’m very grateful to Prof. Simon Harley (University of Edinburgh) for the SIMS data, Prof. Frank Hawthorne (University of Manitoba, Winnipeg) for the LA-ICP-MS analysis, Giuseppe Chita (IC-CNR, Bari) and Francesco Capitelli (CNR, Roma) for X-ray data collection, Dr. Luca Tortora (Roma Tre University) for the TOF-SIMS maps, Vincenzo Mangione (Roma Tre University) for the help with the optical profilometer and Massimo Piccinini (Porto Conte Ricerche, Alghero) for the Raman spectra.
Thanks to Mr. R. Pagano and Dr M. D. Welch (Natural History Museum, London) for
providing some of the studied cordierite samples, while Dr. B. Rondeau (Nantes) and Dr. J.J. Chiappero (Museum National d'Histoire Naturelle, Paris) gently provided the beautiful and hystorical emeralds which have been used for the experiments.
A very special thanks goes to Dr. Gianluca Iezzi (Università G. D’Annunzio, Chieti), Dr. Jannick Ingrin (Univerité Lille 1, Lille) and Prof. Charles Geiger (University of Salzburg, Salzburg) for their careful revision of a preliminary draft of my Thesis and for their precious suggestions. Thanks to all people I met during these years of travelling and conferencing, especially to Ruggero, hope to see you soon.
Un grandissimo ringraziamento va ai miei vecchi e nuovi colleghi/amici che mi hanno accompagnato e mi hanno dato forza in questi anni, in special modo Stefano (preparati per agosto!), Umberto, Fabietto, Lidia, una serie infinita di Gabriele, Marco e Andrea, Ines, Ileana, Giorgia, Silvia, Roberta, Chiara, Alessandro, Riccardo, Martina e Francesco. Se ho dimenticato qualcuno sono una pessima persona.
Un grazie di cuore va ai miei genitori, a mio fratello e specialmente ai miei nonni che sono venuti a mancare in questi anni, grazie per l’amore che mi donate quotidianamente in terra e dal Cielo.
Ovviamente un ringraziamento speciale va ai miei amici storici e recenti, non mi dilungherò nei nomi - sarebbero troppi e, per come sto combinato adesso, sicuramente dimenticherei qualcuno - vi basti sapere che il vostro nome è nascosto dietro questi quadratini
□□□□□□□□□□□□□.
A
BSTRACT
Cordierite is a relatively widespread mineral, having a peculiar ability to trap H2O and
CO2 up to very high pressure and temperature. This is a unique property for a rock forming
silicate, and has a significant role in the mineralogical equilibria in HT and UHT
metamorphism (Harley and Thompson, 2004). In this work, great attention was paid to the study of the diffusion mechanisms of carbon dioxide inside these channel-like structures. Considering that carbon dioxide is probably one of the major responsible for long-term climate change on Earth (IPCC, 2005), the ability of these minerals to entrap CO2 could
provide insights for future research for the permanent CO2 storage in minerals.
The aim of this Thesis was to investigate the diffusion of CO2 across cordierite, and
address possible implications from both a geological and a technological point of view. The work was completed by the parallel study of beryl, which is structurally correlated to cordierite.
The text is divided into four major sections:
1) In the first section (Chapter 1 and 2) I introduce the issues related to the qualitative and quantitative analysis of H2O and CO2 in cordierite by means of
Fourier-Transform Infrared Spectroscopy (hereafter FTIR). In detail I show the crystal-chemical and spectroscopic study of chemically different samples, from an almost Mg-cordierite end-member to its Fe-analogue sekaninaite. Additionally I will discuss the calibration of the molar absorption coefficient ε, an indispensable coefficient for quantitative measurement in FTIR micro-spectroscopy. Both these chapters have been published in first-rank mineralogical and petrological journals and are thus reported here as they are published.
2) In the second section (Chapter 3 and 4) I’ll focus in mechanism of outward CO2
iv
heating-stage under the FTIR microscope and investigated using in situ FTIR µ-spectroscopy. Part of this study was done using a synchrotron-light source (SR-FTIR) to improve the signal-to-noise ratio and attain higher spatial resolution in the data. In this section I studied in particular the absorbance variation at constant temperature as a function of time, and evaluated the kinetic and diffusion parameters for CO2 expulsion from the matrix.
3) In the third section (Chapter 5) I discuss the mechanism of inward diffusion of CO2
within the structural channel of cordierite and beryl under different pressure, temperature and time conditions. The experimental work was done using a piston cylinder apparatus. In this section I’ll make extensive use of high resolution single-crystal FTIR Focal Planar Array (FTIR-FPA) imaging to characterize possible inhomogeneity in the CO2/H2O across the
samples, and identify the possible pathways for CO2 diffusion. As it will be shown, the
spectroscopic imaging was also necessary to locate the analytical spots for CO2
measurements in the sample.
4) The last part (Chapter 6, 7 and 8) covers additional features observed during the work. In particular, chapter 6 deals with a multidisciplinary study of a peculiar diffusion pattern of CO2 across an hourglass zoned beryl. This chapter relates on advances in
techniques such as Time Of Flight Secondary Ion Mass Spectroscopy (TOF-SIMS) chemical imaging, polarized light FPA imaging and High Resolution SR-FTIR mapping. Chapter 7 deals with changes in coordination environment and physical state of H2O in low-water beryl and
cordierite. Chapter 8 eventually presents a summary of the work and illustrates the technological applications of CO2 diffusion in beryl.
R
IASSUNTO
La cordierite è un minerale abbastanza diffuso che ha la capacità di intrappolare H2O
and CO2 anche ad altissime pressioni e temperature. Questa è una proprietà unica per un
silicato diffuso nelle rocce che gioca un ruolo fondamentale negli equilibri mineralogici nel metamorfismo di alta o altissima temperatura (Harley and Thompson, 2004). In questo lavoro ci siamo dedicati allo studio approfondito dei meccanismi di diffusione nell’anidride carbonica all’interno di strutture cristalline a “canale”. Inoltre, considerando che l’anidride carbonica è uno delle principali cause dei cambiamenti climatici terrestri a lungo termine (IPCC, 2005), la capacità di questi minerali di intrappolare la CO2 potrebbe fornire spunti per
future ricerche sullo stoccaggio permanente della CO2 nei minerali.
Lo scopo di questa tesi è quindi quello di studiare la diffusione della CO2 nella
cordierite, e individuare le possibili implicazioni da un punto di vista geologico e tecnologico. Il lavoro è stato arricchito con lo studio in parallelo della diffusione della CO2 nel berillo, che
è strutturalmente correlato alla cordierite.
Il lavoro di tesi è suddiviso in quattro sezioni principali:
1) Nella prima sezione (Capitoli 1 e 2) introduco le problematiche relative all’analisi qualitativa e quantitativa di H2O e CO2 nella cordierite attraverso la Spettroscopia Infrarosso
a Trasformata di Fourier (più comunemente FTIR). In particolare illustro lo studio
cristallochimico e spettroscopico di campioni di variegata composizione chimica, a partire da cordieriti di Mg fino all’analogo estremo ferrifero sekaninaite. Inoltre illustrerò la messa a punto della calibrazione del coefficiente di assorbimento molare ε, un parametro
vi
stati pubblicati su riviste di mineralogia e petrologia di alto impatto e qui riportati come da pubblicazione.
2) La seconda sezione (Capitoli 3 e 4) è focalizzata sui meccanismi di espulsione della CO2: a questo proposito sono state riscaldate delle lamelle orientate provenienti da cristalli
singoli di cordierite attraverso un tavolino riscaldante installato direttamente su di un microscopio FTIR ed analizzati tramite micro-spettroscopia FTIR in situ. Parte dello studio è stato condotto utilizzando una sorgente di luce di sincrotrone (SR-FTIR) in modo da
aumentare il rapporto segnale-rumore e raggiungere una migliore risoluzione spaziale. In questa sezione ho studiato in dettaglio la variazione degli assorbimenti in funzione del tempo a temperatura costante, e ho ricavato i parametri cinetici e di diffusione per l’estrazione della CO2 dai canali strutturali della cordierite.
3) Nella terza sezione (Capitolo 5) discuto il meccanismo di diffusione della CO2
attraverso i canali strutturali di cordierite e berillo riequilibrate a varie condizioni di pressione, temperatura e tempo. La procedura sperimentale è stata condotta usando un apparato di tipo piston-cylinder. In questa sezione farò uso intensivo di imaging FTIR bidimensionale (FTIR-FPA) ad alta risoluzione su cristallo singolo per individuare possibili inomogeneità nella distribuzione di H2O/CO2 nei campioni trattati, ed identificare i possibili
percorsi di diffusione della CO2. Inoltre l’imaging FTIR è indispensabile per localizzare i punti
analitici per la misura quantitativa della CO2.
4) Nell’ultima parte del manoscritto (Capitoli 6, 7 e 8) discuterò ulteriori
problematiche incontrate durante il lavoro di tesi. In particolare, il capitolo 6 illustrerà uno studio multidisciplinare su di un peculiare percorso di diffusione della CO2 osservato in un
berillo zonato a clessidra. Questo capitolo illustra alcune tra le tecniche più innovative nell’analisi mineralogica come le mappe composizionali in Time Of Flight Secondary Ion Mass
Spectroscopy (TOF-SIMS), imaging FTIR-FPA in luce polarizzata e mappatura SR-FTIR and
altissima risoluzione. Il capitolo 7 è focalizzato sulle variazioni di coordinazione e speciazione dell’H2O in berilli e cordieriti con poca acqua. Infine il capitolo 8 riporta un riassunto
dell’intero lavoro svolto e illustra le implicazioni tecnologiche della diffusione della CO2 nel
I
NTRODUCTION
1. Structural details of cordierite and beryl and their relevance on
technology
Carbon dioxide (CO2) generated by the combustion of fossil fuels is by far the most
abundant greenhouse gas; its reduction in the atmosphere is therefore a primary
environmental concern. Due to several reasons, it can be easily understood that fossil fuels will continue to play a significant role in the world’s economy at least in the following decades, thus emphasis must be placed on improving methods to decrease the amount of CO2 dispersed in the environment. The reduction of CO2 from the atmosphere can be
achieved by efficiency improvements in power plants, use of alternative energy technologies, sequestration of CO2, or some combination of these methods. Up to the
present, several techniques have been considered, and these include: 1) forestation, where CO2 is removed from the atmosphere by biological activity; 2) aquifer storage, in which CO2
is injected into terrestrial aquifers where it is trapped hydro-dynamically; 3) deep sea
storage, where CO2 is injected into the ocean at approximately 3,000 meter depths, where it
is believed to remain stable; and 4) mineral carbonation, in which CO2 is reacted with
minerals to form solid carbonates. This final form of sequestration is the most efficient method, because the carbonates are stable over geologic time periods (millions of years), rather than the hundreds to thousands of years of stability expected for the first three forms of sequestration. This process is however highly expensive and energy consuming, therefore research in material science has focused in the last decade at developing technically feasible processes for mineral sequestration of carbon dioxide alternative to carbonation.
Actually, many minerals contain carbon as a major to trace constituent, however the carbon content analysed in naturally occurring silicates is traditionally assigned to CO3
2-2
groups in the structure, whereas the possible presence of molecular CO2 in these phases is
almost completely ignored. Up to the present, the only accepted CO2-bearing minerals are
beryl (Wood and Nassau, 1967) and cordierite (Armbruster and Bloss, 1980, Della Ventura et
al., 2009, 2012). Indeed these two isostructural minerals are able to trap CO2 because of their peculiar structural channels.
Cordierite is a framework alumino silicate with the ideal formula
(□,Na)(Mg,Fe)2Al4Si5O18(□,H2O,CO2) and a continuous solid solution between the Mg2+
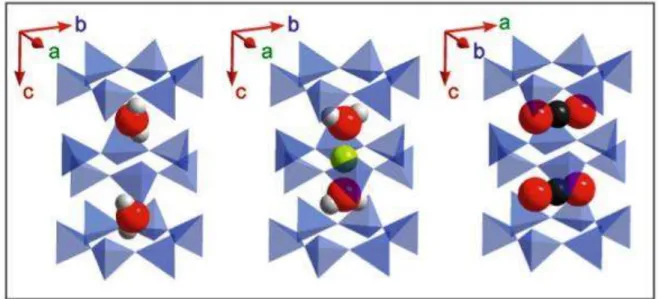
end-member and the Fe2+ end-member (sekaninaite) exists (e.g. Černý et al., 1997, Radica et al., 2013). The cordierite framework can be described as a stacking of pseudo-hexagonal Si/Al layers of tetrahedra and mixed layers of tetrahedra and octahedra (Fig. 1a). Alkali cations such as Na, K, Ca, and molecules such as H2O and CO2 may be allotted within the resulting
pseudo-hexagonal channel, occupying sites on the c axis at the height of the narrow “bottle necks” for Na, and of the large cavities for H2O and CO2 (Gibbs, 1966, Hochella et al., 1979;
Malcherek et al., 2001; Yakubovich et al., 2004).
Figure I - Schematic view of a portion of the cordierite (a) and beryl (b) structures emphasizing the channels parallel the c axis. Si-containing tetrahedra are shown in blue, Al in tetrahedral and octahedral coordination is shown in orange, Be- containing distorted tetrahedra in dark gray and Mg-octahedra in dark green. The structural position of the channel alkali cations, both orientation types of H2O and CO2 are shown (modified
after Radica et al., 2013)
Beryl (ideal formula (□,Na)Be3Al2Si6O18(□,H2O,CO2) is isostructural with cordierite
the c axis. The hexagonal rings are interconnected parallel to [001] by distorted Be-centered tetrahedra. Al occupies the octahedral sites (Gibbs et al., 1968). Beryl also has structural channels running along the c axis that can contain alkali cations and volatile molecules (Wood and Nassau, 1968).
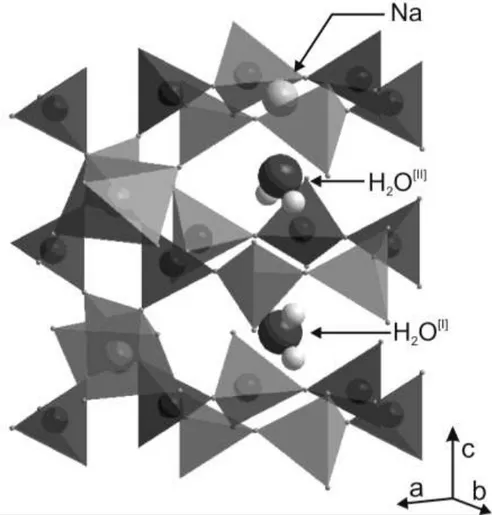
Extra-framework H2O groups occur in the structural channels with the molecular
plane parallel to (100). In both cordierite and beryl H2O can be oriented in two different
ways: type I H2O (hereafter H2O[I]) has its H–H vector oriented parallel to the c axis, and type
II H2O (H2O[II]) has its H–H vector normal to the c axis (parallel to the b axis in cordierite). H2O
groups of the latter type are locally associated with channel cations (Goldmann et al., 1977; Hawthorne and Černý, 1977). Winkler et al. (1994) proposed that H2O[I] in synthetic
Mg-cordierite is rotationally disordered about [001] and that a purely static description is
inappropriate to describe its behavior in the channel cavity. They proposed a model whereby the H...H vector remains parallel to [001] and the H2O molecule rotates in two different
positions about its center of mass with an estimated hopping time of about 6 picoseconds at room temperature; this feature however cannot be observed by using FTIR spectroscopy. The linear CO2 molecules are systematically oriented normal to the c axis and parallel to the
crystallographic a axis for cordierite (Aines and Rossman, 1984;Kolesov and Geiger, 2000; Khomenko and Langer, 2005).
The molecular dimension of H2O is 2.8 X 3.2 X 3.7 Å and CO2 is 2.8 X 2.8 X 5.0 Å
(Wood and Nassau, 1968). However the CO2 molecule barely fits inside the cage, so once
inside it tends to be wedged to the structure behaving as a “plug” (Aines and Rosmann, 1984; Vry et al., 1990). On the opposite, the smaller H2O polar molecules are bonded to the
structure mainly by electrostatic interactions with the structural oxygens (H2O[I]) and alkali
cations (H2O[II]).
Additionally, because of its thermal and mechanical properties, cordierite is used in industrial applications such as high-tech ceramics or as a catalyst in petroleum industry. Beryl is a pegmatitic mineral and has a lower thermal and baric stability; it is well known for providing some of the most notable gemstones, such as the varieties emerald (green), aquamarine (light-blue), heliodor (yellow) or bixbite (red).
4
2. The petrological relevance of cordierite
This PhD Thesis work has been mainly focused on cordierite because it represents the only case of a widespread microporous mineral (pore size under 2 nm, Rouquérol et al., 1994; McCusker et al., 2001) that is able to trap significant amounts of molecular H2O and
CO2 (Schreyer and Yoder 1964; Mirwald et al., 1979; Newton and Wood, 1979; Armbruster
and Bloss 1982; Kurepin 1985) under extreme geological (P, T) conditions. Cordierite stability extends from the amphibolite facies to ultra-high temperature metamorphism to crustal anatexis conditions (Mirwald and Schreyer, 1977; Vry et al.,1990; Carrington and Harley, 1996; Smith 1996; Kalt 2000; Harley et al., 2002; Bertoldi et al., 2004; Sarkar et al., 2010). The analysis of the volatile constituents of cordierite can used to determine the composition of the fluid pahse during crystallization (Vry et al., 1990; Carrington and Harley, 1996; Harley
et al.,2002; Kurepin, 2010). H2O and CO2 contents affect the stability of cordierite (Schreyer
1985; Carey 1995; Harley et al., 2002). Therefore, a quantitative determination of its channel constituents is crucial in petrologic studies.
Among the wide range of cordierite occurrences, the most investigated is the ultra high-temperature metamorphism of pelitic rocks. Dehydration melting of biotite-bearing pelites with moderate to high XMg variations (XMg/XMg+Fe >0.5) is often controlled by
cordierite-forming reactions in migmatites and leuco-granites at 200–700 MPa and 700–900° C (Fitzsimons, 1996; Harley et al., 2002). Thus understanding the role of cordierite as an H2O
and CO2 bearing phase is essential for understanding melting processes and for
thermodynamic calculation of fluid activities during these events (Harley and Thompson, 2004). Kurepin (2010) made calculations of the dependence of H2O and CO2 contents in
cordierite as a function of P, T and fluid composition for the aforementioned P-T conditions, and his thermodynamic model showed a non-ideality of thermodynamic behavior of H2O
and CO2 mixing. In addition evaluation of the H2O and CO2 activities showed that cordierites
in high temperature and pressure assemblages were formed under fluid-saturated conditions over a wide range of H2O/CO2 ratios (Vry et al., 1990; Kurepin, 2010).
In order to understand these mechanisms, several experimental studies on the solubility of volatile components in cordierite have been performed, in particular H2O
others), CO2 (Armbruster and Bloss, 1982, Armbruster, 1985; Le Breton and Schreyer, 1993),
and mixed H2O – CO2 (Johannes and Schreyer 1981; Thompson et al., 2001).
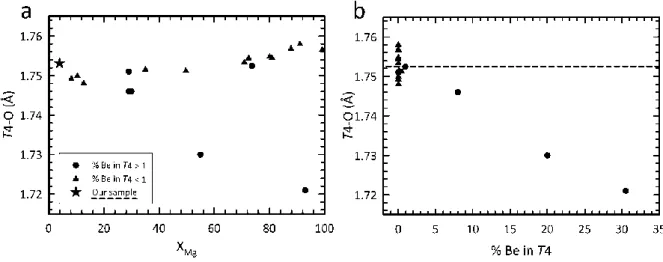
As a result of these studies, there is agreement that pressure exerts a stronger influence on the solubility of both H2O and CO2 than does temperature. Both H2O and CO2
contents slightly decrease with increasing temperature, while increasing pressure favors higher concentrations (e.g. Fig. 2, modified after Harley and Thompson, 2004). It is
important to note that the maximum H2O content obtained at 700 MPa is about 2.4 wt.%,
which is close to the maximum theoretical value of 2.9 wt.% or 1 molecule per formula unit in the channel (Deer et al., 2004). The maximum calculated value for CO2 is about 2.2 wt.%
(Deer et al., 2004) corresponding to about 0.3 molecules per formula unit.
Figure 2 – (a) Pressure – temperature phase diagram of the isopleths of H2O (expressed in wt.%) for XMg = 0.75
cordierite coexisting with pure H2O fluid, as calculated by Harley and Carrington (2001); (b) isopleths of CO2
(expressed in wt.%) for XMg = 0.80 cordierite in a pure fluid after Thompson et al., (2001) and Harley et al.,
(2002).
Studies on XCO2, where XCO2 = CO2/(CO2+H2O), partitioning between melt and
cordierite have shown that H2O tends to be incorporated preferentially into the cordierite
structure, while CO2 preferentially remains in the melt (Fig. 3b and Johannes and Schreyer,
1981). This behavior is only slightly changed at higher temperatures (Harley and Carrington, 2001), while XCO2 increases with increasing pressure, facilitating CO2 uptake (Johannes and
Schreyer, 1981). Moreover, increasing XCO2 decreases significantly the amount of H2O+CO2
diffused into the mineral. In particular, there is a decrease of H2O (Fig. 3a) probably because
the presence of CO2 obstructs its diffusion to the channel ways. This behavior, which is
6
the CO2 molecule inside the channels. Another factor that decreases the total amount of
diffused fluids is the alkali content within the structural channels (Johannes and Schreyer, 1981; Vry et al., 1990). There is evidence suggesting that CO2 (and possibly alkali cations)
may act as plugs in the channel ways obstructing inward and outward molecule diffusion, drastically slowing down the time of degassing and re-equilibration in case of pressure drop (Johannes and Schreyer, 1981; Kalt, 2000). This behavior complicates the possibility to predict the diffused molecules coexisting with mixed H2O and CO2 fluids, although a
theoretical approach has been attempted by Kurepin (2010).
Figure 3 (a) variation of the volatile composition in cordierite (XMg = 0.68) channels with fluid-saturated,
intermediate H2O - CO2 fluid composition. The lines show the calculated values atThompson et al. (2001).
Squares = H2O, triangles = CO2, circles = total number of molecules per formula unit (modified after Thompson
et al., 2001). (b) partition curves showing XCO2 fractioning between cordierite and coexisting fluid at 500 MPa
and 600°C fort two different synthetic cordierites A and B (modified after Johannes and Schreyer, 1981). The experiments were performed with small cordierite grains as starting materials (about 200 µm in Armbruster and Bloss, 1982 and Armbruster, 1985; 125-250 µm in Thompson et al., 2001) in order to maximize the surface-to-volume ratio, and were carried out for a long duration (up to a few weeks) in order to achieve fluid/mineral equilibration. However there is still no agreement on the results, among the different authors. For instance, Johannes and Schreyer (1981) obtained different results as a function of different starting material (Fig. 2b) or grain size of cordierite, and Le Breton and Schreyer (1993) observed a nonlinear behavior of the CO2 contents between 15 minutes to 3 weeks
experimental runs. Major problems arise with CO2 diffusion, because its “sluggish” nature
delays or even prevents sample saturation. Thus, the study of the run products cannot be addressed by conventional bulk methods, such as coulometric tritation (Armbruster and
Bloss, 1982; Johannes and Schreyer, 1981) or powder FTIR spectroscopy (Vry et al., 1990) or single spot micro-analytical techniques, such as SIMS (secondary ion mass spectrometry) (Thompson et al., 2001), which do not allow characterizing the inhomogeneous distribution of the target element. For this reason, we have predominantly used, in this Thesis, single-crystal FTIR spectroscopy to examine the run products, and have developed in particular novel FTIR procedures to characterize the sample inhomogeneities.
3. Advances in FTIR micro-spectroscopy
Several times during this introduction we mentioned that FTIR micro-spectroscopy was chosen as a principal probing tool, and the reason is that FTIR is one of the main tool in Earth Science able to deal with light and crucial elements like H (both as H2O and OH-) and C
(both as CO2 and CO32- groups). Several complementary techniques were developed in the
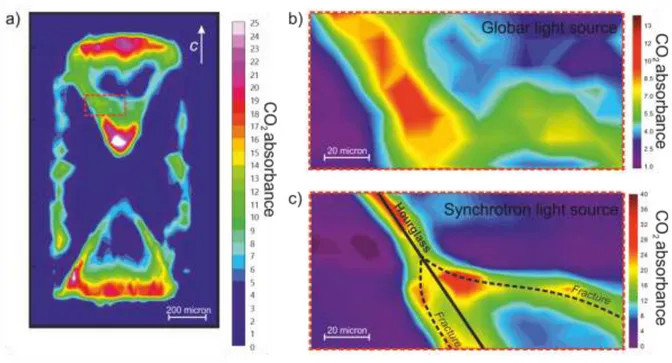
last decades to overcome some of the most common issues occurring in Earth Science. 1) Focal Plane Array (FPA) FTIR imaging and FTIR mapping are extremely important imaging techniques capable of detecting and quantify the distribution of an absorber across a sample. In Earth Science materials these techniques are useful to examine the possible inhomogeneity of natural samples, such as chemical zoning, but also melt/fluid inclusions, structural defect of the occurrence of included micro-phases. Several works have been devoted to this topic, in particular Della Ventura et al. (2010, 2014) revised the data in literature and illustrated the possibilities offered by imaging techniques in Earth Science. During the present Thesis I made extensive use of this technique, in particular each experimental sample was preliminary analyzed through 2D FTIR FPA imaging in order to locate the most suitable spots for CO2 quantitative measurement.
Polarized-light FTIR single spot analysis (Libowitzky and Rossman, 1996) was used for quantitative measurements and to define the orientation of the absorbers in the samples. In addition in Chapter 6 I describe the results of FPA imaging done on oriented single crystals using polarized radiation (Fig. 4a); this is the first time that polarized imaging is applied in Earth Science and the data show that this technique opens interesting scenarios: for instance the work presented in chapter 6 shows how it is possible to map in detail the distribution of absorbers with different orientation in the same section.
8
In this work I also illustrate the possibilities offered by synchrotron-light FTIR mapping. In FTIR spectroscopy the increased brilliance of a synchrotron source translates into improved signal to noise ratio in 2D FPA imaging and thus in a higher spatial resolution for spot measurements and mapping (Della Ventura et al., 2014). In Figure 4 I reported for comparison the contour map of CO2 distribution in the same area of a thermally-treated
beryl sample obtained using a conventional Globar source (Fig. 4b) and a synchrotron source (Fig. 4c).
Figure 4 – (a) FTIR-FPA contour map of CO2 distribution collected for Ec in a beryl sample treated at 800 °C
and 500 MPa, 4 days. (b) Enlargement of (a) showing the CO2 distribution obtained with conventional light,
spot size 20 x 20 µm, sampling step 10 µm, and (c) obtained with synchrotron light with spot size 10 x 10 µm, sampling step 5 µm. Chromatic scale is proportional to the CO2 content, units are arbitrary. See Chapter 6.
2) In-situ FTIR techniques were developed to study phase equilibria and kinetic process at extreme pressures and temperatures using diamond anvil cells (DAC) and heating stages (Koch-Müller et al., 2003, Iezzi et al., 2006, 2009, Keppler and Smyth, 2006;
Hawthorne et al., 2007, Welch et al., 2007, Della Ventura et al., 2010, 2014). In Chapter 3 and 4 of this Thesis I will describe the CO2 absorbance variations in cordierite up to 1200 °C
and the kinetic of CO2 expulsion from the structural channels. In-situ high temperature
measurements up to 1200 °C could be performed for the first time using a modified heating stage capable to operate at extreme temperatures directly under the IR microscope (Fig. 5a).
Figure 5 - The used Linkam TS 1400XY Heating stage, modified to work under the FTIR microscope (a). Schematic layout (b).
The kinetic of CO2 expulsion was studies using two different sections with different
thickness; to collect the spectra for the thinner 19 µm slice with enough S/R we used a synchrotron light source, because the reduced thickness of the samples coupled with the strong beam absorbance caused by the stage windows, sample holder and polarizers (Fig. 5b) affected significantly the transmitted signal.
10
S
UMMARY
Section I: Structural and spectroscopic characterization of cordierite
(Chapters 1 and 2).
Eight different cordierite samples (Chapter 1) from different localities and geological occurrences were chosen to cover a wide range in H2O/CO2 ratio.
Single-crystal X-ray diffraction data were collected on optically clean grains free from inclusions and alteration products at CNR Istituto di Cristallografia (Bari) with a Nonius Kappa CCD area detector diffractometer, revealing all samples to be orthorhombic Cccm. Major oxides were analysed by EMPA while H and C were quantified by SIMS (secondary ion mass spectrometry). Accordingly, the Si:Al ratio is close to 5:4; XMg ranges from 76.31 to 96.63;
extraframework K and Ca are negligible, with Na up to 0.84 apfu. SIMS shows H2O up to 1.52
and CO2 up to 1.11 wt%.
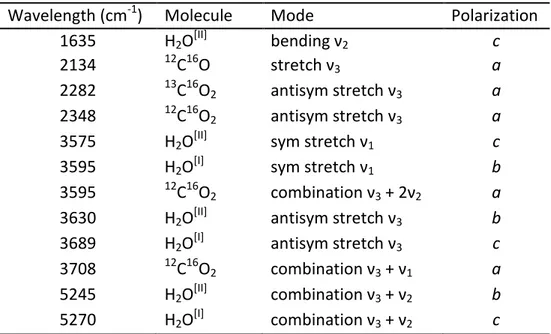
Figure 1 - Selected single-crystal polarized-light FTIR spectra of cordierite along the principal optical directions, peak identification after Della Ventura et al., (2009).
Optically transparent single-crystals were oriented using the spindle-stage and examined by FTIR micro-spectroscopy under polarized light. The observed bands were assigned to water molecules in two different orientations H2O[I] and H2O[II], and to CO2
molecules in the structural channels (Fig. 1). Prior to the quantitative analyses, the samples were examined for their water and carbon dioxide distribution using a focal-plane-array (FPA) of detectors. The evidence was that at the µm-scale the distribution of H and C in cordierite were significantly inhomogeneous, particularly for H2O, whose zoning within the crystal can be
strongly affected by the geological history of the mineral after its formation.
The core of this work was the quantitative calibration of H2O and CO2 in cordierite
based on single-crystal FTIR micro-spectroscopy (Fig. 1), based on the Beer-Lambert relationship.
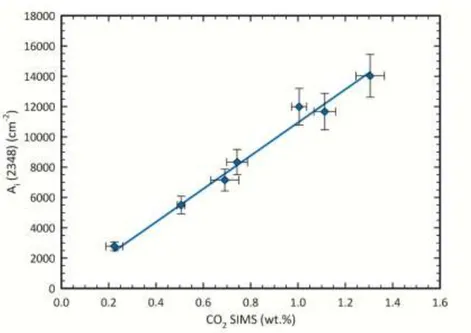
Figure 2 - Relationship between the analysed (SIMS) CO2 content and the integrated absorption coefficient
(ai=Ai/t) for the studied cordierites. The calibration curve provides the specific absorption coefficient (ε) to be
used in the Beer-Lambert equation for the spectroscopic quantitative analysis of CO2 in cordierite.
For H2O the integrated molar coefficients for type I and type II water molecules were
calculated separately and turned out to be [I]ε = 5000 ± 1000 l∙mol-1∙cm-2 and [II]ε = 13200 ± 500 l∙mol-1∙cm-2, respectively. For CO2 the integrated coefficient is εCO2 = 19000 ± 1000 l∙mol-1∙cm-2.
The same procedure just illustrated was then applied to the Fe end-member of the cordierite group, sekaninaite (Chapter 2). Additionally single crystal X-ray refinement, laser ablation mass-spectroscopy for Li+ and Raman spectroscopy characterization were performed.
12
Electron-micro-probe analysis shows the sample to be close to the Fe end-member [XFe =
Fe/(Fe+Mg) = 94%) with significant Mn (1.48 wt.%); laser ablation mass-spectrometry showed the presence of 0.42 wt.% Li2O. H2O and CO2 contents (1.48 and 0.17 wt.%,
respectively) were determined via secondary-ion mass-spectrometry (SIMS). X-ray site occupancy refinement suggested that the lack of monovalent charge at the octahedral site due to the presence of Li+, is counter-balanced by the presence of Na+ in the channel.
Sample homogeneity was confirmed by FPA imaging (Fig. 3) and single-crystal FTIR spectroscopy confirmed the presence of two types of H2O groups in different orientations
(with prevalence of the type II orientation).
Using the Beer-Lambert relation, integrated molar coefficients εi were calculated for
both types of H2O (εi H2O[I] = 6000±2000; εi H2O[II] = 13000±1000) and for CO2 (εi CO2 =
2000±1000).
Fig. 6. FTIR FPA image of the (100) section, 47 µm thick slab of sekaninaite. Integration of the H2O stretching
bands in the range 3500-3700 cm-1. The chromatic scale is proportional to volatile contents, units are arbitrary. The integrated molar absorption coefficients ε for H2O are very close to those
reported for Mg-rich cordierite in Chapter 1. On the other hand, the value of εiCO2 obtained
here cannot be considered reliable because of the uncertainty of the SIMS data, which is > 50%. However, it is close to the one calibrated by Della Ventura et al. (2006) from a CO2
Section II: In-situ HT-IR spectroscopy and kinetic study of CO
2expulsion from cordierite (Chapters 3 and 4).
In this section I will describe the in situ HT-FTIR micro-spectroscopy of cordierite and will evaluate the kinetic and diffusion parameters of CO2 expulsion as a function of
increasing T. Experiments were performed using a Linkam TS 1400 XY heating stage at LNF-INFN and at beamline B22, Diamond Light Source laboratory Oxford (UK). Fragments of two natural cordierites, BM 96512 from Cabo de Gata (Almaria region, Spain) and Rp 3237 from Kragero (Arendal region, Norway) were used.
In a first series of step-heating experiments, the (001) section of cordierite Rp 3237 was heated up to 1000 °C with a rate of 20 °C/min and FTIR spectra were collected for every step. At the end of the run, the sample was allowed to cool down to RT and a spectrum was measured, than was heated up at 1100 °C (rate 100 °C/min) and then cooled down again at
RT; spectra were collected at 1100 °C and at RT. A second series of experiments was
performed heating up the (010) section with a rate of 100 °C/min up to 600 °C;
measurements were performed every 100°C during the ramp. Then the sample was cooled down to RT and heated up again up to 600 °C with a rate of 100 °C/min. The same procedure was repeated at 800, 900, 1000, 1100 and 1200 °C. FTIR spectra were collected at RT and at any target temperature every 50 °C. After each experiment FPA-FTIR images were collected to check for the homogeneity of residual CO2.
In-situ measurements on (001) oriented sections that up to T > 800 °C there is a
significant intensity increase of the CO2 stretching mode at 2348 cm-1, followed by a sudden
decrease for T > 900°C; the absorbance is virtually zero at 1000°C (Fig. 7a). On the opposite, the integrated absorbance (Ai) of the CO2 (ν3 + ν1) combination mode at 3708 cm-1 (Fig. 7a) is
almost constant up to about 450 °C, then decrease up to 850 °C. For higher T the intensity decreases with a much faster rate; the band disappears at 950°C. Similar trends for the (010) section cut out from the same cordierite crystal (Fig. 7c).
The evolution of the H2O absorbance as a function of increasing T is extremely
different to that of CO2 (Fig. 7a and b, in purple), and shows a linear and constant decrease
of 50% of the intensity up to 800°C; in the 800°-900°C range there is a sudden drop and at 950°C the sample is completely anhydrous. Similarly to what observed for CO2, the data
14
constant up to 800°C and suddenly drops in the 800-900°C range. At 1000° the sample is completely anhydrous
Figure 7 - (a) Sample Rp 3237 (001) section: integrated absorbance variation (ART% in %) of H2O (purple
triangles), CO2 stretching mode (filled orange squares) and CO2 combination mode (open orange squares).
Sample Rp 3237_14 (010) section: integrated absorbance variation (ART% in %) of H2O (b) and CO2 (c)
absorptions. In (b) and (c) the intensities measured after quencing the sample are given for comparison (dashed black lines). The shaded areas represent the estimated error on ART%.
Several authors (e.g. Keppler and Bagdassorov, 1993; Yamagishi et al., 1997; Zhang et
al., 2007; Tokiwai and Nakashima, 2010b) revised recently the absorbance in minerals and
glasses in HT-FTIR spectroscopy and showed that the intensity measured during in situ data collection is not related to the concentration of the target absorber via the same Beer-Lambert relationship calibrated at room-T. This feature is shown in Figure 7, where it is evident that in situ FTIR data collection does not provide a real estimate of the CO2 and H2O
behavior in cordierite as a function of increasing T. In particular, based on the Beer-Lambert relationship, assuming no or negligible change in the sample thickness across the studied T range, the trends of Figure 7 suggest a significant change in the molar absorption
coefficients ε for both volatile species at varying T.
Interestingly, as already observed for H2O/OH in several mineral species (Zhang et al.,
2007) the temperature dependence of the principal modes is different from that of multi-phonon bands (Fig. 7a and c open squares).
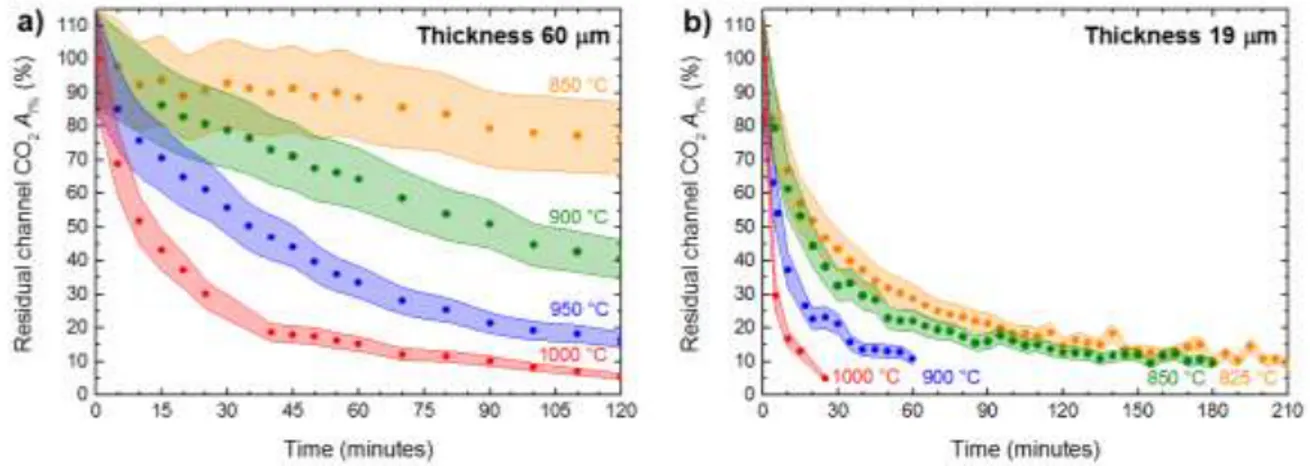
Continuous heating experiments were performed on (001) oriented BM 96512 cordierite slabs. Two fragments were double-polished at 60 µm and 19 µm, respectively and broke up into four pieces each. Four fragments of the same 60 µm thick section were heated to 850, 900, 950 and 1000 °C (heating rate 100°C/min) and kept at the target T for two hours. Polarized spectra were collected using conventional light with both E//a and E//b at
RT before the experiment, and at the target T, every 5 minutes for the first hour and every
19 µm thick BM 96512 slab were heated to 825, 850, 900 and 1000 °C (heating rate 100°C/min) at different annealing times. For this second set of samples, spectra were collected using synchrotron light exclusively along the a crystallographic direction at RT and at the target T every 5 minutes. This experimental layout was necessary to get a better S/N because the reduced thickness of the samples coupled with the strong beam absorbance caused by the stage windows, sample holder and polarizers affected significantly the transmitted signal.
Figure 8 shows the CO2 loss curves expressed as 𝐴𝑡% = 100 · 𝐴𝑡/𝐴0 where At is the
Ai at time = t and A0 is Ai at time = 0, i.e. just after the sample reached the target temperature; data obtained with E//a for the ν3 mode at 2348 cm-1 for the 60 µm thick
BM96512 and the 19 µm thick BM96512 (001) sections are displayed.
Figure 8 – Isothermal plots of residual CO2 within the cordierite channels (At% = 100·At/A0 of the 2348 cm-1
band) as a function of time; sample BM96512, (001) section for E//a. Shaded areas represent the estimated error on the absorption. (a) 60 µm thick section, (b) 19 µm thick section.
The curves in Figure 8 were fitted using three different approaches: the Avrami JMAK rate equation (Hancock and Sharp, 1972), the Avrami Putnis rate equation (Putnis, 1992) and the mono-dimensional plane sheet diffusion (Ingrin, 1995).
Activation energies calculated using the Avrami approaches yield four different results on the basis of the used formula and the sample thickness. However, based on different assumptions, it is possible to conclude that the most reliable activation energy for CO2 expulsion from cordierite provided by the Avrami formalism is Ea = 138±12 kJ/mol, i.e. the value obtained using the Avrami Putnis equation on the thinner sample data set. This
16
value is very close to those obtained by previous authors for the dehydration of cordierite (Giampaolo and Putnis, 1989).
Using the mono-dimensional plane sheet diffusion approach it was possible to evaluate both the diffusion coefficient D and the activation energy Ea for CO2 in cordierite.
Results confirmed that this approach is not influenced by sample thickness variation and fitted data for both sample set yield a value of –logD0 = 4.4±0.7 m2/sec and Ea = 204±15 kJ/mol.
Section III: Experimental diffusion of CO
2in cordierite and beryl at
different PTt conditions (Chapter 5).
In this section I examined the interaction of cordierite with a CO2–rich fluid under
different experimental P, T, t conditions and evaluated the diffusion coefficients within the crystals. Experiments were performed using a non-end loaded piston cylinder apparatus (QUICKpress™ design by Depths of the Earth Co. Fig. 9a). FTIR spectra were acquired using a Bruker™ Hyperion 3000 microscope (Fig. 9b) at Laboratori Nazionali di Frascati-Istituto Nazionale di Fisica Nucleare (LNF-INFN,) Frascati (Rome).
Figure 9 - (a) QUICKpress™ Non end-load Piston-cylinder Press, (b) Bruker Hyperion 3000™ FTIR microscope equipped with FPA detector. (c) Fragments of the cordierite sample RP 7344 from Karur, India and (d) a cluster of green synthetic beryls (photo courtesy of Roberto Pucci).
Several cordierite fragments (Mg-cordierite sample RP 7344 from Karur, Tamil Nadu, Chapter 1) were separated from a large single crystal (Fig. 9c). Before the experiments, the grains were pre-treated at 1250 °C for 24 hour in order to remove all H2O and CO2 from the
18
during the heat-treatment. Beryl samples are from the very first flux-grown synthetic emeralds made by P.G. Hautefueille and A. Perrey in 1888 in Paris (Bellatreccia et al., 2008); samples show a perfect prismatic hexagonal habitus with a maximum length of 1 mm and width of 0.5 mm (Fig. 9d).
The experiments were carried in 3 x 9 mm Pt capsules; silver carbonate was used as a CO2 source. Al2O3 powder was mixed in 1 to 1 ratio by wt. with Ag2CO3, and added to the
charge. The aluminum oxide powder was used to prevent the contact between the crystals and the capsule walls after the silver carbonate disappearance due to its decomposition. Layers of Ag2CO3/Al2O3 mix were alternated to layers of starting crystals (Fig. 10a). Each
capsule contained from 4 to 7 grains of cordierite/beryl, for a total crystal weight of 2 to 10 mg. All components used to prepare the tubes were dried up at 110 °C
Figure 10 – (a) Schematic section of the layered crystal/filler assemblage within the capsule, (b) schematic cross section a 19-25 mm and 25 mm furnace assembly (modified after Masotta et al., 2012b).
Piston cylinder experiments were conducted using two different set-ups (Fig. 10b): using a standard 19 mm assembly (Moore et al., 2008), operating at P from 300 to 800 MPa and a 19-25 or 25 mm assembly (P from 150 to 300 MPa). The 25 mm assembly may
accommodate up to 4 samples in a single run (Masotta et al., 2012b). We used a NaCl-Pyrex-Graphite-crushable-MgO–pyrex assembly with capsule surrounded by pyrex powder instead of pyrophyllite to avoid water infiltration. Temperature was controlled using a C-type
(W95Re5 – W74Re26) thermocouple with a ±5 °C uncertainty (Holtz et al., 2001). Heating rates
were set to 100 °C/min; the isobaric quenching rate ranged from 50 °C/s (25 mm assembly) to 100 °C/s (19 mm and 19-25 mm assembly) in the first 5 seconds (Masotta et al., 2012b). Experiments were performed in the pressure range 200 – 700 MPa, temperature range 700 – 900 °C; run duration varied from 1 to 72 hours.
Figure 11 - (left) Unpolarized single-crystal spectra of a cordierite before and after treated at 900 °C and 500 MPa for 1 hour (CRD_Pr 15). (right) Unpolarized single-crystal spectra of a beryl before and after treated at 800 °C and 500 MPa for 10 hour (Pa_340 t).
Preliminary FTIR single spot measurements confirmed that H2O and CO2 had been
diffused in the samples (Fig. 11), however an evident heterogeneity in carbon dioxide absorbance was observed. Therefore all samples were carefully examined by FPA to locate the area suitable for analytical spots. In particular FPA imaging revealed that the CO2
diffusion in both cordierite and beryl proceeds exclusively along the structural channels (Fig. 12). FPA images also showed a strong enhancement of the CO2 diffusion along cracks.
On the basis of these results we located the most suitable area for the analytical spots avoided measurements close to fractures; the beam size was kept as small as possible, usually at 20x20 µm2 and the highest absorbance values were selected as representative of the CO2 content of the sample.
The CO2 contents were calculated from polarized FTIR spectra using the
Beer-Lambert relationship using the procedure described in Della Ventura et al. (2010). Final data shows that T plays only a minor role on the CO2 diffusion for both
cordierite and beryl, while pressure has a significant effect. In particular, beryl shows a steep increase in CO2 content from 200 MPa to 500 MPa and from 500 MPa to 700 MPa. The CO2
contents in cordierite, on the other side, show only a minor increase from 200 MPa to 500 MPa, with a significant jump from 500 MPa to 700 MPa.
20
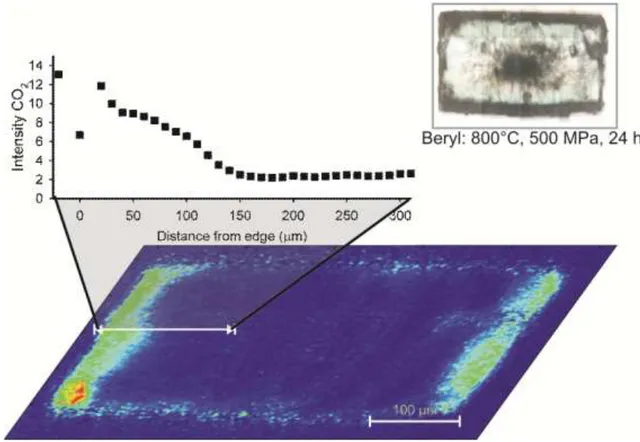
Figure 12 - FPA image and FTIR diffusion profile of beryl Pa_340 d bis treated at 800°C and 500 MPa for 24 hours.
The diffusion coefficient (D) for beryl was obtained by fitting the concentration profiles (Fig. 12) using a simple mono dimensional equation (Crank, 1975, Zhang and Cherniak, 2010):
𝐶 = 𝐶0 ∙ 𝑒𝑟𝑓𝑐 𝑥 2 𝐷𝑡
where C is the concentration at depth x (m) from the sample rim, C0 is the maximum concentration, D is the diffusion coefficient (m2/s), t is the time duration (s), and erfc is the complementary error function. Obtained D values range from 7.6E-13 to 6.3E-14 for cordierite, and 1.1E-14 to 9.5E-14 for beryl.
Activation energy (Ea) and pre-exponential factor (-logD0) were determined fitting the data on the basis of the Arrhenius equation.
log 𝐷 = log 𝐷0 − 𝐸𝑎/𝑅 ∙ ln(10) ∙ 1/𝑇
Mean activation energy (Ea) for beryl data is 122±15 kJ/mol with a pre-exponential
Section IV: The diffusion of volatiles in hourglass zoned beryl, the
coordination environment of H
2O in low-water samples and
comments on the geological storage of CO
2in beryl (Chapters 6, 7
and 8).
Chapters 6 and 7 deal with some particular features observed during the present Thesis, i.e. the role of chemical inhomogeneity in the diffusion of CO2 in beryl, and the
coordination environment of H2O in the channels.
Some synthetic samples used for the diffusion experiments had a typical hourglass structure due to the distribution of Cr during the crystal growth (e.g. Bellatreccia et al., 2008). After the experimental run, the FTIR-FPA imaging of these sample showed an unexpected distribution of the diffused molecules within the channels (Fig. 14): CO2
apparently diffuses following the hourglass boundaries, while H2O[II] is homogeneously
distributed except along the hourglass traces.
Figure 14 – Polarized light FPA images of the beryl sample treated for four days at 800°C, 500 MPa. Optical image of the grain (a), E//c FTIR-FPA map of H2O[I] (b) and H2O[II] (c) distribution, and (d) Ec FPA map of CO2.
Chromatic scale is proportional to CO2 content.
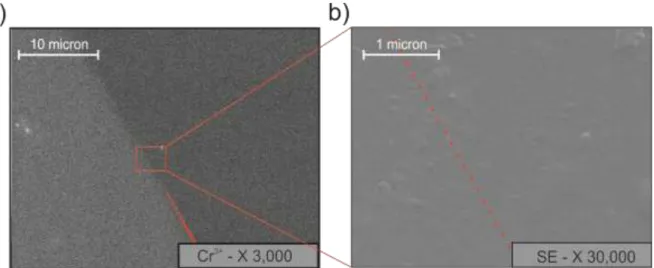
Considering that the carbon dioxide diffusion in beryl and cordierite is significantly enhanced by the presence of fractures (chapter 5) we performed high-resolution FESEM imaging (Fig. 15) to check for the possible presence of physical discontinuities across the hourglass boundary. The results showed that indeed the hourglass structure was exclusively due to a chemical zoning, thus suggesting that the diffusion pattern of CO2 observed in
22
Figure 14 must be related to a kind of defect fast-path diffusion mechanism (Zhang et al., 2006).
Figure 15 – Field Emission SEM pictures of the treated beryl sample in correspondence of the “hourglass” structure in a fracture free area. (a) EDS chemical mapping of Cr3+ zoning. (b) topological Secondary Electron (SE) images of the highlighted area. The red dashed line indicates the limit of the “hourglass” sector zoning.
TOF-SIMS chemical maps showed K is enriched along the hourglass boundary, while Na is depleted. Considering that H2O[II] is preferentially associated Na+ cations inside the
channels it is reasonable to infer that H2O[II] depletion along the hourglass discontinuity is
the result of the increased K+ content at the expense of Na occurring along these chemical boundary.
As explained in chapter 5, the HT/HP experiments aimed at the CO2 diffusion across
cordierite and beryl were done using a piston-cylinder apparatus, where the pressure was mechanically and not hydrothermally increased. The infrared spectra of the run products, as expected, showed the presence of significant CO2 but also of minor H2O; due to the
experimental conditions, this water content must be related to moisture present in the starting products used for the synthesis, thus its bulk amount is very low. Single-spot spectra collected along profiles parallel to the c crystallographic axis show subtle changes as a function of the distance from the crystal edge; these changes can be correlated to a progressive change in the H2O coordination environment in the channel (Fig. 16), as a
response to the varying H2O/alkali content. In particular, the data show that when 2·H2O >
Na+ apfu, H2O can assume both type I and type II orientation; in the latter case, each Na
H2O[II] molecules are singly coordinated to each Na cation. The same type of feature is
observed and commented for the structurally related cordierite.
Figure 16 – Concentration trend of selected peak for sample Pa 340_o treated at 800 °C. Peak intensity were scaled to the maximum intensity. A schematic representation of the configuration of water molecules inside the structural channels of beryl, as the overall water content decreases in given above.
The implication of this finding is that H2O in beryl and in cordierite is trapped in the
structural channel following very different bonding environments, and this has a significant consequence on the diffusion rates (both inward and outward) obtained in experiments and hence on the calculation of thermodynamic properties from the observed data. For
24
indicator of the fluid system in equilibrium with the rock, the different diffusion mechanisms of water and CO2 could affect the closing temperatures modeled on the basis of field studies.
Chapter 8 reports a short paper in press on the Rendiconti Online della Società
Geologica Italiana discussing problems related to the permanent storage of carbon dioxide
PUBLISHED ON CONTRIBUTION TO MINERALOGY AND PETROLOGY (JULY 2012)
DOI 10.1007/s00410-012-0779-8
C
HAPTER
1
QUANTITATIVE
ANALYSIS
OF
H
2O
AND
CO
2IN
CORDIERITE
USING
POLARIZED
FTIR
SPECTROSCOPY
Giancarlo Della Ventura
1,2,3, Francesco Radica
1, Fabio Bellatreccia
1,2, Andrea
Cavallo
3, Francesco Capitelli
4and Simon Harley
51
Dipartimento di Scienze Geologiche, Università Roma Tre, Largo S. Leonardo Murialdo 1, I-00146 Roma, Italy
2
LNF-INFN, Via E. Fermi 40, Frascati (Roma), Italy
3
INGV, Via di Vigna Murata 605, Roma, Italy
4
Institute of Crystallography, CNR, Via Salaria Km 29,300, 00016 Monterotondo, Roma (Italy)
5
School of GeoSciences, University of Edinburgh, Kings Buildings, West Mains Road, Edinburgh EH9 3JW, Scotland, UK
Abstract
We report a FTIR (Fourier-transform infrared) study of a set of cordierite samples from different occurrence and with different H2O/CO2 content. The specimens were fully
X-26
ray diffraction, EMPA (electron micro probe analysis), SIMS (secondary ion mass
spectrometry), and FTIR spectroscopy. All cordierites are orthorhombic Ccmm. According to the EMPA data, the Si:Al ratio is always close to 5:4; XMg ranges from 76.31 to 96.63 and
additional octahedral constituents occur in very small amounts. Extraframework K and Ca are negligible, while Na reach values up to 0.84 apfu. SIMS shows H2O up to 1.52 and CO2 up
to 1.11 wt%.
Optically transparent single-crystals were oriented using the spindle-stage and examined by FTIR micro-spectroscopy under polarized light. On the basis of the polarizing behaviour, the observed bands were assigned to water molecules in two different
orientations and to CO2 molecules in the structural channels. The IR spectra also show the
presence of small amounts of CO in the samples. Refined integrated molar absorption coefficients were calibrated for the quantitative microanalysis of both H2O and CO2 in
cordierite based on single-crystal polarized-light FTIR spectroscopy. For H2O the integrated 3 modes) were calculated
separately and are [I] -1∙cm-2 and [II] -1∙cm-2, respectively. For CO2 CO2 = 19000 ± 2000 l∙mol-1∙cm-2.
Key words: cordierite, EMPA and SIMS, polarised FTIR spectroscopy, quantitative H2O and CO2 analysis.
1. Introduction
Cordierite, ideally (Mg,Fe)2Al4Si5O18, is a unique case of a microporous mineral
stable under geological conditions spanning from the amphibolite facies to UHT metamorphism to crustal anatexis (Vry et al. 1990; Carrington and Harley 1995, 1996; Smith 1996; Kalt 2000; Harley et al. 2002; Bertoldi et al. 2004). Because of its
structural channels, cordierite is able to trap H2O and CO2 (Schreyer and Yoder 1964;
Armbruster and Bloss 1980; Kurepin 1985; Schreyer 1985; Carey 1995), but also hydrocarbons (Zimmermann 1981; Mottana et al. 1983; Khomenko and Langer 1999), CO (Khomenko and Langer 2005; Della Ventura et al. 2009), Ar (Armbruster 1985; Schreyer 1985) and N2 (Armbruster 1985; Cesare et al. 2007). For this reason, the
analysis of the volatile constituents of cordierite can be a very useful tool to define the composition of coexisting fluids during its formation (e.g. Vry et al. 1990; Visser et al. 1994; Carrington and Harley 1996; Kalt 2000; Harley et al. 2002). Moreover, H2O
and CO2 contents may significantly affect the stability of cordierite (e.g. Schreyer
1985; Carey 1995; Harley et al. 2002), therefore the quantitative evaluation of the channel constituents is crucial in petrologic studies.
The microanalysis of light elements like hydrogen and carbon is still extremely complex (e.g. Rossman, 2006); due to their low atomic number these elements cannot be easily studied by electron microprobe; moreover H and C are very poor X-rays scatterers hence they cannot be studied with conventional X-rays diffraction methods.
On the other hand, infrared spectroscopy is an efficient technique to detect the volatile components within the structural pores of cordierite (Farrell and Newnham 1967; Goldman et al. 1977; Aines and Rossman 1984; Le Breton 1989; Kolesov and Geiger 2000; Khomenko and Langer 2005; Rigby et al. 2008, Della Ventura et al. 2009); coupled with well-tested methods for volatile quantification like secondary ion mass spectroscopy (e.g.
Thompson et al. 2001), it can be a simple yet powerful tool for sample volatile quantification (Della Ventura et al. 2009). In addition, IR has the distinguishing advantage of providing information on the closest structural environment of the target element, its molecular arrangement (for example OH vs H2O, CO2 vs CO3) and the orientation of the molecules
within the structure. Moreover, by using the modern techniques of FTIR imaging with the bi-dimensional focal plane array of detectors (FPA), enables detection of the zoning of volatile species across the studied sample.
Despite the large number of studies, a calibration for unambiguous infrared quantitative analysis of H2O and CO2 in cordierite is still lacking. The quantitative
determination of an absorber (c, concentration) in a mineral is based on the Beer-Lambert law: c = Ai /(t i), where Ai (cm-1) = integrated absorbance, t (cm) = sample thickness and i
(cm-2 per mol H2O/L) = integrated molar absorption coefficient. Ai and t are measured, but the i coefficient must be calibrated for any mineral matrix by combining an independent method. Libowitzky and Rossman (1996) definitively showed that for quantitative purposes the measurement of the absorbance in anisotropic minerals must be obtained summing-up the integrated absorbance along the three principal optical directions. For orthorhombic cordierite thus Ai = Ax + Ay + Az.
28
For H2O, the only molar absorption coefficient available for cordierite has been
calibrated by Goldman et al. (1977) using linear (peak height) intensity data, while the only coefficient available for CO2 has been recently calibrated by Della Ventura et al. (2009) on
one cordierite crystal from a partially melted graphite-bearing granulitic enclave within the dacitic lava dome of El Hoyazo (SE Spain). According to Della Ventura et al. (2009) several problems are involved in the analysis of cordierite, primarily the possible zoning of H2O/CO2
in the sample and the widespread presence of inclusions or alteration products even in apparently gemmy crystals.
We address in this paper the calibration for a reliable analysis in cordierite by studying a set of samples from different occurrences.
2. Samples and analytical methods
Eight different cordierite samples (Table 1) from different localities and geological occurrences were chosen for this work such as to cover a wide range in the H2O/CO2 ratio.
The crystals used for the spectroscopic data collection were previously fully characterized using a multidisciplinary approach.
Table 1- Sample labels and occurrence of the studied samples.
Sample Occurrence
BM 96512 Cabo de Gata, Almaria Region, Spain 8/90 Serre Massiff, Calabria, Italy
RIG Unknown
BB3a Brattstrand Bluffs, Prydz Bay, Antarctica Rp 7344 Karur, Tamil Nadu, India
Rp 5578 Tsihombe, Madagascar Rp 3237 Kragero, Arendal, Norway Rp 7045 Region de Bekily, Madagascar
Single-crystal X-ray diffraction data were collected on optically clean grains free from inclusions and alteration products at CNR Istituto di Cristallografia (Bari) with a Nonius Kappa CCD area detector diffractometer, using Mo-K radiation ( = 0.71073 Å). Cell refinement and data reduction was performed via EvalCCD (Duisenberg et al. 2003) and absorption correction via
SADABS (Sheldrick 1996).
The structures were solved through the Direct Methods procedure of SIR2008 (Burla et al. 2007), within the orthorombic space group Cccm, and refined by a full-matrix least-square
techniques based on F2 using SHELX-97 (Sheldrick 1997).
The electron microprobe analyses (EMPA) were done using a Joel JXA 8200 WD-ED at the Istituto Nazionale di Geofisica e Vulcanologia (INGV), Roma. Working conditions were 15 kV accelerating voltage, 7 nA sample current, 5 µm beam diameter, counting times: 10 seconds on the peak and 5 seconds on the background on both sides of the peak. The standards, spectral lines and crystals used were: albite (NaKα, TAP), pargasite (CaKα, PET), wollastonite (SiKα, PET), k-feldspar (KKα, PET), kyanite (AlKα, TAP), pargasite (MgKα, TAP), augite (FeKα, LIF), titan oxyde (TiKα, LIF) and spessartine (MnKα, LIF). Data correction was performed using the ZAF method. Sample homogeneity was verified collecting several spots per crystal.
The H2O and CO2 contents were quantified by SIMS
(secondary-ion-mass-spectrometry) using a Cameca IMS4f ion microprobe at EMMAC, the University of Edinburgh. Procedures follow those described in previous cordierite studies from the Edinburgh laboratory (Harley and Carrington 2001; Thompson et al. 2001; Harley et al. 2002). A 2.58 cm diameter analysis block incorporating the studied samples, and two standard cordierite grains (ANMH with XMg = 0.89; H2O = 1.54 wt%; and CO2 = 0.7 wt% and
8/90 with XMg = 0.75; H2O = 0.81 %; and CO2 = 1.31 wt%: Thompson et al. 2001) was
prepared, coated with gold, and inserted into the IMS4f sample change chamber for
overnight pump-down prior to in-situ SIMS analysis. Negative secondary ions 1H, 12C and 28Si were measured at an energy offset of 75 V and energy window of 19 eV, under operating conditions of 4500 V secondary beam voltage and 8 nA and 10 kV for the primary beam of O -ions. Under these conditions the primary ion beam sputters an elliptical analysis pit with long diameter 25-30 µm and maximum depth of 3 µm. All analyses involved a 3 minute burn-in time followed by 20 cycles of 5 second counts for each isotope. The mean isotope ratios of
1
H/28Si and 12C/28Si for the last 10 cycles in each analysis has been taken as the final results, thereby avoiding surface contamination. Analyses expressed as isotopic ratios of 1H/28Si and
12
C/28Si were converted to wt% H2O or CO2 by comparison with the calibration lines
produced from fitting two standards analysed several times throughout the same analytical session.