Standard And Innovative Energy Improvement
Strategies In School Buildings Through
Numerical Analysis
A case study in Italy
Paolo Zazzini and Cinzia Pellegrino Department INGEO, University “G. D’Annunzio”Pescara, Italy [email protected]
Abstract— This paper deals with the energy saving strategies adopted in school buildings in Italy. It presents the energy requalification and the inner quality check of a school building in Southern Italy, as a case study. The authors carried out a dynamic simulation of the energy performance of the building through the soft-ware Design-Builder, based on data registered during the monitoring process. They calculated the main index of energy consumption with the aim to determine the most efficient energy saving strategies, considering the technical-economic possibilities too. The numerical analysis allowed evaluating the influence of dynamic/thermal properties of the building, comparing the behavior of five different vertical opaque existing envelopes. The paper shows how standard energy saving interventions, named low and medium-impact operations, are less effective than innovative high-impact ones that consider the possibility to increase the thermal mass of the envelopes, although with a higher economic effort. This is particularly true during winter and specifically in the considered climatic contest.
Keywords—Energy improvement, energy saving, school buildings, Design Builder.
I. INTRODUCTION
School buildings are usually interested by high-energy consumption, regarding heating, cooling, electric lighting and domestic hot water. They belong to the public buildings category, about which many scientific investigations have been carried out by numerous authors in order to propose energy saving strategies [1, 2, 3, 4, 5]. They are a considerable part of the public assets in the existing building park in Italy [6]. Nonetheless, they have been involved in national investment projects only in recent years. For this reason, Italian school buildings have a negative energy output compared to the standards set by the national legislation [7, 8] included in Directive 2002/91/EC [9]. This topic may be considered a real national emergency in Italy [10, 11]. All this is confirmed by the MIUR Observatory for Scholastic Buildings [12], which got a complete report of national scholastic buildings. According to it, there are too many old schools whose structures are obsolete and not properly performing from the energy point of view in relation to the generally mild Italian climate. In particular, the 55% of 42.292 recorded school buildings were built before
1976, without any energy saving normative. After 1976, schools were built according to Ordinary law of Parliament n° 373/76 (“Terms for reducing energetic consume for thermal purpose in buildings”); their standards were sufficient in the 80s, but they don't fit today requirements. According to law 9 January 1991 n° 10 (“Terms of the actualization of the National Energetic Plan concerning a rational use of energy, energy saving and developing renewable energy”), schools have to actuate an energy saving policy and use renewable energy sources. The missing application of this policy has produced a building park insufficient to European standards [13]; Italian schools use 100 kWh/m2 every year just for the heating system [14]. The age of a building has direct consequences on the building state. Buildings constructed between 1976 and 1991 present low quality technologies, which cause heat losses, thermal bridges, humidity, condensation, water infiltration from facade and roof, air and water infiltration from shutters. These deficiencies affect negatively both air quality and energy performances. The decay of internal air quality also depends on the usage of buildings and, specifically, of the single rooms. In fact, there is often a lack of ventilation and fresh air circulation, which are indispensable to eliminate indoor contamination due to occupants' metabolism [15]. Right now Italian schools’ total energy consumption arrives to 13 TWh/year, of which 72 % is used for the heating system and 28 % for electricity [16].
Dependence on imports of primary energy in Italy amounts to about 85%, against 50% in France, 61% in Germany, 77% in Spain and 8% in the United Kingdom. Depending on foreign sources of primary energy impacts on the country security (constant risk of energy crisis), environmental sustainability (the use of pollutant sources implies the emission of greenhouse gases) and competition, which makes energy costs rise above European average.
According to a research by ENEA [17], in Italy there may be 35 % reduction of energy use through a few easy arrangements, causing every institute to save 13.000 € every year (they now spend 40.000 € in energy); the numbers of course depend on climate condition. The authors suggest that it is important to act on about 15.000 buildings (35 %), giving a priority
to the old ones, moreover in Southern Italy. Any arrangements would improve the dependence of foreign supplies; they would also improve competition on energy costs, moreover if NZEB (Near Zero Energy Buildings) buildings were used more. Up to 2015, only 58 % of 33.825 active schools (of 42.292 reported) are actually trying to reduce the energy use [12].
Since schools are public buildings, they are supposed to be an example for the community; their emblematic role should support sustainability and represent an incarnation of didactic and social principles. Being also a closed place, it should not only respect didactic requirements, but also guarantee essential conditions of safety and health of everyday occupants. Physical and environmental conditions of school buildings represent, in fact, a considerable risk: children and teenagers are exposed to the eventual discomfort for a third of the day. Unsatisfying and inadequate microclimate factors affect attention and performance, obstructing the achievement and the conservation of the occupant’s ideal comfort.
For this reason, founds diminution should not affect the comfort in buildings, influencing both students and teachers’ performances [18, 19]. In Italy students spend in schools four-eight hours each day for at least ten years. Moreover, 15 % of the population (10.000.000 people, both students and teachers) attends everyday public buildings [20]. That is why the existing prescriptive Technical Norms (1975) have been reinforced by MIUR Guidelines for Scholastic Buildings (April 2013). This significant contribute provides a list of performance criteria for the design and the requalification of the space and the equipment of ‘the new millennium schools’ [21].
This paper proposes different possible scenarios for the energy requalification of a single building meant to be a kindergarten and a first and second grade primary school. After an audit, a numerical model of the building has been made by Design Builder to test the improvement level of the internal energy and environmental conditions. Air temperature, humidity, air speed and air quality have been monitored, analyzing the index of wellness according to Fanger's theory and evaluating the capacity and role of the building thermal inertia.
Data used in this work can be considered representative of school buildings placed in small towns in Italy and built in the 50s, according to that decade technology and building features, then. It is important to underline that school buildings (both entirely and specifically in every single room) are supposed to offer to occupants a satisfying level of comfort for the whole duration of using them [22]. These analyses focused on internal comfort, clearly linking it to energy performances.
1. Methodology for the energy requalification of the building
1.1. Description of the building and the actual energy and comfort condition
The building is located in San Marco la Catola, a small town of 28,63 km2, whose center is 700 meters above the level of sea. The town is in the Sub-Apennine Dauno area, which can be considered a sub-zone with specific morphologic configurations, and it is situated on the east-north-east side respect to the city of Foggia (Puglia). The climate of this area is sub-continental, while the rest of the region is sub-littoral and warm. For the Italian normative on energy output it is included in the climatic zone E (building category E.7), with 2251 conventional day-degrees, the heating period ranging from October the 15th to April the 15th, with 14 hours of daily use.
The research opted for a documental study and a direct investigation through a series of energy audits, which allowed to contextualize, according to a logic procedure, the critic points of the school building, which is dated in the 50s and placed in a small town. The collected data have then been processed.
The compilation of a form, a detailed photographic report, verifying thermal and electric systems' functions, acquiring the history of energy consumption and relevant technical-structural data (through specific instruments) followed right after.
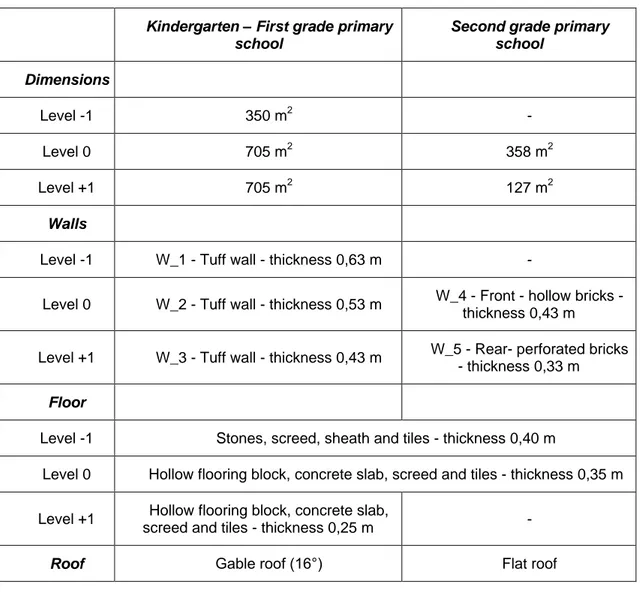
The school was built in various time steps which ended in 1988. The oldest portion of the building today hosts the kindergarten and the first grade primary school. In a successive building step, a nearby structure was erected (the second grade primary school). These two structures form a single intercommunicating building, but they are clearly split from the technologic point of view. The building, which is in the downtown area, is quite isolated; precisely, his boundary walls confine with no other structures. Its geometrical plant is quite irregular, but basically rectangular. In Fig. 1 a picture of the building is shown.
TABLE I. TABLE ITECHNOLOGICAL FEATURES OF THE SCHOOL BUILDING.
Kindergarten – First grade primary school
Second grade primary school Dimensions Level -1 350 m2 - Level 0 705 m2 358 m2 Level +1 705 m2 127 m2 Walls
Level -1 W_1 - Tuff wall - thickness 0,63 m -
Level 0 W_2 - Tuff wall - thickness 0,53 m W_4 - Front - hollow bricks - thickness 0,43 m
Level +1 W_3 - Tuff wall - thickness 0,43 m W_5 - Rear- perforated bricks - thickness 0,33 m
Floor
Level -1 Stones, screed, sheath and tiles - thickness 0,40 m
Level 0 Hollow flooring block, concrete slab, screed and tiles - thickness 0,35 m
Level +1 Hollow flooring block, concrete slab,
screed and tiles - thickness 0,25 m -
Roof Gable roof (16°) Flat roof
TABLE II. FEATURES AND QUANTITIES OF THE DIFFERENT TYPES OF OPENINGS.
Type A Anodized aluminum frame in cold cutting with single glass 8%
Type B Anticorodal frame in cold cutting with double glazing 59%
Type C Anticorodal frame in thermal cutting with double glazing 33%
The technological features reported during the endoscopic investigations are reviewable in Table I, while Table II shows the features of the different existing openings.
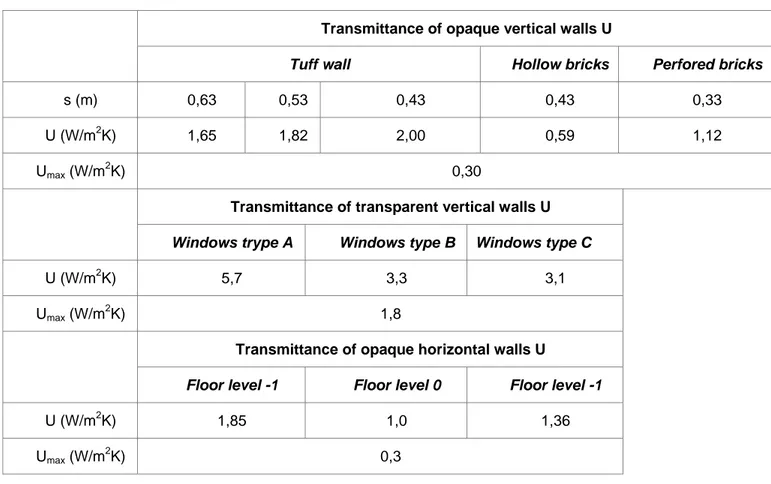
It may also be noticed in Table III the thermal transmittance incompatibility of the single elements in reference to the Ministerial Decree on June, the 26th, 2015 (Umax).
The energy-consuming systems in the school building are the electric one and the thermal one; there are neither chilling systems, nor controlled mechanical ventilation systems. Natural ventilation is achieved only opening doors and windows or caused by air
infiltration in the building envelope. Concerning the energy loads distribution, the consumption is basically due to the lighting system (which uses fluorescent and incandescent lamps), while a smaller part is caused by the equipment needed during the didactic activity (computers, printers etc.). The thermal energy system is based on a heat generator made by a 260 kW gasoline boiler, which is able to satisfy only the air heating system; domestic hot water is heated up through electric boilers. The terminals are cast-iron radiators installed on the wall with four or six columns; they don't have any thermostatic valves, so the global output of the building is low, due to an inadequate thermoregulation of the environments.
TABLE III. TRANSMITTANCE OF STRUCTURAL ELEMENTS OF THE BUILDING
Transmittance of opaque vertical walls U
Tuff wall Hollow bricks Perfored bricks
s (m) 0,63 0,53 0,43 0,43 0,33
U (W/m2K) 1,65 1,82 2,00 0,59 1,12
Umax (W/m 2
K) 0,30
Transmittance of transparent vertical walls U Windows trype A Windows type B Windows type C
U (W/m2K) 5,7 3,3 3,1
Umax (W/m 2
K) 1,8
Transmittance of opaque horizontal walls U
Floor level -1 Floor level 0 Floor level -1
U (W/m2K) 1,85 1,0 1,36
Umax (W/m2K) 0,3
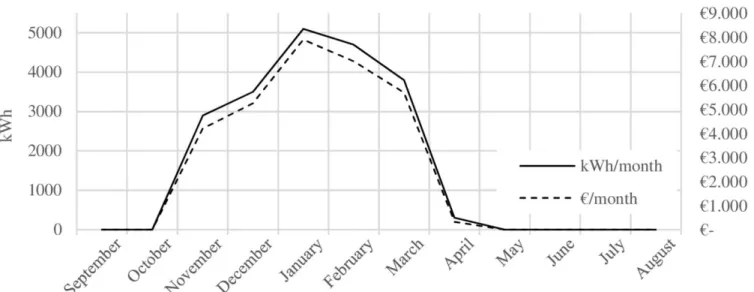
Fig. 3. Monthly consumption of thermal energy.
The collected historical energy and economic data showed that from 2010 to 2014 the effective electricity consumption amounts to 16.600 kWh/year, which means about 4.000 €/year. Fig.2 shows the monthly consumption of electric energy. It is noticeable that the maximum level of energy use takes place during the darkest months (late autumn and winter), due to a more frequent use of artificial light. On the contrary, during spring and summer the energy use is reduced. Specifically, it is quite zero during July and August, because the lessons are interrupted. The consumption reduction during summer is a counter-tendency compared to similar buildings; this is due to the lack of air conditioners, which would increase the energy consumption during the warm season. In this case there is no need of air refreshing due to the external climate conditions.
The effective thermal energy consumption from 2010 to 2014 amounts to 20.300 kWh/year, corresponding to 30.000 €/year. As showed in Fig.3, the highest values are obviously in the coldest months, where there is a peak of 5.000 kWh/month. Data are referred to a partial use of the building; the occupied surface is 1.215 m2 of 2.240 m2 (about 54 %), due to the low number of occupants (150 people including students). The place is occupied six weekly days: five hours each day for four days a week, eight hours for the remaining two days. Besides, it is to be considered that, during holidays, the structure is closed.
To get data about the perception of environmental conditions, discomfort and manifested symptomatology, the occupants were given a questionnaire indicating personal information such as age and sex (to understand if they are students or teachers, in which part of the building they usually stay and for how long time); they were also asked to express a vote and to answer some questions with the
chance to motivate them. The results show that young students have a different thermal perception compared to adults, declaring a good ability to adapt to indoor temperature variation. Anyway, the worst results are referred to the building hosting the second grade primary school, where the occupants perceive disturbing smells and cold, moreover in the laboratories and in service rooms. These results, compared to specific on-field investigations, showed that there is a connection between low quality conditions and low energy efficiency. The reasons of this discomfort may deal with a bad managing of the heating system, an inadequate ventilation and/or an inefficient thermal insulation.
1.2. Designing the model
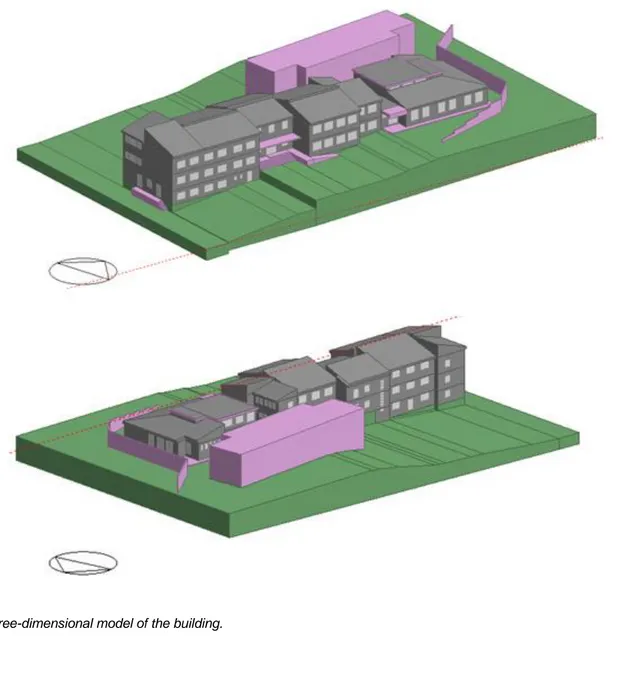
The methodology proposed is based on the implementation of a model of the building made by Design Builder, a simulation software which uses the calculation engine Energy-Plus, to evaluate the energy performance of the building. In Fig. 4 the three dimensional Design Builder model of the building is shown.
The software was able to sum up the thermo-physical features of the real school building. Typing the initial data and the external climatic conditions, it was possible to get the actual energy requirement concerning both electricity and thermal energy and the parameters representing the thermo-hygrometric comfort conditions (air temperature, mean radiant and operating temperature, relative humidity and Predicted Mean Vote), then studying the real thermal and energy behavior through dynamic calculations. The calculation model has been improved and then validated comparing the different energy needs calculated through the numerical elaboration and the real consumption (got from the monthly bill) shown in Fig. 5.
Fig. 4. Three-dimensional model of the building.
The calculated amount of yearly energy consumption presents about 4 % difference for electricity and about 5 % for thermal energy, if compared to the real building performance. Once accepted the reliability of data from Design Builder, it was used for the next simulations, with the aim to support the energy requalification strategy (to reduce the energy needs and costs and to improve the thermo-hygrometric comfort) and to study the role of thermal inertia in the building envelope.
1.3 Strategies of energy requalification
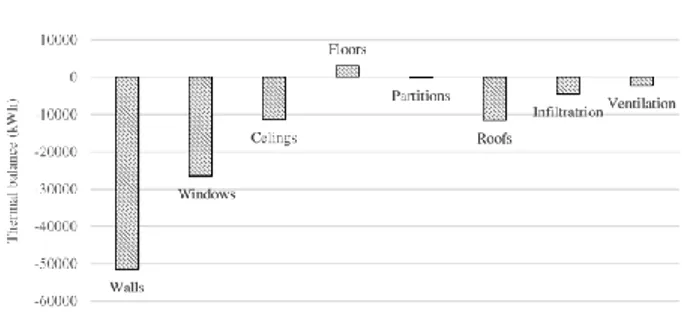
Thanks to the energy diagnosis, some weaknesses were found in the building. Requalification measures were then determined, both concerning energy conservation (like heat) and the substitution of completely or partially inefficient elements, which caused the energy waste and the thermo-hygrometric discomfort. Fig. 6 shows the energy weaknesses of the building, evaluated through the physical investigation and the dynamic simulation of Design Builder model. They are:
the envelope is highly transmitting (Table III) and not homogeneous at different levels from the energy point of view, causing relevant thermal losses from the boundary walls, due to the absence of an adequate thermal insulation;
the windows are highly transmitting (Table III);
artificial lighting is achieved through an obsolete technology; moreover, there is not an adequate control and optimization of day-lighting.
After this, on the base of the calculation model previously made, the potential improvement of the building has been evaluated. The interactive approaches defined three different groups of possible operations, divided according to the impact on the building and the costs of realization:
the first group deals with small operations. It suggests low impact possible scenarios whose purpose is to substitute the windows and to update the illumination system.
the second group deals with medium-impact operations. It suggests the thermal insulation of vertical and horizontal elements. The operations, though very expensive, are very detailed and able to improve the thermal comfort of the rooms;
the third group deals with high-impact operations. It suggests a very detailed study of thermal inertia with the purpose of verifying the performances of the five different existing kinds of building envelopes and then to foresee the performance in case the whole envelope was built in the best way.
Fig. 6. Heat losses and annual average contributions.
It was not possible to foresee the employment of renewable energy sources, which would lead to better energy performances, because the building is considered a historical heritage and is supervised.
1.3.1 Low-impact operations 1.3.1.1 Substitution of the windows
Windows are crucial in controlling thermal losses, air permeability and natural illumination. The operation includes the complete removal of the existing windows and their substitution with PVC seven-roomed frames; moreover, the windows would have low-transmittance triple glass argon-filled and with a warm edge line in between. This glass lets thermal radiation in, but doesn't let the same radiation out.
The total thermal transmittance of the windows UW (W/m2K) was calculated with Eq. (1) and evaluated to conform Ministerial Decree on June the 26th 2015, obtained through the average thermal transmittance of the glass and frame.
𝑈𝑊=
𝐴𝑔∗𝑈𝑔+𝐴𝑓∗𝑈𝑓+𝐼𝑔∗𝑔
𝐴𝑤 (1)
where Ag is the glass area, Ug is the thermal
transmittance of the glass, not including the effect of the spacer along the edge of the glass, Af is the frame
area, Uf is the frame thermal transmittance, Ig is the
glass perimeter, g is the linear thermal transmittance
concerning supplemental heat conduction which happens due to the interaction between frame, glass and glass spacer in function to the thermal properties of the glass of each one of these components; finally Aw is the shutter area.
1.3.1.2 Substitution and integration of illuminating system
The research shows that a significant part of energy consumption regards the illuminating system. For this reason, the work provides two scenarios: the first one deals with the substitution of the lamps with LED T8_120 cm and LED T8_60 cm, whose energy-saving capacity was analyzed by different authors, like
Bertoldi and Atanasiu [23]; the second scenario deals with the installation of accurately placed motion sensors, able to turn off the lamps when no one is close to them. This improvement allows to have the lamps on only if needed, avoiding energy wastes caused by the occupants' oversights (e.g. forgetting to turn off the lamps when leaving a room). The installation is provided only in the most used places, like classrooms.
1.3.2 Medium-impact operations
To reduce thermal losses through the opaque vertical envelope, the boundary walls get coated, placing the insulating layer on the outside to avoid thermal excursion and letting the structure warm during winter and cool in summer. The thermal insulation during cold season reduces condensation, humidity and mould. The insulation is achieved through Sintered Expanded Polystyrene,0.09 m plates for tuff vertical opaque structures, 0.08 m for perforated bricks vertical opaque structures and 0.05 m for hollow bricks vertical opaque structures, certified “ETICS” (External Thermal Insulation Composite System) and coded according to UNI EN 13163 with EC certification. The external surface finishing is in plaster. Moreover, to reduce the thermal losses from indoor to outdoor, the external horizontal structures must be insulated with 0.07 m glass wool plates (sand and 80% of recycled glass), with 0.06 m screed-laying based on cement. The thermal transmittance of both vertical and horizontal opaque structures is conformed to the Ministerial Decree on June 26th 2015.
1.3.3 High-impact operations
Thermal inertia may generally cause in buildings a lower energy consumption and an improvement of indoor comfort. To demonstrate the real effects of thermal inertia on the indoor conditions of the school building, five different envelopes existing in the building have been analyzed through numerical analysis which allowed to specifically evaluate two parameters: the areic thermal capacity Cta (kJ/m
2
K) and the periodic thermal transmittance of the system
Yi,e (W/m
2
K).
The first parameter has been calculated using the Eq. (2) and describes the capacity of an element to oppose temperature variations happening on the external wall of the building and reaching the inside in a certain time period: the higher this parameter, the lower the temperature variation.
𝐶𝑡𝑎= ∑ 𝑀𝑠𝑖∗ 𝑐𝑖 (2)
where 𝑀𝑠𝑖 (kg/m2) is the surface mass and 𝑐𝑖 is the
specific heat (kJ/kg K) of the building type.
The second parameter has been calculated by Eq. (3) and evaluates the capacity of an opaque wall to change (considering the thermal lag coefficient) and reduce (considering the attenuation factor) the periodic
element on the thermal flux through a period of 24 hours.
𝑌𝑖,𝑒= 𝑓 ∗ 𝑈 (3)
where the attenuation factor f was calculated with Eq. (4) and U (W/m2K) is the thermal transmittance. The limit values of the attenuation factor are in the National Guidelines for Buildings Energy Certification [24] and it ranges between 0 and 1, where 0 corresponds to the total heat accumulation limit.
𝑓 = 𝑞𝑚𝑎𝑥
𝑞′
𝑚𝑎𝑥 (4)
if qmax (W/m
2
) is the thermal flow in real condition which introduces the concept of periodic-dynamic (it was calculated through the general solution of the heat conduction in variable regime) and q’max was calculated with the equation:
𝑞′𝑚𝑎𝑥= 𝑈 ∗ 𝑇(𝑒 𝑚𝑎𝑥,𝑖) (5)
where T(e max,i) (K) is the temperature difference between the maximum external and internal.
Since the actual thermal and dynamic behavior of the building depends on the instability of environmental conditions (both internal and external), the authors decided to carry out dynamic simulations from October the 15th to April the 15th, as provided in zone E according to D.P.R. August 26th 1993 n. 412 art. 2, analyzing five classrooms with similar conditions but equipped by five different types of external walls, ranging from W_1 to W_5 (see Table IV).
The first scenario wants to verify, in a case of equal heat transmission, which of the five options works best and is less affected by changes in outside temperatures. The second scenario involves the application on each wall of the best option from the first scenario and review of the improvements.
2. Results
This paragraph shows the results of the numerical analysis carried out by Design Builder. The reduction of thermal and electric energy consumption due to each improving operation has been evaluated. Data are shown in Table V, Table VI and Table VII, together with Fanger's indexes for indoor comfort.
Moreover, it is important to underline that the energy requalification of a building is particularly convenient in terms of money if it leads to reducing costs compared to requested services; in other words, if the money saved thanks to reduced energy use is more than the money spent for the requalification operation. For this reason, the economic investment and the amortization period are reported for each operation. The costs were calculated on the base of the average prices of natural gas and electric energy in May 2015 [25].
TABLE IV. THERMO-PHYSICAL PARAMETERS OF THE ANALYZED WALLS
Different types of external walls
W_1 W_2 W_3 W_4 W_5
Wall thickness (m) 0,630 0,530 0,430 0,430 0,330
Insulation thickness (m) 0,088 0,090 0,092 0,051 0,078
Trasmittance (W/m2K) 0,300 0,300 0,300 0,300 0,300
Surface mass (kg/m2) 1403 1173 943 319 243
Areic thermal capacity (kJ/m2K) 1930 1613 1295 278 211
Damping factor 0,006 0,014 0,032 0,067 0,225
Periodic thermal trasmittance (W/m2K) 0,002 0,004 0,010 0,020 0,068
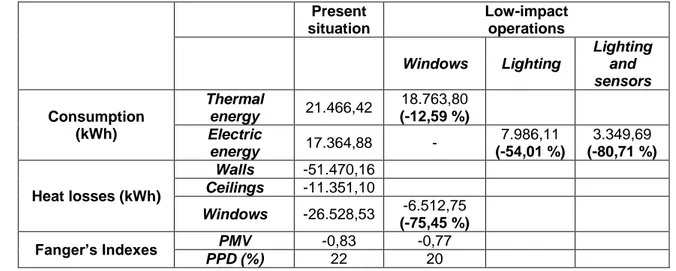
TABLE V. RESULTS OF LOW IMPACT INTERVENTIONS AND COMPARISON WITH THE PRESENT SITUATION
Present situation Low-impact operations Windows Lighting Lighting and sensors Consumption (kWh) Thermal energy 21.466,42 18.763,80 (-12,59 %) Electric energy 17.364,88 - 7.986,11 (-54,01 %) 3.349,69 (-80,71 %) Heat losses (kWh) Walls -51.470,16 Ceilings -11.351,10 Windows -26.528,53 -6.512,75 (-75,45 %) Fanger’s Indexes PMV -0,83 -0,77 PPD (%) 22 20
TABLE VI. TABLE VIRESULTS OF MEDIUM IMPACT INTERVENTIONS AND COMPARISON WITH THE PRESENT SITUATION
Present
situation Medium-impact operations Consumption (kWh) Thermal energy 21.466,42 10.522,84 (-50,98 %) Electric energy 17.364,88 - Heat losses (kWh) Walls -51.470,16 -11.086,67 (-78,46 %) Ceilings -11.351,10 -7.817,50 (-31,13 %) Windows -26.528,53 -6.512,75 (-75,45 %) Fanger’s Indexes PMV -0,83 -0,62 PPD (%) 22 16
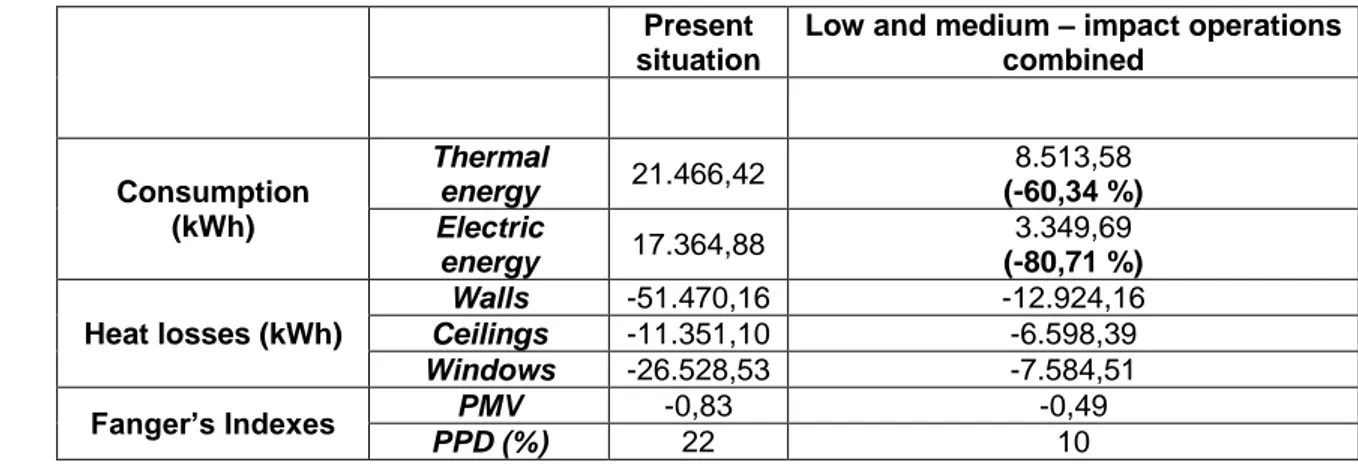
TABLE VII. RESULTS OF LOW AND MEDIUM IMPACT INTERVENTIONS COMBINED AND COMPARISON WITH THE PRESENT SITUATION
Present situation
Low and medium – impact operations combined Consumption (kWh) Thermal energy 21.466,42 8.513,58 (-60,34 %) Electric energy 17.364,88 3.349,69 (-80,71 %) Heat losses (kWh) Walls -51.470,16 -12.924,16 Ceilings -11.351,10 -6.598,39 Windows -26.528,53 -7.584,51 Fanger’s Indexes PMV -0,83 -0,49 PPD (%) 22 10 2.1. Low-impact operations
The substitution of windows allows to save 12,59 % of thermal energy and to reduce 75,45 % of wastes. The initial investment is 8.610,00 €, the amortization period is 19,3 years and saving thermal energy in twenty-five years is 9.938,35 €. In terms of indoor comfort, Fanger's method allows to get a -0.77 PMV, which means 20 % of unsatisfied people; the feeling perceived indoor by the occupants, with the new windows, becomes "Cool", which is slightly better than the present situation.
For what concerns the substitution of lamps, 54,01 % of energy is saved. The initial investment is 6.525,00 €, the amortization period is 15,90 years and saving electric energy in twenty-five years is 4.926,94 €. Motion sensors add an extra 26,70% of saved energy, since they allow to reduce the use of artificial light. This emphasizes the importance of this operation in terms of money. The initial investment and amortization are increased.
2.2. Medium-impact operations
The thermal insulation of vertical opaque walls and horizontal boundary walls save 50,98 % of thermal energy. The initial investment is 62.930,00 €, the amortization is 18,2 years and saving thermal energy in twenty-five years is 40.242,85 €. In terms of indoor comfort, Fanger's method allows to get a -0,62 PMV, which means 16% of unsatisfied people. Once more, the perception is improved.
2.3. Low and medium-impact operations combined
The combination of low and medium impact operations provides an improvement both in terms of consumption (-60,34 % of thermal energy and 80,71 % of electric energy) and wastes caused by structural elements and in terms of thermal comforts, creating a
"thermal comfort condition" which causes only 10% of unsatisfied people (-12% than the actual situation).
2.4. High-impact operations
An hourly dynamic simulation has been carried out from October the 15th to April the 15th and the results are specifically referred to two weeks during which the rooms were occupied and heated up. Fig. 7 shows the results of the week when the highest outdoor temperature was about 25°C, while Fig. 8 regards the week with the lowest outdoor temperature of about - 4°C.
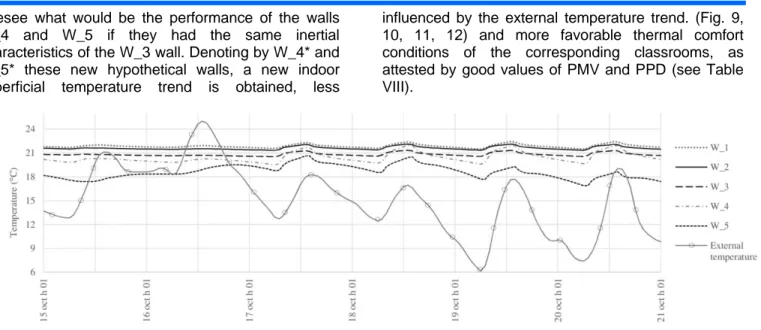
Both figures show the hourly trend of indoor superficial temperatures of the five considered walls in relation with the outdoor temperature trend. The walls which registered more fluctuations, being really influenced by the external climatic condition, are W_4 and W_5 (hollow bricks and perforated bricks walls), while W_1, W_2 and W_3 (tuff walls) are less affected by the external temperature trend, no matter their thickness. This is clarified by data shown in Table IV, where it is possible to notice that the higher the areic thermal capacity, the later the temperature variation will happen (the highest value is for W_1 and the lowest for W_5). Moreover, the lower the periodic thermal transmittance, the lower the entrance of thermal loads from outdoor will be (the lowest value for W_1, the highest for W_5).
Besides, in Table VIII the indoor temperatures of the five classrooms considered with the five types of walls W_1 ÷ W_5 are shown. Their variation from room to room generates different PMV and PPD values. The wall type W_3 gives the best PMV and PPD values. From these results, since the wall type W_3 gives totally the best results in terms of thermal inertia and indoor temperatures, it is assumed to change, at least in theory, the thermal features of the walls type W_4 and W_5 by giving them the same characteristics of the wall type W_3. In this way, it was possible to
foresee what would be the performance of the walls W_4 and W_5 if they had the same inertial characteristics of the W_3 wall. Denoting by W_4* and W_5* these new hypothetical walls, a new indoor superficial temperature trend is obtained, less
influenced by the external temperature trend. (Fig. 9, 10, 11, 12) and more favorable thermal comfort conditions of the corresponding classrooms, as attested by good values of PMV and PPD (see Table VIII).
Fig.7. Comparison between the indoor superficial temperatures of the five walls with the highest outdoor temperatures from October the 15th to October the 21st.
Fig. 8. Comparison between the indoor superficial temperatures of the five walls with the lowest outdoor temperatures from January the 19th to January the 25th.
TABLE VIII. ANALYZED CLASSROOM'S THERMAL PARAMETERS AND FANGER'S INDEX.
Air temperature (°C) Radiant temperature (°C) Operating temperature (°C) PMV PPD (%) Classroom_1 21,56 19,64 20,60 0,39 8 Classroom _2 21,42 19,50 20,46 0,36 7 Classroom _3 20,93 19,08 20,01 0,24 6 Classroom _4 21,14 19,22 20,18 0,30 7 Classroom _5 19,42 16,36 17,89 -0,52 12 Classroom _4* 21,96 19,93 20,94 0,25 6 Classroom _5* 20,76 19,31 20,03 -0,44 9
Fig. 9. Comparison between superficial temperatures of W_4 and W_4* in relation to outdoor highest temperatures from October the 15th to October the 21st.
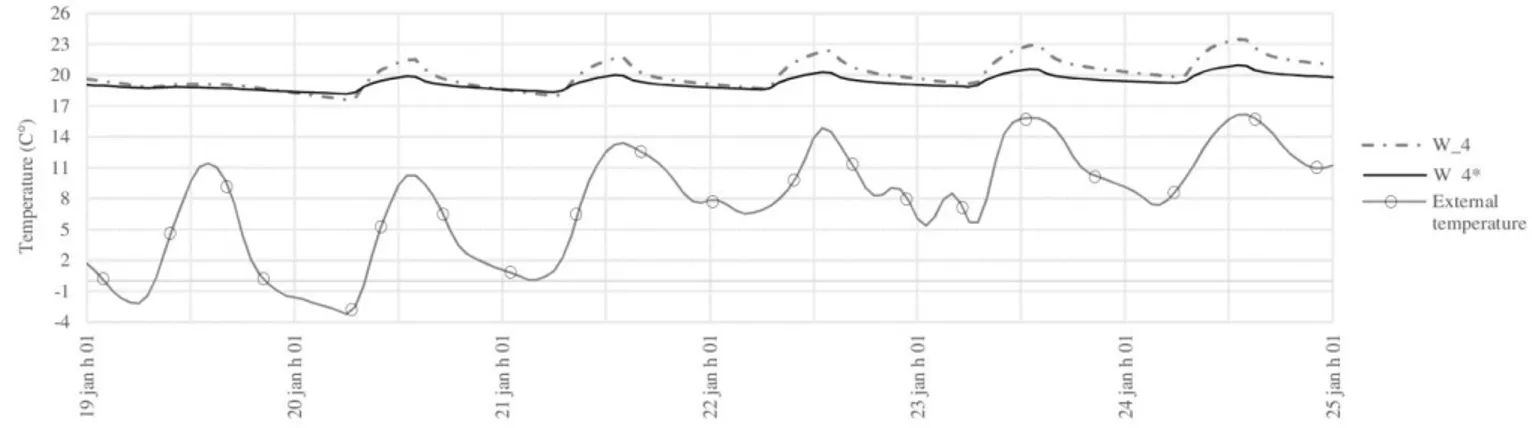
Fig. 10. Comparison between superficial temperatures of W_4 and W_4* in relation to outdoor lowest temperatures from January the 19th to January the 25th.
Fig. 11. Comparison between superficial temperatures of W_5 and W_5* in relation to outdoor highest temperatures from October the 15th October the 21st.
In fact, the higher areic thermal capacities of the two walls allow to delay the temperature variation, while the lower thermal transmittance lets to achieve less loads in and from outside. Consequently, less people are unsatisfied.
Therefore, the ideal operation (high impact operation) would provide all the suggested modifications, including the variation of the technologic features in a part of the building, achieving a 64,19% of thermal energy saving in relation to the actual state, and -0,34 PMV, which corresponds to 7 % PPD.
In the considered climate, the contribution from massive envelopes, which work as thermal barriers, moreover during winter, is crucial, both to reduce the need for energy and to maintain the thermal comfort conditions. In fact, in this case heat losses from the envelope is -74,89 % compared to the actual state. Obviously, an intervention of this kind would be expensive and invasive, as it would require a considerable structural change.
3. Conclusions
The requalification of every single school building is an important achievement in the field of public buildings; to get it through energy simulations means solving several problems. In this paper, the authors propose a multi-criteria analysis whose purpose is to reduce the energy use and to get comfortable conditions inside a school building. In particular, they try to get an assessment of some possible alternatives choosing the best solutions according to the different, conflicting parameters.
The energy saving strategies have been evaluated in relation to the thermal comfort conditions of occupants, hypothesizing three levels of actions: low, medium and high impact, the last being only in principle. The best performances are obtained providing all the suggested modifications, including the technologic features variation in a part of the building (high impact operations), achieving a remarkable thermal energy saving in relation to the actual state, and a considerable improvement of the Fanger’s comfort indexes.
This is obviously connected to the particular climatic zone in which the building is situated, mainly in winter. It is probable that in other climates it would show some weaknesses for sure. Even if high impact actions are the most effective, the result is not the best possible, since the money saved with a lower consume is less than the money invested. Instead, low and medium-impact operations guarantee the best results, since the money saved is more than the money spent.
References
[1] M. C. Dubois, A. Blomsterberg, “Energy saving potential and strategies for electric lighting in future North European, low energy office buildings: A
literature review”, Energy and Buildings vol. 43, 2011, pp. 2572-2582.
[2] M. Santamouris, G. Mihalakakou, P. Patargias, N. Gaitani, “Other using intelligent clustering techniques to classify the energy performance of school buildings”, Energy and Buildings vol. 39, 2007, pp. 45–51.
[3] A. Boyano, P. Hernandez, O. Wolf, “Energy demand and potential savings in European office buildings: Case studies based on EnergyPlus simulations”, Energy and Buildings vol. 65, 2013, pp. 19-28
[4] N. Fumo, P. Mago, R. Luck, “Methodology to estimate building energy consumption using EnergyPlus Benchmark Models”, Energy and Buildings vol. 42, 2010, pp. 2331-2337.
[5] M. Santamouris, G. Mihalakakou, P. Patargias, N. Gaitani, K. Sfakianaki, M. Papaglastra, C. Pavlou, P. Doukas, E. Primikiri, V. Geros, M.N. Assimakopoulos, R. Mitoula, S. Zerefos, “Using intelligent clustering techniques to classify the energy performance of school buildings”, Energy and Buildings vol. 39, 2007, pp. 45-51.
[6] S.P.Corgnati, V. Corrado, M. Filippi, “A method for heating consumption assessment in existing buildings: A field survey concerning 120 italian schools”, Energy and Buildings vol. 40, 2008, pp.801– 809.
[7] Law n.192, August the 19th 2005, ”Execution of 2002/91/EC Directive on energy performance of buildings” [D.lgs 19 agosto 2005, n. 192, “Attuazione della direttiva 2002/91/CE relativa al rendimento energetico nell’edilizia”].
[8] Law n. 311, December the 29th, 2006, “Corrective and supplementary measures to the legislative decree n.192, August the 19th, 2005, Execution of 2002/91/EC Directive on energy performance of buildings” [D.lgs 29 dicembre 2006, n. 311, “Disposizioni correttive ed integrative al decreto legislativo 19 agosto 2005, n. 192 “Attuazione della direttiva 2002/91/CE relativa al rendimento energetico nell’edilizia”].
[9] Directive 2002/91/EC, Official Journal of the European Communities, 2003, pp. 65–71.
[10] School buildings research Italy, School
buildings report for the Italy.
http://www.legambiente.it/temi/scuola/edifici-scolastici, 2015 (accessed 16.10.2015).
[11] L. de Santoli, F. Fraticelli, F. Fornari, C. Calice, “Energy performance assessment and retrofit strategies in public school buildings in Rome”, Energy and Buildings vol. 68, 2014, pp. 196–202.
[12] The good school. School buildings registry, [La buona scuola. Anagrafe dell’edilizia scolastica], http://www.istruzione.it/allegati/2015/Slide_Anagrafe_E dilizia.pdf, 2015 (accessed 16.10.2015).
[13] G. Dall’O’, L. Sarto, “Potential and limits to improve energy efficiency in space heating in existing school buildings in northern Italy”, Energy and Buildings vol. 67, 2013, pp. 298–308.
[14] Ecosystem School, XVI Legambiente Report on the quality of school buildings, facilities and services [Ecosistema scuola, XVI Rapporto di Legambiente sulla qualità dell’edilizia scolastica, delle
strutture e dei servizi],
http://www.legambiente.it/sites/default/files/docs/ecosis tema_scuola_xvi_edizionew.pdf, 2015 (accessed 16.10.2015)
[15] M. T. Lucarelli, D. Pennestri, “School buildings and indoor air quality: diagnostic procedures and criteria for intervention”, TECHNE vol. 9, 2015, pp. 299-306.
[16] M. Citterio, G.Fasano, “Survey on consumption of public buildings and the potential of energy efficiency measures” [Indagine sui consumi degli edifici pubblici e potenzialità degli interventi di efficienza energetica], ENEA, 2009.
[17] F. Bianchi, M. Altomonte, M.E. Cannata, G. Fasano, “Definition of the requirements of energy consumption indices of school buildings - energy consumption of primary and secondary schools” [Definizione degli indici di fabbisogno dei vari centri di consumo energetico degli edifici adibiti a scuole – consumi energetici delle scuole primarie e secondarie], ENEA, 2009.
[18] P. Wargocki, D.P. Wyon, “Effects of HVAC on student performance”, ASHRAE Journal, 2013 pp. 46-50.
[19] V. De Giuli, O. Da Pos, M. De Carli, “Indoor environmental quality and pupil perception in Italian primary schools”, Building and Environment vol. 56, 2012, pp. 335–345.
[20] “The air quality in schools and risks for respiratory and allergic diseases”, [La qualità dell’aria nelle scuole e rischi per malattie respiratorie e allergiche]
http://www.salute.gov.it/imgs/c_17_pubblicazioni_1892 _allegato.pdf, 2015 (accessed 16.10.2015).
[21] “Green School Project, Agenda 21 of the UN Action Plan for the reference sustainable development for the 21st century” [Progetto Green School, Agenda 21. Piano di Azione dell’ONU per lo sviluppo sostenibile di riferimento per il 21° secolo]. http://www.agenda21laghi.it/Agenda21.htm, 2015 (accessed 16.10.2015).
[22] Ministerial Decree on December the 18th 1975, “Updated technical standards for school buildings”, [DM 18/12/1975. Norme tecniche aggiornate relative all’edilizia scolastica, ivi compresi gli indici minimi di funzionalità didattica, edilizia ed urbanistica da osservarsi nell’esecuzione di opere di edilizia scolastica].
[23] P. Bertoldi and B. Atanasiu, “Residential Lighting Consumption and Saving Potential in the
Enlarged EU”, European Commission.
http://iet.jrc.ec.europa.eu/energyefficiency/system/tdf/i d150_bertoldi_final.pdf?file=1&type=node&id=2645
[24] National guidelines for energy certification of buildings [Linee guida nazionali per la certificazione
energetica degli edifici].
http://www.gazzettaufficiale.it/do/atto/serie_generale/c aricaPdf?cdimg=09A0790000100010110001&dgu=20 09-07-10&art.dataPubblicazioneGazzetta=2009-07-10&art.codiceRedazionale=09A07900&art.num=1&art. tiposerie=SG , 2015 (accessed:16.10.2015).
[25] Europe’s Energy Portal, Energy prices from
past to present. http://www.energy.eu, 2015 (accessed 3.10.2015).