PAPER • OPEN ACCESS
Decoding working memory task condition using
magnetoencephalography source level long-range phase coupling
patterns
To cite this article: Jaakko Syrjälä et al 2021 J. Neural Eng. 18 016027
View the article online for updates and enhancements.
Journal of Neural Engineering
OPEN ACCESS RECEIVED 9 August 2020 REVISED 20 November 2020 ACCEPTED FOR PUBLICATION 30 November 2020 PUBLISHED 23 February 2021 Original content from this work may be used under the terms of theCreative Commons Attribution 4.0 licence. Any further distribution of this work must maintain attribution to the author(s) and the title of the work, journal citation and DOI.
PAPER
Decoding working memory task condition using
magnetoencephalography source level long-range phase
coupling patterns
Jaakko Syrjälä1, Alessio Basti1, Roberto Guidotti1, Laura Marzetti1,2,3and Vittorio Pizzella1,2,3 1 Department of Neuroscience, Imaging and Clinical Sciences, ‘Gabriele d’Annunzio’ University of Chieti-Pescara, Chieti 66013, Italy 2 Institute for Advanced Biomedical Technologies, ‘Gabriele d’Annunzio’ University of Chieti-Pescara, Chieti 66013, Italy
3
These authors equally contributed to this work. E-mail:[email protected]
Keywords: working memory, magnetoencephalography, phase coupling, machine learning, neural oscillation Supplementary material for this article is availableonline
Abstract
Objective. The objective of the study is to identify phase coupling patterns that are shared across
subjects via a machine learning approach that utilises source space magnetoencephalography
(MEG) phase coupling data from a working memory (WM) task. Indeed, phase coupling of neural
oscillations is putatively a key factor for communication between distant brain areas and is
therefore crucial in performing cognitive tasks, including WM. Previous studies investigating phase
coupling during cognitive tasks have often focused on a few a priori selected brain areas or a
specific frequency band, and the need for data-driven approaches has been recognised. Machine
learning techniques have emerged as valuable tools for the analysis of neuroimaging data since they
catch fine-grained differences in the multivariate signal distribution. Here, we expect that these
techniques applied to MEG phase couplings can reveal WM-related processes that are shared across
individuals. Approach. We analysed WM data collected as part of the Human Connectome Project.
The MEG data were collected while subjects (n = 83) performed N-back WM tasks in two different
conditions, namely 2-back (WM condition) and 0-back (control condition). We estimated phase
coupling patterns (multivariate phase slope index) for both conditions and for theta, alpha, beta,
and gamma bands. The obtained phase coupling data were then used to train a linear support
vector machine in order to classify which task condition the subject was performing with an
across-subject cross-validation approach. The classification was performed separately based on the
data from individual frequency bands and with all bands combined (multiband). Finally, we
evaluated the relative importance of the different features (phase couplings) for classification by the
means of feature selection probability. Main results. The WM condition and control condition were
successfully classified based on the phase coupling patterns in the theta (62% accuracy) and alpha
bands (60% accuracy) separately. Importantly, the multiband classification showed that phase
coupling patterns not only in the theta and alpha but also in the gamma bands are related to WM
processing, as testified by improvement in classification performance (71%). Significance. Our
study successfully decoded WM tasks using MEG source space functional connectivity. Our
approach, combining across-subject classification and a multidimensional metric recently
developed by our group, is able to detect patterns of connectivity that are shared across individuals.
In other words, the results are generalisable to new individuals and allow meaningful interpretation
of task-relevant phase coupling patterns.
1. Introduction
Cognitive operations and complex behaviour require interactions between distributed neuronal popula-tions [1]. Neural oscillations and their synchronisa-tion is a putative mechanism supporting the func-tional integration of distributed neuronal popula-tions that is needed in higher cognitive funcpopula-tions [2] such as working memory (WM), i.e. the ability to temporarily maintain and manipulate information [3]. The neural oscillations arise from rhythmically synchronised post-synaptic potentials of thousands or even millions of neurons and can be measured with electroencephalography (EEG) and magnetoen-cephalography (MEG) [4–6]. It has been hypothes-ised that the phase of the measured signal is related to the excitability state of the neurons in the assembly. Distant brain areas can therefore communicate effect-ively only when the phases of their oscillations syn-chronise so that the output from the pre-synaptic group of neurons arrives at the time when the post-synaptic neurons are the most excitable [7]. This form of long-range phase coupling is thought to play a key role in neuronal communication in cognitive pro-cesses, including WM. Indeed, many neurophysiolo-gical studies have found that the phase coupling is modulated in different frequency bands in various WM tasks, thus supporting the role of neural oscil-lations in the context of WM [8–13].
The previous reports cast little doubt that the phase coupling is relevant to WM functions. How-ever, the majority of the previous studies have relied on a priori assumptions about the relevant brain areas, relevant frequency bands or both. Indeed, in recent years, the demand for data-driven approaches that can capture the multivariate and interactive nature of functional connectivity and cognitive pro-cessing has been recognised [1, 14]. An encour-aging approach for analysing complex multidimen-sional brain-imaging data in a data-driven manner is brain decoding [15,16]. Brain decoding is based on machine learning algorithms that mine the inform-ation content of multiple signals to make predic-tions of task, brain state or stimuli [15, 17, 18]. The decoding approach can exploit the interaction of multiple variables at the same time, which is not possible with often employed mass-univariate ana-lyses [17–21]. Moreover, the decoding approach over-comes the overly conservative multiple comparison correction that is needed in mass-univariate analyses due to the high dimensionality of neuroimaging data [18,20,22].
Machine learning techniques have been success-fully applied to neurophysiological data for different purposes, e.g. identifying individuals (fingerprinting) [23], diagnostics/biomarker/treatment outcome pre-diction [24–29], brain–computer interfaces (BCIs) [30,31], to reveal task or stimuli specific patterns of neural activity [16,17,20,30–35] and to predict
behavioural outcome [36]. The different applications have vastly different principle aims. For example, in BCI applications the primary aim is to find a model that maximises classification accuracy regardless of the underlying brain mechanisms and features. In contrast, in brain function decoding, as in the current study, the goal is to find a model that is interpretable, with shared features and that can accurately dis-criminate between brain states and therefore provide insight into related brain functions [16]. In the lat-ter framework, we use a brain decoding approach based on patterns of long-range phase coupling i.e. functional connectomes, obtained with a connectiv-ity approach recently developed by our group [37] to investigate brain mechanisms underlying WM.
Only relatively few studies have used MEG func-tional connectivity as features in machine learn-ing approaches, and the majority of previous stud-ies have focused on resting-state data in order to find biomarkers for various patient groups [26–29]. When brain decoding based on MEG functional connectivity during cognitive tasks has been per-formed [17,31], the analyses have been limited at the sensor level and used connectivity measures that are not robust against ‘artificial’ synchrony induced by field spread, thus making the interpretation of the results in terms of underlying mechanisms almost impossible [38,39]. These studies reported signific-ant decoding results within subjects but not across subjects, therefore not allowing generalisation of the results.
In the current study, we aim to use brain decod-ing based on MEG functional connectivity in source space, i.e. after having inferred the underlying gen-erators in the brain of the measured MEG signals, to be able to interpret our results in terms of coup-ling between brain regions. To the best of our know-ledge, this is the first study that uses MEG source space functional connectivity as a task decoding fea-ture. As a cognitive task, we focus on WM, since we expect a large set of brain regions to be involved in inter-areal communication underlying processing in WM as suggested by earlier literature, thus mak-ing WM an ideal task for multivariate analysis and to test generalisation across subjects. The WM MEG data used for this purpose were acquired as part of the Human Connectome Project (HCP) [40] dur-ing an N-back task, a continuous performance task that is commonly used to investigate WM [41]. Of note, the MEG HCP researchers acquired WM data in 83 healthy subjects, a fairly large number of sub-jects for a MEG study, making this dataset suitable to investigate subject-wise common functional con-nectivity patterns by decoding with training and test-ing split across subjects [42]. In these 83 subjects, we estimated phase coupling for the 2-back tion (WM) and the 0-back condition (control condi-tion) separately across the whole cortex in four differ-ent frequency bands (theta, alpha, beta and gamma).
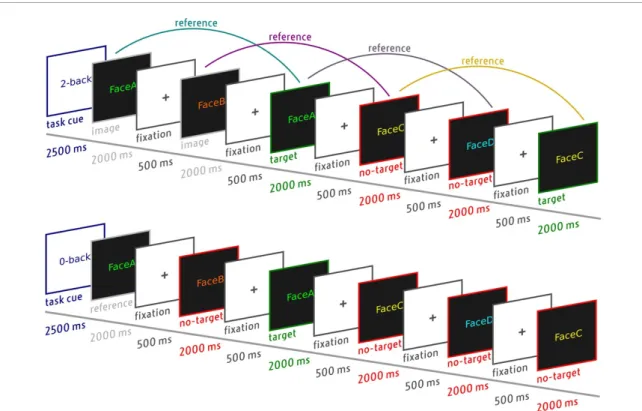
Figure 1. Subjects performed an N-back WM task in two different conditions: 2-back WM condition (upper panel) and 0-back control condition (bottom panel). Each block started with a task cue followed by ten images (only six examples shown here) of tools or faces. As illustrated, in the 2-back WM condition, the reference is constantly updated so that the reference is the image that was presented two images before the current image. In the 0-back control condition, the reference image is fixed.
Phase coupling was estimated using the multivariate phase slope index (MPSI) [37], which is the gener-alisation to the multidimensional case of the phase slope index [43]. In particular, the MPSI exploits the multivariate nature of the signal and is able to estimate the directionality of the coupling, that is, which one of the two phase-coupled brain areas is the ‘leader’ [37]. The obtained phase coupling connec-tomes were then used to train a linear support vec-tor machine in order to classify, in an across-subjects manner, which task condition (WM/control) a sub-ject was performing. We found that frequency spe-cific patterns of phase coupling between brain regions that discriminate between WM and control condi-tions can be consistently and reliably observed across subjects and are thus generalised to new individuals.
2. Methods
In this study, we analysed publicly available MEG data collected and preprocessed by the HCP Consortium [40]. Here, for the reader’s convenience, we briefly describe the task (figure1), data and analysis pipeline (figure2). Phase coupling analyses were carried out in Matlab (The MathWorks, Inc., Natick, MA, United States) using the FieldTrip toolbox [44] and custom-made Matlab scripts. The classification analyses were carried out in Python using the scikit-learn [45], nilearn [46] and scipy/numpy packages [47]. More information about data and software availability is provided in the data and code availability statement
section. For full details of the data acquisition, task protocol and preprocessing, the reader is referred to the data release manual [41].
2.1. Data acquisition
The WM MEG data acquisition was performed with a 248 magnetometer whole head MEG system (4D Neuroimaging, San Diego, CA) located at the Saint Louis University medical campus. The data were recorded at 2034 Hz sampling rate with a bandwidth of DC-400 Hz. Spatial digitization of three anatom-ical landmarks (nasion, peri-auricular points), five localiser coils and each subject’s head shape were performed using a Polhemus FASTRAK-III digitiser. This allowed co-registration of MEG data with indi-vidual MRI structural scans.
2.2. Participants and task protocol
Eighty-three healthy subjects (age range: 22–35; 38 females) included in the HCP experiment were ana-lysed. All participants gave written informed consent in accordance with the Declaration of Helsinki.
The subjects performed an N-back WM task while undergoing MEG data acquisition. In the N-back WM task (figure 1), participants were asked to monitor sequentially presented images of tools or faces in two different conditions, namely, 0-back (control condition) and 2-back (WM condition). Data acquisition was performed in two runs, each consisting of 16 blocks (eight blocks in each condi-tion). Each block consisted of ten images of either
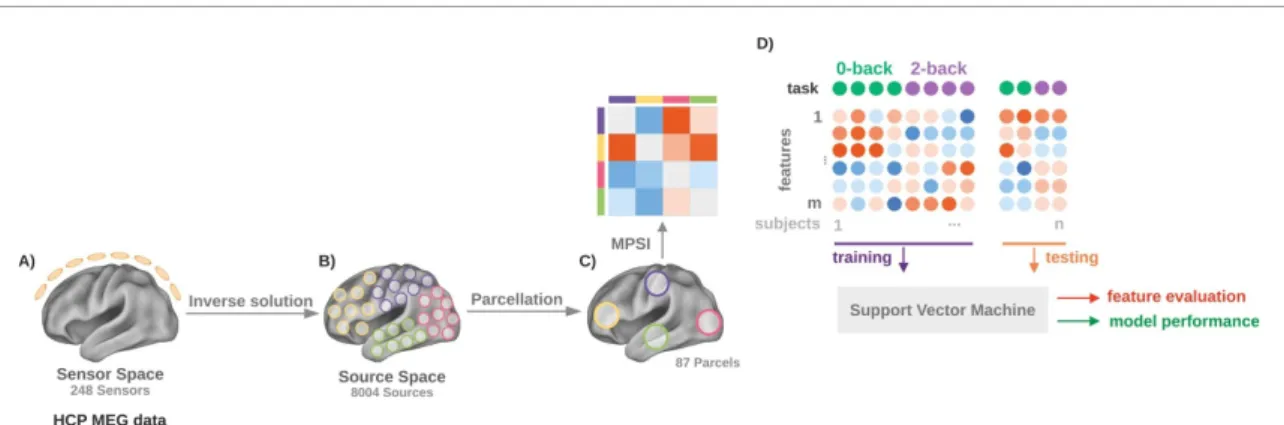
Figure 2. Data analysis pipeline. The preprocessed channel level data (A) were projected into the source space by relying on the eLoreta inverse method (B). An automated anatomical labelling (AAL) atlas was used in order to parcellate the source space, and a dimensionality reduction step (via subject-, condition- and frequency-band-specific prior principal component analyses) was performed in order to reduce the computation time in calculating the connectomes and implicitly increase the signal-to-noise ratio (C). The cross-spectral matrices between the (dimensionality-reduced) parcels were then computed and phase coupling was estimated through the multivariate phase slope index (MPSI). Finally, in order to classify the two WM task conditions, a linear support vector machine was trained using the phase coupling data; model performance was assessed by calculating classification accuracies and the most relevant features for the classification were identified by means of feature selection probability (D).
faces or tools. An initial cue was presented for 2500 ms at the beginning of each block indicating whether the block was a 0-back or a 2-back block. At the beginning of each 0-back block, a single reference image was presented to the participants. This was fol-lowed by a series of images, and the participants were instructed to respond whether the currently presen-ted image matched the reference image. In the 2-back blocks participants were instructed to respond whether the currently presented image matched the image presented two images before. Each stimulus lasted 2000 ms and consecutive stimuli were separated by a 500 ms fixation period. The participants were instructed to respond as fast as possible within the stimulus presentation window via button press with their right index (match) or right middle finger (non-match). Each block ended with a 15 s fixation period. 2.3. Preprocessing
The quality control of the HCP data was based on two quality assessment (QA) modules [40]. In the first QA module, channels with poor correlation or high variance ratio to the neighbouring channels were considered as bad and removed from further ana-lysis [48]. The second module utilised an iterative independent component analysis algorithm, which removes bad channels and segments based on spa-tial and temporal criteria [49]. This step minimises the effect of non-brain components such as magneto-and electro-cardiogram, eye movements, power sup-ply bursting, and 1/f like environmental noise [40]. Data were also down-sampled to 508.6275 Hz. 2.4. Epoching
In the current study, the HCP MEG data were epoched into 2 s time windows locked to the onset of the stimuli. Thus, the time window of interest, i.e. a trial, was defined as the entire stimulus presentation time window (2 s). We considered only trials in which
the participants provided correct responses in order to avoid possible confounds due to the different ratios of correct and incorrect responses between the condi-tions. The two types of stimuli (tools and faces) were not separated as the scope of this study was not to dif-ferentiate the processing of different types of stimuli. 2.5. Phase coupling estimation
2.5.1. Parcellation and parcel vector time series In order to reduce the computation time in calcu-lating the connectomes and to implicitly increase the signal-to-noise ratio, the dimensionality of the data was reduced by using the automated anatomical labelling atlas [50] parcellation relying on the nearest interpolation approach. This resulted in dividing the source space into 87 parcels and associating each parcel with a vector time series composed of time series (one for each location belonging to that par-cel). Finally, to reduce the number of signals for each parcel, a principal component analysis was applied on the average (across the two sessions) real part of the cross-spectral matrices for each subject, frequency band and condition separately. For each parcel, the representative vector time series was thus defined as the smallest set of signals that explains at least 90% of the parcel power [51].
Specifically, each trial was first divided at channel level into three segments with 50% overlap between the segments, and the channel-level cross-spectra were estimated for each subject, condition and fre-quency band (theta 4–8 Hz, alpha 9–13 Hz, beta 14–30 Hz and gamma 30–80 Hz). The channel-level cross-spectra for each of the two sessions were estim-ated as an average of the products of the Fourier-transformed data over all segments. Since each seg-ment had a length of 1 s, the frequency resolution was equal to 1 Hz. The cross-spectral matrix in source space (cortical layer of 8004 points with 6 mm dis-tance) was then estimated for each session and parcel
by applying the eLoreta inverse procedure with free source orientation [52]. The normalised leadfields, used for the calculation of the inverse matrices, were obtained by relying on a single shell approach [53] for the source space and volume conductor model provided by the HCP.
2.5.2. Multivariate phase slope index
The MPSI was used to estimate long-range directed phase coupling between all parcel pairs [37]. Specific-ally, for each pair of parcels I and J, the MPSI between the two corresponding vector time series ˜XIand ˜XJis
defined as MPSIIJ(F) :=4∑ f∈F Tr((SRII(df + f ) + SRII(f ))−1SIIJ(df + f ) ( SRJJ(df + f ) + SRJJ(f ))−1SRJI(f ) +(SRII(df + f ) + SRII(f ))−1SRIJ(df + f ) ( SRJJ(df + f ) + SRJJ(f ))−1SIJI(f ) )
where df = 1 Hz denotes the incremental step in the frequency domain, R the real part, I the imaginary part, Tr the trace of a matrix, (·)−1 the inverse oper-ator, and e.g. SIJ the cross-spectral matrix between
˜
XIand ˜XJ. Here, the cross-spectral matrices for each
parcel have been estimated by averaging the products of the Fourier transforms over all the segments into which the source level data (separately projected from sensor space for each session) have been divided. In order to avoid possible confounds induced by the dif-ference in dimensionality of the vector time series, all MPSI values were normalised with respect to the dimensions of the respective ˜XIand ˜XJ.
The sign of MPSIIJ gives information about the
directionality of the phase coupling. Specifically, a positive sign, which means that the phase differences between the components of I and J are more prone to increase with increasing frequency, implies that the average time lag between the two parcels is positive and thus that parcel I is the leading source; conversely, a negative value implies the opposite [37,54].
The above analysis resulted in 664 matrices (83 (subjects)×4 (frequency bands) ×2 (conditions)) of 3741 (87 parcels× (87 − 1)/2) elements, in which each entry represents the corresponding MPSI value between two parcels.
2.6. Classification analysis
Having obtained the phase coupling values for all par-cel pairs, a linear support vector machine (with pen-alisation coefficient C = 1) was trained to classify in which of the two task conditions each subject was engaged. The classification was first performed sep-arately for each frequency band (single band classi-fication) in order to evaluate the respective roles of
the different frequency bands. To further examine the respective importance and to evaluate whether the joint information stored in the phase coupling pat-terns of different frequency bands improves decod-ing, we considered all frequency bands simultan-eously (multiband classification). As input data for the classifier in the single band classification, we used the obtained MPSI matrices composed of 3741 fea-tures each representing the phase coupling between a pair of parcels. In multiband classification, the input data were formed by concatenating the MPSI matrices of all four frequency bands, resulting in 14 964 (3741× 4) features.
An ANOVA-based feature selection [55] was applied by selecting the first k highest f-score rank features. This operation is often deemed necessary to reduce the possibility of overfitting, particularly when the number of features is greater than the number of samples [55]. Therefore, the number of selected fea-tures (k) was varied from 1 to 600. A model selec-tion was then performed by means of subject-level cross-validation, that is, the data from 75% of the subjects were used as a training set and the remain-ing 25% as a testremain-ing set. This cross-validation scheme provides a measure of generalisation across subjects, i.e. it detects whether information that is used to classify the task is shared in the examined popula-tion [56]. To provide a good estimate of the classific-ation accuracy [57], across-subjects cross-validation was repeated 75 times. For each iteration, the subjects in the training set were randomly assigned. Feature selection was applied only on the training set for each repetition in order to avoid biasing of the classifica-tion error [55].
The statistical significance of the classification res-ults was assessed through permutation tests [58,59]. To obtain the null distribution for the classification accuracy, the labels of the conditions were shuffled 100 times and the entire classification procedure was repeated, including feature selection and cross-validation. The reported p-value is the probability of observing the reported accuracy by chance using the null distribution obtained after permutations (p < 0.01). Multiple comparisons were assessed using the Bonferroni correction.
2.7. Relevant feature analysis
The feature selection procedure extracts the inform-ative features that are used by the classifier to classify the task conditions. A feature that is selected in each cross-validation fold is important for the classifica-tion of the task condiclassifica-tion. Therefore, a feature that has a high probability to be selected by the algorithm is considered relevant for the classification of the task. To this end, a feature selection probability was calcu-lated by dividing the number of times a feature was selected by the total number of cross-validation folds
(n = 75). The feature selection probability was calcu-lated only for the frequency bands that showed statist-ically significant classification accuracy. Furthermore, to select the set of features that maximises the dis-criminative information about WM conditions, the feature selection probability was calculated for the number of features (k) that showed the best classific-ation accuracy.
The most relevant features (MPSI values between a pair of parcels) were defined as those that had a feature selection probability value greater than three standard deviations above the mean. In addition, we estimated which parcels were most often involved in the phase couplings (with any other parcel) that were selected for the classification. This was done by calcu-lating, for each parcel, the average probability of being selected for the classification. The most relevant par-cels were defined as those that had an average probab-ility value greater than two standard deviations above the mean.
2.8. Directed phase couplings
After the identification of the relevant phase coup-lings for the classification, we sought to understand whether the classification is partially driven by phase couplings that have consistent (across subjects) dir-ection in the WM condition but not in the control condition, or vice versa. To this end, we performed a sign test for both conditions separately to evalu-ate whether the MPSI value across the subjects has non-zero median. The directed phase couplings were evaluated separately for the phase couplings that were identified as relevant for single band and multiband classification.
2.9. Additional analyses
The phase estimation and thus the phase coupling estimation is affected by the signal-to-noise ratio [60]. Although the MPSI is a phase coupling method that is not biased by source powers, we nevertheless wanted to examine to which extent the most relevant features are affected by the respective parcel powers. To this end, we calculated the correlation between feature selection probability and the respective parcel powers.
A parcel power was defined as the sum over the scalar time series of ˜XI of the power spectrum in the
frequency band of interest, i.e. as
PI(F) := ∑N˜I i=1 ∑ f∈F(SII(f ))ii |F| ,
where F denotes the frequency band of interest, |F| the number of frequencies belonging to F, ˜NIthe
num-ber of univariate time series in ˜XI, and (SII(f ))iithe ith diagonal entry of the cross-spectral matrix SII(f )
associated with parcel I.
The difference in power between the WM and the control condition was then calculated for each par-cel, subject and frequency band. As described earlier, a feature in the current study refers to an MPSI value between two parcels. Therefore, we calculated the correlation between feature selection probability and mean power difference across the two involved par-cels. The correlation was calculated across all fea-tures that had non-zero feature selection probabil-ity (supplementary figure 1(A) (available online at
stacks.iop.org/JNE/18/016027/mmedia)) and across
the most relevant features (supplementary figure 1(B)), respectively. The correlation was calculated only for the frequency bands that showed significant classification accuracy.
3. Results
3.1. Behavioural results
The subjects correctly identified (either match or non-match) over 90% of targets in both condi-tions. The median accuracy in the 0-back condition was 97.5% (lower quartile = 93.4%, upper quart-ile = 99.3%) and it was significantly higher (sign test, p < 0.05) than the accuracy in the 2-back con-dition (median = 94.5%; lower quartile = 90.9%, upper quartile = 96.8%). The analysis of response times showed that the subjects performed signi-ficantly faster (sign test, p < 0.05) in the 0-back (median = 629 ms; lower quartile = 572 ms, upper quartile = 701 ms) than in the 2-back condition (median = 804 ms; lower quartile = 724 ms, upper quartile = 901 ms). Overall, the behavioural results indicate that the subjects performed well in both task conditions.
3.2. Classification accuracies
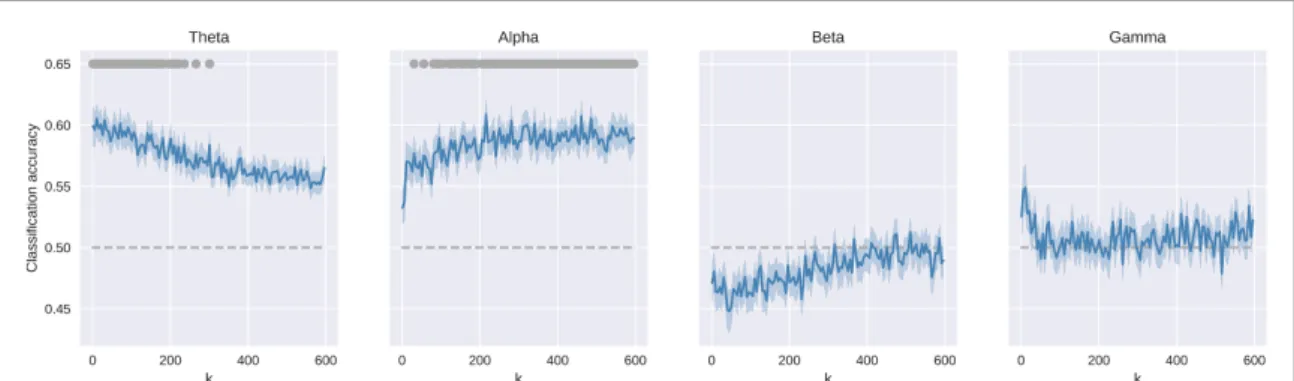
Phase coupling matrices (reported in supplementary figure 3) were used to classify whether the tested sub-ject was performing the WM condition (2-back) or the control condition (0-back). Figure3 shows the classification accuracies as a function of the number of features selected for the classification analysis. Sig-nificant (p < 0.01, Bonferroni-corrected) values for the classification accuracy are indicated by the grey dots in the uppermost part of each panel in figure3.
The classification accuracy was statistically signi-ficant only in the theta and alpha bands. In the gamma band, the accuracy was above chance level with a small number of features but did not reach significance level.
In the theta band, the classification accuracy reached the maximum value of 62% (std 5%) when the number of features was k = 58. After this peak, the accuracy started to decrease with increasing number of features and dropped below significance level with more than 300 features.
In the alpha band, the opposite trend was found. The accuracy increased with increasing number of
Figure 3. Classification accuracies for different frequency bands. The x-axis indicates the number of features used by the classifier. The grey markers at the tops of the plots imply that the classification accuracy reached a statistically significant value (p < 0.01, Bonferroni-corrected). The light blue shading denotes standard deviation across the cross-validation folds.
features, until reaching a peak of 60% (std 5%) at k = 216. After the peak, the accuracy level reached a plateau but remained above significance level.
3.3. Relevant features
For the frequency bands that showed significant clas-sification accuracy, i.e. theta and alpha, we analysed which phase couplings were the most frequently used to classify the two task conditions and which parcels were most often involved in these phase couplings. 3.3.1. Theta band
The majority of the relevant phase couplings for the classification in the theta band (figure 4(A)) were found between parcels located within the left hemi-sphere, e.g. left frontal parcels (green dots) were coupled to left temporal (purple dots), left parietal (dark orange dots) and left central (blue dots) parcels. In addition, the phase coupling between the left pre-cuneus and left calcarine was important. A few inter-hemispheric phase couplings also emerged as relev-ant: the left supramarginal parcel was coupled with the right supplementary motor area (SMA) and the right paracentral lobule. Finally, the right posterior cingulate cortex was coupled with the right lingual gyrus and the right precuneus was coupled with the right inferior temporal gyrus.
The parcels that were most frequently involved in the classification (highlighted with red labels in figure4(A) were the left superior frontal gyrus (SFG), left SMA, left superior temporal gyrus, left supramar-ginal gyrus (SMG), left paracentral lobule and left posterior cingulate cortex.
3.3.2. Alpha band
In the alpha band, the frontal and occipital parcels were involved in most of the relevant phase couplings (figure4(B)). The frontal parcels were mostly coupled with the left central (pre- and post-central gyri), the left parietal (supramarginal and angular gyri) and bilateral occipital parcels (light orange dots). In addi-tion to the phase couplings with the frontal parcels,
the bilateral occipital parcels were coupled with the left central parcels, parietal parcels, anterior cingu-late parcels and right superior temporal pole. A few important phase couplings were also found between the parcels within the right temporal cortex and left frontal cortex.
The parcels that were most frequently involved in the classification in the alpha band (highlighted with red labels in figure4(B)) were located in the left SFG (medial orbital part), left inferior frontal gyrus (opercular part), left postcentral gyrus, left SMG, left inferior occipital gyrus and left superior occipital gyrus.
3.3.3. Correlation between feature selection probability and mean parcel power difference
In order to rule out the possibility that the feature selection process was driven by a difference in the power between the conditions, we calculated the Pear-son correlation between the feature selection prob-ability and the mean (of the two associated parcels) difference in parcel power (supplementary figure 1). This was performed in the theta and alpha bands for all the features (non-zero probability) and for the features that were identified as the most relevant (figure4), respectively. The results showed no signi-ficant correlation between the feature selection prob-ability and the mean difference in parcel powers (p-values between 0.13 and 0.74). The spatial distribu-tion of the difference in parcel powers between the conditions is shown in z-scored parcel power maps (supplementary figure 2).
3.4. Multiband classification
Concatenating the phase coupling patterns from all frequency bands (theta, alpha, beta and gamma) improved the classification accuracy (figure 5(A)). The maximum accuracy was 71% (std 8%) and was reached with the number of features (k) equal to 38. The relevant features for the multiband classification highlight some phase couplings in the theta (n = 8) and alpha (n = 2) bands that were also found to be relevant for the respective single band classifications
Figure 4. Most relevant phase couplings in the (A) theta and (B) alpha bands. The relevant phase couplings were estimated by feature selection probability. Only phase couplings that had a feature selection probability three standard deviations above the mean are shown. Each line in the circle plot represents the phase coupling between two parcels and the colour of the line indicates the frequency selection probability; darker colours indicate relatively high frequency selection probability. Red parcel labels indicate the most relevant parcels. In the bottom row, the same phase couplings are visualised on a brain template.
Figure 5. Classification accuracy and relevant features for the classification with all the frequency bands. (A) Accuracies as a function of the number of selected features (k). (B)–(D) Features that contributed to the classification from each frequency band.
(figures5(B) and (C)). In addition, selected phase couplings in the gamma band (n = 6) contributed to the multiband classification (figure5(D)). The phase couplings in the gamma band involved mainly frontal (left inferior frontal gyrus, left paracentral lobule, left middle frontal gyrus and right middle frontal gyrus) and right temporal (inferior temporal gyrus, superior temporal pole and Heschl gyrus) parcels. In addition, the middle cingulate cortex and left Rolandic opercu-lum were involved in the relevant gamma band phase couplings.
The results of the single and multiband classi-fications point to the conclusion that the beta band phase coupling is not relevant for the decoding of the WM and control conditions and that the improved
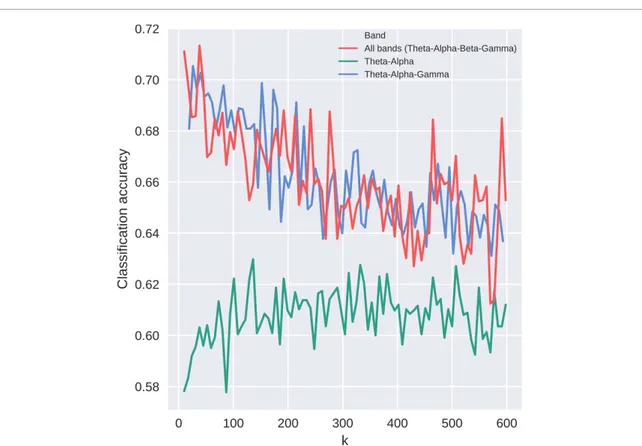
accuracy results from the inclusion of the gamma band. These observations motivated two additional analyses: classification with concatenated theta and alpha band features, and classification with concaten-ated theta, alpha and gamma band features (figure6). The maximum accuracy of the theta–alpha band clas-sification was 63% (std 7%) which is comparable to the maximum accuracy achieved in the single band analysis (62% with the theta band). The maximum accuracy of the theta–alpha–gamma band classific-ation was 71% (std 9%) and, in general, accuracy values for the theta–alpha–gamma band classifica-tion were comparable with the multiband classific-ation accuracies across the whole range of selected features (k).
Figure 6. Classification accuracies for multiband (all bands: theta–alpha–beta–gamma), theta–alpha and theta–alpha–gamma analysis, respectively. The concatenation of the theta and alpha bands results in similar accuracies to the theta and alpha bands alone (see supplementary figure 4). The multiband and theta–alpha–gamma classification accuracies are comparable, indicating that the removal of the beta band did not affect the results.
3.5. Directed phase couplings
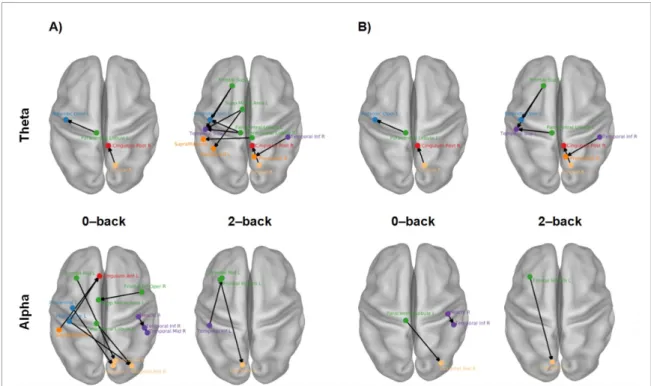
After identifying the most relevant phase couplings for single and multiband classifications, we tested, for both conditions separately, whether some of these phase couplings have preferred directionality across subjects (MPSI value across subjects has a non-zero median). The results are shown in figure7 for the theta and alpha bands and for both task conditions separately. The analyses reveal that in the theta band, consistent phase couplings (sign test, p < 0.01 uncor-rected) from frontal parcels to other parcels and from the right inferior temporal gyrus to right precuneus were observed in the WM condition but not in the control condition. In contrast, in the alpha band, more consistent directed phase couplings emerged in the control compared to the WM condition. Spe-cifically, directed phase couplings were found from left frontal/central parcels to right occipital parcels in the control condition but not in the WM condi-tion. However, after multiple comparisons (sign test, p < 0.05 Bonferroni-corrected), some of the signi-ficant phase couplings vanished and the differences between the conditions were less evident. The relev-ant gamma band features did not show any phase couplings with preferred directions in either of the conditions.
4. Discussion
In the current study, we used machine learning to perform data-driven analysis on MEG frequency-specific functional connectomes in order to exam-ine the existence of phase coupling patterns that can discriminate between WM (2-back) and control (0-back) conditions and are common across sub-jects. For each subject and for both conditions we calculated directional phase coupling matrices in the theta, alpha, beta and gamma frequency bands. A lin-ear support vector machine was then trained using the phase coupling data and the performance of the classifier was evaluated by means of across-subjects cross-validation. Our classification and relevant fea-ture analyses (both in single and multiband) demon-strate phase coupling patterns in the theta and alpha bands that are important for discrimination between the WM and control conditions. This result is in accordance with a recent study by Wang et al (2019), which analysed information flow in WM tasks using phase transfer entropy. The results show consistent information flow only in the theta and alpha bands while the information flow in the delta, beta and gamma bands is weak and dispersed [6]. However, in addition, our results support the relevance of the
Figure 7. Phase couplings that have preferred directionality shown for both task conditions and for the theta and alpha bands, separately. The arrows represent significant phase coupling directionality between two parcels. The arrowhead points from the leading parcel to the following parcel. (A) In the theta band (top row), the WM condition shows more phase couplings that have consistent direction across subjects (p < 0.01, uncorrected) than the control condition. Specifically, this is observed from frontal parcels to other parcels. In contrast, the alpha band shows more phase couplings with consistent direction in the control condition (p < 0.01, uncorrected). (B) Bonferroni-corrected (p < 0.05) directed phase couplings.
gamma band phase coupling to the WM processes as the multiband analyses show the contribution of the gamma band features to the discrimination of the two tasks.
Moreover, the fact that the classification was per-formed on a group level (across subjects), using a large set of participants, indicates that the phase coup-ling patterns found to be relevant are consistent across subjects and can be generalised to new individuals [18,61]. In other words, we found the same pattern of phase couplings across individuals as a trace of the WM task.
We identified the parcels (brain areas) and the functional connections (phase couplings) that were most often selected for the classification. The results show that without a priori assumptions, the emerging relevant phase couplings and involved brain areas are in line with the putative mechanisms underly-ing WM. Furthermore, our additional analysis of par-cel powers, reported in the supplementary materials, showed that the identified phase coupling patterns are not biased by the difference in power between the conditions, as demonstrated by: (a) correlation ana-lysis between the feature selection probability and the mean power difference of the respective parcels (sup-plementary figure 1) and (b) z-scored power maps (supplementary figure 2).
To the best knowledge of the authors, this is the first study to report successful across-subjects task decoding based on source-level phase coupling of
MEG signals. Comparison of this classification per-formance to previous studies is not straightforward due to accuracy values being influenced by the spe-cific conditions to be discriminated as well as by the classification design (within subjects vs. across subjects). In general, it is acknowledged that across-subjects classifiers exhibit poorer performance than within-subject classifiers [16, 17, 20, 31, 33] as a result of genuine inter-individual differences in the anatomical/functional architecture of the brain and the inherent variability in the environmental/meas-urement conditions between different measenvironmental/meas-urement sessions [16, 20, 61]. More specifically, to the best knowledge of the authors, no MEG studies and only two EEG studies [62, 63] used source-level func-tional connectivity as features for classifying task condition/brain states with an asubjects cross-validation approach. The study by Dimitrakopoulos et al (2017) [62] used Pearson correlation as a func-tional connectivity metric in order to classify the workloads of two tasks (N-back and arithmetic task), reporting a maximum accuracy of 88% for the work-load classification. However, two factors may have inflated these accuracy values: (a) the correlation does not account for spurious connectivity induced by spatial leakage, and (b) the leave-one-out cross-validation is suboptimal since it might lead to vari-able and biased results [57]. The study by Wang et al (2020) [63] used different film clips to induce dif-ferent emotions (positive, negative, neutral). They
used weighted partial directed coherence (wPDC) to obtain connectivity networks in five frequency bands: delta, theta, alpha, beta and gamma. Features derived from the wPDC analysis were used to classify the emotion. This study showed a maximum accuracy of 66.67% when relying on theta band connectivity. Fur-thermore, these classification studies used a limited set of subjects (n = 25 in Dimitrakopoulos et al (2017) [62], n = 15 in Wang et al (2020) [63]) that might cause a large error in the estimation of classification accuracy [42]. Conversely, we used a large cohort of subjects (n = 83) in the across-subjects classification approach.
4.1. Relevant phase couplings and involved brain areas in the theta band support the role of theta band activity in executive control and temporal order coding
In previous WM literature, the theta band activity has been proposed to have a special role in coordinating, monitoring and controlling complex WM tasks [64]. In particular, theta band phase coupling from pre-frontal to temporal areas [8,12] and from prefrontal to parieto-occipital areas has been shown to have a key role in executive control in WM [65,66]. Interest-ingly, we demonstrate that frontoparietal, frontotem-poral and frontocentral phase couplings are the dom-inant features that underlie the discrimination of the WM and control conditions in the theta band. This is observed both in single band and multiband analyses. Furthermore, the left SFG, left SMA and left SMG, which we found to be among the most relevant par-cels, have all been reported as important for WM.
The SFG, an area of the prefrontal cortex, has been shown to be regularly activated in the N-back paradigm [67]. A study by Boisgueheneuc et al (2006) showed that patients with SFG lesions were impaired in N-back WM tasks, especially when the executive demand was high [68]. Given that executive demands in the WM condition are arguably higher with respect to the control condition, our results are in agree-ment with the proposed role of the SFG in executive control.
Theta band oscillations have been also reported to be involved in the maintenance and organisation of the temporal order of items in WM [5,69]. Interest-ingly, the left SMG and the SMA, which we identified among the most important parcels for the classifica-tion, have been associated with temporal order cod-ing [70] and sequence processing [71,72]. A recent study by Guidali et al (2019) demonstrated that low-frequency rTMS applied over SMG disrupted the per-formance of participants in a short-term memory task. This effect was specific for temporal order information; that is, the participants remembered the correct items but made more errors in recalling the temporal order of these items [70]. It is therefore plausible that the emergence of the SMA and SMG as the most important parcels for the theta band
decoding reflects the different demands between the two task conditions in the temporal domain; that is, encoding and maintenance of the temporal order of the stimuli are relevant for the WM but not for the control condition.
Finally, we analysed, in each condition, whether the relevant phase couplings have preferred directions that are consistent across subjects. Preferred direction was mainly observed in the WM condition and the frontal parcels were identified as the ‘leading’ parcels, indicating anterior to posterior phase coupling dir-ection (figure7). This is in accordance with a recent study by Wang et al (2019), which showed increased information flow strength from frontal to parieto-occipital regions and associated this information flow with central executive functions in WM [6].
Taken together, the relevant phase couplings for the theta band classification found in the current study converge with the evidence supporting the pro-posed role of the theta band in executive control when the complexity of the task or its attentional demands are high. Furthermore, the theta band phase coupling seems to be involved in temporal order coding, with SMG and SMA possibly acting as key areas related to this function.
4.2. Alpha band oscillations might serve multiple functional roles
The frontocentral, frontoparietal, parieto-occipital and fronto-occipital phase couplings were found to be relevant for decoding in the alpha band (figure4). Furthermore, alpha band phase couplings between left frontal (superior and inferior opercular) par-cels and the right cuneus were found to be relevant for multiband classification. The most relevant par-cels for the classification were found in the frontal, central, parietal and occipital regions. This wide-spread pattern of phase couplings needed for the alpha band classification proposes that phase coup-ling in the alpha band could serve multiple func-tions in WM. In fact, it has been hypothesised, based on nonhuman primate studies, that alpha oscillations might support different functions depending on the laminar organisation of the alpha generators [73]. Increased alpha oscillations in higher-level cortices may play a direct role in facilitating representation of task-relevant information and sensory processing, while increased alpha in lower-level (sensory) cortices could support functional inhibition [74]. Although the N-back task does not directly emphasise atten-tion, the involvement of the frontal and parietal par-cels indicates that phase coupling in the alpha band plays a role in attentional functions. Indeed, the alpha band phase coupling has been previously associated with top-down modulation and attention [11,75–
77]. On the other hand, phase coupling in the alpha band has been associated with distraction inhibition [78,79] and inhibition of task-irrelevant brain areas [13]. The involvement of occipital parcels supports
the commonly suggested ‘gating by inhibition’ role of alpha activity [80–82] for which the evidence has often been observed in the posterior brain areas [13,
69,78,83]. Directed phase couplings involving par-cels in the occipital cortex were found in the current study mainly in the control condition (figure7). This might reflect the inhibitory control of the alpha phase coupling because in the control condition the cur-rently presented image becomes a distraction after the matching process is completed and the suppression of the current image is therefore beneficial, while in the WM condition each image needs to be encoded for forthcoming trials.
An interesting notion can be taken from the observations that a relatively large number of fea-tures were needed in the alpha band for success-ful decoding in the single band case, and that only two features from the alpha band were identified as relevant for the multiband classification. This sug-gests that the differences between the conditions are subtle and it is the joint information stored in multiple phase couplings and not individual phase couplings that allows the discrimination between the two tasks.
4.3. Multiband classification emphasises the complementary role of the different frequency bands and reveals the role of the gamma band The multiband classification improved the classifica-tion accuracy (figure5(A)) by leveraging the inform-ation coded in patterns of phase couplings across the frequency bands. This implies that the phase coup-ling patterns in different frequency bands add dif-ferent information to the classification, since pooling redundant information would not lead to improved classification performance. The frequency band spe-cificity of the phase coupling patterns can also be observed in the MPSI connectome graphs (supple-mentary figure 3).
The multiband classification also revealed that a few gamma band features contributed to the multiband classification, even though the classifica-tion in the gamma band individually did not yield statistically significant results. To confirm that the improved accuracy resulted from the inclusion of the gamma band, we performed two additional ana-lyses (figure6). First, we removed the beta band from the multiband analysis. This yielded virtu-ally the same results as the concatenation of all bands, indicating that the beta band did not con-tribute to the improved accuracy observed in the multiband classification. Next, we concatenated only the theta and alpha bands, i.e. further removed the gamma band. The classification accuracies using the concatenated theta and alpha bands resulted in slightly better accuracies compared to the respect-ive single band accuracies (supplementary figure 4) but a remarkable drop in accuracies compared to the
multiband classification. These results further indic-ate that the gamma band phase coupling patterns appear relevant when combined with information from the other frequency bands and demonstrate the strength of the multiband approach, since it can show the complementary information coded in dif-ferent frequency bands that cannot be revealed using a single band.
The gamma band phase couplings that were relevant for the multiband classification involved mainly frontal and right temporal parcels. Increased local [84–86] and long-range [11,87] gamma band synchronisations have been previously reported during WM tasks, especially during the mainten-ance period of the task. The increased gamma band synchronisation has been related to mainten-ance of object/feature representations and binding of the object representations. On the other hand, gamma band synchronisation has been proposed to serve a more general role in attentional functions [11,88,89]. A study by Tseng et al (2018) provided evidence of the feature binding account of gamma oscillations by applying transcranial alternating cur-rent stimulation (tACS) over the left temporal and parietal cortex. Anti-phase gamma tACS enhanced the performance of low-performing individuals and this effect was specific to the binding task [90]. In the current study, the visual features of the stimuli were on average the same for both conditions. However, as discussed earlier, the WM condition requires active effort to encode and maintain the currently presen-ted image for the next trials, whereas the control condition does not require such effort. It is therefore plausible that the phase coupling patterns involving temporal and frontal parcels are related to this dif-ference between the conditions, as Honkanen et al (2015) proposed that gamma oscillations in frontal areas might be related to the active effort required to bind the task-relevant object features into coherent WM representations [88].
4.4. Limitations
We have discussed how the phase couplings that were the most relevant for the classification support the earlier findings in the WM literature. However, it must be noted that the N-back task used in the HCP does not allow a clear separation of the different stages of WM, that is, the encoding, maintenance and retrieval. Therefore, it is not possible to conclusively establish that the observed phase coupling patterns were induced by specific neural processes. Ad hoc tasks should be designed in order to further invest-igate how the presented approach can contribute to unravelling the processing in different stages of WM. As a second possible limitation of this study, we acknowledge that the HCP WM task design is such that the time window used to estimate the phase coupling is the same in which the subjects provided their motor response. This might have affected the
beta band results, since it is possible that subtle beta band phase coupling differences between the condi-tions were masked by strong motor responses that were similar in both conditions.
Finally, a low number of incorrect trials was reported in these data since the subject performance was high. Thus, due to this imbalance, it did not make sense to separately analyse incorrect and correct tri-als. Nevertheless, a task that induces more incorrect responses would be desirable for future studies since the classification between incorrect and correct trials would give stronger evidence of the behavioural rel-evance of the involved phase coupling patterns. 4.5. Conclusions
We report, for the first time to our knowledge, that it is possible to discriminate between a WM condition and control condition by using a machine learning approach applied to MEG source-level phase coup-ling data. The across-subjects cross-validation in this relatively large cohort of 83 subjects indicates that the phase coupling patterns in theta and alpha bands are task-specific and common across subjects. These res-ults accumulate evidence for the crucial role of low-frequency oscillatory networks in inter-regional com-munication, especially in tasks involving top-down processes [6, 91–93]. Furthermore, the multiband classification increased the accuracy and revealed that gamma band phase coupling also contains task-specific information. The increased accuracy in the multiband classification also implies that phase coup-ling patterns in different frequency bands are inde-pendent and related to different neural processes. In future studies, the approach based on the source-level directed phase couplings could be used to contrast many different WM (or cognitive in general) condi-tions. As already demonstrated in an fMRI study [14], contrasting multiple conditions, all addressing differ-ent aspects, allows one to find connectivity patterns that characterise different aspects of WM processing but are still overlapping. Furthermore, a comparative study testing different (robust) phase coupling meas-ures in combination with different classifiers would be insightful.
Data and code availability statement
The data used in this study are publicly available and can be downloaded from the Human Connectome Project database (https://db.humanconnectome.org). The FieldTrip toolbox (Oostenveld et al 2011) is freely available (www.fieldtriptoolbox.org/download/) under the GNU General Public License. Soft-ware packages used for classification analyses are freely available at: scikit-learn (
https://scikit-learn.org/), nilearn (https://nilearn.github.io) and
scipy (www.scipy.org).
The phase coupling (MPSI) data and the MatLab script for calculation of the MPSI are available upon
request. Conditions for sharing or re-use include cita-tion of the related papers, compliance with CC BY-NC-ND 4.0 licensing, with the requirements of the funding bodies and with institutional ethics approval.
Acknowledgments
This work has been partially conducted under the framework of the ‘Departments of Excellence 2018– 2022’ initiative of the Italian Ministry of Education, University and Research for the Department of Neur-oscience, Imaging and Clinical Sciences (DNISC) of the University of Chieti-Pescara.
Conflict of interest
The authors declare no conflict of interest.
Funding
This project has received funding from the European Union’s Horizon 2020 research and innovation pro-gramme under the Marie Skłodowska-Curie Grant Agreement No. 713645 and from the European Research Council (ERC Synergy) under the European Union’s Horizon 2020 research and innovation pro-gramme (ConnectToBrain; grant agreement No 810377). Data were provided in part by the Human Connectome Project, WU-Minn Consortium (Prin-cipal Investigators: David Van Essen and Kamil Ugur-bil; 1U54MH091657) funded by the 16 NIH Institutes and Centers that support the NIH Blueprint for Neur-oscience Research; and by the McDonnell Center for Systems Neuroscience at Washington University.
ORCID iDs
Jaakko Syrjälä https://orcid.org/0000-0002-2959-0900
Alessio Basti https://orcid.org/0000-0002-8392-7201
Roberto Guidotti https://orcid.org/0000-0002-0807-6005
Laura Marzetti https://orcid.org/0000-0002-6481-3743
Vittorio Pizzella https://orcid.org/0000-0002-0452-1108
References
[1] Misic B and Sporns O 2016 From regions to connections and networks: new bridges between brain and behavior Curr.
Opin. Neurobiol.40 1–7
[2] Varela F, Lachaux J-P, Rodriguez E and Martinerie J 2001 The brainweb: phase synchronization and large-scale integration Nat. Rev. Neurosci.2 229–39
[3] Baddeley A 2003 Working memory and language: an overview J. Commun. Disord.36 189–208
[4] Sauseng P and Klimesch W 2008 What does phase information of oscillatory brain activity tell us about cognitive processes? Neurosci. Biobehav. Rev.32 1001–13
[5] Roux F and Uhlhaas P J 2014 Working memory and neural oscillations: alpha–gamma versus theta–gamma codes for distinct WM information? Trends Cogn. Sci.18 16–25
[6] Wang R, Ge S, Zommara N, Ravienna K and Espinoza T 2019 Consistency and dynamical changes of directional information flow in different brain states: a comparison of working memory and resting-state using EEG
Neuroimage203 116188
[7] Fries P 2015 Rhythms for cognition: communication through coherence Neuron88 220–35
[8] Fell J and Axmacher N 2011 The role of phase
synchronization in memory processes Nat. Rev. Neurosci.
12 105–18
[9] Siebenhühner F, Wang S H, Palva J M and Palva S 2016 Cross-frequency synchronization connects networks of fast and slow oscillations during visual working memory maintenance Elife5 e13451
[10] Sauseng P, Klimesch W, Stadler W, Schabus M, Doppelmayr M, Hanslmayr S, Gruber W and Birbaumer N 2005 A shift of visual spatial attention is selectively associated with human EEG alpha activity Eur. J. Neurosci.22 2917–26
[11] Palva J M, Monto S, Kulashekhar S and Palva S 2010 Neuronal synchrony reveals working memory networks and predicts individual memory capacity Proc. Natl Acad. Sci.
107 7580–5
[12] Daume J, Gruber T, Engel A K and Friese U 2017 Phase-amplitude coupling and long-range phase synchronization reveal frontotemporal interactions during visual working memory J. Neurosci.37 313–22
[13] Crespo-Garcia M, Pinal D, Cantero J L, Díaz F, Zurrón M and Atienza M 2013 Working memory processes are mediated by local and long-range synchronization of alpha oscillations J. Cogn. Neurosci.25 1343–57
[14] Soreq E, Leech R and Hampshire A 2019 Dynamic network coding of working-memory domains and working-memory processes Nat. Commun.10 1–14
[15] O’Toole A J, Jiang F, Abdi H, Pénard N, Dunlop J P and Parent M A 2007 Theoretical, statistical, and practical perspectives on pattern-based classification approaches to the analysis of functional neuroimaging data J. Cogn.
Neurosci.19 1735–52
[16] Kauppi J-P, Parkkonen L, Hari R and Hyvärinen A 2013 Decoding magnetoencephalographic rhythmic activity using spectrospatial information Neuroimage83 921–36
[17] Besserve M, Jerbi K, Laurent F, Baillet S, Martinerie J and Garnero L 2007 Classification methods for ongoing EEG and MEG signals Biol. Res.40 415–37
[18] Kia S M, Pedregosa F, Blumenthal A and Passerini A 2017 Group-level spatio-temporal pattern recovery in MEG decoding using multi-task joint feature learning J. Neurosci.
Methods285 97–108
[19] Carlson T A, Schrater P and He S 2003 Patterns of activity in the categorical representations of objects J. Cogn. Neurosci.
15 704–17
[20] Chan A M, Halgren E, Marinkovic K and Cash S S 2011 Decoding word and category-specific spatiotemporal representations from MEG and EEG Neuroimage
54 3028–39
[21] Cox D D and Savoy R L 2003 Functional magnetic resonance imaging (fMRI) ‘brain reading’: detecting and classifying distributed patterns of fMRI activity in human visual cortex
Neuroimage19 261–70
[22] Eklund A, Nichols T E and Knutsson H 2016 Cluster failure: why fMRI inferences for spatial extent have inflated false-positive rates Proc. Natl Acad. Sci. USA113 7900–5
[23] Demuru M et al 2017 Functional and effective whole brain connectivity using magnetoencephalography to identify monozygotic twin pairs Sci. Rep.7 1–11
[24] Georgopoulos A P et al 2007 Synchronous neural interactions assessed by magnetoencephalography: a functional biomarker for brain disorders J. Neural. Eng.
4 349–55
[25] Cetin M S et al 2016 Multimodal classification of
schizophrenia patients with MEG and fMRI data using static and dynamic connectivity measures Front. Neurosci.10 466
[26] Nissen I A et al 2018 Localization of the epileptogenic zone using interictal MEG and machine learning in a large cohort of drug-resistant epilepsy patients Front. Neurol.9 647
[27] Pollonini L, Patidar U, Situ N, Rezaie R, Papanicolaou A C and Zouridakis G 2010 Functional connectivity networks in the autistic and healthy brain assessed using Granger causality 2010 Annual Int. Conf. IEEE Engineering in
Medicine and Biology Society, EMBC’10
[28] Tsiaras V, Simos P G, Rezaie R, Sheth B R, Garyfallidis E, Castillo E M and Papanicolaou A C 2011 Extracting biomarkers of autism from MEG resting-state functional connectivity networks Comput. Biol. Med.41 1166–77
[29] Zhang J, Richardson J D and Dunkley B T 2020 Classifying post-traumatic stress disorder using the
magnetoencephalographic connectome and machine learning Sci. Rep.10 1–10
[30] Ahmadi A, Davoudi S, Behroozi M and Daliri M R 2020 Decoding covert visual attention based on phase transfer entropy Physiol. Behav.222 112932
[31] Zhigalov A, Heinilä E, Parviainen T, Parkkonen L and Hyvärinen A 2019 Decoding attentional states for neurofeedback: mindfulness vs. wandering thoughts
Neuroimage185 565–74
[32] Rieger J W, Reichert C, Gegenfurtner K R, Noesselt T, Braun C, Heinze H-J, Kruse R and Hinrichs H 2008 Predicting the recognition of natural scenes from single trial MEG recordings of brain activity Neuroimage
42 1056–68
[33] Ramkumar P, Jas M, Pannasch S, Hari R and Parkkonen L 2013 Feature-specific information processing precedes concerted activation in human visual cortex J. Neurosci.
33 7691–9
[34] Geravanchizadeh M and Bakhshalipour Gavgani S 2020 Selective auditory attention detection based on effective connectivity by single-trial EEG J. Neural. Eng.17 026021
[35] Provenza N R, Paulk A C, Peled N, Restrepo M I, Cash S S, Dougherty D D, Eskandar E N, Borton D A and Widge A S 2019 Decoding task engagement from distributed network electrophysiology in humans J. Neural. Eng.16 056015
[36] Al-Fahad R, Yeasin M and Bidelman G M 2020 Decoding of single-trial EEG reveals unique states of functional brain connectivity that drive rapid speech categorization decisions
J. Neural. Eng.17 016045
[37] Basti A, Pizzella V, Chella F, Romani G L, Nolte G and Marzetti L 2018 Disclosing large-scale directed functional connections in MEG with the multivariate phase slope index
Neuroimage175 161–75
[38] Schoffelen J-M and Gross J 2009 Source connectivity analysis with MEG and EEG Hum. Brain Mapp.30 1857–65
[39] Marzetti L, Basti A, Chella F, Andrea A D, Syrjälä J and Pizzella V 2019 Brain functional connectivity through phase coupling of neuronal oscillations: a perspective from magnetoencephalography Front. Neurosci.13 1–21
[40] Larson-Prior L J et al 2013 Adding dynamics to the Human Connectome Project with MEG Neuroimage
80 190–201
[41] WU-Minn HCP consortium 2015 WU-Minn HCP 900 subjects data release: reference manual pp 1–187 (available at:www.humanconnectome.org/storage/app/media/ documentation/s900/HCP_S900_Release_Reference _Manual.pdf) (Accessed 8 August 2020)
[42] Varoquaux G 2018 Cross-validation failure: small sample sizes lead to large error bars Neuroimage180 68–77
[43] Nolte G, Ziehe A, Nikulin V V, Schlögl A, Krämer N, Brismar T and Müller K 2008 Robustly estimating the flow direction of information in complex physical systems Phys. Rev. Lett.
100 234101
[44] Oostenveld R, Fries P, Maris E and Schoffelen J-M 2011 FieldTrip: open source software for advanced analysis of