Dipartimento di Scienze Ambientali
Dottorato di Ricerca in Genetica e Biologia Cellulare XXIII ciclo
Understanding temperature-related physiological processes
through proteomics in vegetal and animal systems
Applicazioni della proteomica alla comprensione di processi
fisiologici influenzati dalla temperatura in sistemi vegetali e
animali
Docente guida: Prof. Lello Zolla
Coordinatore: Prof. Luigi Prantera
INDICE
Two-dimensional electrophoresis coupled to mass spectrometry: tips and pitfalls 3 PART I- The influence of temperature on plant development in a
vernalization-requiring winter wheat: a proteomic investigation
6
Aim of the study 6
Background 9
Material and Methods 14
Results 22
Discussion 46
PART II- Proteomic analysis of a drought-resistant spring wheat cultivar in
response to prolonged cold stress
63
Aim of the study 63
Background 65
Cold stress in wheat 67
Material and Methods 71
Results 78
Discussion 95
PART III- Platelet storage temperature and new perspectives through
proteomics
102
Background 103
New proteomic applications to study platelet storage 108
Proteomic analysis of plasma derived from platelet buffy coats during storage at room temperature. An application of ProteoMinerTM technology.
112
Aim of the study 112
Materials and Methods 113
Results 118
Discussion 132
Two-dimensional electrophoresis coupled to mass spectrometry: tips and pitfalls
Despite alternative technologies that have emerged, 2-dimensional (2-D) electrophoresis is currently the only technique that can be routinely applied for parallel quantitative expression profiling of large sets of complex protein mixtures. 2-D electrophoresis is a powerful and widely used method for the analysis of complex protein mixtures extracted from cells, tissues, or other biological samples. This technique separates proteins according to two independent properties in two discrete steps. The first-dimension step, isoelectric focusing (IEF), separates proteins according to their isoelectric points (pI); the second-dimension step, sodium dodecyl sulfate-polyacrylamide gel electrophoresis (SDS-PAGE), separates proteins according to their molecular weights (Mr, relative molecular mass). Each spot on the resulting two-dimensional gel potentially corresponds to a single protein species in the sample. Thousands of different proteins can thus be separated, and information such as the protein pI, the apparent molecular weight, and the amount of each protein can be obtained. Two-dimensional electrophoresis was first introduced by O’Farrell (1975). In the original technique, the first dimension separation was performed in carrier-ampholyte-containing polyacrylamide gels cast in narrow tubes. 2D-E delivers a map of intact proteins that reflects changes in protein expression level, isoforms, or post-translational modifications. 2-DE shows as main advantages the simplicity, reproducibility, awide size range (10 kDa to 500 kDa) and the fact that both moderately hydrophobic and very acidic-basic proteins can be isolated and visualized. A large and growing application of 2-D electrophoresis is within the field of proteomics. The analysis involves the systematic separation, identification, and quantitation of many proteins simultaneously from a single sample. Two-dimensional electrophoresis is used in this field due to its unparalleled ability to separate thousands of proteins simultaneously. The technique is also unique in its ability to detect post- and co-translational modifications, which cannot be predicted from the genome sequence.
Historically, two-dimensional PAGE has been the primary method of separation and comparison for complex protein mixtures. This method has been critical in developing our
understanding of the complexity and variety of proteins contained in cells and bodily fluids. Although impressive improvements in two-dimensional PAGE technologies have occurred in recent years, limitations are apparent when dealing with low abundance and membrane proteins, which escape from detection and may limit the broad mapping of proteins in samples. Moreover, two-dimensional PAGE is laborintensive, requires relatively large sample quantities, is poorly reproducible, has a limited dynamic range for protein detection, and has difficulties in detecting proteins with extremes in molecular mass and isoelectric point (Rabilloud, 2002). To address these limitations several types of mass spectrometry, in conjunction with various separation and analysis methods, are increasingly being adopted for proteomic measurements (Yates, 2000).
Protein identification can be done only after tryptic digestion of spots cut out from 2DE maps, and subsequent mass spectrometry analysis. This can be performed either by PMF (peptide mass finger printing) or by MS/MS analysis, although nowadays, to enhance proteome resolution it is often necessary to use multiple techniques that provide complementary results. A PMF database search is usually employed following MALDI TOF mass analysis. The premise of peptide mass finger printing is that every unique protein will have a unique set of peptides and hence unique peptide masses. This technique does well with 2DE gel spots where the protein purity is high. PMF protein identification can run into difficulties with complex mixtures of proteins. Low level identification also becomes difficult due to common place contamination by keratin, and is not suitable for those organisms with little genomic information (Hughes and Dunn, 1996; Gilmour et al., 2000). Moreover, since Peptide Mass Fingerprinting is performed by matching their constituent fragment masses (peptide masses) to the theoretical peptide masses generated from a protein or DNA database, it can only be used for species where the genome is known. Unfortunately, genetic and genomic information for crops and vegetables is still limited despite the complement of genome of Arabidopsis, rice and Poplar is rapidly advancing. Regarding the MALDI/TOF analysis, a limitation is that the measured signal intensity is not linear with the quantity of introduced sample, and
therefore the method is not applicable for determining concentrations of peptides/proteins in a mixture. Strengths of MALDI-TOF, instead, are its high sensitivity, broad mass range, relative tolerance to salts/buffers and suitability for the analysis of relatively complex mixtures. HPLC and µLC coupled to ESI-MS/MS presently dominate the field of protein identification by tandem mass spectrometry and database searching. ESI-MS/MS offers definitive information about protein structure; in some cases amino acid sequence and specific chemical modifications can be unequivocally deduced from the pattern of product ions generated. It is indicated for screening and structural characterization of complex mixtures of peptides, giving more reliable results for protein identification. MS/MS methods can be employed to identify unknown proteins and posttranslational modifications. Additionally, since the technique uses soft ionization, it is possible to observe labile species, e.g., nitrosothiols, protein multimers and even biologically native non-covalent interactions which would be destroyed and therefore undetected in a MALDI-TOF MS experiment, such as sites of non-covalent association with small molecules or other proteins. Limitations of ESI-MS/MS are the need for relatively high purity protein samples and a poor tolerance for electrolytes and detergents.
References
- O’Farrell, P. H. High resolution two-dimensional electrophoresis of proteins. J. Biol. Chem. 250, 4007–4021 (1975).
- Hughes MA, Dunn MA. The molecular biology of plant acclimation to low temperature. J Exp Biol 1996;47:291–305.
- Gilmour SJ, Sebolt AM, Salazar MP, Everard JD, Thomashow MF. Overexpression of the Arabidopsis CBF3 transcriptional activator mimics multiple biochemical changes associated with cold acclimation. Plant Physiol 2000;124:1854–65.
- Rabilloud, T. (2002) Two-dimensional gel electrophoresis in proteomics: old, old fashioned, but it still climbs up the mountains. Proteomics 2, 3–10.
PART I
The influence of temperature on plant development in a vernalization-requiring
winter wheat: a proteomic investigation
Aim of the study
The first objective of my PhD was the study of the influence of prolonged cold treatment on the expression of cold-induced proteins in a vernalized common wheat (Triticum aestivum L.), to identify proteomic changes in vernalization-treated plants when the key steps in controlling the flowering time occur. Non-proteomic studies on protein changes in plants upon prolonged cold exposure have been already performed, leading to the undisclosure of new protein isoforms, modulation of pre-existing products and accumulation of frost resistance-related proteins (Karimzadeh et al., 2005; Jahanbakhsh et al., 2007). In constrast, proteomics has been used so far to study the mechanisms of plant responses to short-term cold treatments, in order to focus on major protein modulations which are likely to be involved in defence processes against adverse conditions (Goulas et al., 2006; Hashimoto et al., 2007; Lee et al., 2007; Cui et al., 2005). Although vernalization is the same as cold treatment except for the length of the low temperature exposure, it is physiologically different in that the cold treatment usually does not affect flowering time significantly whereas vernalization does it dramatically.
We choose for this study a winter-habit wheat cultivar (named Cheyenne) with a long vernalization requirement and excellent cold tolerance (Mahfoozi et al. 2001). Seedlings were grown at optimal environmental conditions for 14 days, then transferred into conditioned chambers kept at 4 °C and 20 °C, respec tively, both for a period of 63 days. Leaf proteome of cold acclimated and vernalized winter wheat were compared with the control non acclimated ones grown at control temperature of 20 °C. Total protein was extracted from the leaves of cold treated or control plants, then separated by 2-dimensional electrophoresis. The identities of differentially expressed proteins were determined by tandem mass spectrometry. Cold tolerance and vernalization requirement
were respectively determined by LT50 and final leaf number (FLN) measurements. Leaf proteomes were examined and cross-compared through classical two-dimensional electrophoresis maps, followed by LC-ESI-MS/MS analysis.
The data demonstrated a differential expression of several proteins involved in different cellular functions. Identifying proteins that up/down regulated during cold acclimation or in response to vernalization does provide information about the mechanisms involved in cold tolerance and their effect on regulating vernalization in temperate cereals.
References
- Jahanbakhsh S, Karimzadeh G, Rastgar F. 2007. Low temperature induced accumulation of, and SDS-PAGE changes in soluble proteins in the leaves of spring and winter wheat genotypes. The journal of Agricultural Science 16, 73-83.
- Karimzadeh G, Darvishzadeh R, Jalali-Javaran M, Dehghani H. 2005. Cold-induced accumulation of protein in the leaves of spring and winter barley cultivars. Acta Biologica Hungarica 56, 83-96. - Goulas E, Schubert M, Kieselbach T, Kleczkowski LA, Gardeström P, Schröder W, Hurry V. The chloroplast lumen and stromal proteomes of Arabidopsis thaliana show differential sensitivity to short- and long-term exposure to low temperature. Plant J 2006;47:720-34.
- Hashimoto M, Komatsu S. Proteomic analysis of rice seedlings during cold stress. Proteomics 2007;7:1293-302.
- Lee DG, Ahsan N, Lee SH, Kang KY, Lee JJ, Lee BH. An approach to identify cold-induced low-abundant proteins in rice leaf. C R Biol 2007;330:215-25.
- Cui S, Huang F, Wang J, Ma X, Cheng Y, Liu J. A proteomic analysis of cold stress responses in rice seedlings. Proteomics 2005;5:3162-72.
- Mahfoozi S, Limin AE, Fowler DB. Developmental regulation of low-temperature tolerance in winter wheat. Ann Bot-London 2001;87:751-7.
Background
Triticum aestivum L., commonly termed bread wheat, is among the most resistant crops able to grow under severe and diverse environmental conditions. This successful fitness is achieved through strict control of the flowering process, in other words getting the flowering time right is crucial to the plant’s survival.
Vernalization is defined as a period of exposure to low, non-freezing temperatures, which certain plants require in order to be able to flower in spring (Streck et al., 2003).
This term refers to the acceleration of flowering that occurs in many plant species after a prolonged exposure of their imbibed seeds or young seedlings to extended periods of cold. This is not all-or-none, but a slow, quantitative process in which increasing periods of cold cause progressively earlier flowering until a saturation point is reached. Plants that are vernalized as seeds or young seedlings do not flower immediately upon being raised to higher temperatures, but often weeks later. There is, therefore, a delay between the perception of cold and the switch from vegetative to reproductive growth. The perception of and response to cold is localized in the meristematic cells of embryos, growing points, and buds. The changes induced in meristems by vernalization are conserved through many generations of cell division even at temperatures much higher than those required for the cold induction of flowering. In some species, this “memory” of vernalization can be maintained for up to 330 d. Vernalization is required in each generation for winter annuals and biennials and each year for perennials. Thus, meiosis appears to reset the requirement for vernalization. There is tremendous natural variation between Arabidopsis ecotypes in the extent to which their time to flowering is shortened by vernalization.
Many plant species have developed this adaptive strategy, among them fall-planted cereals such as winter wheat (Triticum aestivum L.), which survives the cold season in the vegetative stage, entering the more sensitive reproductive phase when both long day photoperiod and mild climate occur. In contrast, spring cereals do not have a vernalization requirement, normally developing rapidly into their reproductive phase when grown under long day photoperiod (Fowler et al., 1996a; Mahfoozi et al., 2006). The molecular basis of
vernalization has been recently elucidated in Arabidopsis (Sung and Amasino, 2004; Michaels and Amasino, 1999; Mylne et al., 2006) and wheat (Laurie et al., 2004; Trevaskis et al., 2007).
Through genetic mapping it has been established that winter wheat possesses recessive vrn-A1, vrn-B1, and vrn-D1 loci, which are induced upon vernalization, whereas spring wheat carries at least one dominant VRN1 allele. This characteristic determines absolute independence from (Vrn-A1) or partial requirement of (Vrn-B1 and Vrn-D1) vernalization to flower. The three VRN1 loci encode proteins related to the Arabidopsis meristem identity APETALA1-like (AP1) MADS-box factors (Danyluk et al., 2003; Trevaskis et al., 2003; Yan et al., 2003). VRN1 induces flowering competency during the vernalization process and also presides over inflorescence meristem development during the second stage towards flowering (Preston and Kellogg, 2008). Another important vernalization factor is VRN2, which acts as a floral repressor in non-vernalized plants grown under long day conditions (Yan et al., 2004). A recent study aimed at characterizing VRN2 gene from Triticum aestivum (TaVRN2) demonstrated that its regulation is also exerted by salt, heat shock, dehydration, wounding and abscissic acid, suggesting its pleiotropic effect in phenological development and plant responsiveness to the environment (Diallo et al., 2010). Finally, VRN3 is the homologue of the flowering integrator flowering locus T (FT) gene in Arabidopsis; it is induced in leaves under long day conditions and promotes early flowering when overexpressed in winter wheat (Yan et al., 2006). Allelic differences for the three homeologous FT loci on the group 7 chromosomes determine variations in flowering times (Yan et al., 2006; Bonnin et al., 2008). On the other hand, the recent molecular genetic analyses of Arabidopsis winter annuals revealed that the epigenetic regulatory mechanism of vernalization tends to suppress a strong floral repressor located in a specific genomic locus, termed FLC (flowering locus C), through a series of modifications in the chromatin structure. The result is the triggering of a flowering cascade process (Sung and Amasino, 2004). A recent paper (Oliver et al., 2009) has shown that the induction of VRN1 in barley is epigenetic, and involves histone modifications of the same
type as occur in FLC in Arabidopsis. However, these change in opposite directions to those in FLC. In VRN1 there is a decrease in trimethylation of histone H3 lysine 27 (H3K27me3), the mark of a transcriptionally inactive gene, and an increase in trimethylation of histone H3 lysine 4 (H3K4me3), a mark of an active gene.
The requirement for vernalization is linked to a plant capacity to cold acclimate and develop freezing tolerance. A study on crop plants has revealed that low temperature (LT) tolerance usually depends on a complex network of inducible genes, which are fully expressed during the vegetative stage; in contrast, this control appears to be switched off during reproductive stage when the plant has limited ability to adapt to cold (Fowler et al., 1996b). Genes involved in development, such as those involved in the photoperiod and vernalization processes, determine the duration of expression of LT-tolerance genes (Fowler et al., 1996a; Mahfoozi et al., 2000). It makes sense that these two processes should be linked to avoid plants in regions that have cold winters making the transition from the vegetative to the reproductive phase too early. It has been postulated that developmental genes are mainly responsible for the duration of expression of LT-induced structural genes; in contrast, the rate of acquisition of LT tolerance is determined at the genetic level by differences in cold-hardiness potential (Fowler et al., 1996a; Mahfoozi et al., 2001). Fowler and co-workers, through studies on wheat (T. aestivum L.) and rye (Secale cereale L.) cultivars, reported a very close association between the point of vernalization saturation and a decline in cold tolerance (Limin and Fowler, 2006). Vernalization-requiring plants go through a process of reducing their final leaf number (FLN) up to the point of vernalization saturation (Fowler et al. 1996a). After this point, cold tolerance is gradually reduced, as it has been observed in many studies on over wintering cereals (Fowler et al. 1996a, b; Trevaskis et al., 2007).
References
- Streck N.A, Weiss A, Baenziger PS. A Generalized Vernalization Response Function for Winter Wheat. Agron J 2003;95:155-9.
- Fowler DB, Limin AE, Wang S-Y, Ward RW Relationship between low-temperature tolerance and vernalization response in wheat and rye. Can J Plant Sci 1996a;76:37-42.
- Mahfoozi S, Limin AE, Ahakpaz F, Fowler DB. Phenological development and expression of freezing resistance in spring and winter wheat under field conditions in north-west Iran. Field Crop Res 2006;97:182-7.
- Sung S, Amasino RM. Vernalization in Arabidopsis thaliana is mediated by the PHD finger protein VIN3. Nature 2004;427:159-64.
- Michaels SD, Amasino RM. FLOWERING LOCUS C encodes a novel MADS domain protein that acts as a repressor of flowering. Plant Cell 1999;11:949-56.
- Mylne JS, Barrett L, Tessadori F, Mesnage S, Johnson L, Bernatavichute YV, Jacobsen SE, Fransz P, Dean C. LHP1, the Arabidopsis homologue of ETEROCHROMATIN PROTEIN1, is required for epigenetic silencing of FLC. P Natl Acad Sci USA 2006;103:5012-7.
- Laurie DA, Griffiths S, Dunford RP, Christodoulou V, Taylor SA, Cockram J, Beales J, Turner A. Comparative genetic approaches to the identification of flowering time genes in temperate cereals. Field Crop Res 2004;90:87-99.
- Trevaskis B, Hemming MN, Dennis ES, Peacock WJ. The molecular basis of vernalization-induced flowering in cereals. Trends Plant Sci 2007;12:352-7.
- Danyluk J, Kane NA, Breton G, Limin AE, Fowler DB, Sarhan F. TaVRT-1, a putative transcription factor associated with vegetative to reproductive transition in cereals. Plant Physiol 2003;132:1849-60.
- Trevaskis B, Bagnall DJ, Ellis MH, Peacock WJ, Dennis ES. MADS box genes control vernalization-induced flowering in cereals. P Natl Acad Sci USA 2003;100:13099-104.
- Yan L, Loukoianov A, Tranquilli G, Helguera M, Fahima T, Dubcovsky J. Positional cloning of wheat vernalization gene VRN1. P Natl Acad Sci USA 2003;100:6263–8.
- Preston JC, Kellogg EA. Discrete developmental roles for temperate cereal grass VERNALIZATION1/FRUITFULL-like genes in flowering competency and the transition to flowering. Plant Physiol 2008;146:265-76.
- Yan L, Loukoianov A, Blechl A, Tranquilli G, Ramakrishna W, SanMiguel P, Bennetzen JL, Echenique V, Dubcovsky J. The wheat VRN2 gene is a flowering repressor down-regulated by vernalization. Science 2004;303:1640-4.
- Diallo A, Kane N, Agharbaoui Z, Badawi M, Sarhan F. Heterologous expression of wheat VERNALIZATION 2 (TaVRN2) gene in Arabidopsis delays flowering and enhances freezing tolerance. PLoS ONE 2010;5:e8690.
- Yan L, Fu. D, Li C, Blechl A, Tranquilli G, Bonafede M, Sanchez A, Valarik M, Yasuda S, Dubcovsky J. The wheat and barley vernalization gene VRN3 is an orthologue of FT. P Natl Acad Sci USA 2006;103:19581-6.
- Bonnin I, Rousset M, Madur D, Sourdille P, Dupuits C, Brunel D, Goldringer I. FT genome A and D polymorphisms are associated with the variation of earliness components in hexaploid wheat. Theor Appl Genet 2008;116:383-94.
- Oliver SN, Finnegan EJ, Dennis ES, Peacock WJ, Trevaskis B. Vernalization-induced flowering in cereals is associated with changes in histone methylation at the VERNALIZATION1 gene. P Natl Acad Sci USA 2009;106:8386-91.
- Fowler DB, Chauvin LP, Limin AE, Sarhan F. The regulatory role of vernalization in the expression of low-temperature-induced genes in wheat and rye. Theor Appl Genet 1996b;93:554-59.
- Mahfoozi S, Limin AE, Hayes PM. Hucl P, Fowler DB. Influence of photoperiod response on the expression of cold hardiness in wheat and barley. Can J Plant Sci 2000;80:721-4.
- Mahfoozi S, Limin AE, Fowler DB. 2001. Developmental regulation of low-temperature tolerance in winter wheat. Annals of Botany 87, 751–757.
- Limin A, Fowler DB. Low-temperature tolerance and genetic potential in wheat (Triticum aestivum L.): response to photoperiod, vernalization, and plant development. Planta 2006;224:360-6.
Material and Methods
Determination of cold tolerance and phenological development stage. For LT50
determination, actively germinating seeds were transferred to plastic trays (40 x 25 x 15 cm) filled with mixture of soil, loamy sand and soft mold leaves (2:1:1) and returned to germinating conditions. Germinated seeds were then grown at 20 °C under 12 h day lengths at a light intensity of 350 µmol m-2 s-1 for 14 d before being exposed to 4 °C for cold acclimation. The procedure outlined by Limin and Fowler (1988) was used to determine the LT50 of Cheyenne cultivar at the 0 d (14 d establishment with no exposure to cold), 63 d acclimation and vernalization treatment at 4 °C and 63 d at 20 °C (no exposure to cold). At the end of each treatment plant crowns were covered in moist sand in aluminum weighing cans and placed in a programmable freezer that was held at -3 °C for 12 h. After 12 h, they were cooled at a rate of 2 °C/h down to -17 °C, then cooled at 8 °C/h. Five crowns were removed at 4 °C intervals fo r each of eight test temperatures in each replications. Samples were then thawed overnight at 4 °C. Thawed crowns were planted into flats containing soil, sand and soft mold leaves (2:1:1) that was kept moist. The flats were placed in a growth room maintained at 20 °C with a 16 h day/8 h night. Plant recovery was rated (alive vs. dead) after 3 weeks and a LT50 was calculated for each treatment. At the end of each cold-acclimation period (0, 21, 42, and 63 days), pots containing two plants were moved to 20 °C until fla g leaf emergence and leaf numbered on the main shoot. The control non-vernalized seedlings were maintained continuously at 20 °C with the same light intensity and length. Two methods were used to determine the stage of phenological development: (i) dissection of the plant crown to reveal the shoot apex development, and (ii) the FLN procedure (Fowler et al., 1996b; Mahfoozi et al., 2001). Plants for FLN measurements were grown in 15 cm pots filled with mixture of field soil, loamy sand and soft mold leaves (2:1:1) (2 plants/pot). Plants were uniformly watered and fertilized with sustained-release fertilizer and a nutrient-complete water-soluble solution. Measurements of FLN were made in a three-replicate completely randomized design (CRD) with a 1 (cultivar) x 4 (vernalization period) factorial arrangement. Analysis
of variance (ANOVA) was conducted by Multi-Factorial Balanced model in Minitab Statistical software. Duncan’s Multiple Range Test at 5 % probability level was used for mean comparisons. Finally, shoot apices of plants were dissected, recorded and photographed at each sampling date to determine when the double ridge (DR) occurred.
Proline content. Proline content was estimated at intervals of 0, 21 and 42 days following
the method described by Bates et al. (1973). 0.5 g (fresh weight) of spring wheat leaves were homogenized with 3% sulphosalicylic acid and centrifuged. The supernatant was treated with acetic acid and acid-ninhydrin and boiled for 1 h. The mixture was eluted in benzene and the absorbance was read at 520 nm using a Cary 4 Varian spectrophotometer.
Soluble sugar extraction. Total water soluble carbohydrate determination was based on the phenol sulphuric acid method of Dubois et al. (1956). Data were measured at 485 nm by a Cary 4 Varian spectrophotometer.
Protein Extraction. 1 g of wheat leaves (2-4 leaves above the crown on main stem
samples) was finely ground in liquid nitrogen and the protein extraction was performed according to Damerval et al. (1986) with some modifications. Four biological replicates (different plants grown side by side in the same growth chamber) were used. The resulting powder was suspended (1 g/10 ml) in chilled (- 20 °C) 10% TCA in acetone containing 0.007% DTT and 1% plant protease inhibitor cocktail (P9599; Bio-Rad, Hercules, CA, USA). The mixture was incubated at - 20 °C for at l east 1 h then centrifuged at 35000 g for 15 min. The pellet was washed three times (10 ml) with chilled (- 20 °C) acetone containing 0.007% DTT centrifuging at 12000 g at 4 °C for 15 min. The supernatant was removed and the pellet was lyophilized for 1 h. If dried powder was not to be solubilised immediately, it was stored at - 80 °C until use.
Protein solubilisation and two-dimensional electrophoresis. The wheat leaf proteins
in the dried powder were solubilised in 9 M urea, 4% CHAPS, 1% DTT, 1% pH 3-10 ampholytes (Bio-lyte; Bio-Rad, Hercules, CA, USA), 35 mM Tris base via incubation at 37 °C for 1 h with continuous stirring. The mixture wa s centrifuged at 12000 g at room temperature for 15 min and a small aliquote was used to determine protein content by Bradford assay (Bradford, 1976). IEF was performed using Biorad Multiphore II and Dry Strip Kit (Bio-Rad-Protean-IEF-Cell-System). Seventeen centimeter IPG strips (Bio-Rad, Hercules, CA, USA) pH 4-7 were passively rehydrated overnight with 750 µg of protein in 300 µl of solubilisation solution containing 1% carrier ampholyte (Bio-lyte 4-7; Bio-Rad, Hercules, CA, USA). The total product time × voltage applied was 80 000 V h for each strip at 20 °C. Strips were subsequently reduced (1 % DTT, 15 min) and alkylated (2.5% IAA, 15 min) during the equilibration step (30 min in 50 mM Tris-HCl pH 8.8, 6 M urea, 30% glycerol v/v, 1% SDS, bromophenol blue). Equilibrated strips were then placed on SDS-polyacrylamide gels, 16 cm × 20 cm, 13% acrylamide, and sealed with 0.5% agarose. SDS-PAGE was performed using the Protean II xi Cell, large gel format (Bio-Rad) at constant current (40 mA per gel) at 7 °C until the bromophenol blue trackin g dye was approximately 2–3 mm from the bottom of the gel. Protein spots were stained by Blue Silver (Candiano et al., 2004). To ensure protein pattern reproducibility, four replicates were done.
Image Analysis. Two dimension gel images were digitised using a flatbed scanner
(model ImageScanner-II, GE Healthcare, Uppsala, Sweden) with a resolution of 300 dpi and 16-bit greyscale pixel depth. Image analysis was carried out with Progenesis SameSpots software vers. 2.0 (Nonlinear Dynamics), which allows spot detection, background subtraction, and protein spot OD intensity quantification (spot quantity definition). The gel image showing the highest number of spots and the best protein pattern was chosen as a reference template, and spots in a standard gel were then matched across all gels. Spot quantity values were normalised in each gel dividing the
raw quantity of each spot by the total quantity of all the spots included in the standard gel. For each protein spot, the average spot quantity value and its variance coefficient in each group was determined. One-way analysis of variance (ANOVA) was carried out at p < 0.05 in order to assess for absolute protein changes among the different treatments; only 1.5-fold or higher quantitative variations were taken into consideration. The false discovery rate (FDR) was estimated by calculating q-values with a threshold of 0.05. The least significant difference (LSD) test was used to determine significant differences among group means.
Functional annotation. Gene Ontology (GO) lists were downloaded from the TAIR
website (http://www.arabidopsis.org/tools/bulk/go/index.jsp): each protein was classified with respect to its cellular component, biological process, and molecular function using GO annotation. When no GO annotation was available, proteins were annotated manually based on literature searches and closely related homologues.
In-Gel Digestion and Protein identification by MS/MS. Protein spots were carefully cut
out from Blue Silver stained gels and subjected to in-gel trypsin digestion according to Shevchenko et al. (1996) with minor modifications. Peptide mixtures were separated using a nanoflow-HPLC system (Ultimate; Switchos; Famos; LC Packings, Amsterdam, The Netherlands). A sample volume of 10 µL was loaded by the autosampler onto a homemade 2 cm fused silica precolumn (75 µm I.D.; 375 µm O.D.; Reprosil C18-AQ, 3 µm, Dr. Maisch GmbH, Ammerbuch-Entringen, Germany) at a flow rate of 2 µL/min. Sequential elution of peptides was accomplished using a flow rate of 200 nL/min and a linear gradient from Solution A (2% acetonitrile; 0.1% formic acid) to 50% of Solution B (98% acetonitrile; 0.1% formic acid) in 40 minutes over the precolumn in-line with a homemade 10-15 cm resolving column (75 µm I.D.; 375 µm O.D.; Reprosil C18-AQ, 3 µm, Dr. Maisch GmbH, Ammerbuch-Entringen, Germany). Peptides were eluted directly into a High Capacity ion Trap (model HCTplus, Bruker-Daltonik, Germany). Capillary voltage
was 1.5-2 kV and a dry gas flow rate of 10 L/min was used with a temperature of 230 °C. The scan range used was from 300 to 1800 m/z. Protein identification was achieved by searching the National Center for Biotechnology Information non-redundant database (NCBInr, version 20081128, www.ncbi.nlm.nih.gov) using the Mascot program (in-house version 2.2, Matrix Science, London, UK). The following parameters were adopted for database searches: complete carbamidomethylation of cysteines and partial oxidation of methionines, peptide Mass Tolerance ± 1.2 Da, Fragment Mass Tolerance ± 0.9 Da, missed cleavages 2. For positive identification, the score of the result of (- 10 x Log(P)) had to be over the significance threshold level (P < 0.05). Even though high MASCOT scores are obtained with values greater than 60, when proteins were identified with only one peptide a combination of automated database search and manual interpretation of peptide fragmentation spectra was used to validate protein assignments. In this manual verification, the mass error, the presence of fragment ion series, and the expected prevalence of C-terminus containing ions (Y-type) in the high mass range, were all taken into account. Moreover, replicate measurements have confirmed the identity of these protein hits.
RNA extraction, cDNA synthesis and PCR. Semi-quantitative RT-PCR was carried out
following extraction of total leaf RNA by applying RNXplus (Fermentas) from the pulverized plant leaves, followed by phenol/chloroform/extraction, isopropanol precipitation and ethanol wash. The extracted RNA was reverse transcribed using the Roche cDNA synthesis kit, as per manufacturer’s instructions. The synthesised cDNA was used in the subsequent PCR by applying specific primers designed for tubulin as an internal control housekeeping gene and three other genes whose expression was subjected to change in response to cold stress (wcor18, protein spots No. 32, 96; wrab17, protein spots No. 39, 44, 90; rbcS, protein spots No. 6, 62, 178). The primer pairs used for amplification are listed in Table 1. PCR conditions were identical except for the annealing temperature which was adjusted for each gene as required. Specifically, 60 °C and 35
cycles were used for tubulin, rbcS and Wrab17 genes, while a two step annealing procedure was used for Wcor18 amplification so that a primary gradient amplification for 16 cycles starting from 52 °C and terminating at 60 °C was used to enhance amplification of Wcor18 followed by 30 cycles of annealing at 60 °C. Apart from annealing, all other conditions of PCR were the same so that initial denaturation was at 94 °C for 4 min followed by denaturation at 94 °C 1 min, annealing 1 min according to the above description, 72 °C extension for 1 min and final ex tension for 5 min.
Gene Forward 5'-3' Reverse 5'-3'
tubulin TGATGCTTTCAACACCTTCTTCAG GGGGCGTAGGAGGAAAGCA
Wcor18 TACACGCTGGAGGGGCAGGGC CCGGGCTGCTTCCAGTCGTTGAC
Wrab17 GGCTGTCACGAAGGCTGCCTC CCTGCTGGAAGACGTTTTCCTTGG
rbcS GAGGGCATCAAGAAGTTCGAGACC TCAGGGTACTCCTTCTTGACCTCC
References
- Bates LS. Rapid determination of free proline for water stress studies. Plant Soil 1973;39:205-207.
- Bradford MM. A Rapid and Sensitive Method for the Quantitation of Microgram Quantities of Protein Utilizing the Principle of Protein-Dye Binding. Anal Biochem 1976;72:248-54.
- Candiano G, Bruschi M, Musante L, Santucci L, Ghiggeri GM, Carnemolla B, Orecchia P, Zardi L, Righetti PG. Blue silver: a very sensitive colloidal Coomassie G-250 staining for proteome analysis. Electrophoresis 2004;25:1327-33.
- Damerval C, De Vienne D, Zivy M, Thiellement H. Technical improvements in two-dimensional electrophoresis increase the level of genetic variation detected in wheat-seedling proteins. Electrophoresis 1986;7:52-4.
- Dubois MK, Gils JK, Hanniton PA, Robes L, Smith F. Colorimetric Method for Determination of Sugars and Related Substances. Anal Chem 1956;28:350-356.
- Fowler DB, Chauvin LP, Limin AE, Sarhan F. The regulatory role of vernalization in the expression of low-temperature-induced genes in wheat and rye. Theor Appl Genet 1996b;93:554-59.
- Limin AE, Fowler DB. Cold hardiness expression in interspecific hybrids and amphiploids of the Triticeae. Genome 1988;30:261-5.
- Mahfoozi S, Limin AE, Fowler DB. Developmental regulation of low-temperature tolerance in winter wheat. Ann Bot-London 2001;87:751-7.
- Shevchenko A, Wilm M, Vorm O, Mann M. Mass spectrometric sequencing of proteins silver-stained polyacrylamide gels. Anal Biochem 1996;68:850-8.
RESULTS
Phenological development and low-temperature tolerance
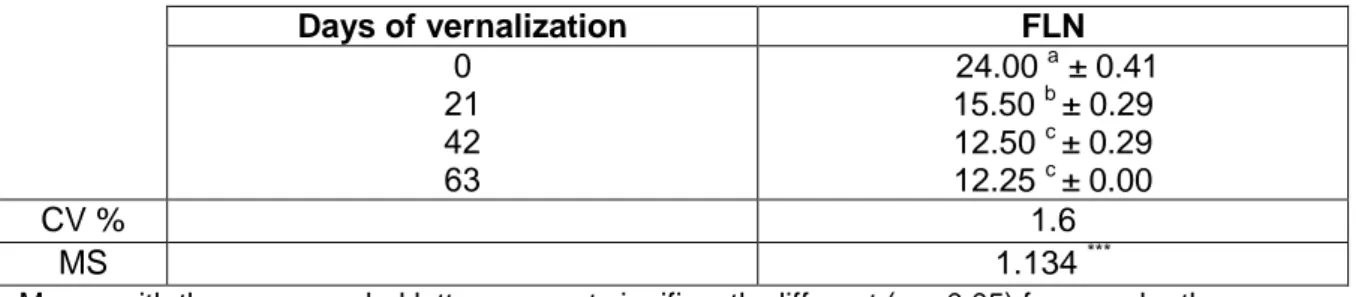
For our study, plants of the winter wheat variety Cheyenne were grown at room temperature (RT) for 14 days under a 12 h photoperiod (experimental day 0), then half were transferred to 4 °C low-temperature growth cha mber over 63 days of cold-acclimation. The remaining plants were left to grow at room temperature for the same period. Growth morphology of 14-d establishment plants (0-day cold treatment) was not much different from 63-d cold acclimated plants, as 0-d and 63-d were in 2 and 4 leaves growth stage, respectively. On the contrary, plants grown in continuous 20 °C conditions produced about 24 leaves (Figure 1). To exactly establish phenological development stages of wheat plants used in this study, both FLN (final leaf number) measurements and shoot apex dissection were performed. Analysis of variance for the FLN (Table 2) showed that differences of FLN due to the days of vernalization were highly significant (p < 0.001). When grown at continuous 20 °C compared to a 21, 42 and 63-d pretreatment at 4 °C, Cheyenne wheat (CNN) showed a reduced FLN from 24 to 12.5 (Table 3), indicating that it is a winter habit genotype with a vernalization requirement (Mahfoozi et al., 2001). Moreover, FLN became constant (12.5) between 42 and 63 days of vernalization (vernalization fulfillment), indicating that a long vernalization requirement period in this winter cultivar causes a delay in its transition from the vegetative to the reproductive phase. On the other hand, double ridge (DR) formation, when leaf and spikelet initials are both apparent on the shoot apex, is considered to be another clear indication that transition to the reproductive phase occurred (McMaster, 1997). Interestingly, double ridge formation was not observed for 0-d and 42-d cold treated CNN plants (Figure 2, panels A-B), whereas beginning of shoot apex elongation was visible in 63-d cold treated plants (Figure 2C). Thus, vernalization fulfillment did not coincide with the physical manifestation of DR formation which is generally considered an unquestionable sign of floral initiation (Hay and Ellis, 1998). These observations showed conclusively that 63-d represented the time-point
after vernalization saturation where flowering processes were undoubtedly in progress and for this reason was chosen for proteomic analysis. On the other hand, the LT50 (lethal temperature at which 50% of the plants are killed) value of CNN at 63-d cold acclimation treatment was -9.0 ± 0.8 (mean ± SE; n = 3) °C indi cating the ability of plants to cold acclimate after vernalization saturation, while the LT50 of CNN at 0-d (14 d RT) and 63-d warm (no exposure to cold) was -2.0 ± 0.0 (mean ± SE; n = 3) °C. Interestingly, plants grown at continuous 20 °C conditions maintained in the vegetative stage for a long time and produced more leaves, while plants vernalized at 4 °C for 63 days and then moved to 20 °C (devernalization) emerged its flag leaf short ly after moving to the warm long-day condition (20 °C, 16h day-length) indicating the hi ghly progressed phenological development toward flowering stage (data not shown).
Figure 1. Response of Cheyenne winter wheat cultivar to prolonged cold stress F MS SS df Source 24.90*** 3.3819 10.146 3 Days of vernalization 0.1358 1.630 12 Error 11.776 15 Total
df, degrees of freedom; SS, sum of squares; MS, mean square; F, variance ratio. *** p < 0.001
Table 2. Summary of the ANOVA one-way analysis on the basis of completely randomized design (CRD) for final leaf number (FLN) in Cheyenne cultivar.
FLN Days of vernalization 24.00 a ± 0.41 15.50 b ± 0.29 12.50 c ± 0.29 12.25 c ± 0.00 0 21 42 63 1.6 CV % 1.134 *** MS
Means with the same symbol letters are not significantly different (p > 0.05) from each other according to Duncan’s multiple range test.
CV, coefficient of variation; MS, mean square. *** p < 0.001
Figure 2. Phenological development stage of Cheyenne (CNN) winter wheat cultivar grown at 4 °C as estimated from shoot apex developmental morphology. A, Shoot apex elongation and single ridge stage of 14-d establishment CNN (0-d cold treatment); B, Shoot apex elongation and single ridge stage of 42-d cold acclimated CNN plants; C, Double ridge stage of 63-d cold acclimated CNN plants.
Proteome changes in wheat leaves upon exposure to low temperatures
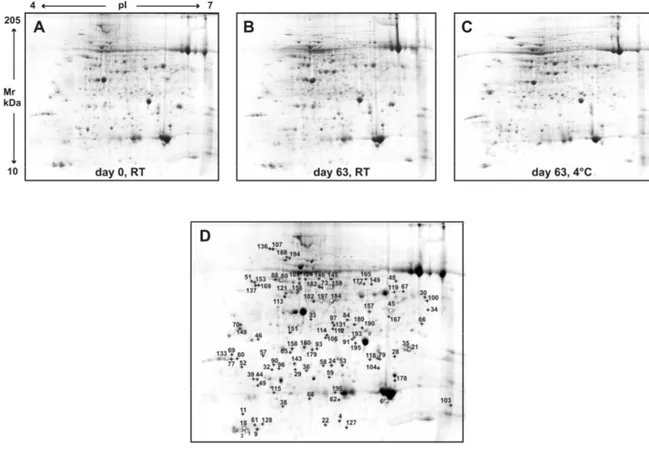
Figure 3 shows three representative 2DE maps obtained from day 0 (14 d, RT), 63 days at room temperature and 63 days at 4 °C. Each stage of leaf treatment was analyzed in four biological and technical replicates. Approximately 1000 spots could be detected on each gel (Figure 3A-C). Among these spots, 732 could be reliably matched on all the gels and these were included in the statistical analysis. A one-way ANOVA analysis identified 101 spots with significantly different expression levels (p < 0.05, absolute variation of at least 1.5-fold). These protein spots (indicated with numbers in the reference map showed in Figure 3D) were excised from the gels and digested by trypsin. Peptide mixtures were then analyzed by LC-ESI-MS/MS for protein identification.
Figure 3. Representative 2-DE gels of leaf tissues from day 0 (A), 63 days at room temperature (B) and 63 days at 4° C (C). Linear IPGs pH 4-7, 17 cm length. Panel D shows the reference map derived from computerized image analysis performed by using Progenesis SameSpots software. Numbers indicate the differentially expressed proteins.
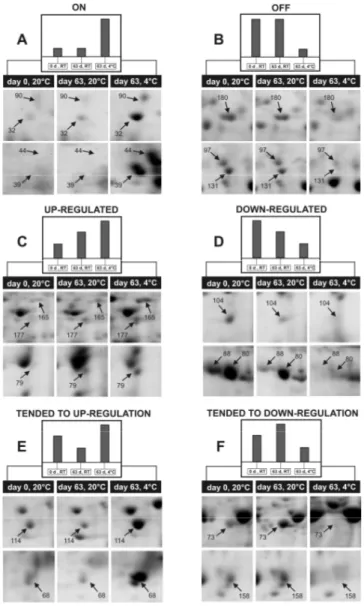
Table 4 lists the successfully identified proteins, together with the protein spot number, the identification parameters, and the indication of their GO (gene ontology) annotation (cellular component, biological process, and molecular function). An additional table listing peptide sequences of identified proteins is provided in the final section of the thesis “Supporting Information”. Figure 4 displays details of specific gel regions in order to appreciate quantitative changes caused by development and/or vernalization treatment.
Figure 4. Close-up views of some 2D-gel regions showing examples of the observed variation patterns in protein spot intensity. A: on; B: off; C: regulated; D: down-regulated; E: tended to up-regulation; F: tended to down-regulation. Numbers of spots indicated by the arrows refer to the master map shown in Fig. 3D.
Protein name Spot No.a Mr, kDa theor/ experb pI theor/ experb
NCBI GI No. Homologue
Atc peptidesNo. of MascotScore 1-ANOVAd
Fold of variation (63 d 20 °C/63 d
4°C)e
GO process GO comp GO funct
OFF Oxygen-evolving
enhancer protein 2 [Triticum aestivum]
35 27.4/28.1 8.8/6.3 gi|131394 At1g06680 10 752 5.9x10⁻⁸ - 0.0082/- 0.8698 photosynthesis oxygen evolving
activity ATPase, beta subunit
[Hordeum vulgare] 57 53.9/24.8 5.1/4.8 gi|11583 AtCg00480 3 162 4.2x10
-4 - 0.0121/- 0.7479 electron transport coupled to ATP synthesis hydrogen ion transmembrane transporter activity Oxygen-evolving enhancer protein 1 [Triticum aestivum]
61 35.0/13.0 8.7/4.7 gi|131388 At5g66570 1 104 2.0x10⁻³ + 0.0254/- 0.7133 photosystem II assembly
oxygen evolving activity Acyl carrier protein 1,
chloroplast precursor [Hordeum vulgare] 69 16.2/25.0 5.7/4.4 gi|113165 At4g25050 2 98 5.0x10⁻³ - 0.0251/- 0.7159 fatty acid biosynthetic process chloroplast
acyl carrier activity Os08g0478200
ATP synthase D chain, mitochondrial [Oryza sativa (japonica
cultivar-group)] 118 19.7/24.0 5.2/5.9 gi|115476908 At3g52300 3 150 1.4x10⁻⁶ + 0.0037/- 0.4668 electron transport coupled to ATP synthesis mitochondrion hydrogen ion transporting ATPase/ synthase activity Os08g0382400 cyclophilin-type peptidylprolyl cis- trans
isomerase [Oryza sativa (japonica
cultivar-group)]
169 46.8/56.4 4.8/4.7 gi|115476198 At3g01480 7 367 3.1x10⁻² + 0.0043/- 0.3779 photosynthesis
peptidyl-prolyl cis-trans isomerase activity 2-Cys peroxiredoxin BAS1, chloroplastic [Triticum aestivum
179 23.4/27.0 5.7/5.3 gi|2829687 At5g06290 3 166 5.9x10⁻⁵ + 0.0041/- 0.3271 response to
cold peroxiredoxin activity
Os02g0634500 [Oryza sativa (japonica
cultivar-group)]
180 32.1/35.5 6.7/5.8 gi|115447465 At5g23140 2 112 9.2x10⁻⁶ + 0.0167/- 0.3100 proteolysis clp protease
ferredoxin-NADP(H) oxidoreductase [Triticum aestivum]
197 40.5/47.2 6.9/5.4 gi|20302473 At5g66190 2 175 3.0x10⁻³ - 0.0661/- 0.2971 electron transporter
Os03g0278900 ATP synthase B/B' CF(0) [Oryza sativa (japonica
cultivar-group)] 115 22.8/18.1 5.8/4.9 gi|115452259 At4g32260 4 208 9.0x10⁻³ + 0.1894/- 0.2838 electron transport coupled to ATP synthesis chloroplast hydrolase activity
Phosphoribulokinase, chloroplast precursor
[Triticum aestivum]
45.5/53.1 5.7/5.0 gi|125580 At1g32060 16 855 2.0x10⁻² phosphoribulokinase
activity Sedoheptulose-1,7-bisphosphatase, chloroplast precursor [Triticum aestivum] 121 42.5/53.1 6.0/5.0 gi|1173347 At3g55800 11 588 2.0x10⁻² - 0.0479/ - 0.5437 carbon utilization by fixation of carbon dioxide chloroplast sedoheptulose-bisphosphatase activity hypothetical protein OsJ_031021 [Oryza sativa (japonica
cultivar-group)]
128 20.1/13.2 9.0/4.8 gi|125575528 At4g01150 3 107 8.0x10⁻³ + 0.0868/- 0.3849 metabolic
processes chloroplast
serine carboxypeptidase
activity OSJNBa0041A02.10
[Oryza sativa (japonica cultivar-group)]
131 38.0/35.1 8.8/5.6 gi|38344143 At4g09010 3 172 3.4x10⁻⁶ + 0.0277/- 0.4213 response to
oxidative stress cytoplasm peroxidase activity FtsH-like protein Pftf precursor [Nicotiana tabacum] 143 74.5/23.5 6.0/5.1 gi|4325041 At2g30950 4 216 1.0x10⁻³ + 0.0805/- 0.3547 protein catabolic process thylakoid
membrane ATPase activity RuBisCO small chain,
chloroplast precursor [Hordeum vulgare] 178 19.7/20.6 9.0/6.2 gi|3914588 At1g67090 5 221 1.6x10⁻² + 0.0473/- 0.3312 carbon utilization by fixation of carbon dioxide chloroplast ribulose-bisphosphate carboxylase activity mitochondrial ATP synthase precursor [Triticum aestivum] 190 27.1/34.6 7.7/5.9 gi|47607439 At2g21870 10 604 2.0x10⁻³ + 0.1062/- 0.2113 electron transport coupled to ATP synthesis mitochondrion unknown Os07g0469100 thylakoid membrane phosphoprotein 14 kDa [Oryza sativa (japonica
cultivar-group)]
9 15.8/12.5 9.4/4.7 gi|115472001 At1g52220 2 106 7.0x10⁻⁹ + 0.0574/- 1.2379 unknown chloroplast unknown
Os03g0843400, 30S ribosomal protein S6, chloroplast precursor [Oryza sativa (japonica
cultivar-group)]
36 23.3/22.2 7.8/5.2 gi|115456525 At1g64510 1 70 4.4x10⁻⁵ + 0.0460/- 0.8308
translation, ribosome biogenesis
ribosome structural constituent of ribosome Os10g0502000,
thylakoid lumenal 17.4 kDa protein
[Oryza sativa (japonica cultivar-group)]
38 25.0/15.5 7.5/5.0 gi|115482792 At1g12250 2 137 7.4x10⁻⁵ + 0.0329/- 0.8191 unknown chloroplast unknown
Translationally-controlled tumor protein homolog
(TCTP) [Triticum aestivum]
46 18.9/30.4 4.5/4.7 gi|75246527 At3g16640 3 175 2.0x10⁻³ + 0.1370/- 0.7138 regulation of
cell growth cytoplasm
calcium binding and microtubule stabilization RuBisCO small subunit
[Triticum aestivum] 62 19.7/17.0 9.1/5.6 gi|11990893 At1g67090 6 253 5.3x10
-5 + 0.1056/- 0.5908 ribulose-bisphosphate
carboxylase activity Os04g0459500
glyceraldehyde-3-phosphate dehydrogenase
[Oryza sativa (japonica cultivar-group)] 97 43.0/35.9 7.6/5.5 gi|115458768 At1g12900 4 239 1.3x10⁻⁴ + 0.1190/- 0.4405 carbon utilization by fixation of carbon dioxide chloroplast glyceraldehyde-3-phosphate dehydrogenase activity
fructose-bisphosphate
aldolase [Zea mays] 102 42.0/47.1 7.6/5.3 gi|195634659 At2g21330 10 577 1.0x10 -3 - 0.1030/- 0.5283 carbon utilization by fixation of carbon dioxide fructose-bisphosphate aldolase activity putative oxygen-evolving
complex precursor [Triticum aestivum]
103 21.1/16.3 9.7/6.8 gi|134290407 At1g14150 6 280 2.4x10⁻⁴ + 0.1038/- 0.4061 photosynthesis oxygen evolving activity ATP synthase CF1
beta subunit [Triticum aestivum] 109 53.9/60.0 5.1/5.2 gi|14017579 AtCg00480 9 536 5.0x10⁻³ - 0.0090/- 0.5002 electron transport coupled to ATP synthesis chloroplast hydrogen ion transmembrane transporter activity ON Os06g0608700 Fructose-1,6- bisphosphate aldolase [Oryza sativa (japonica cultivar-group)] 30 38.0/50.1 7.6/6.6 gi|115468886 At4g26530 5 311 8.3x10⁻⁵ + 0.1532/+ 0.9084 carbon utilization by fixation of carbon dioxide chloroplast fructose-bisphosphate aldolase activity 32 17.8/22.4 4.8/4.8 4 304 3.3x10⁻⁴ + 0.0965/+ 0.9121
cold regulated protein (wcor18)
[Triticum aestivum] 96 17.8/22.6 4.8/5.0
gi|26017213 At5g01300
4 238 4.0x10⁻³ + 0.0417/+ 0.5122
unknown unknown phosphatidylethanol amine binding 39 17.1/20.7 4.8/4.7 6 376 1.0x10⁻³ - 0.0009/+ 0.8454 cold-responsive LEA/RAB-related COR protein (wrab17) [Triticum aestivum] 44 17.1/20.6 4.8/4.7 gi|7716956 At3g15670 2 98 8.0x10⁻⁵ + 0.1086/+ 0.8314 developmental
processes nucleus unknown
group3 late embryogenesis abundant protein (wrab17)
[Triticum aestivum]
90 18.3/23.2 5.0/4.8 gi|157073742 At3g15670 9 629 4.1x10⁻² + 0.1105/+ 0.6649 developmental
processes nucleus
unknown cytosolic NADP+-isocitrate
dehydrogenase [Populus tremula]
48 47.2/58.2 6.1/6.2 gi|75267781 At1g65930 7 388 6.1x10⁻⁵ + 0.1067/+ 0.7592 processesmetabolic cytoplasm
isocitrate dehydrogenase (NADP+) activity cytosolic malate dehydrogenase [Triticum aestivum]
119 24.5/54.1 6.6/6.2 gi|37928995 At5g43330 4 230 8.0x10⁻³ - 0.1211/ + 0.3856 glycolysis plasma membrane malate dehydrogenase activity Os12g0244100 molecular chaperone DnaK [Oryza sativa (japonica cultivar-group)]
136 74.3/91.0 5.1/4.8 gi|115487998 At5g28540 17 1118 1.7x10⁻⁶ - 0.0470/+ 0.3849 protein folding
chloroplast plasma membrane ATP binding RuBisCO activase A, chloroplastic [Hordeum vulgare]
146 51.4/60.1 8.0/5.4 gi|12643756 At2g39730 14 928 6.0x10⁻⁵ - 0.0663/+ 0.3530 response to
cold chloroplast
RuBisCO activase activity cp31BHv [Hordeum
vulgare subsp. vulgare] 148 30.7/33.9 4.8/4.5 gi|3550483 At4g24770 9 553 6.1x10
-5 -0.0523/+ 0.3607 RNA processing chloroplast envelope poly(U) binding RNA binding Plastid glutamine synthetaseGS2b [Triticum aestivum] 156 47.0/57.6 6.0/5.2 gi|71362638 At5g35630 2 107 3.4x10⁻⁴ + 0.0535/+ 0.3982 aging, ammonia assimilation cycle chloroplast glutamate-ammonia ligase activity protein disulfide 194 56.8/77.0 5.0/5.0 gi|13925723 At1g21750 20 1296 5.8x10⁻⁴ + 0.0527/+ 0.3087 developmental vacuole protein disulfide
isomerase 1 precursor [Triticum aestivum]
processes isomerase activity
Os02g0259600, 50S ribosomal protein L21,
chloroplast precursor [Oryza sativa (japonica
cultivar-group)]
195 23.4/29.2 6.2/5.8 gi|115445399 At1g35680 2 98 1.2x10⁻² + 0.0588/+ 0.3213
response to cold, translation
ribosome structural constituent of ribosome putative fructokinase
[Oryza sativa Japonica Group] 113 43.8/49.6 6.0/5.0 gi|51535181 At2g31390 6 345 5.6x10⁻⁴ + 0.1855/ + 0.6250 sucrose metabolic process plasma
membrane kinase activity Plastid glutamine
synthetase GS2c [Triticum aestivum]
153 47.0/57.0 5.7/4.7 gi|71362640 At1g66200 8 488 1.0x10⁻³ - 0.0518/+ 0.3396 nitrate
assimilation chloroplast
glutamate-ammonia ligase activity DOWN-REGULATED
plastocyanin precursor
[Hordeum vulgare] 3 15.8/12.2 5.6/4.6 gi|22705 At1g76100 1 77 9.4x10
-4 - 0.2445/- 1.8874
electron transport coupled to ATP
synthesis
chloroplast copper ion binding Oxygen-evolving
enhancer protein 2 [Triticum aestivum]
4 27.4/13.5 8.8/5.6 gi|131394 At1g06680 3 255 1.9x10⁻⁴ - 0.2411/- 1.7634 photosynthesis chloroplast oxygen evolving activity RuBisCO small subunit
[Triticum aestivum] 45 19.7/42.1 9.1/6.2 gi|11990893 At1g67090 10 483 2.0x10 -3
- 0.5222/ - 0.7602 RuBisCO large chain
[Avena sativa] 66 53.5/35.5 5.9/6.4 gi|1346964 AtCg00490 4 212 3.6x10
-4 - 0.0603/- 0.6772 carbon utilization by fixation of carbon dioxide chloroplast ribulose-bisphosphate carboxylase activity 80 47.4/59.0 5.1/5.0 9 604 1.8x10⁻⁵ - 0.1029/ - 0.5976 Glutamine synthetase chloroplast precursor [Hordeum vulgare] 88 47.4/59.9 5.1/4.9 gi|121340 At5g37600 11 649 6.9x10⁻⁴ - 0.1251/- 0.5850 nitrate assimilation chloroplast glutamate-ammonia ligase activity oxygen-evolving enhancer protein 1 [Leymus chinensis]
104 34.7/22.8 6.1/6.0 gi|147945622 At5g66570 5 297 1.9x10⁻⁵ - 0.1333/- 0.5183 photosystem II assembly and stabilization
chloroplast oxygen evolving activity Os08g0162800
Acyl-CoA binding protein [Oryza sativa (japonica
cultivar-group)]
127 10.1/12.9 5.2/5.7 gi|115474931 At5g53470 3 134 3.0x10⁻³ - 0.1407/- 0.4776 lipid transport plasma
membrane acyl-CoA binding
UP-REGULATED S-adenosylmethionine
synthetase 1 [Triticum monococcum]
165 43.2/60.0 5.6/5.9 gi|115589744 At4g01850 6 414 5.1x10⁻⁴ + 0.0403/+ 0.3681 S-AdoMet biosynthetic process cell wall methionine adenosyltransferase activity Os01g0104400, ricin
B-related lectin domain containing protein [Oryza sativa (japonica
cultivar-group)]
67 30.3/54.9 6.3/6.3 gi|115434012 At2g39050 2 83 2.8x10⁻⁵ + 0.2224/+ 0.6793 unknown unknown
Patatin-13 precursor
[Solanum tuberosum] 79 42.4/24.0 5.5/6.0 gi|122201873 At4g37070 6 360 2.4x10
-4 + 0.3515/ + 0.5694 lipid metabolic process unknown nutrient reservoir activity
enzymatic activity
Os02g0634900 proteasome alpha type 2
[Oryza sativa (japonica cultivar-group)] 112 25.8/34.0 5.4/5.5 gi|115447473 At1g16470 9 555 3.1x10⁻⁵ + 0.1606/+ 0.4923 ubiquitin-dependent protein catabolic process cytosolic ribosome proteasome complex peptidase activity
RuBisCO small subunit
[Triticum aestivum] 167 19.7/38.9 9.06/6.1 gi|11990893 At1g67090 5 224 6.0x10 -3 + 0.2755/+ 0.3671 carbon utilization by fixation of carbon dioxide ribulose-bisphosphate carboxylase activity Os08g0532200 Acetyl ornithine aminotransferase family
[Oryza sativa (japonica cultivar-group)] 177 50.4/57.2 6.5/5.9 gi|115477483 At3g48730 5 308 8.6x10⁻⁵ + 0.1909/+ 0.3372 porphyrin biosynthetic process chloroplast glutamate-1-semialdehyde 2,1-aminomutase activity TENDED TO DOWN-REGULATION
RuBisCO small subunit
[Triticum aestivum] 6 19.7/16.9 9.1/6.1 gi|11990893 At1g67090 5 221 4.0x10
-6 + 0.1447/ - 1.3347 carbon utilization by fixation of carbon dioxide ribulose-bisphosphate carboxylase activity Os07g0469100 thylakoid membrane phosphoprotein 14 kDa, [Oryza sativa (japonica
cultivar-group)]
18 15.8/12.7 9.4/4.6 gi|115472001 At1g52220 2 96 1.7x10⁻⁴ + 0.1435/- 1.0091 unknown unknown
ATP synthase CF1 beta subunit [Triticum aestivum] 33 53.9/37.4 5.1/5.3 gi|14017579 AtCg00480 12 800 1.6x10⁻⁶ + 0.3185/- 0.5652 electron transport coupled to ATP synthesis chloroplast hydrogen ion transmembrane transporter activity VER2 Dirigent-like protein
[Triticum aestivum] 34 32.5/42.2 6.7/6.6 gi|16151819 At4g11210 2 94 2.0x10
-3 + 0.4677/- 0.4769 lignan biosynthetic process endomembrane system unknown chloroplast oxygen-evolving enhancer protein 1 [Leymus chinensis
58 34.7/23.0 6.1/5.4 gi|147945622 At5g66570 4 199 2.7x10⁻⁷ + 0.1688/- 0.5376 photosynthesis oxygen evolving activity Cyt b6-f complex
iron-sulfur subunit, chloroplastic [Triticum aestivum] 59 24.1/21.3 8.8/5.5 gi|68566191 At4g03280 2 108 4.7x10⁻⁸ + 0.1677/- 0.5334 electron transport coupled to ATP synthesis electron transporter RuBisCO activase alpha
form precursor [Deschampsia antarctica] 73 51.4/55.5 6.0/5.4 gi|32481061 At2g39730 13 881 7.0x10⁻⁷ + 0.2707/- 0.3358 response to biotic/abiotic stresses chloroplast RuBisCO activase activity Os05g0110300
similar to Putative 3-beta hydroxysteroid dehydrogenase/ isomerase [Oryza sativa(japonica 84 31.4/37.1 9.1/5.7 gi|115461679 At5g02240 3 218 1.1x10⁻⁴ + 0.1398/- 0.4474 response to abscisic acid stimulus plasma
cultivar-group)] 2-Cys peroxiredoxin BAS1, chloroplastic [Triticum aestivum]
158 23.4/27.4 5.7/5.0 gi|2829687 At5g06290 9 479 3.9x10⁻⁴ + 0.1057/- 0.2864 response to
cold peroxiredoxin activity
LHC I [Hordeum vulgare] 160 24.4/28.1 8.1/5.2 gi|544700 At3g54890 5 283 5.7x10⁻⁵ + 0.1150/- 0.2679 photosynthesis chlorophyll binding ATP synthase CF1 epsilon
subunit [Triticum aestivum] 196 15.3/18.3 5.2/5.6 gi|14017578 AtCg00470 10 554 3.9x10⁻⁴ + 0.1187/- 0.1790 electron transport coupled to cesis chloroplast hydrogen ion transmembrane transporter activity Os01g0649100 malate dehydrogenase [Oryza sativa (japonica
cultivar-group)]
100 35.7/47.6 8.7/6.6 gi|115438875 At1g53240 3 194 3.6x10⁻⁴ + 0.4282/- 0.1353 response to
cold mitochondrion malate dehydrogenase activity TENDED TO UP-REGULATION glycine-rich RNA-binding protein [Triticum aestivum] 68 16.0/17.2 6.3/5.3 gi|114145394 At2g21660 5 304 6.5x10⁻⁸ - 0.1245/+ 0.5280 vegetative to reproductive phase transition of meristem
chloroplast ss/ds DNA binding RNAbinding putative chaperonin 21
precursor [Oryza sativa Japonica Group]
114 26.4/32.3 7.7/5.5 gi|51090748 At5g20720 5 246 1.4x10⁻⁷ - 0.1332/+ 0.3483 response to cold
mitochondrion
chloroplast calmodulin binding Phosphoglycerate kinase, chloroplast precursor [Triticum aestivum] 124 50.0/60.1 6.6/5.2 gi|129915 At1g56190 3 244 1.1x10⁻² - 0.2263/+ 0.2783 carbon utilization by fixation of carbon dioxide phosphoglycerate kinase activity 159 51.4/56.1 6.0/5.5 12 707 6.4x10⁻⁷ - 0.1365/+ 0.2435 RuBisCO activase alpha form precursor
[Deschampsia antarctica] 182 51.4/56.2 6.0/5.4 gi|32481061 At2g39730 18 1049 2.7x10⁻⁴ - 0.1240/+ 0.2087 response to cold RuBisCO activase activity fructose 1,6-bisphosphate aldolase precursor [Avena sativa] 184 42.1/47.2 9.0/5.5 gi|8272480 At4g38970 10 576 3.0x10⁻³ - 0.0747/+ 0.2486 carbon utilization by fixation of carbon dioxide fructose-bisphosphate aldolase activity peptide methionine sulfoxide reductase; cPMSR [Gossypium barbadense] 193 28.8/31.7 8.4/5.8 gi|29469000 At4g25130 3 144 1.0x10⁻³ - 0.1473/+ 0.1622 protein modification and metabolic process chloroplast peptide-methionine-(S)-S-oxide reductase activity a
Spot number represents the number on the master gel (see Figure 1)
b
Theoretical Mr/pI was calculated with Mr/pI tool on the Expasy web site (http://expasy.org/tools/pi_tool.html)
c
TAIR Accession no. of the closest homologue in Arabidopsis thaliana
d
p-value of one-way ANOVA analysis
e
Fold of protein variation is calculated by standardizing the mean of the normalized spot volumes of samples at 63 days 20 °C and at 63 days of cold trea tment with the mean of the normalized spot volumes of the sample at day 0.
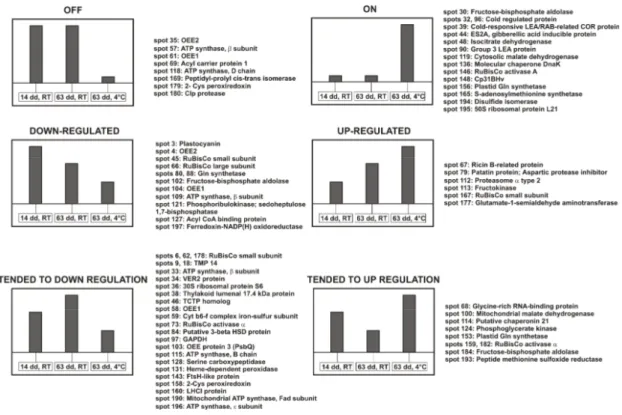
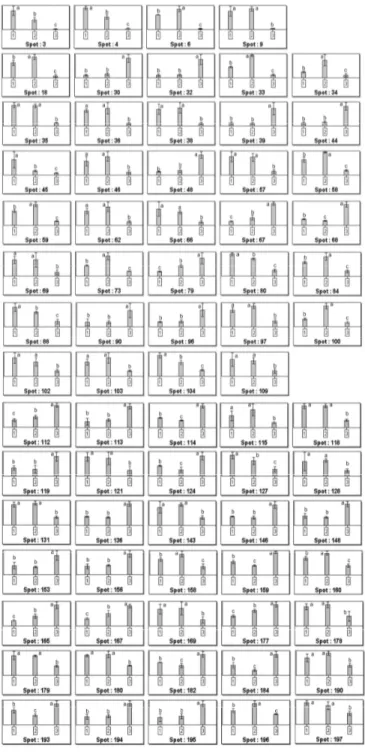
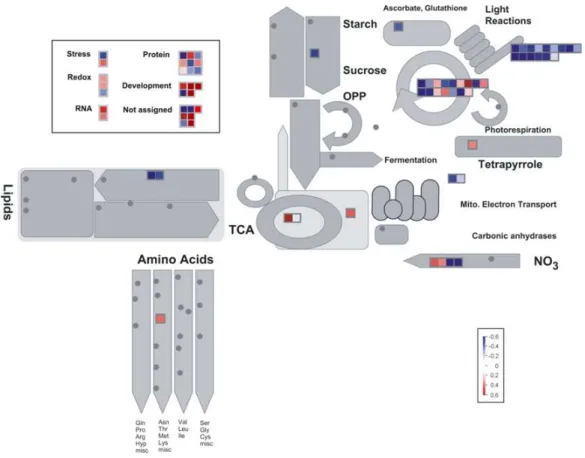
A schematic representation of main trends observed in spot modulations after quantitative analysis of 2-DE gels by Progenesis SameSpots software is provided in Figure 5, whereas spot quantification results are shown in Figure 6. To provide a classification of the differential proteins into functional categories, we used the automated MapMan annotation dataflow (Thimm et al., 2004). Figure 7 shows a global overview of the metabolic pathways and cellular processes mostly affected by 63-day cold treatment. Most of the proteins were related to metabolism (62.2 %), but also, among others, to the following MapMan based categories (BINs): stress (2.7 %), redox (4 %), RNA (2.7 %), protein (12.2 %), development (6.8 %), not assigned (9.4 %).
Figure 5. Schematic representation of main trends observed in spot modulations after quantitative analysis of 2-DE gels by Progenesis SameSpots software. Proteins identified are listed and grouped into the different categories.
Figure 6 . Histograms representing the mean of the spot normalized volumes for each treatment: 1 stands for sample at day 0 (14 days, room temperature), 2 means 63 days at room temperature, 3 is 63 days at 4 °C. Error bars indicate the SD of four replicates. The analysis was performed by Progenesis SameSpots software (Nonlinear Dynamics). The same letters above the bars indicate no statistically significant difference, whereas different letters indicate a statistically significant difference (p < 0.05) according to the LSD (least significant difference) test.
Figure 7. Visualization of cellular processes affected by prolonged cold acclimation using the MapMan software (http://mapman.gabipd.org/) (Thimm et al. 2004). Protein spots significantly up- and down-regulated in 63-day cold acclimated leaves with respect to day 0 are indicated with red and blue squares, respectively. Color scale bars display log normalized volumes. Gray dots are automatically assigned to empty subpathways by the program.
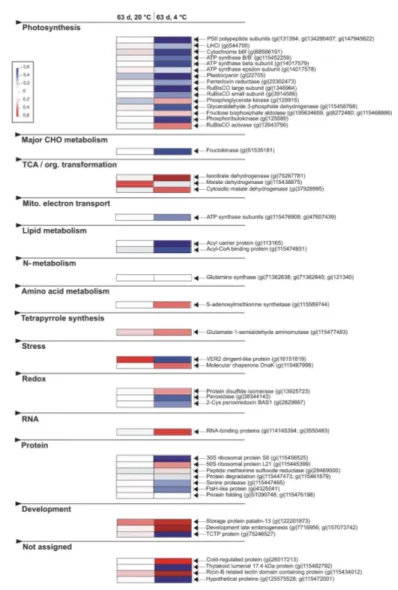
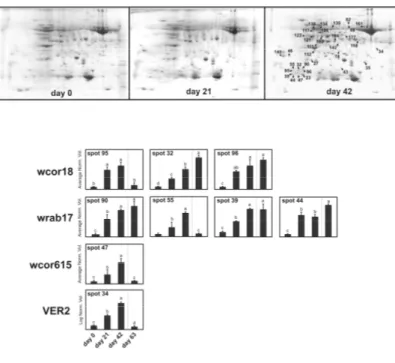
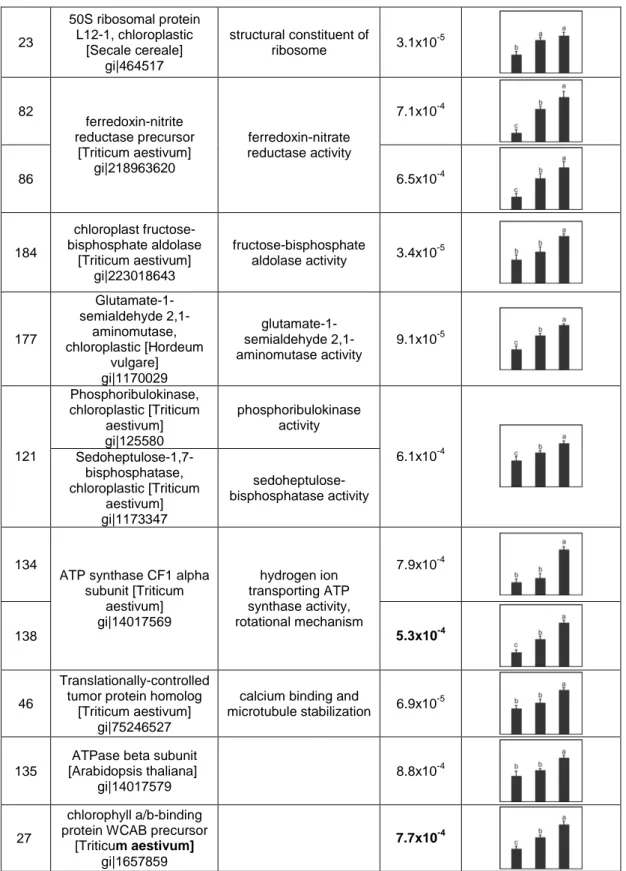
We also loaded quantitative data into the PageMan program (Usadel et al., 2006) in order to have a direct comparison between growth and cold effects on wheat leaves (Figure 8). Although our analysis provided direct evidence for a programmed and precise cellular response raised by Cheyenne after prolonged cold stress, the question whether such modulations are also influenced by short term cold exposures needed to be addressed. For this reason, proteomic investigation was extended to intermediate time points (21 and 42 days). Results are presented in Figure 9, which also displays the expression trends of proteins whose involvement in cold acclimation has been assessed by many previous studies. Table 5 lists those proteins not classically involved in cold acclimation which shown a differential expression at these intermediate points, whereas Table 6 shows peptides of cold-related proteins identified by means of mass spectrometry. Only
few new proteins were identified, thus confirming that the deepest changes at the protein expression level occurred at 63 days. However, the time-course monitoring of cold-induced expression of Cor/Lea gene products yielded interesting information about the development of cold hardiness in the examined winter wheat cultivar (Figure 9). Of particular interest was the maintenance of high expression level of wrab17 and wcor18 proteins even after vernalization fulfillment suggesting a fundamental correlation between their production and cold resistance. Multiple spots of both proteins were detected as a result of either post-translationally modified forms or different gene copies.
Figure 8. Growth and cold-induced changes in proteins, organized at the level of functional categories using the PageMan software (http://mapman.mpimp-golm.mpg.de/pageman/) (Usadel et al. 2006). For each protein, the difference between the expression level at the given data points (63 d, 20 °C; 63 d, 4 °C ) and the control (day 0) was calculated and converted to a false color scale (increasing red and blue indicate an up- and down-regulation, respectively). Values are shown as log normalized volumes. The average change for all proteins in a functional category is presented.
Figure 9. 2-DE proteomic profiling of wheat leaves collected from plants grown at room temperature (day 0) or exposed to LT (4 °C) for 21 and 42 days. Lower p anel shows quantitative variations (expressed as average normalized volume) of spots identified as typically cold-related proteins. The same letters above the bars indicate no statistically significant difference, whereas different letters indicate a statistically significant difference (p < 0.05) according to the LSD (least significant difference) test.
Spot No. a
Protein name
NCBI GI No. GO function
1-ANOVA b Average Normal. Volume c 0-d 21-d 42-d 161
Rubisco large subunit [Hordeum vulgare] gi|11587 ribulose-bisphosphate carboxylase activity 2.5x10 -4 117 UTP--glucose-1-phosphate uridylyltransferase [Hordeum vulgare] gi|6136111 nucleotidyltransferase activity 6.1x10 -3 182
Rubisco activase alpha form [Deschampsia antarctica] gi|32481061 RuBisCO activase activity 5.2x10 -6 124 Phosphoglycerate kinase, chloroplastic [Triticum aestivum] gi|129915 phosphoglycerate kinase activity 1.3x10 -3 119 cytosolic malate dehydrogenase [Triticum aestivum] gi|37928995 malate dehydrogenase activity 5.1x10 -4 122 glutamine synthetase [Triticum aestivum] gi|71361902 glutamate-ammonia ligase activity 2.4x10 -5 111 pyruvate dehydrogenase, putative [Ricinus communis] gi|255543140 pyruvate dehydrogenase (acetyl-transferring) activity 8.1x10⁻⁴ 142 Os09g0277800 NADH-dependent enoyl-ACP reductase [Oryza sativa
Japonica Group] gi|115478314 enoyl-[acyl-carrier-protein] reductase (NADH) activity 7.2x10⁻⁴ 152 OEE1 [Triticum aestivum] gi|131388
oxygen evolving activity 2.1x10⁻⁵
78 beta-1,3-glucanase precursor [Triticum aestivum] gi|4741846 glucan 1,3-beta-glucosidase activity 2.7x10 -4 148 cp31BHv [Triticum aestivum] gi|226533870 poly(U) binding RNA binding 3.7x10 -5 35 OEE2 [Triticum aestivum] gi|131394
oxygen evolving activity 5.2x10⁻⁴
43 adenosine diphosphate glucose pyrophosphatase [Triticum aestivum] gi|21322655 adenosine diphosphate glucose pyrophosphatase activity 6.2x10⁻⁶
23 50S ribosomal protein L12-1, chloroplastic [Secale cereale] gi|464517 structural constituent of ribosome 3.1x10 -5 82 7.1x10⁻⁴ 86 ferredoxin-nitrite reductase precursor [Triticum aestivum] gi|218963620 ferredoxin-nitrate reductase activity 6.5x10⁻⁴ 184 chloroplast fructose-bisphosphate aldolase [Triticum aestivum] gi|223018643 fructose-bisphosphate aldolase activity 3.4x10 -5 177 Glutamate-1-semialdehyde 2,1-aminomutase, chloroplastic [Hordeum vulgare] gi|1170029 glutamate-1-semialdehyde 2,1-aminomutase activity 9.1x10⁻⁵ Phosphoribulokinase, chloroplastic [Triticum aestivum] gi|125580 phosphoribulokinase activity 121 Sedoheptulose-1,7-bisphosphatase, chloroplastic [Triticum aestivum] gi|1173347 sedoheptulose-bisphosphatase activity 6.1x10⁻⁴ 134 7.9x10⁻⁴ 138
ATP synthase CF1 alpha subunit [Triticum aestivum] gi|14017569 hydrogen ion transporting ATP synthase activity, rotational mechanism 5.3x10⁻⁴ 46 Translationally-controlled tumor protein homolog
[Triticum aestivum] gi|75246527
calcium binding and
microtubule stabilization 6.9x10
-5
135
ATPase beta subunit [Arabidopsis thaliana]
gi|14017579
8.8x10⁻⁴
27
chlorophyll a/b-binding protein WCAB precursor
[Triticum aestivum] gi|1657859
7.7x10⁻⁴
Table 5. Protein spots identified during short-term cold acclimation (0, 21 and 42 days). Spot shown in Fig.5 were not included.