w w w. s p e c t r o s c o p y o n l i n e . c o m
16 Spectroscopy 20(4) April 2005
ultural heritage belongs to humanity as its history and evolution. The knowledge of the main characteristics of a work of art serves to define fully a scenario of the cus-toms of a historical period or geographical area. In particular, pottery objects, although fragile, are resistant to time and maintain their aesthetic characteristics, so that this type of artifact can be considered a very specific trace of every civiliza-tion.
Therefore it is of great importance to acquire detailed knowledge about the chemical composition and the manufac-turing technique of an artifact. Furthermore, from this infor-mation it is possible to define the degradation state of an artis-tic object — the identification of products of alteration processes or standing chemical reaction can serve to avoid fur-ther irreversible damages and can lead to a qualified restoring work.
The scientific contribution to these purposes is important because it allows for the gathering of clear and unambiguous data. Moreover, only this kind of approach leads to the setting and to the constant check of the conservation conditions for a rare object.
Obviously, in this field, the nondestructiveness of the inves-tigation method is of great importance. Strictly speaking, it means that the technique does not require sampling, but in the common sense the request of a very low quantity of matter is negligible in spite of the great amount of information that could be obtained.
Spectroscopic techniques are very useful in the field of cul-tural heritage because they provide a direct and accurate analysis of the samples and usually require only a small amount of material. In particular, in some cases such as micro-spectroscopies (1–4), Raman scattering (5–7), x-ray fluores-cence (8, 9), and so on, the measurements can be carried out on the whole and intact artistic object. Besides nondestructive-ness, spectroscopic methods furnish a detailed determination of the chemical composition of the matter. Each compound gives rise to an its own spectrum that reflects its energy level distribution, independent of each chemical species, so a
spec-troscopic feature is like a fingerprint (10). From the analysis of the spectral profiles the chemical composition and the physi-cal properties of a material can be determined with great accu-racy.
Among the several vibrational spectroscopies, Fourier-transform infrared (FT-IR) absorbance is one of the most appropriate experimental techniques for the analysis and the characterization of the components in the field of material sci-ence and cultural heritage (2, 11, 12). In particular, the miner-als present in ceramics or other artistic objects, even in traces, are very identifiable, so as to provide useful information on the clay’s provenance.
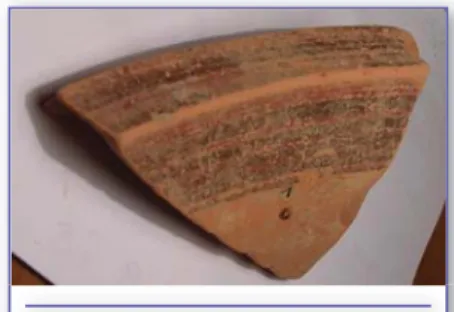
In this paper, we report the main results obtained by FT-IR absorbance on pottery fragments from South Italy archaeolog-ical sites (see Figure 1). The analysis allowed a full and detailed characterization of materials by the identification of the chem-ical phases present, even in traces, in the various specimens. These results provided information about the firing tempera-ture of the potteries and the manufactempera-ture process. In this way the study of geographical provenance can be carried out as well. The comparison with local quarry materials, such as clays
Characterization of Archaeological
Findings by FT-IR Spectroscopy
The authors describe their work characterizing archaeological ceramics by means of
Fourier-transform infrared (FT-IR) absorption. Semiquantitative analyses using the technique can
identify the main components and trace elements constituting the ceramics. An accurate
knowledge of the chemical composition of the samples gives useful information for their
classification
.
Donatella Barilaro, Germana Barone, Vincenza Crupi, and Domenico Majolino
C
IMA
GE COUR
FT-IR
and inert, and in situ productions can assist in classifying the samples and dis-tinguishing between original Greek pot-tery, imported in Italy through trading travel, and that produced locally in South Italy, in which Greek colonies were settled.
Experimental Set-Up
The present study is addressed to the characterization of ceramic specimens. The investigated samples are fragments of common pottery, amphorae, and tiles coming from South Italy archaeological sites and dated back to the sixth to fourth centuries B.C. The main problem is the identification of the provenance of the shards: the aesthetic criterion classi-fies them as Greek type but the Mediterranean basin was rich with Greek colonies in that period, so the manufactures could be local western production or Aegean importations.
We analyzed three groups of samples: • 10 ceramic fragments of coarse potter-ies and transport amphorae from the Valley of Temples in Agrigento (Sicily, Italy), found in archaeological excava-tions carried out in 1954;
• six samples of transport amphorae and tiles from Locri Epizephiri (Calabria, South Italy) dated back to the fifth and fourth centuries B.C.; and
• 20 shards of trade amphorae of the so-called archaic “Corinthian B” type, from archaeological excavations in Gela (Sicily, Italy) and dated to the sixth and fifth centuries B.C.
FT-IR spectroscopy has the advantage of fast absorbance measurements, with good resolution. The use of a Michelson interferometer, instead of a monochro-mator, allows for a simultaneous
meas-ure on the whole admitted spectral range. The interferogram then obtained is processed by a fast Fourier transform algorithm in order to get the absorbance spectrum.
The instrumentation used consists of a Bomem DA8 FT-IR spectrometer equipped with a Globar lamp source, a Mylar beam-splitter and a DTGS/FIR detector spanning the 200–700 cm-1
spectral range; for the 450–4000 cm-1
range we used a Globar lamp source, a KBr beam-splitter and a DTGS/MIR detector. In order to obtain a good sig-nal-to-noise ratio, the measurements were performed in vacuum and 32 repetitive scans were collected for each measurement. In such a configuration a resolution of 4 cm-1was obtained.
Finally, to identify the molecular species, the IR data were compared with the Sadtler library data bank titled “Minerals and Clays” (13).
The samples required preparation in order to be analyzed by measurements in transmission configuration. Just 2 mg of sample was powdered and dispersed in 200 mg of CsI matrix, which is transpar-ent to the IR frequency range used; the mixture then was compacted in pellets, whose thickness was about 0.5 mm. For the negligible sampling required, we can
label the FT-IR absorbance technique as nondestructive.
Results and Discussion
The main feature in a typical absorbance spectrum of a ceramic is due to the quartz bands, centered at 1000 and 1160 cm-1, and also to feldspar and plagioclase
contributions, the presence of which is evident for the bands at around 520–650 cm-1and for the main bands falling in
the range 1000–1100 cm-1. Calcium
car-bonates, such as calcite, aragonite, and dolomite, are revealed easily by the vibrational bands at around 1430 cm-1
and 870 cm-1. Calcite content is variable,
almost absent in some samples, but FT-IR analysis is able to detect it also in trace. This result, together with the pres-ence of neo-formed minerals, reveals the firing temperature that each sample underwent. In fact for temperatures higher than 750 °C the reaction of disso-ciation of calcium carbonate in calcium oxide and carbon dioxide occurs. If the temperature reaches 900 °C this decom-position is irreversible because calcium oxide reacts with clay components and carbon dioxide can no longer be fixed. Therefore, if the cooking of the manu-facture occurs at approximately 900 °C, calcite disappears partially and is
600 800 1000 1200 1400 1600
FT
–I
R absorbance (arb. unit)
Amphora Coarse pottery
Wavenumber (cm-1)
Figure 2. FT-IR absorbance spectra of Agrigento samples: amphora (straight line)
and coarse pottery (dotted line). 1 = calcite; 2 = quartz; 3 = feldspar; 4 = diopside; 5 = montmorillonite; 6 = kaolinite; 7 = wollastonite.
mineral, such as calcite, some other min-erals come out in the firing process. As an example, at 650 °C the reaction of illite with calcite produces the formation of gehlenite:
2KAL2(Si3Al)O10(OH)2[illite] + 6CaCO3[calcite] → 3Ca2SiAl2O7 [gehlenite] + 6CO2+ 2H2O + K2O + 3SiO2
If the baking temperature reaches 900 °C, diopside, whose bands are centered at about 256 cm-1, 305 cm-1, 468 cm-1,
506 cm-1, 622 cm-1, 857 cm-1, 915 cm-1,
960 cm-1, and 1068 cm-1, can be
obtained from the reaction between quartz and dolomite:
2SiO2[quartz] + CaMg(CO3)2 [dolomite] → 2CO2 + CaMgSi2O6 [diopside]
while, at the same temperature, the
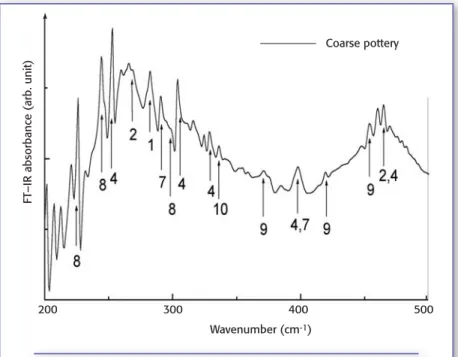
com-200 300 400 500
FT–I
R absorbance (arb. unit)
Coarse pottery
Wavenumber (cm-1)
Figure 3. Low frequency FT-IR absorbance spectra of Agrigento amphora sample. 1
= calcite; 2 = quartz; 4 = diopside; 7 = wollastonite; 8 = iron oxide; 9 = aluminum oxide; 10 = titanium oxide.
FT-IR
bination of quartz and calcite gives wol-lastonite, whose main bands are centered at about 568 cm-1, 893 cm-1, 928 cm-1,
960 cm-1, 1008 cm-1, and 1046 cm-1:
2SiO2[quartz] + CaCO3[calcite] → CaSiO3[wollastonite] + CO2
Other elements undoubtedly present in the ceramic paste are clays, such as montmorillonite, kaolinite, muscovite, illite, and chlorite, that are revealed by bands in the range 1000–1100 cm-1and
other contributions at ~530 cm-1and at
900 cm-1. Usually kaolinite and dolomite
are present in traces because of burn during the baking reactions, while the montmorillonite generally derives from hydrolysis processes during the burial period of the ceramic manufacture (14). Ceramics also often contain iron oxides, which have main bands centered in the range of 520–530 cm-1.
Measurements in the low frequency range (200–700 cm-1) allow for the
con-firmation of identification of some min-erals, such as calcite (282 cm-1), quartz
(268 cm-1and 461 cm-1), diopside (232
cm-1, 251 cm-1, 306 cm-1, 329 cm-1, 397
cm-1 and 465 cm-1), and wollastonite
(290 cm-1 and 396 cm-1); furthermore
they show more clearly the presence of several oxides, such as iron (224 cm-1,
245 cm-1and 297 cm-1), aluminum (371
cm-1, 420 cm-1, 453 cm-1), and titanium
(334 cm-1) oxides, whose bands at low
frequency can be identified easily (11).
Agrigento ceramic samples. In all the
Agrigento samples high content of quartz, feldspars, and kaolinite, labeled in Figure 2 with numbers 2, 3, and 6 respectively, were found. Figure 2 shows the IR absorbance spectra, in the high
600 800 1000 1200 1400 1600
FT–I
R absorbance (arb. unit)
Amphora Tile
600 800 1000 1200 1400 1600
FT–I
R absorbance (arb. unit)
Greek Western
Wavenumber (cm-1)
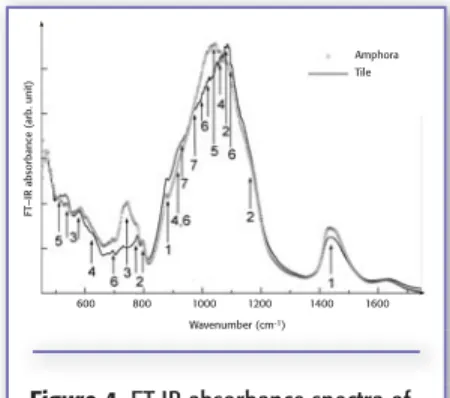
Figure 4. FT-IR absorbance spectra of
Locri samples: amphora (straight line) and tile (dotted line). 1 = calcite; 2 = quartz; 3 = feldspar; 4 = diopside; 5 = montmorillonite; 6 = kaolinite; 7 = wollastonite.
Figure 5: FT-IR absorbance spectra of
Gela samples: greek (straight line) and western (dotted line). 1 = calcite; 2 = quartz; 3 = feldspar; 4 = diopside; 5 = montmorillonite; 6 = kaolinite; 7 = wollastonite; 11 = flint.
sample (dotted line). As can be seen, cal-cite (labeled with 1) content is variable, in fact we can observe a higher amount in amphorae then in coarse pottery. This occurrence is related to the baking of the manufactures because as the tempera-ture increases, calcite disappears partial-ly. Furthermore neo-formed minerals come out from the firing process: diop-side (4) and wollastonite (7) were, in fact, mainly revealed in coarse potteries. Such detailed experimental results allowed to deduce that the coarse pot-tery was cooked at a temperature of about 900 °C, because of the presence of diopside and wollastonite and the lower amount of calcite.
Low frequency FT-IR measurements were carried out on the same samples. In Figure 3, the FT-IR spectrum of a coarse pottery sample, collected in the range of 200–500 cm-1, is reported: this kind of
analysis confirmed the presence of cal-cite, quartz, wollastonite, and the abun-dance of diopside; furthermore iron (8), aluminum (9), and titanium (10) oxides also were identified.
The experimental results were com-pared to data relative to hellenistic-roman coarse pottery produced in Agrigento and medieval kiln scraps from paleo-christian necropolis of Agrigento (17). We can deduce that the clayey matrix revealed in the samples under investigation are compatible with the geological formation of the area in which they were found. This leads to the conclusion that raw materials, through-out extracted in different periods, have similar composition.
Locri ceramic samples. From the IR
absorbance profiles, it was evident that Locri ceramic samples contain high amounts of calcite (1), quartz (2), and feldspar (3), as can be seen from an inspection of Figure 4, which reports the IR experimental spectra of an amphora sample (straight line) and of a tile sam-ple (dotted line). The experimental data show relevant differences between the two typologies of sample analyzed as the clay content is concerned. In fact, we can observe that kaolinite (6) is more abun-dant in tile fragments than in amphorae, while in the latter the presence of
mont-productions and raw materials (18, 19), it is possible to conclude that the prove-nance region of the ceramics is Calabro–Peloritano. The compositional variations, clearly showed by the experi-mental data, could be attributed to the presence of different workshops and to the existence of several quarries of clay materials, although in the same area.
ter contains more diopside (4) than the former. From these results, we can deduce a firing temperature of about 900 °C for the tiles, while for the amphorae we can hypothesize a range of 850–900 °C for the more abundant pres-ence of calcite and only traces of diop-side.
Gela ceramic samples. Gela samples
FT-IR
can be divided into two groups that show spectral features really different from each other. Their classification was related to the provenance of the frag-ments: the first group was supposed to have been imported from Greece; the second one referred to a Magna Grecia region. Figure 5 reports the IR spectra of an original Greek amphora sample (straight line) and a local western amphora sample (dotted line). Experimental data showed the presence of calcite (1), quartz (2), and K-feldspar (3) in both groups of samples, but more abundant in western ceramics. In the lat-ter, montmorillonite (5) and kaolinite (6) also were clearly revealed. In the original Greek samples a high content of diopside (4) and wollastonite (7) is evi-dent. This occurrence, together with a low amount of calcite, allows us to assign a higher firing temperature (~900 °C) for these findings than the one of western samples. In particular, the band centered at around 880 cm-1is not due
totally to calcite (present in low quanti-ty, as shown from the lack of its charac-teristic band at 1424 cm-1) but also it can
be attributed to flint (11) presence, that contributes at 778 cm-1, 796 cm-1, 1080
cm-1, and 1164 cm-1(19–21).
The attribution to different prove-nance of the two groups of samples is confirmed by ICP–OES analysis. It is known from the literature (22–24) that original Greek manufactures show per-centages of Ni and Cr ranging from 250 to 500 ppm, while the western produc-tion has values of these elements lower than 100 ppm. The high concentrations of Ni and Cr (Ni: 140–190 ppm, Cr: 230–360 ppm), revealed in the first sam-ples group, lead to identifying a Greek original manufacture. Instead, the sec-ond sample group is characterized by lower amounts of Ni and Cr (Ni: 40–50 ppm, Cr: 70–90 ppm), therefore attrib-uted to a local western production. Conclusion
The study carried out on ceramic frag-ments is addressed to obtain an accurate knowledge of the manufacturing of this type of artwork in the sixth to fourth centuries B.C. The identification of the mineral phases present is the first step in the characterization of the findings and
FT-IR absorbance spectroscopy is able to determine with good precision the ana-lytical composition of the samples under investigation. Such a detailed characteri-zation furnishes useful information also about the firing temperature of the ceramics. Moreover, the choice of the materials used depends upon the geo-logical sheeting of the production region and each historical age refers to different recipes and manufacturing techniques. The measurements collected contribute significantly to attribute the provenance of all the fragments and to distinguish the imported findings from the local. References
1. A. Zoppi, C. Lofrumento, E. Castellucci, and M.G. Migliorini, Spectroscopy
Eu-rope14, 16 (2002).
2. D. Majolino, P. Migliardo, R. Ponterio, and M.T. Rodriquez, J. Cutl. Herit. 5, 57 (1996).
3. C. Coupry, Analusis 28, 39 (2000). 4. R.J.H. Clark, M.L. Curri, and C. Laganara,
Spectrochim. Acta Part A53, 597
(1997).
5. R.J.H. Clark and M.L. Curri, J. Mol. Struct.
440, 105 (1998).
6. P. Colomban, V. Milande, and L. Le Bihan,
J. Raman Spectrosc.35, 527 (2004).
7. P. Colomban, G. Sagon, and X. Faurel, J.
Raman Spectrosc.32, 351 (2001).
8. K.I. Duffy, J.H. Carlson, and C.P. Swann,
Nuclear Instruments and Methods in Physics Research B189, 369 (2002).
9. M. Ferretti, in D.C. Creagh, and D.A. Bradley, eds. Radiation in Art and
Ar-chaeometry(Elsevier, Amsterdam, 2000), pp. 285–296.
10. S. Svanberg, Atomic and Molecular
Spectroscopy(Springer Verlag, Berlin, 1992).
11. W.P. Griffith, in Spectroscopy of
Inor-ganic Based Materials, R.J.H. Clark and R.E. Hester, eds. (J. Wiley and Sons Ltd., New York, 1987), pp.119–186. 12. P. Agozzino, D.I. Donato, S. Magazù, D.
Majolino, P. Migliardo, R. Ponterio, E. Ri-varola, and S. Vassallo, J. Cutl. Herit. 4, 59 (1995).
13. Sadtler Database for FT-IR (BioRad Lab-oratories).
14. J. Capel, F. Huertas, and J. Linares,
Min-eral Petrogr. Acta29, 563 (1985).
15. P. Duminuco, M.P. Riccardi, B. Messiga, and M. Setti, Ceramurgia 5, 281,
(1996).
16. M.P Riccardi, B. Messiga, and P. Dumin-uco, Appl. Clay Sci. 15, 393 (1999). 17. R. Alaimo, G. Montana, R. Giarruso, L. Di
Franco, R.M. Bonacasa Carra, M. Denaro, O. Belvedere, A. Bugio, and M.S. Rizzo “Le ceramiche comuni di Agrigento, Segesta e Termini Imerese: risultati archeometrici e problemi arche-ologici,” in Atti della prima giornata di
archeometria della ceramica (Univer-sity Press Bologna, 1997), pp. 46–70. 18. L. Amodio-Morelli, G. Bonardi, V.
Colonna, D. Dietrich, G. Giunta, F. Ip-polito, V. Liguori, S. Lorenzoni, A. Paglionico, V. Perrone, G. Piccarretta, M. Russo, P. Scandone, E. Zanettin Loren-zoni, and A. Zuppetta, Mem. Soc. Geol.
It.17, 1 (1976).
19. G. Barone, S. Ioppolo, D. Majolino , C. Branca , L. Sannino , G. Spagnolo, and G. Tigano, Per. Min. 74 (in press). 20. I.K. Whitbread, 1995, Greek Transport
Amphorae. A Petrological and Archeo-logical Study, Occasional Paper 4, The British School at Athens, Fitch Labora-tory.
21. G. Barone, S. Ioppolo, D. Majolino, P. Migliardo, L. Sannino, G. Spagnolo, and G. Tigano, in Da Zancle a Messina, So-printendenza Beni Culturali e Ambien-tali di Messina, G.M. Bacci and G. Tigano, eds. (Sicania, Messina, 2002), pp. 87–117.
22. R.E. Jones, 1986, Greek and Cypriot
Pot-tery. A Review of Scientific Studies, Oc-casional Paper 1, The British School at Athens, Fitch Laboratory.
23. S.T. Levi, Produzione e circolazione della
ceramica nella Sibaritide protostorica, (All’insegna del Giglio, Firenze, 1999). 24. G. Barone, S. Ioppolo, D. Majolino, P.
Migliardo, and G. Spagnolo, J. Cult.
Herit.3, 171 (2002). ■
Donatella Barilaro, Vincenza
Crupi, and Domenico Majolino
are with the Dipartimento di Fisica, Università di Messina (Italy). E-mail: [email protected].
Germana Baroneis with Dipartimento di Scienze Della Terra, Università di Messina.