IET Wireless Sensor Systems
Research Article
Architecture of a hydroelectrically powered
wireless sensor node for underground
environmental monitoring
ISSN 2043-6386 Received on 6th December 2016 Revised 3rd May 2017 Accepted on 10th May 2017 E-First on 22nd June 2017 doi: 10.1049/iet-wss.2016.0103 www.ietdl.orgAlessandro Mecocci
1, Giacomo Peruzzi
1, Alessandro Pozzebon
1, Pietro Vaccarella
11Department of Information Engineering and Mathematical Sciences, University of Siena, Via Roma 56, Siena, Italy
E-mail: [email protected]
Abstract: This study describes a sensor node powered by an energy harvesting method based on the watermill principle. This
method is suitable whenever a sensor node has to be deployed in the nearby of an underground water line, such as a drainage system or an aqueduct. The operating scenario for whom this solution has been developed and employed is a wireless sensor network for the monitoring of the environmental conditions of the so-called ‘Bottini’ in Siena, Italy. The ‘Bottini’ is a network of medieval aqueducts dug in the underground of the historic centre of the city, in which water still flows nowadays. Using the proposed energy harvesting system the sensor nodes are able to operate independently, minimising the maintenance and allowing the real-time monitoring of environmental parameters, thanks, in order to manage the preservation of this ancient site. The entire system is composed of three parts: the power generation system, the data acquisition system and the wireless transmission system. The whole architecture has been tested in the operating scenario, precisely in ‘Fontebranda’, one of the biggest fountains in the ‘Bottini’ network.
1 Introduction
Wireless sensor networks (WSN) are widely adopted in many situations and they are in continuous development to suit best the most diverse project requirements. A WSN deployed in a hardly reachable region, such as in the underground, presents some tough challenges in terms of power supply and data transmission and collection. The challenge in terms of power supply is probably the toughest task, since there could be several factors and variables that may affect the choice of the best solution. In particular, power consumption is affected by the following elements:
• The presence of data transmission modules on the node. • The environment where the nodes have to be deployed.
Particular environmental conditions, such as high temperature or moisture, could rapidly decrease the battery level and its lifetime.
• The typology of the sensors embedded on the node. Indeed, active sensors require more power than the passive ones and consequentially they are responsible for reducing the lifetime of the node.
Owing to the fact that a wireless sensor node is typically characterised by a limited source of power, it is fundamental to adopt an energy-saving strategy or even more than one, which permits to reduce as much as possible the power consumption. This requirement is mandatory if the node is placed in a hardly reachable site by direct power supply or non-renewable energy sources (such as the scenario where the system described in this paper has been tested).
Some energy-saving strategies reside in optimised energy communication protocols: at the media access control layer [1, 2] as well as at the network layer, exploiting energy aware routing algorithms [3, 4].
Other energy-saving strategies could be adopted managing the duty cycle of the node [5] or using mixed techniques of energy management as described in [6, 7].
The lifetime of a node is also affected by the position of the node itself inside the monitored environment network. For instance, chain-type networks with multi-hop communication methods are widely employed in underground environments. As a consequence, the closer the node is to the base station the more
power it requires, because it is subject to a stronger data traffic than the ones placed farther. This phenomenon is discussed in several papers such as [8, 9]. Using a renewable source of energy, it is possible to develop autonomous powering solutions for sensor nodes, like it is shown in this study.
This paper is structured as follows: Section 2 describes the state-of-the-art about sensor nodes energy harvesting solutions. In Section 3 the operating scenario and the architectures of the node and the network are shown. Section 4 describes the fundamental mechanical principle and the conversion system which are at the base of the hydroelectric energy harvesting solution. Section 5 presents the data acquisition system and the data transmission system, while in Section 6 the test phase is shown. Finally, in Section 7 some final remarks are underlined.
2 Energy harvesting techniques for sensor nodes
Many papers focus on the use of renewable energy sources to power sensor nodes [10, 11].
Solutions exploiting radio frequency [12] and mechanical vibrations [13] are not suitable for underground environments such as the proposed scenario.
In terms of wind power, nowadays there are not much commercial solutions available. Nevertheless, this kind of source is often exploited to power low consumption systems such as sensor nodes [14, 15].
Regarding the use of solar power it is necessary that the device is directly exposed to the sunlight as shown in [16, 17]. Moreover, if Arduino micro-controller is used as the core of the sensor node, a plug-and-play solar charger shield is commercially available.
Water flows have been used several times to power sensor nodes such as in [18, 19]; however all these solutions exploit water flows in pipelines: in these applications the flow is channeled and constrained in pipes and is then notably more powerful. Hence, they cannot then be adopted in scenarios like the one described in this paper. Hence, as far as we are concerned, a solution such as the proposed one, based on the principle of the watermill for a sensor node power supplying, does not exist. Moreover, at our knowledge the watermill principle has never been opted for a power generator to be employed in a case of such a scant flow.
Andreadis et al. [20] proposed a first laboratory prototype of a watermill-based energy harvesting system for wireless sensor node.
That solution provided good results in laboratory, however, it turned out to be no longer effective in the real scenario, hence it has been totally re-designed. In particular, the whole mechanic system has been fully re-designed and the improved solution allows the continuous powering of the node with the subsequent removal of the energy control system and the battery. The battery could be obviously re-introduced to allow power accumulation: anyway, real time monitoring is not required, hence short interruptions in the data acquisition do not affect the overall system functioning. Moreover, with respect to [20], also the node architecture has been totally re-designed, with the removal of the micro-controller and the subsequent notable reduction in power consumption. Finally, in this paper an on-field test is shown.
3 Operating scenario and the node and network
architectures
The watermill has been designed and developed to feed each sensor node belonging to a WSN for the monitoring of some environmental parameters of the ‘Bottini’ of Siena, Italy.
The ‘Bottini’ are the ancient aqueducts dug in the underground during the period 12th to 14th century. They are composed of a network of galleries, whose average height is 170 cm and whose average width is 90 cm, and on the floor of the galleries there is a duct where the water still flows nowadays. The duct has a cross section whose rough dimensions are 20 × 8 cm. The water level is almost constant: in case of exceptional events (flooding) it can increase up to 5 cm with respect to the standard level.
Furthermore, due to the fact that the ‘Bottini’ are difficult to access by man, it is very important that the WSN operates autonomously as much as possible: each single node should be able to work drawing power from a renewable source of energy, limiting as far as possible any human intervention.
To satisfy all the project requirements, a minimal sensor node architecture based on the following sub-systems is proposed: • A watermill-based energy harvesting solution for the node
powering.
• An XBee communication module for data transmission. The module is used standalone, providing wireless communication and data sampling as well. No additional micro-controller has been added: this would have increased the required power. Among the possible data transmission technologies, XBee has been chosen due to the fact that it implements the ZigBee protocol that allows mesh networking, required for the proposed scenario. A star topology, common for many sub-GHz networking technologies, would not allow the full coverage of the whole network of galleries; multi-star topology would be complex to be implemented due to the difficulty in deploying a larger number of access points. Moreover, the main advantages of sub-GHz solutions, i.e. long transmission ranges and low power consumption, do not significantly improve the features provided by XBee for the proposed application scenario. • An air temperature sensor an air moisture sensor and a water
temperature sensor.
A block diagram of the architecture is shown in Fig. 1: the structures of the blocks will be described in detail in the following sections.
The proposed sensor node is expected to be integrated in a network architecture composed by a set of nodes placed every 50 m along the main gallery of the ‘Bottini’: this distance allows the line-of-sight among a node and its closest one. Indeed, XBee modules are able to transmit at a distance up to 120 m in line-of-sight.
To make remote data available, the WSN is provided with a gateway node which is in charge of receiving all the data collected by the sensor nodes and transmitting it to a remote data collection centre.
The network architecture is based on the use of a multi-hop mesh topology with a single gateway, placed at the entrance of the gallery, which is provided with GPRS connection. Of course, below ground no GPRS connection is available, but this is not an issue at all since the entrance of the gallery is a small door in the main square of Siena. In this site GPRS coverage has proven to be available and the line-of-sight requirement with the first sensor node of the network is still fulfilled.
4 Watermill and the energy conversion system
The main component of the energy harvesting system is a watermill wheel which has been specially designed to fit in the ducts of the ‘Bottini’. Indeed, it has some special features:
• A modular support, in order to come into contact with the right amount of water due to the fact that water level and cross section of the duct may slightly vary.
• The width of the wheel can vary depending on the width of the duct, adding up to a maximum of three watermill wheels, one beside the other, tightly secured with cable ties.
This section shows how the several parts of the energy harvesting system are made.
4.1 Design and realisation of the watermill wheel
The wheel has been designed ex-novo exploiting a 3D CAD software and a 3D printer. It has a structure designed ad-hoc: it is provided with a row of blades having a suitably shaped profile, whose curvature allows the water to enter inside the blades without causing shocks, turbulences or eddies with consequent energy losses (see Fig. 2a). At the same time, the curvature of the profile allows the wheel to maximise the potential energy of the water. Water coming into contact with the blades of the wheel, gives them its own kinetic energy, then it flows naturally unloading its weight on the curved profile of the blade, exerting further pressure on the wheel. Another advantage of the curved profile of the blade is that it allows the total emptying of the blade itself, avoiding resistances which would compromise the efficiency of the mill wheel. The wheel has a diameter of 19 cm and a width of 4 cm and, as previously mentioned, its thickness can reach even up to 12 cm in case all three wheels are employed.
Each wheel was printed in polylactic acid or polylactide (PLA) (see Figs. 2b and c). Each wheel has a central hole, within which is installed a pair of ball bearings so as to reduce the friction during the wheel's rotation. Inside the hole of the bearings, a threaded rod passes so as to facilitate the installation of the wheels, which are joined together with plastic cable ties, in the support structure using a pair of nuts, as it will be explained later.
4.2 Choice of the electric motor and of the motion transmission
The DC electric motor has a fundamental role: indeed, exploiting its reversibility, it is able to generate a voltage at its leads linearly dependent on the number of revolutions that the motor shaft does by water push. The linear dependence reflects only a purely theoretical scenario: in practice it is not exactly linear. However, this motor has been sized using the linear dependence as it will work in the ideal case. As a consequence, the results obtained are slightly lower than those expected but they are still satisfactory for the purpose of feeding the sensor node.
The square one is the evaluation of the speed of water. It has been calculated in an entirely experimental mode, and this means that this figure may be far from reality even though it has been calculated considering a set of underestimated factors, such as the roughness of the duct. However, due to the fact that it is not possible to do an accurate measurement because of all the reasons listed above, the calculated speed of water has been chosen. This speed has been calculated using the Chézy formula for an open channel flow:
ν = χ Rj (1)
where:
• ν is the water speed [m ⋅ s−1].
• χ is the Strickler–Manning coefficient which represent the
surface's roughness on which water flows [m1/2⋅ s−1]. • R is the hydraulic radius [m].
• j is the duct slope.
In the ‘Bottini’ χ has a very low value comparable with
watercourses with gravel riverbed and some moving material on the bottom. Due to this, χ is assumable as 30 m1/2⋅ s−1. The slope of the ‘Bottini’, which is the only reason for the water flowing, is = 0.1% so 0.001. R depends on the cross section of the water flow, which is approximately rectangular in the ‘Bottini’. Assuming that this cross section has a base (b) of 20 cm, and a height (y) of 8 cm (which represents an underestimated condition), R is calculable through the following formula:
R = b ⋅ yb + 2y (2) According to this formula R ≈ 0.045 m.
Using the values of χ, j, and R in (1) the speed of water could
be calculated, so v = 0.2 m ⋅ s−1. It could be assumed that the water that flows in the ducts has the characteristics of a laminar flow without eddies or turbulence in order to simplify the calculations: the limited duct dimensions allow this approximation without losing too much accuracy. Assuming to immerse the watermill wheel so that the surface of the water arrives at a distance r = 5 cm
from the centre of the wheel, it is possible to calculate the angular velocity ω of the waterwheel:
ω = vr (3)
According to this formula ω = 4 rad ⋅ s−1.
Using the following formula it is possible to calculate the number of rotation per minute n of the watermill wheel:
n = 60 ω2 π (4)
According to this formula n ≈ 38 rpm.
Now it is necessary to describe the system used to transmit the motion from the mill wheel to the electric motor. An ad-hoc transmission system has been chosen: two gears have been designed and printed in PLA using a 3D printer. These gears are coupled with a transmission belt and they introduce a transmission ratio of 6, which is in theory the optimum transmission ratio for two gears connected with a belt. The bigger gear is fixed to one of the hydraulic wheels and inside it there is a ball bearing, while the smaller one has been fixed to the motor shaft. Once the gear ratio has been chosen it is possible to calculate the number of rotation per minute N of the electric motor using the following formula:
N = 6 n (5)
According to this formula N = 228 rpm. It is preferable to choose a
motor with a high nominal supply voltage (in this case 24 V) because, for the same nominal shaft rotation per minute, a motor with a higher nominal voltage provides less drag torque. Assuming the case of linear motor reversibility, and having chosen a 7 V voltage at the motor leads with 228 rpm, it is possible to calculate the nominal number of rotation per minute NR that should have had the motor:
NR = 24N7 (6)
According to this formula NR ≈ 781 rpm.
Hence, the ideal electric motor would have 781 rpm at 24 V of power supply. Obviously, a motor which exactly reflects these features does not exist so a motor as similar as possible to the desired one has been chosen. Therefore a motor with a supply voltage of 24 V and 863 rpm has been selected.
Fig. 2 Waterwheel:
(a) 3D model and (b) Prototype standing, (c) lying
4.3 Description of the support structure
The support structure has been designed as a consequence of how the waterwheel has been assembled. Without a doubt, having an unmovable watermill wheel's axle is a big advantage since it can be securely inserted into the support structure. In addition, the dimensions of the duct, as well as its position on the floor of the galleries, have been considered in the design of the support structure, aiming to provide an underpinning that could be installed in multiple operating conditions. Furthermore, a ballast has been laid on the staple surface of the structure in order to provide a greater stability to the whole prototype.
The support frame has got only one arm, thus it will be easier to install the prototype whenever the duct is in the nearby of the wall of the galleries. The structure allows to install both the sensors and the communication system directly on itself. The axle of the wheel, which is a steel threaded rod, is fixed to two vertical bars, which are steel threaded too, with a pair of nuts: this facilitates its disassembly. The vertical bars have been perforated so as to allow the crossing of the axle of the wheel. The vertical rods allow, through a nuts clamping system, to place the waterwheel in the
optimal position in function of the water which flows in the duct. Furthermore, in order to speed up the installation of a large number of sensor nodes, the threaded rods could be substituted with a pair of smooth ones. In this situation, the nuts would be replaced with clamps. The support also provides a seat designated for the housing of the electric motor: indeed, exploiting one of the two vertical bars, a support for the motor has been clamped using a pair of nuts. In addition, this also allows to bring in the correct tension the transmission belt.
At this point the support structure has been mounted. It is composed of three parts: the base on which the ballast lays, a vertical beam and a horizontal arm. All three of these parts were made using wooden beams, glued and screwed to each other so as to have a greater stability. Of course, in a further engineering phase of the prototype, a more waterproof material should be used instead of wood for the support structure. The following figures show the design of the structure (see Fig. 3a) and its realisation (see Fig. 3b). While the support structure perfectly fits within the dimensions of the ‘Bottini’ galleries, the base could be arranged longitudinally beside the duct with two ballasts on both sides of the vertical beam. Such a solution would notably reduce the space occupied by the structure, allowing its positioning also in galleries whose width can be only 40 cm.
5 Data acquisition and transmission systems
In this section, all the sensors used for the monitoring as well as the transmission system, are described. Furthermore, the signal conditioning circuits are analysed, whenever they occur, because the AD converters accept signals lower than 1.2 V and some sensors could provide higher signals than the ones accepted.
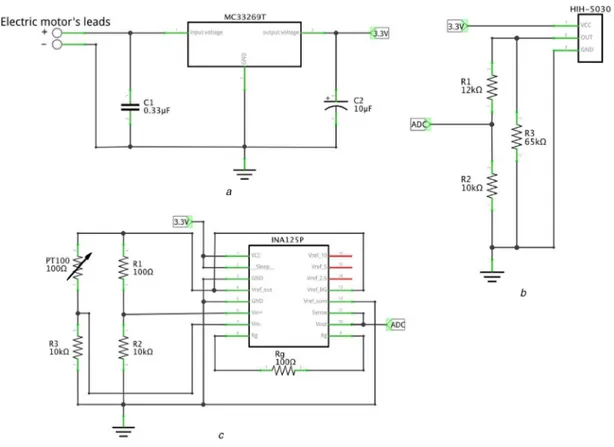
The electric motor does not power directly the sensor node. Indeed, it is powered by a voltage regulator because it requires a power supply of 3.3 V, which is the communication module supply voltage. To power the whole node in the proper way, the MC33269 T voltage regulator produced by ON Semiconductor has been employed. This regulator needs two capacitors employed as low pass filters (see Fig. 4a).
Fig. 3 Support structure:
(a) 3D model and (b) prototype
Fig. 4 Electronic circuits:
5.1 Air temperature sensor
To monitor the air temperature the MCP9700 temperature sensor produced by Microchip has been chosen. It has an output voltage of 500 mV at 0∘C and a linear temperature coefficient of 10 mV ⋅∘C−1. Assuming that the temperature of the ‘Bottini’ will not exceed 20∘C, since it is an underground environment, the output voltage of the sensor will be always under 700 mV, as also shown in its datasheet [21], so it does not require any signal conditioning circuit. The sensor absorbs 6 μA.
5.2 Air moisture sensor
To monitor the air moisture, in particular relative humidity, the HIH-5030 moisture sensor produced by Honeywell has been employed. It has a linear output voltage from 500 mV at 0%RH to 2.6 V at 100%RH, as shown in the datasheet [22]. Due to this fact, this sensor needs a signal conditioning circuit.
A resistive voltage divider has been chosen as signal conditioning circuit employing a 10 kΩ resistor and a 12 kΩ resistor, obtaining a ratio of 0.45; so in case of 100%RH, the output voltage of the sensor would be 1.18 V, which would be well accepted by the AD converter. The datasheet also recommends to use a 65 kΩ resistor from the output pin to the ground (see Fig. 4b). The sensor absorbs 200 μA and the signal conditioning circuit absorbs, in the worst case, 120 μA, hence the entire system absorbs at maximum 320 μA.
5.3 Water temperature sensor
To monitor water temperature a PT100, which is a platinum RTD (resistance temperature detector), has been chosen. It is capable of operating under water and its resistance value varies as a function of temperature with a linear trend:
RT= R0(1 + αT) (7)
where
• R0= 100 Ω is the resistance value of the PT100 at 0∘C • α = 0.00 385∘C−1;
• T is the temperature to which the PT100 is exposed. • RT is the resistance value of the PT100 at the temperature T. Estimating that water will not exceed the temperature of 25∘C, this implies that the PT100 will have a maximum value of 109.625 Ω. Like many resistive transducers, the PT100 has been installed in a Wheatstone bridge configuration. Then the signal provided by the bridge has been amplified using an instrumentation amplifier. Hence, the INA125P, which is an integrated instrumentation amplifier whose gain is settable employing just one resistor (Rg),
produced by Burr-Brown, has been used.
The Wheatstone bridge has been supplied with a voltage
Vref1.24 V using one of the several amplifier's reference voltages, as it is shown in the circuit (see Fig. 4c). The bridge has been sized using two 10 kΩ resistors, one 100 Ω resistor and of course the PT100. In this conditions the bridge approximately absorbs at maximum 200 μA.
It is possible to calculate the maximum bridge differential voltage Vd, which will be amplified by INA125P:
Vd=(RVref⋅ R2⋅ (RT⋅ R0)
2+ R0) ⋅ (R2+ RT) (8) where:
• Vref= 1.24 V which is the bridge's supply voltage;
• R2= 10 kΩ;
• RT= 109.625 Ω which is the maximum resistance value of the PT100, as explained above;
• R0= 100 Ω which is the resistance value of the PT100 at 0∘C, as explained above.
Calculating (8) using the previous values, Vd= 1.17 mV.
At this point, the differential voltage of the bridge is amplified by the instrumentation amplifier, whose gain G is calculable using (9), as it is shown in its datasheet.
G = 4 + 60000R
g (9)
In this case Rg = 100 Ω, so G = 604, which means that the output voltage of the amplifier would be at maximum 706.68 mV (which means a water temperature of 25∘C) that would be well accepted by the AD converter. The amplifier typically absorbs 460 μA, so the overall system for the monitoring of water temperature absorbs around 660 μA.
5.4 Transmission module
The sensor node described above has two main tasks: data acquisition and transmission. Since data processing is not a required feature, a micro-controller is not necessary, therefore the consumption of the sensor node is pretty low. Indeed, the remote data collection centre is in charge of data processing. This is possible because the WSN is provided with a gateway node, equipped with GPRS technology, whose task is to gather data from each sensor node and transmit it to the remote data collection centre.
The data gathering is allowed by the employment of a wireless transmission module per sensor node. In particular, XBee series 2 PRO communication modules have been used, for the following reasons:
• Larger transmission range compared to similar devices;
• Low power consumption (at maximum 70 mA during the transmission phase);
• Presence of 10 bit AD converters on board (which are employed to acquire the signals from the sensors).
The signals from the sensors are dealt by the XBee AD converters (pins 18, 19 and 20) whose sample frequency can be set via the XBee configuration parameters. In this case a sampling period of 60 s has been chosen.
Since each XBee module is identified with an univocal serial number, it will be easy to process each frame transmitted to the data collection centre during the processing phase. Indeed, each frame contains the sender address (which is the serial number of the sender module) and many others information within which there are the signals values of the sensors converted in digital by the AD converters (they are at the end of the frame, just before the last byte that is the checksum byte), which are handled by the remote data collection centre.
6 System test
While the data transmission system has been tested in the gallery of the ‘Bottino Maestro di Fonte Gaia’, the overall sensor node architecture has been tested in one of the few open air parts of the Bottini so as to ease all the test procedures, without being obligated to work in a poky space such as the one described above: the open air testing site was the complex of a Bottini fountain called Fontebranda (see Fig. 5). Regarding the communication channel, the data transmission was tested with the sensor nodes powered by a common battery, and the 50 m data transmission range was fully achieved, confirming the feasibility of the whole network architecture. For the testing of the sensor node, the support structure has been placed close to the duct of the ‘Bottini’. Then, the height of the waterwheel has been carefully regulated exploiting the vertical rods, in order to maximise as much as possible the transferred energy. The best results have been achieved with the waterwheel immersed in for around 1.5 cm. This result has been achieved experimentally by measuring the obtained voltage
by varying the depth of immersion from 0.5 to 4 cm: voltage has been measured every 0.5 cm keeping the wheel immersed for 15 min. The voltage value obtained with the depth of immersion of 1.5 cm has always been the highest one compared to the ones obtained with different depths. Nevertheless, it has to be underlined that with different depth values the variation of the achieved voltage is not so large to compromise the operation of the node. This fact suggests that the node will be able to operate also with variable water levels. This fact allows then the operation of the waterwheel also in case of flooding: as described in Section 3, in these cases water level increases at most of 5 cm. With this value the waterwheel is still able to rotate and generate power. With higher water level increases, the waterwheel could not be able to operate: anyway, mechanical parts are not damaged by the presence of water and the node would only stop working for a short span of time, resuming its operation as soon as the water level is decreased. Electrical components, that could be damaged by the
presence of water, are placed around 30 cm above the wheel: such an increase in water level is not possible in the ‘Bottini’.
Following the identification of the best immersion depth, the node has been run in the duct for 2 h. In this span of time the water flux has been almost constant: indeed, the ‘Bottini’ present an average slope of 0.1% that does not allow remarkable variations of the flow. Due to the very low value of the slope, the ‘Bottini’ can be considered as a worst case scenario to analyse the effectiveness of the proposed solution. For the 2 h operation, the sensors, as described in Section 5.4 have been sampled every 60 s: after every sampling, a ZigBee API frame has been sent from the node to a laptop provided with a USB ZigBee gateway. An example of data packet can be seen in Fig. 6, where the payload storing a set of the three data samples of the sensors has been highlighted.
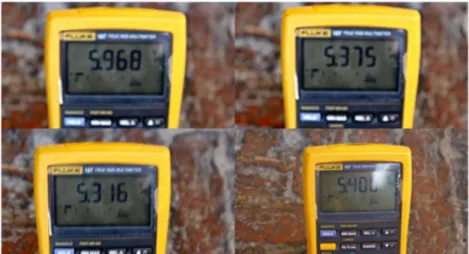
While the effectiveness of the solution has been proven by achieving the transfer of the data acquired by the sensors from the node to the gateway, the analysis of the consumptions has been carried out by connecting a multimeter to the power supply of the node. The whole prototype has a total consumption composed by the sum of the consumption of the single component, hence it hovers at maximum around 75 mA during the transmission phase (peak consumption). As mentioned in Section 4.2, the voltage at the motor leads is not as high as the one expected (7 V) but despite this, it is a very useful result anyway. Indeed, the voltage regulator has a dropout voltage of 1 V, according to its datasheet [23], therefore a medium voltage of 5.5 V (see Fig. 7), such as the one obtained during the test, ensures the proper operation of the device. Moreover, since the regulator runs correctly and its average input– output differential voltage hovers around 2 V, according to its datasheet [23] it provides a maximum output current of ∼1.5 A, which abundantly satisfies the amount of energy required by the node.
7 Conclusion
The energy harvesting system described in this paper has proven to satisfy the power requirements of the proposed sensor node. While water can be used as a source of energy in WSN, the amount of energy achievable could be also sufficient to power sensor nodes provided with different transmission modules (GSM, Bluetooth) and with power hungry sensors. Indeed, the solution has been customised on the ‘Bottini’ scenario, that is characterised by a very scant water flow: if employed in other scenarios with higher water flow levels, the proposed energy harvesting solution could be significantly more efficient.
While the ‘Bottini’ environment can be considered a worst case scenario, the system has been thought to be employed in all the situations where a continuous and constant water flow is available: these may include aqueducts, sewers, grottoes or mines. In these scenarios, the proposed energy harvesting solution could be employed to power not only the sensor node but also, for example, a LED lighting infrastructure.
Fig. 5 ‘Fontebranda’ test site with the sensor node
Fig. 6 Example of data packet with highlighted the sensor samples
Moreover, the solution could be adapted also to be employed in scenarios where there are not continuous and constant water flows: in this case, the energy harvesting system could be easily provided with a battery or any other sort of energy storage system. Then, the use of the stored power could be optimised by setting up a duty cycle managing solution, thus allowing the continuous and autonomous functioning of the monitoring system.
8 References
[1] Bachir, A., Heusse, M., Duda, A., et al.: ‘Preamble sampling MAC protocols with persistent receivers in wireless sensor networks’, IEEE Trans. Wirel. Commun., 2009, 8, (3), pp. 1091–1095
[2] Shanti, C., Sahoo, A.: ‘DGRAM: a Delay Guaranteed Routing and MAC Protocol for Wireless Sensor Networks’, IEEE Trans. Mob. Comput., 2010, 9, (10), pp. 1407–1423
[3] Wu, Y., Liu, W.: ‘Routing protocol based on genetic algorithm for energy harvesting-wireless sensor networks’, IET Wirel. Sens. Syst., 2013, 3, (2), pp. 112–118
[4] Yanyan, M., Dapeng, C.: ‘An energy-efficient routing protocol for WSN-based intelligent mining system’. 9th Int. Conf. on Computer Science and Education (ICCSE), 22–24 August 2014, pp. 973–976
[5] Vigorito, C.M., Deepak, G., Andrew, G.B.: ‘Adaptive control of duty cycling in energy-harvesting wireless sensor networks’. 2007 4th Annual IEEE Communications Society Conf. on Sensor, Mesh and Ad Hoc Communications and Networks, 2007
[6] Alippi, C., Anastasi, G., Di Francesco, M., et al.: ‘Energy management in wireless sensor networks with energy-hungry sensors’, IEEE Instrum. Meas. Mag., 2009, 12, (2), pp. 16–23
[7] Raghunathan, V., Ganeriwal, S., Srivastava, M.: ‘Emerging techniques for long lived wireless sensor networks’, IEEE Commun. Mag., 2006, 44, (4), pp. 108–114
[8] Chen, G.Z., Zhu, Z.C., Zhou, G.B., et al.: ‘Sensor deployment strategy for chain-type wireless underground mine sensor network’, J. China Univ. Min. Technol., 2008, 18, pp. 561–566
[9] Haifeng, J., Jiansheng, Q., Wei, P.: ‘Energy efficient sensor placement for tunnel wireless sensor network in underground mine’. Proc. of 2009 2nd Int. Conf. on Power Electronics and Intelligent Transportation System (PEITS), 19 and 20 December 2009, vol. 2, pp. 219–222
[10] Jain, P.C.: ‘Recent trends in energy harvesting for green wireless sensor networks’. Proc. of 2015 Int. Conf. on Signal Processing and Communication (ICSC), 16-18 March 2015, pp. 40–45
[11] Shaikh, F.K., Zeadally, S.: ‘Energy harvesting in wireless sensor networks: a comprehensive review’, Renew. Sustain. Energy Rev., 2016, 55, pp. 1041– 1054
[12] Ghosh, S., Ghosh, S.K., Chakrabarty, A.: ‘Design of RF energy harvesting system for wireless sensor node using circularly polarized monopole antenna: RF energy harvesting system for WSN node using circularly polarized antenna’. Proc. of 9th Int. Conf. on Industrial and Information Systems (ICIIS), 15-17 December 2014, pp. 1–6
[13] Panthongsy, P., Isarakorn, D., Sudhawiyangkul, T., et al.: ‘Piezoelectric energy harvesting from machine vibrations for wireless sensor system’. , 2015 12th Int. Conf. on Electrical Engineering/Electronics, Computer, Telecommunications and Information Technology (ECTI-CON), 24–27 June 2015, pp. 1–6
[14] Weimer, M.A., Zane, R.A.: ‘Remote area wind energy harvesting for low-power autonomous sensors’. Proc. of 37th IEEE Power Electronics Specialists Conf., 06, 18–22 June 2006, pp. 1–5
[15] Yin, W., Wenbo, L., Yongjun, Z.: ‘Design of a wind energy harvesting wireless sensor node’. Proc. of 2013 Int. Conf. on Information Science and Technology (ICIST), 23–25 March 2013, pp. 1494–1497
[16] Hengzhao, Y., Ying, Z.: ‘Modeling and analysis of a solar powered wireless sensor node’. 2012 Int. Conf. on Proc. of Computing, Networking and Communications (ICNC), January 30 2012–February 2 2012, pp. 970–974 [17] Yongtai, H., Lihui, L., Yanqiu, L.: ‘Design of solar photovoltaic micro-power
supply for application of wireless sensor nodes in complex illumination environments’, in IET IET Wirel. Sens. Syst., 2012, 2, (1), pp. 16–21 [18] Morais, R., Matos, S.G., Fernandes, M.A., et al.: ‘Sun, wind and water flow
as energy supply for small stationary data acquisition platforms’, Comput. Electron. Agric., 2008, 64, (2), pp. 120–132
[19] Mohamed, M.I., Wu, W.Y., Moniri, M.: ‘Power harvesting for smart sensor networks in monitoring water distribution system’. Proc. of 2011 IEEE Int. Conf. on Networking, Sensing and Control (ICNSC), 11–13 April 2011, pp. 393–398
[20] Andreadis, A., Pozzebon, A., Vaccarella, P.: ‘Watermill principle applied to energy harvesting for sensor nodes in underground environments’. Proc. of 2016 IEEE Int. Smart Cities Conf. (ISC2), September 2016, pp. 1–6 [21] Microchip Technology Inc.: ‘MCP9700 datasheet’, 2005–2016 [22] Honeywell: ‘HIH-5030–001 datasheet’, February 2012 [23] ON Semiconductor: ‘MC33269 T datasheet’, 2014