Value Creation
N. Castellano, R. Del Gobbo1Abstract When companies face with the effort to comply with customer needs,
their prior necessity is to acquire knowledge about the most sensitive variables that can condition customer satisfaction perceptions better than others. However the analysis of the firm-customer relationships seem to be very complex, given the high number of variables that potentially influence customer satisfaction, and hence the stability of their relationship with the company. Through a case study this paper describes a process to generate explicit knowledge about the main stra-tegic customer satisfaction’s value drivers. This process can be considered as a knowledge management tool to support the planning of specific actions about stra-tegic resources and competencies supposed to improve customer satisfaction. The paper discusses about contributions of the study, as well as managerial implica-tions, findings, limitaimplica-tions, and directions for further research.
1 Value creation and knowledge
Every company, in the perceiving of its competitive advantage, needs to acquire knowledge about its customers’ needs and expectations. However the high number of variables that potentially influence customer satisfaction, and hence the stability of their relationship with the firm, render analysis of the firm-customer relation-ship very complex. This is particularly true in business-to-business contexts [1, 2]. Thus, the generation of knowledge is the first step in a process that leads to the development of competencies necessary to successfully manage those key vari-ables.
This paper focuses attention on the processes and instruments able to allow the knowledge discovery directly from customers, about the key factors that mostly influence their satisfaction needs, expectations and perceptions, in a context of high complexity and multidimensional relations. The execution of the process in-volves suppliers and key customers in knowledge sharing and externalization, and
1 University of Macerata, Department of Economic and Financial Institutions,
facilitates the empowerment of collaborative relationships. Furthermore factor analysis and multiple regression are employed as exploratory knowledge discov-ery tools supporting company decision making.
The entire process is described, adopting a case study, from the information user point of view (the supplying company); the interestingness of the knowledge discovered can be valued in terms of unexpectedness and actionability [3].
The paper is structured as follows: after the design of a theoretical framework about knowledge creation processes, we proceed to describe the research method-ology and the data elaboration process. In the final conclusions, we discuss on the reliability of the methodology employed and evaluate implications both on theory and practice and the further research developments.
2 Studies on knowledge
Organizational learning theory focus on the coordination of individual knowl-edge and its transfer in the organizational structure in order to acquire new experi-ences and stimulate the development and changes in operational processes [4].
In this field of studies Nonaka [5] employed Polany’s classification of knowl-edge into tacit and explicit dimensions [6] to built its model of learning process. The creation of knowledge focuses on the conversion of tacit knowledge into ex-plicit and vice versa. This conversion process is known as SECI, the acronym of the four pre-defined knowledge creation alternatives: socialization, externaliza-tion, combinaexternaliza-tion, internalization.
Socialization relates to the transfer of tacit knowledge between individuals, ex-ternalization instead refers to the conversion of tacit knowledge into explicit, combination refers to elaboration and communication of new explicit knowledge from pre-existing explicit concepts , and finally, internalization concerns the con-version of explicit knowledge into tacit knowledge by individuals.
Particularly useful to the purpose of this paper are also the strategic compe-tencies theories that present strong links with the resource-based theory postulates. Strategic competencies focus on the creation of value for customers that allows to overcome the competitors performance [7]. The theories focus on how to create this particular knowledge and on the conditions that impact on its strategic weight [8]. The definition of the company strategy, in accordance with these models, is thus based on the search for, and exploitation of, these competencies [9].
3 Customer value literature
The concept of customer value employed in this paper is well represented by the definition of Desired Customer Value (what customers want to happen) [10]. Pre-vious studies analyzed this construct both in a B2C and B2B [11] environment.
These studies also employed factor analysis as confirmatory [12] or explora-tory [13] tool in order to discover general dimensions of value creation, useful to assess how customers view value creation in supplier relationship. One of the pur-poses pursued in this field of study is to provide valuable insights for modelling relationship value.
This paper is written adopting a different perspective: we focus on the rele-vance of the entire process employed to discover the most relevant customer satis-faction value drivers rather than on the discovered value dimension.
Moreover we employ the terms customer value and customer satisfaction as synonymous while in marketing literature they are often defined as different con-cepts [10].
4 Methodology and research objectives
The research described in the paper was developed through a case study [14, 15, 16] concerning one of the top three Italian kitchen furniture companies. The adop-tion of the case study is justified by at least two of the main attributes of this re-search approach: the study is explorative and gives the opportunity to study in a natural setting, with the possibility to describe the social phenomenon with an ho-listic view.
The research employed a combination of qualitative and quantitative research methodologies [17]. In the first stage of the research we conducted a focus group and in-depth interviews with a limited number of customers in order to identify the core variables which could allow successful relationships with customer.
The collected information allowed us to prepare an evaluation grid subse-quently submitted to a wider sample of customers in order to rank their value per-ceptions on a set of 21 variables. To rank the significance of each item we em-ployed a 10 level assessment scale. This scale is an adaptation of Cantril's methodology [18], which requires individuals to subjectively define high and low endpoints of a 10-point ladder. Several scientific studies [19], show that the reli-ability of the scales is monotonically dependent, in a positive way, to the number of levels, so the discrimination capability grows with the number of valuation po-sitions increases, even though beyond a certain limit. Moreover, an uneven num-ber of positions introduce a midpoint “neutrality” level, with the associated risk that the respondent won’t take an explicit positive or negative position,
compro-mising the evaluation of individual differences. This choice may represent a sig-nificant difference with previous similar studies [12, 13].
Starting out from the ranking on the attributes of the relation, through the fac-tor analysis the generic concept of “value perceptions” has been articulated em-ploying a limited number of dimensions or factors: the company knowledge about the value drivers on which management can act to strengthen the level of customer satisfaction. In addiction we also perform a multiple regression analysis on the to rank each discovered dimension, in terms of significance of the impact producible on the overall level of customer satisfaction. The results obtained can easily guide the management in the selection of the actions that will probably produce a greater impact.
5 Data acquisition and processing
The research was launched with the construction of the evaluation grid employed in the data collection to identify the customer’s value drivers. This step followed to a preliminary qualitative survey, divided into two phases: 1) a focus group with 6 participants (5 top managers and 1 moderator) to create a list of value drivers; 2) interviews with a judgmental sample of customers which have a long-term rela-tionship with the firm, in order to check, review and improve the items in the list.
Once the testing phase had ended, we proceeded with the definitive drawing up of the evaluation grid, composed of 21 items, employed to assess the customer value perceptions by mean of the 10-point scale.
The reference population from which we extracted the final sample was re-stricted to customers with an annual turnover greater than € 50.000, in order to ex-clude occasional transactions. The sample size was determined considering ac-ceptable a sampling error of 3.5% at a 95% level of confidence, taking into account costs and time of the survey. The final sample was composed of 294 units, selected through a stratified random sampling. We employed the level of turnover and the geographical area as stratification variables, because they are considered influential in customer value perceptions in the kitchen furniture market.
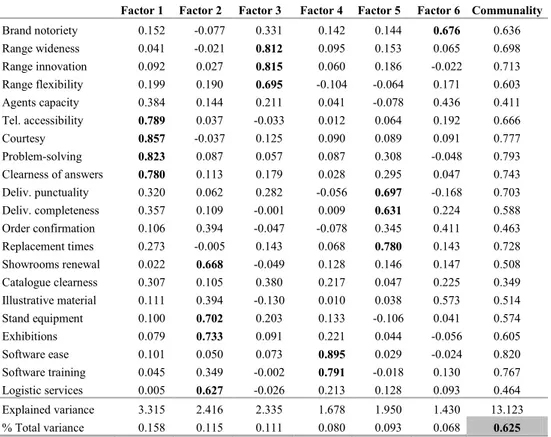
The factor analysis initially showed that the first 10 factors explained ap-proximately the 77% of the total variance, but we retained convenient to accept lower percentages of explained variance to facilitate the understanding of the re-sults employing a 6-factor model. As can be noted in Table 1, the matrix of rotated factors can to globally explain a portion of 62.50% of variance.
The final step of factor analysis consists in denominating each factor with a la-bel, which highlights the points of commonality between the variables most sig-nificantly correlated to it (see the factor loadings in bold in table 1).
The denomination of the selected factors represent the step of knowledge gen-eration in which it is possible to identify the value drivers able to impact on cus-tomer satisfaction and its related control levers. The denominations selected for
the 6 factors are the following: response capacity; sell-out support; product range; information systems; deliver efficiency; brand.
Table 1. Rotated matrix of factorial loadings
Factor 1 Factor 2 Factor 3 Factor 4 Factor 5 Factor 6 Communality
Brand notoriety 0.152 -0.077 0.331 0.142 0.144 0.676 0.636 Range wideness 0.041 -0.021 0.812 0.095 0.153 0.065 0.698 Range innovation 0.092 0.027 0.815 0.060 0.186 -0.022 0.713 Range flexibility 0.199 0.190 0.695 -0.104 -0.064 0.171 0.603 Agents capacity 0.384 0.144 0.211 0.041 -0.078 0.436 0.411 Tel. accessibility 0.789 0.037 -0.033 0.012 0.064 0.192 0.666 Courtesy 0.857 -0.037 0.125 0.090 0.089 0.091 0.777 Problem-solving 0.823 0.087 0.057 0.087 0.308 -0.048 0.793 Clearness of answers 0.780 0.113 0.179 0.028 0.295 0.047 0.743 Deliv. punctuality 0.320 0.062 0.282 -0.056 0.697 -0.168 0.703 Deliv. completeness 0.357 0.109 -0.001 0.009 0.631 0.224 0.588 Order confirmation 0.106 0.394 -0.047 -0.078 0.345 0.411 0.463 Replacement times 0.273 -0.005 0.143 0.068 0.780 0.143 0.728 Showrooms renewal 0.022 0.668 -0.049 0.128 0.146 0.147 0.508 Catalogue clearness 0.307 0.105 0.380 0.217 0.047 0.225 0.349 Illustrative material 0.111 0.394 -0.130 0.010 0.038 0.573 0.514 Stand equipment 0.100 0.702 0.203 0.133 -0.106 0.041 0.574 Exhibitions 0.079 0.733 0.091 0.221 0.044 -0.056 0.605 Software ease 0.101 0.050 0.073 0.895 0.029 -0.024 0.820 Software training 0.045 0.349 -0.002 0.791 -0.018 0.130 0.767 Logistic services 0.005 0.627 -0.026 0.213 0.128 0.093 0.464 Explained variance 3.315 2.416 2.335 1.678 1.950 1.430 13.123 % Total variance 0.158 0.115 0.111 0.080 0.093 0.068 0.625
6 Correlation between factors and customer satisfaction
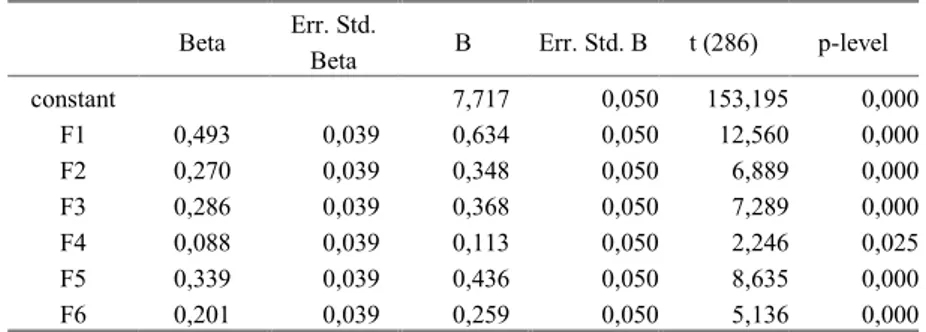
We also try to assess the significance of the relationship between the extracted factors and the overall level of customer satisfaction performing a multiple regres-sion analysis. If the principal components or the extracted factors are interpretable and there are near-dependencies among the original independent variables (multi-collinearity) there are considerable advantages to be gained. Table 2 shows the re-gression parameters and the associated statistics.
The regression coefficients measure the strength and the direction of the rela-tionship between each factor and the dependent variable (all other regressors being constant). The results shows that factor 1 (response capacity) is the variable with
the greatest impact on satisfaction, followed by factor 5 (deliver efficiency). In-stead factor 4 (information system), doesn’t seem to produce significant effects on overall satisfaction, because it is associated to the lowest beta value.
Table 2. Regression coefficients and associated statistics
Beta Err. Std.
Beta B Err. Std. B t (286) p-level constant 7,717 0,050 153,195 0,000 F1 0,493 0,039 0,634 0,050 12,560 0,000 F2 0,270 0,039 0,348 0,050 6,889 0,000 F3 0,286 0,039 0,368 0,050 7,289 0,000 F4 0,088 0,039 0,113 0,050 2,246 0,025 F5 0,339 0,039 0,436 0,050 8,635 0,000 F6 0,201 0,039 0,259 0,050 5,136 0,000
The overall goodness of fit of the regression model can be evaluated through an F-test in the format of analysis of variance (ANOVA). The ANOVA confirmed that the extracted factors, taken together, are significantly associated with the level of satisfaction. The value of multiple correlation coefficient, R (0,748), and the value of R-squared (0,560) indicate that the regression model fits the data satisfac-torily, taking into account the variability of the phenomenon.
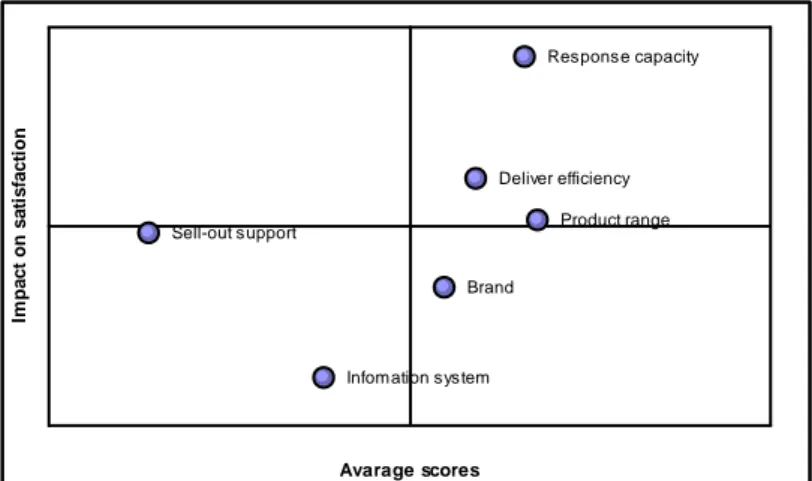
To identify the strategic variables on which to act to create value, we can com-bine the regression coefficients and the average scores of the extracted factors: in this way, it is possible to categorize and display the drivers of satisfaction using a strategic matrix like the one in Figure 1.
The horizontal axis of the matrix represents the average scores of the extracted factors, while the vertical axis reflects their impact on customer satisfaction. The matrix identifies four categories of satisfaction drivers with different managerial implications. The aspects to improve first are those in the top-left quadrant of the matrix, where impact is high and customer assessment is low. Improvements in these areas will effectively focus on resources with the greatest impact on satisfac-tion. The items in the top-right quadrant, where impact and performance are both high, represent the firm’s core competencies and competitive advantage. It is es-sential to reach or maintain high performance on these drivers. The implications for the opposite quadrant, where impact is low and assessment is low, are also clear. More interesting is the low impact-high performance category. This cate-gory may contain drivers of satisfaction that customers consider to be basic and necessary. Although such drivers are important in an absolute sense, they have lit-tle impact on satisfaction because there is likely to be litlit-tle variance in their per-formance across competitors. In our case, we found that “Sell-out support” has a significant impact on the satisfaction but its assessment is lower than the mean. Clearly, successful intervention on this item would have significant impact.
Response capacity
Sell-out support Product range
Infomation system Deliver efficiency Brand Avarage scores Im pa c t on s a ti s fa c ti on
Fig. 1. The satisfaction matrix
7 Concluding remarks
In conclusion, we can affirm that factor analysis allows to trace a path that leads towards specific forms of classification of variables that is often not possible in the initial research stages. While in an a priori classification (that is, based on an initial hypothesis) the employed classification model could not necessarily bring to great contributions and insight, in the case of an a posteriori classification (i.e. as final result of a factor analysis) is possible to gain several indications.
The classification of the semantic features represented by each related variable, indirectly contribute to improvements in the comprehension of the general phe-nomenon. It is therefore clear that factor analysis, as part of the broader process here described, can have a substantial impact on the understanding and revising of concepts: as result of the analysis, we should obtain more clearness, synthesis and brighter classification. Regression analysis as well can be employed to rank the significance of each facets of the classification employed.
As limitation we should underline that factor analysis is based on empirical, ra-ther than mathematical, interpretation of the results; moreover the approximations necessary during its application can render the results questionable. However, we believe that this vagueness may not necessarily be a limitation of this instrument, especially when applied to management disciplines, and particularly as support of knowledge creation processes. In fact, in this specific topic we think more suitable a flexible, even if subjective, solution, rather than a mechanical interpretative me-chanism which may lead to results not coherent with the context of analysis. In fact, in any cases, the validation of the results own to users who express a judge of reasonableness in the light of their tacit knowledge. For this reason not necessarily
the results obtained with more sophisticated and mechanical procedures would be retained more reliable.
The methodology proposed can be developed in further directions. A first po-tential improvement could be to analyze both the dynamic change of customer sa-tisfaction perception [10], and the impact produced from management actions planned on the basis of knowledge generated. In the field of knowledge discovery is possible to work on the measures of interestingness of patterns discovered [3]. Thereafter, over time, should be possible to assess the impacts of knowledge dis-covery on both customer satisfaction and market profitability [20].
References
1. Bennett, R. and Gabriel, H., (1999), Organisational Factors and Knowledge Management within Large Marketing Departments: An Empirical Study, Journal of Knowledge Manage-ment, 3, pp.212-25
2. Fiocca R., Snehota I., Tunisini A., (2003), Business marketing, McGraw Hill, Milano 3. Silberschatz A., Tuzhilin A., (1996), What makes patterns interesting in knowledge
discov-ery systems, IEEE Trans. Knowledge Data Eng., vol. 8, pp. 970–974, 1996.
4. Argyris C., Schön D., (1978), Organizational learning. A theory of action perspective, Read-ing, MA: Addison-Wesley
5. Nonaka I., (1994), A Dynamic Theory of Organizational Knowledge Creation, Organization Science, (5:1), February, pp. 14-37
6. Polanyi M., (1967), The Tacit Dimension, Routledge and Keoan Paul, London 7. Quagli A., (2001), Knowledge Management, Egea, Milano
8. Lev B., (2001), Intangibles, The Brookings Institution
9. Itami H., (1987), Mobilizing invisible assets, Harvard Business School Press, Boston 10. Graf, A., Maas, P., (2007), Customer value from a customer perspective: a comprehensive
review, Journal für Betriebswirtschaft. 58 (1), pp.1–20
11. Ulaga W., (2003), Capturing value creation in business relationships: A customer perspec-tive. Industrial Marketing Management, Vol. 32, pp. 677-693.
12. Huber F, Herrmann A, Henneberg S.C., (2007), Measuring customer value in services trans-actions, scale development, validation and cross-cultural comparison, International Journal of Consumer Studies, Vol. 31, 554-564
13. Sweeney J.C., Soutar G.N., (2001), Consumer perceived value: The development of a multi-ple item scale, Journal of Retailing Vol. 77, 203–220
14. Stake R.E., (1995), The Art of Case Study Research, Sage, London
15. Mari C., (1994), Metodi qualitativi di ricerca. I casi Aziendali, Giappichelli Editore, Torino 16. Yin R.K., (1989), Case Study Research Design and Methods, Sage, London
17. Miles M. B., Huberman A. M., (1994), Qualitative data analysis: an expandend sourcebook, Sage, Thousand Oaks
18. Cantril H., (1965), The pattern of human concern. Rutgers University Press, New Bruns-wick, New Jersey, USA
19. Maggino F., Schifini D’Andrea S., (2003), Different scales for different survey methods: validation in measuring quality of University Life, in How to measure quality of life in di-verse populations, International Society for Quality of Life Studies, Kluwer Academic Pub-lisher, Dordrecht
20 Ulaga W., (2001), Customer value in business markets. An agenda for inquiry, Industrial Marketing Management, vol. 30, pp. 315-319