Full Terms & Conditions of access and use can be found at
http://www.tandfonline.com/action/journalInformation?journalCode=tran20
Download by: [Centre 2020 Medias], [Orazio Pellegrino] Date: 29 June 2016, At: 00:59
Transport
ISSN: 1648-4142 (Print) 1648-3480 (Online) Journal homepage: http://www.tandfonline.com/loi/tran20
A procedure for evaluating the influence of road
context on drivers’ visual behaviour
Nicola Bongiorno, Gaetano Bosurgi & Orazio Pellegrino
To cite this article: Nicola Bongiorno, Gaetano Bosurgi & Orazio Pellegrino (2016) A procedure for evaluating the influence of road context on drivers’ visual behaviour, Transport, 31:2, 233-241
To link to this article: http://dx.doi.org/10.3846/16484142.2016.1188852
Published online: 28 Jun 2016.
Submit your article to this journal
View related articles
Special Issue on the Impact of Vehicle Movement on Exploitation Parameters of Roads and Runways
2016 Volume 31(2): 233–241
doi:10.3846/16484142.2016.1188852
Corresponding author: Orazio Pellegrino E-mail: [email protected]
Copyright © 2016 Vilnius Gediminas Technical University (VGTU) Press http://www.tandfonline.com/TRAN
A PROCEDURE FOR EVALUATING THE INFLUENCE OF ROAD CONTEXT
ON DRIVERS’ VISUAL BEHAVIOUR
Nicola Bongiorno, Gaetano Bosurgi, Orazio Pellegrino
Dept of Civil Engineering, University of Messina, Italy
Submitted 1 December 2014; resubmitted 31 March 2015, 2 July 2015; accepted 8 July 2015 Abstract. In this paper, we investigated drivers’ visual behaviour while travelling a road regularly opened to traffic in order to evaluate the effectiveness of the traditional scientific models and propose, at the same time, further measures useful for understanding the complex phenomenon. As is known, drivers acquire the necessary information for know-ing the road geometry by visually detectknow-ing certain areas of the surroundknow-ing context. Some models in the literature have shown in a simple and convincing way these mechanisms, but they are valid only with specific assumptions, often very restrictive, such as a two-lane road, horizontal sign clearly visible and no interaction with other vehicles. For this reason, in this study we wanted to investigate different conditions, by estimating the visual strategy of some regular drivers on a three-lane road in presence of other vehicles. The visual behaviour was surveyed with the Tobii Glasses
Eye Tracker and the resulting raw data were further manipulated by us to extract more useful information for our
purposes. In particular, we quantified the driver’s dedicated attention to the various elements present inside the envi-ronmental context, both static (road edges, road signs, dashboard, etc.) and dynamic (other vehicles), meaning by this term those that could potentially collide with the trajectories of our vehicle. The achieved results, highlighting the lim-its of validity of some recent studies, contain some proposed indexes useful to give a better understanding of the visual behaviour in order to detect any eventual weakness of the road.
Keywords: highway; information infrastructure; performance evaluation; advanced technologies; analysis; visibility.
Introduction
The environmental context exerts a strong influence on driving behaviour, as it contains information that will be acquired through the sense of sight and processed by the driver’s cognitive system in the most appropriate manner, according to its capacity and its psycho-physical state (Shinoda et al. 2001; Minin et al. 2012). However, it is very difficult to recognize in absolute terms if such in-formation is quantitatively sufficient for understanding road geometry in an optimal way (Martens 2011). There are, in fact, some elements, which induce great uncer-tainty, such as the different types of users (differentiated by age, disease, experience, skills, etc.), visibility condi-tions, traffic flows, the presence of human activities on the edge, etc. However, in recent years, some variables, as drivers’ age, have been studied in great detail and in several analytical models their variability is contained in limit sufficiently tight.
For these reasons, a road could be considered dan-gerous only during certain hours of the day, or adverse weather conditions or for particular kind of drivers (Stinchcombe, Gagnon 2010).
The influence of the environment on driving be-haviour is, therefore, very complex to be determined so that some researchers closest to the psychological sci-ences have preferred to address the problem without particular analytical tools but through the use of detailed questionnaires tending to deepen the psycho physiologi-cal drivers’ characteristics (Konstantopoulos, Crundall 2008; Dijksterhuis et al. 2011). However, these surveys never allow rigorous quantification and the analyst’s subjective contribution in the interpretation of results remains predominant.
Empirical or analytics models with a certain general validity are few and, among them, one of the most popu-lar was proposed by Donges (1978) and later developed by other authors. It is appropriate to point out that the model regarding the curve negotiating of an undisturbed vehicle is representative of a very particular condition and could not be applied in general cases where other conditions affect the driver’s activity.
In simplistic environmental contexts, reproduced in the laboratory using driving simulators, these re-searchers recognized a mechanism of visual behaviour,
234 N. Bongiorno et al. Procedure for evaluating the influence of road context on drivers’ visual behaviour
which was confirmed later by on road tests. This model is constituted by a first component, called ‘feedforward’, with which driver foresees in advance the curve geom-etry when it appears from the previous tangent and ac-cordingly adapt his speed and trajectory. Subsequently, when he is inside of the curve, in the case in which his evaluation was wrong, corrects the position within the cross-section through precise movements of the steering wheel (feedback mechanism).
Regarding the single vehicle, Land (1998, 2006), Land and Horwood (1998), Land and Tatler (2001) showed that the driver addresses his gaze to points that move less in the visual field. This zone is located at the center at the vanishing point when the user travel along a straight stretch or coincides with the tangent to the in-ner edge of the curve. These researchers also evaluated by means of testing in a simulated environment which elements of the context were more important to acquire the right information. The conclusions indicated that the full view of the edges is sufficient to interpret well the geometry of the road. In addition to this, if it is perceiva-ble only the far part of the road, drivers match curvature well, but their lane keeping performance is poor. On the contrary, when only the near part is visible, lane keeping is better, but steering becomes unstable.
In recent years, we have seen massive introduction of high-tech equipment in our vehicles. The purpose is to make a more comfortable travel and increase the road safety. However, these devices (cell phone, on-board computer and navigator) require the driver’s cognitive intervention so that he spends a part of his energy in ac-tivities that can distract from the main task. It is obvious that the simple models based on the vision of the edges are no longer sufficient to explain the driver’s strategy that, therefore, must be detected with more suitable methodologies than previously done.
In this regard, recently modern eye-tracking sys-tems mounted on glasses assumed an important role, as eye movements are strongly related to the data acqui-sition way and represent a measure of the distribution of attention in the environment perceived by the driver. These tools commonly used to assess the desirability of a product within a supermarket or the ease of use of particular software, can detect the visual strategies dur-ing the travel (Di Stasi et al. 2012).
1. Aim of the Research
The purpose of engineers is to design sufficiently safe road. In the past, relationships between isolated vehi-cle and geometry were adequately studied (Owsley, McGwin 2010) but without investigating the role and importance of the simultaneous presence of other active and passive elements, such vehicles of all types, weak class of drivers, role of road sign, visibility conditions, human activities on the edges, etc.
In previous experiences (Bosurgi et al. 2010, 2013a, 2013b; Pellegrino 2009, 2011, 2012a, 2012b), we already verified a close correlation between road geometry, en-vironment and drivers’ behaviour.
The use of an eye tracker has allowed us to obtain a large amount of raw data with greater accuracy and frequency (compared to past experiences) subsequently conveniently filtered for obtaining useful measures to quantify the visual strategy. In this way, we could assign a hierarchy to the objects encountered during the travel and recognize the possible validity of the main known models.
2. Method
Our goal is to suggest some procedures, effective in any context and in any class of road users, based on the sur-vey of eye movements and able to identify the real visual strategies. This phase, purely exploratory, does not re-quire a statistically significant sample of users, because we do not claim to propose a predictive model but only to investigate which visual mechanisms are established in realistic environmental conditions.
Eye movements were recorded using a Tobii Glasses
Eye TrackerÒ, especially suitable for its lightweight (75
grams) and versatility to be used while driving. On the glasses there are two mini cameras that can record video clips at a frequency of 30 Hz. The first detects the re-flection of an infrared illuminator pointing toward the right pupil and allows deriving its movement by means of image analysis techniques. The second camera looks on the front as well as the user perceives the scene, with a dimension of the view of 56 degrees horizontally and 44 degrees vertically. A portable controller allows, by means of special software, to infer fixations and saccades compared to the eye-tracker reference system. As it is known, a fixation is the pause of the eye movement on a specific area of the visual field and saccades are the rapid movements between fixations. Obviously, an eye tracker provides an indication of the point at which the visual activity is concentrated but it is not able to determine the importance of the peripheral areas acquired, in any case, by the driver.
Of course, every time that the glasses were worn by a new user, the calibration procedure had to be repeated.
Before beginning road trials, the Authors selected 10 potential drivers who had completed a detailed ques-tionnaire (French et al. 1993). This group was made up of males between the ages of 25 and 28 with 7–10 years’ driving experience, all habitual users of the road under examination. The questionnaire also required volunteers to provide information regarding:
– any accidents they had had; – presumed driving ability; – propensity for risk-taking;
– most feared traffic scenario (dark, rain, heavy traffic, winding roads, tunnels, etc.);
– any sight impairment (and severity of); – familiarity with the stretch of road.
In order to maximize homogeneity within the group, we decided to exclude 3 respondents who re-ported major sight impairment or a high propensity for risk-taking.
The experimentation was carried out on an ordi-nary vehicle (Fiat 500L), in which the only equipment
in addition to the eye tracker was a notebook connected to the electronic control unit of the car by means of the On Board Diagnostic (OBD) port to know the value of some data during the travel, such as GPS position, speed and acceleration.
At this stage, we preferred not to include addition-al sensors for biomedicaddition-al monitoring of human factors involved while driving so as not to disturb the driver’s activity.
The trials took place on a rural road over a distance of about 5 km with uniform track in terms of cross section and construction. The cross section comprises two sepa-rate carriageways with three lanes each 3 m in width and the central reservation is planted over and varies in width from 2.5 m to 4.00 m with some metal crash barriers.
The trials were carried out on the carriageway near-est to the hills.
As already mentioned, these drivers all belonged to the same class as regards age, sex, driving experience, proneness to accidents; most feared driving scenarios, familiarity with the stretch of road. The trial took place under normal traffic conditions and our vehicle was also occupied by an operator responsible for making sure the computer and tracking equipment worked properly.
It should be observed that the mere observation of the eye movements trend in time domain was not signif-icant for our purposes. There was a need, therefore, for further processing the raw data correlating them with the variables coming from the electronic control unit of our car. For example, when a new element appeared within the visual field, our instrumentation recorded:
– a sudden movement of the X or Y coordinate of the eye in a short time;
– a subsequent fixation time greater respect to a periodic inspection;
– a significant number of fixations concentrated in a small space;
– change in speed or trajectory.
We felt, therefore, that the knowledge of eye coor-dinates and the identification of fixations and saccades had to be complemented by additional indices to charac-terize the visual strategy adopted by the user. In this ex-periment, we turned our attention to the general driver’s behaviour, such as the examination of dashboard and rear-view mirrors, any observation of signs and edges, the determination of important objects appeared in the visual field.
2.1. Detection of Dashboard and Rear-View Mirrors The user performs a regular periodic review of the in-struments on board to know the status of vehicle. The display of the dashboard implies a modest care so to allow further activities. The mirrors, however, are ob-served much more frequently as driver believes to be slower than other vehicles with consequent potential and probable interaction with them.
2.2. Observance of Traffic Signs and Edges
The vision of the static elements and the road signs are strongly related to the sample of drivers. If these do not know the alignment in a two-lane road, they will be very constrained by the information coming from the edges and signs. On the contrary, a comfortable road (in terms of cross section and radii, for example) will not cause special problems except those arising from traffic flow. 2.3. Importance Given by the Driver to Objects Driver does not assign the same importance to all the elements of the road environment but pays more atten-tion to those that have a greater chance of collision (and where there are consequences more severe). From this point of view, a vehicle crossing the road is more dan-gerous than a passing manoeuvre. In addition, an object cannot be considered a priori little or very influential on the visual strategy without considering the particular analysed scenario. For example, a vehicle to be passed can be considered with more attention if there are no other critical elements to be evaluated but is ignored if another vehicle may collide with its trajectory. In the present study, we wanted to correlate the level of atten-tion to the value of the following variables:
– high fixation time; – magnitude of saccades; – change of vehicle speed; – change of vehicle trajectory.
For static and dynamic elements, we considered as appropriate to attribute the term ‘high’ at the fixation time greater than or equal to 80% of the total, in harmo-ny with the Land’s suggestion (Land 1998). The time in-terval begins when the object becomes part of the visual field, until its final exit. Strictly speaking, the dynamic elements should have different thresholds since, if their motion is opposed to our vehicle, the observation time is extremely small while, on the contrary, in the case of car following this interval can be very high.
Concerning the amount of eye movements (Di Stasi
et al. 2012), saccades can be classified as very large
val-Fig. 1. Flow chart regarding the methodology applied in this research
Observation time of the dashborad and rear mirrors
Data acquisition Processing
Results
Observation time of the main objects in the context Importance of the objects
Drivers' visual strategy on curves Car telemetry by OBD
Accelerometer GPS Eye tracker
Speed and acceleration Geo-reference on the road
Fixations and saccades Eye movements
236 N. Bongiorno et al. Procedure for evaluating the influence of road context on drivers’ visual behaviour
ues when they are more than 300 pixels, while persistent fixations cause saccades of about 70 pixels. Generally, there could not be a null value of saccades, as the human eye needs for activity in order to maintain the image on the retina.
As regards the step ‘change of vehicle speed’, we as-sign a as-significant variation to the vehicle speed when, in the time interval in which the user has examined the ele-ment, the speed decreases at least of 10 km/h (D’Andrea, Pellegrino 2012).
The point ‘change of vehicle trajectory’ has positiv-ity only when the vehicle changes its lane because of the view of a disturbing element (Ailon et al. 2005).
Naturally, the positivity of only one condition con-fers a small relevance to the investigated element while, on the contrary, the occurrence of all of the above four con-ditions would highlight its role within the road context. 3. Results
3.1. Match of Traditional Vision Models
As regards the verification of the known scientific mod-els during the experimentation, we detected only the presence of the anticipatory mechanism without the feedback component inside the curve, probably because users knew the road characteristics which was, in any case, easily understandable by virtue of the large radii and cross-section and, for these reasons has pardoned any errors in the positioning of the vehicle.
The anticipatory component described by Donges (1978), that is the feedforward mechanism, according to which the estimation of the curvature occurs through the fixation of the tangent point on the inner edge, were regularly found in numerous bends. In Table 1 we pro-vide some of these data with the following symbols re-ported in the columns:
– Δt is the duration of fixation on the given ele-ment;
– distance is the distance travelled in time Δt dur-ing which the user look at the tangent point; – speed is the speed of our vehicle in the moment
in which the user has started to look the tangent point;
– J is the deviation angle between the direction of motion and the point of tangency at the time when the user has started to look the tangent point.
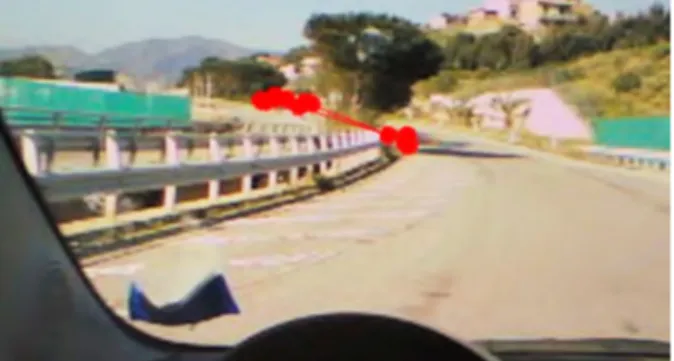
The Figs 2–5 show very clearly that the driver di-rects his gaze toward the inner edge of the curve, regard-less of the presence of more or regard-less visible markings. In these cases, the object more evident was the metal bar-rier. Even when thick vegetation has occluded that point (Figs 3 and 5), the driver has always focused his gaze to the edge, also to maximize the free sight distance.
The fixation times may seem very high but this problem is due to the excellent sight distance of the ex-amined road. For the same reason, it can be noted the speed does not influence the feed forward mechanism but, rather, drivers tend to fix the tangent point as soon as possible.
Table 1. Some experimental data regarding the visual anticipatory mechanism
Bend No Δt [s] Distance [m] Speed [km/h] J [°]
1 5.8 81 49 3
2 5.4 95 63 7
3 6.7 142 76 3
4 3.74 80 77 2
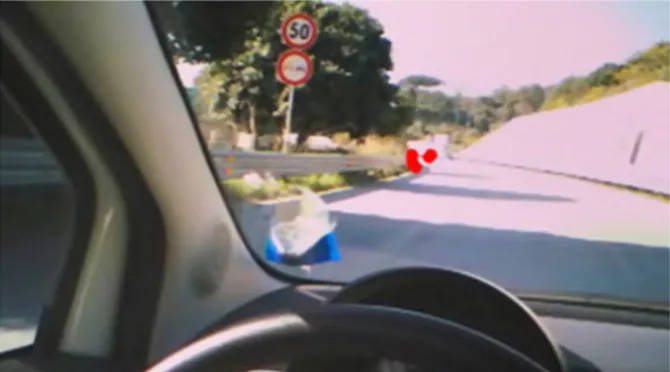
Other elements, in theory, considered fundamen-tal by designers, have been neglected, either because the drivers already knew the road geometry or did not need to acquire more information but also because other ele-ments came suddenly in the visual field. The example in Fig. 6 illustrates precisely this case: a vehicle is crossing the road, creating a possible point of conflict. In this case, there is a concentration of fixations only on this
Fig. 2. The driver looks very precisely to the tangent point of the curve
Fig. 3. Some trees impede the vision of the internal edge, which, however, is always searched by the driver
Fig. 4. Another example of fixation of the internal edge, according to the Donges’s anticipatory mechanism
vehicle, with the result to neglect all other information present in the environment (signs, edges, other vehicles, intersection on the right).
Sometimes the dynamic element has been judged less important than the fixed ‘optical guides’, like edges. In the case shown in Figs 7 and 8, our driver was passed by another vehicle, but since this did not represent any cause for concern, the driver continued to gather infor-mation along the internal edge of the curve. The sensa-tion of danger is also related to the time in which the object resides in his visual field. When the differences in speed between the two vehicles are considerable, this time is short and hardly there will be a potential conflict.
A similar situation was observed in the case of pass manoeuvre performed by our driver. In this case, however, the driver tends to verify that the available space on the left is sufficient to complete his action in a safety way (Fig. 9). Other similar situations are shown in Figs 10 and 11. In the first one a stationary vehicle at the roadside was interpreted as a static object and, therefore, of no importance for his travel. The Fig. 11, however, shows that the driver focused on the elements that assume a greater danger: two vehicles side by side with a similar speed are potentially more dangerous than another vehicle that our driver is passing on the right and that will be out very soon by his visual field.
This brief summary showed that when the vehicle is isolated, the Donges (1978) and Land (1998) models are matched very well. However, when the environment is more complex, as often happens in reality, these mod-els are no longer sufficient to predict the reaction of the driver’s vision and strategy.
Fig. 5. The driver not only sets the tangent point of the curve but also the maximum sight distance. In this case, has tried
to overcome the obstacle of the trees
Fig. 6. Fixations are concentrated on the vehicle that is going to cross the road section
Fig. 7. Fixations are concentrated on the inner edge even if there is a passing vehicle
Fig. 8. Fixations are concentrated at the edge and the vehicle, which carried the overtaking, is not taken into account
by the driver also because is rapidly disappearing from the visual field
Fig. 9. Fixations in this case tend to check the available space to make a safe pass
Fig. 10. A stationary vehicle on the right is considered as a mere static object
238 N. Bongiorno et al. Procedure for evaluating the influence of road context on drivers’ visual behaviour
3.2. Detection of the Instrument Panel and Mirrors We noticed that drivers pointed out with a certain pe-riodicity the instruments inside the vehicle. This event happened when there were no potential hazards or spe-cific commitments. The detection time for all tests was substantially equal and equal to less than 1 s (Table 2). This means that a ‘suspension’ of 1 s of attention do not cause problems to the natural acquisition of informa-tion from the road, at least in the condiinforma-tion of normal workloads.
This time has been surprisingly constant in all the surveys carried out by us as it varies between 0.858 s and 0.979 s. This means that a task performed in automa-ticity requires an extremely short time, which does not influence the driving activity.
The acquisition time by the rear-view mirrors was, on the contrary, very variable and depended on the na-ture of the detected objects. In fact, if these concern or interest of the driver, the detection time increased con-siderably. In Table 3 we reported only some of the results in order to highlight the great dispersion of the detected values.
This time is extremely variable. Excluding the first case, all the others have fixations over the second and, therefore, this means, that such activity is not performed by the driver in an automatic way. The more relevant times (over 2.5 s) express an accurate control of the situ-ation by the driver that could also highlight potential safety problems.
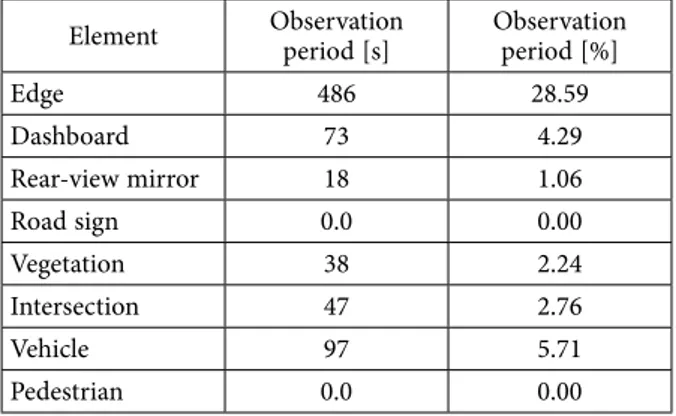
In the Table 4, there are the overall fixation times found in some characteristic elements of the road envi-ronment. It can be noted a clear prevalence of the obser-vation time dedicated to the edges and, to a lesser extent, to the dashboard and to other vehicles. No importance was given to the road signs. These results depended on traffic, type of road and on the drivers who made the trials.
This result confirms that about in one third of the road, the driver fixes his gaze on the edges of the curves. The low percentage of the other objects (for example, vehicles 5.71%) is due not only to the lesser importance given to them but also by a lower presence of these ob-jects within the visual field.
Table 2. Observation time of the dashboard inside the vehicle
No Δt [s] 1 0.962 2 0.858 3 0.979 4 0.893 5 0.892 6 0.893 7 0.961 8 0.893 9 0.927 10 0.928 11 0.892 12 0.917
Table 3. Observation time of the rear mirrors inside the vehicle
No Δt [s] 1 0.067 2 2.570 3 1.540 4 1.099 5 2.868
Table 4. Observation periods of the main objects inside the road context respect to the total time of 170 s (these results
represent the mean values of all the trials) Element Observation period [s] Observation period [%]
Edge 486 28.59 Dashboard 73 4.29 Rear-view mirror 18 1.06 Road sign 0.0 0.00 Vegetation 38 2.24 Intersection 47 2.76 Vehicle 97 5.71 Pedestrian 0.0 0.00
3.3. Observance of Traffic Signs and Eyelashes There was no visual activity towards the road signs. The acquisition of information on the road geometry took place exclusively through the edges, coincident with the metal barrier or the road markings.
The Fig. 1 is emblematic in this regard: the user turns his attention to the edge, partly because this maxi-mizes his visibility distance while the ‘speed limit’ and ‘no passing’ signals are not taken into account.
3.4. Importance Given by the Driver to Objects As mentioned in the Method section, the importance of the elements (static and dynamic) present within the visual field was estimated by the detection of the follow-ing factors (Table 5):
Fig. 11. The two vehicles in front attract the driver’s attention as they represent a greater danger respect to the near vehicle
on the right
– high fixation time; – magnitude of saccades; – change of vehicle speed; – change of vehicle trajectory.
The meaning of the term ‘high’, referred to the fixa-tion time, has already been discussed previously.
With regard to the quantification of the saccades, in Table 5 we separated into two different columns the in-formation about the length in pixels of saccades (called ‘total saccades’) and the relationship between this length and the time of observation of the element (called ‘nor-malized saccades’). The latter index is a sort of normali-zation time, necessary to take into account that some el-ements are displayed for much longer time than others. The examination of the Table 5 allows deducing that the normalized saccades represent a kind of visual speed. High values of the gaze on the dashboard (from 333 to 409 pixels/s) mean that this operation is carried out with automaticity and, therefore, very quickly by the driver. On the contrary, the gaze on edges needs a cer-tain effort to interpret the curve and, for this reason, the normalized saccades are lower (up to 68 pixels/s in the case of the tunnel).
Therefore, a priori, it is not right to give more importance to an element that was focused for a long time, but it is also appropriate to evaluate the dynamic response of the vehicle in terms of trajectory and decel-eration.
4. Discussion
This experimentation has, first-of-all, allowed to recog-nize the effectiveness of some existent models of vision. For example, the search in advance of the tangent point of the curve was found many times, especially when the vehicle was isolated. We had no evidence, however, of the feedback mechanism with which the user corrects his trajectory or his speed when he is already located into the curve. Such behaviour does not depend on the small number of participants in our trials but on the knowledge of the characteristics of the road, considered ‘easy’ by the drivers (three lanes in each direction, very large radii). Therefore, it was not necessary to acquire further information inside the curve.
The carried out surveys in presence of traffic al-tered the visual behaviour respect to the ordinary
mod-els described in the scientific literature but allowed us to inference some interesting deductions.
First-of-all, it is not always true that driving style and visual behaviour are strongly dependent on the presence of other vehicles. The driver, in fact, gives them importance if these can potentially collide with his ve-hicle or, in other words, if stay within his field of view a certain time interval. For example, a passing immediate-ly executed has not caused almost never a concentration of fixations. In these cases, the reference points continue to be the margin lines of the road and, in particular, the tangent point of the curve, because the most stable inside the visual field. In this regard, there is also a sec-ond reason: this point maximizes the sight distance and influences the user’s speed.
We had, in essence, the confirmation that the mar-gin lines represent elements that actually guide the driv-er. However, there are other elements to be taken into account in a realistic way to verify the safety of the road. Some of these, such as road signs, should be, theoretical-ly, a source of additional knowledge for the user but we found that, for opposite reasons, they were not observed. In fact, the ‘ordinary’ signs, as a speed limit, is neglected in sections in which the workload is very low because the driver has already acquired all the geometry of the road in a useful time. In contrast, when the information is too much, the signs are the first to be discarded to accommodate the workload within an acceptable range.
Other objects inside the context represent at least a visual disturbance or, in extreme cases, a source of potential danger. For this reason, we have proposed a policy that classify them in order of importance. It is not sufficient, in fact, select the type of the element to assign it a ranking, since it is necessary verify other charac-teristics, such as the persistence time within the visual field, its static or dynamic nature and, in this case, the trajectory and the relative speed respect to our vehicle. In general, a passing manoeuvre does not induce any change in the visual strategy when the speed difference between the two vehicles is relevant. On the contrary, a vehicle that want to cross an intersection is looked at very carefully since it could cause a potential conflict.
With regard to the objects inside the vehicle or surveyed with the rear-view mirrors, it is opportune to make a clarification: the gaze of the driver to the in-struments on board does not involve any disturbance or Table 5. Criteria to highlight importance of the elements inside the visual field
No. Element Fixation time [s] Total saccades [pixels] Normalized saccades [pixels/s] Δv [km/h] Δs [m]
1 Dashboard 0.9 300 333 3 0.2 2 Dashboard 0.9 345 383 5 0.5 3 Dashboard 0.9 368 409 1 0.7 4 Tunnel 13.9 950 68 3 0.5 5 Van 1.8 226 126 6 0.4 6 Car following 6 668 111 4 0.3 7 Edge 5.8 687 118 2 0.4 8 Edge 11.3 1258 111 20 3.2
240 N. Bongiorno et al. Procedure for evaluating the influence of road context on drivers’ visual behaviour
loss of information, since the detection time is always very short (less 1 s). The time spent on the mirrors, on the contrary, is highly variable and related to the flow of traffic and the speed between the vehicles. If there are these two conditions (significant flow of traffic at high relative speed), fixation time is significant and this will have consequences on the amount of data acquired from the remaining part of the context, with possible repercussions on the quality of the driving manoeuvre.
With our equipment we could ascertain only the main point on which was focused the driver’s attention. It remains uncertain, therefore, its ability to process par-allel information relating to objects more or less close identified with peripheral vision, which, as is known, is greater in people with a long experience and driving skills. Conclusions
In this paper, we have investigated the visual strategy of a small number of users, on a road regularly opened to traffic. The main tool used by us was an eye tracker mounted on glasses (Tobii Glasses Eye TrackerÒ) so as to be minimally invasive to the driver.
The experimentation allowed us to recognize fur-ther visual behaviour, as well as the simplest ones de-scribed in the well-known scientific models.
The presence of other vehicles, often actually in-terfering with our vehicle, vegetation that obstructs the vision of the edges, road signs, existence of accesses or intersections have substantially altered the ordinary mechanisms that develop when the vehicle is isolated. Their influence must therefore be considered to assess more carefully the risk of the road in particular scenar-ios and environmental conditions.
Through the application of the eye tracker, we as-certained that the drivers concentrates their attention also towards the interior of the vehicle. The acquisition of the information from the dashboard was performed at regular intervals and for a fraction of time (about 0.9 s) that did not influence the quality of driving. The moni-toring of the mirrors in our trials represented a partial information, since a more ‘difficult’ geometry (in terms of horizontal radii, dimension of the cross section, etc.) and an increased traffic flow, would lead drivers to turn their attention more frequently toward the mirrors.
The sample size of users, very small, had no effect on the outcome of this research because our aim was to learn visual strategies adopted in various conditions. The results, therefore, have no general value but can be used to thoroughly evaluate the visual behaviour in real conditions.
In conclusion, we believe that this research can help the designer to verify more carefully the road safety, in-vestigating in greater detail some conditions, such as traffic flows, presence of vulnerable users, sight critical conditions, particular classes of users, generally neglect-ed in an ordinary design.
These results could also help to refine theoretical models of visual behaviour in the literature by contex-tualizing the scenarios of interest and inserting the types of users that travel more frequently a particular road.
References
Ailon, A.; Berman, N.; Arogeti, S. 2005. On controllability and trajectory tracking of a kinematic vehicle model,
Automat-ica 41(5): 889–896.
http://doi.org/10.1016/j.automatica.2004.11.025
Bosurgi, G.; D’Andrea, A.; Pellegrino, O. 2013a. A model to predict drivers’ visual strategy, in 4th International
Con-ference on Road Safety and Simulation (RSS2013), 23–25
October 2013, Rome, Italy, 1–18.
Bosurgi, G.; D’Andrea, A.; Pellegrino, O. 2013b. What variables affect to a greater extent the driver’s vision while driving?,
Transport 28(4): 331–340.
http://doi.org/10.3846/16484142.2013.864329
Bosurgi, G.; D’Andrea, A.; Pellegrino, O. 2010. Could drivers’ visual behaviour influence road design?, Advances in
Trans-portation Studies: an International Journal 22: 17–30.
D’Andrea, A.; Pellegrino, O. 2012. Application of fuzzy tech-niques for determining the operating speed based on road geometry, Promet – Traffic&Transportation 24(3): 203–214.
http://doi.org/10.7307/ptt.v24i3.313
Di Stasi, L. L.; Renner, R.; Catena, A.; Cañas, J. J.; Velichko-vsky, B. M.; Pannasch, S. 2012. Towards a driver fatigue test based on the saccadic main sequence: a partial validation by subjective report data, Transportation Research Part C:
Emerging Technologies 21(1): 122–133.
http://doi.org/10.1016/j.trc.2011.07.002
Dijksterhuis, C.; Brookhuis, K. A.; De Waard, D. 2011. Effects of steering demand on lane keeping behaviour, self-reports, and physiology. A simulator study, Accident Analysis &
Pre-vention 43(3): 1074–1081.
http://doi.org/10.1016/j.aap.2010.12.014
Donges, E. 1978. A two-level model of driver steering behav-ior, Human Factors: The Journal of the Human Factors and
Ergonomics Society 20(6): 691–707.
French, D. J.; West, R. J.; Elander, J.; Wilding, J. M. 1993. Deci-sion-making style, driving style, and self-reported involve-ment in road traffic accidents, Ergonomics 36(6): 627–644.
http://doi.org/10.1080/00140139308967925
Konstantopoulos, P.; Crundall, D. 2008. The driver prioritisa-tion quesprioritisa-tionnaire: exploring drivers’ self-report visual pri-orities in a range of driving scenarios, Accident Analysis &
Prevention 40(6): 1925–1936.
http://doi.org/10.1016/j.aap.2008.08.009
Land, M. F. 2006. Eye movements and the control of actions in everyday life, Progress in Retinal and Eye Research 25(3): 296–324. http://doi.org/10.1016/j.preteyeres.2006.01.002
Land, M. F. 1998. The visual control of steering, in L. R. Harris, M. Jenkin (Eds.). Vision and Action, 163–180.
Land, M. F.; Horwood, J. 1998. How speed affects the way visual information is used in steering, Vision in Vehicles 4: 43–50.
Land, M. F.; Tatler, B. W. 2001. Steering with the head: the visual strategy of a racing driver, Current Biology 11(15): 1215–1220. http://doi.org/10.1016/s0960-9822(01)00351-7
Martens, M. H. 2011. Change detection in traffic: where do we look and what do we perceive?, Transportation Research
Part F: Traffic Psychology and Behaviour 14(3): 240–250.
http://doi.org/10.1016/j.trf.2011.01.004
Minin, L.; Benedetto, S.; Pedrotti, M.; Re, A.; Tesauri, F. 2012. Measuring the effects of visual demand on lateral deviation: a comparison among driver’s performance indicators,
Ap-plied Ergonomics 43(3): 486–492.
http://doi.org/10.1016/j.apergo.2011.08.001
Owsley, C.; McGwin, G. 2010. Vision and driving, Vision
Re-search 50(23): 2348–2361.
http://doi.org/10.1016/j.visres.2010.05.021
Pellegrino, O. 2012a. Prediction of driver’s workload by means of fuzzy techniques, The Baltic Journal of Road and Bridge
Engineering 7(2): 120–128.
http://doi.org/10.3846/bjrbe.2012.17
Pellegrino, O. 2012b. The application of drivers’ cognitive relia-bility using fuzzy techniques, Applied Artificial Intelligence:
an International Journal 26(6): 517–540.
http://doi.org/10.1080/08839514.2012.670973
Pellegrino, O. 2011. Road context evaluated by means of fuzzy interval, Cognition, Technology & Work 13(1): 67–79.
http://doi.org/10.1007/s10111-010-0155-2
Pellegrino, O. 2009. An analysis of the effect of roadway design on driver’s workload, The Baltic Journal of Road and Bridge
Engineering 4(2): 45–53.
http://doi.org/10.3846/1822-427X.2009.4.45-53
Shinoda, H.; Hayhoe, M. M.; Shrivastava, A. 2001. What con-trols attention in natural environments?, Vision Research 41(25–26): 3535–3545.
http://doi.org/10.1016/S0042-6989(01)00199-7
Stinchcombe, A.; Gagnon, S. 2010. Driving in dangerous ter-ritory: complexity and road-characteristics influence at-tentional demand, Transportation Research Part F: Traffic
Psychology and Behaviour 13(6): 388–396.
http://doi.org/10.1016/j.trf.2010.06.008