1
2
CORSO DI DOTTORATO IN “SCIENZE, TECNOLOGIE E
BIOTECNOLOGIE PER LA SOSTENIBILITÀ”, CURRICULUM
“ECOLOGIA FORESTALE E TECNOLOGIE AMBIENTALI”
XXIX CICLO
Title of PhD Thesis
Contribute of Airborne Laser Scanning Data
in assessing forests and their characteristics
TUTOR: Prof. Marco Marchetti
COTUTOR: Prof. Gherardo Chirici
COORDINATORE: Prof. Mauro Moresi
COORDINATORE UNIMOL: Prof. Marco Marchetti
CANDIDATO:
Giovanni Lopez
3
Index
Short Abstract ... 4
Extended Abstract and keywords ... 6
Abstract esteso ... 9
Introduction ... 12
State of the art... 15
Aims of the study ... 23
Case studies ... 25
Combining ALS data and satellite images for the classification of land use/land cover ... 25
Introduction ... 25
Materials and Methods ... 26
Results and Discussion ... 31
Conclusion ... 32
Testing the use of LiDAR sensor to reconstruct Digital Terrain Model and Canopy Height Model in densely wooded areas ... 34
Introduction ... 34
Study area ... 35
Materials and methods ... 36
Results and Discussion ... 38
Conclusion ... 40
Combine ALS data, multispectral images and CHM to detect forest variables ... 41
Introduction ... 41
Materials and Methods ... 42
Modelling approach to estimate forest variables ... 48
Results and Discussion ... 52
Conclusion ... 57
Conclusion and Future Perspectives ... 58
References ... 60
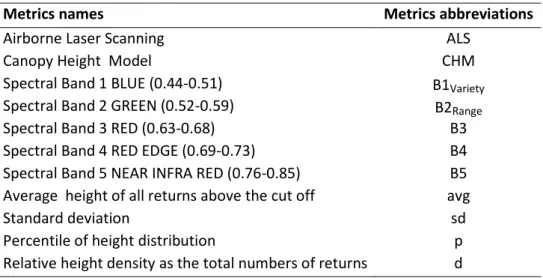
Annex I - List of metrics and abbreviations used in this thesis... 69
4
Short Abstract
In recent decades, the use of LiDAR (Light Detection and Ranging) sensors has been widely used to study forest resources.
The rapidity and the ability to acquire large area data, even unavailable, by integrating land-based sampling data, have encouraged the development and diffusion of remote sensing techniques to evaluate the state of the forests (Valbuena et al., 2017, 2016)through monitoring of sustainable forest management indicators (e.g. biomass above ground, tree species composition).
Monitoring of forest ecosystems and their management are always current issues and require continuous studies in order to simplify the data acquisition and at the same time ensure high reliability of the collected information (McRoberts & Walters, 2012).
Increased interest in forest resources, both in terms of biodiversity conservation and adaptation to climate change, as regards the exploitation of the short chain and the production of energy from renewable sources, highlight the need to develop innovative methodologies for monitoring the state of forest resources by supporting more sustainable forest management of these resources.
Several studies (Chirici et al., 2016c; Lim et al.,2001) have shown that LiDAR technology is a reliable and valuable remote sensing tool for collecting and evaluating forest structural parameters and sustainable forest management indicators.
The use of multispectral images data and laser scanner data has become increasingly common among the forestry sector with several applications for monitoring and planning support (Lasserre et al., 2011; Maselli et al., 2014; Montaghi et al., 2013a).
The remarkable amount of data that can be obtained through the elaboration of the points cloud has opened new horizons for the use of drones to support forestry management by agreeing to both scholars of forestry and forest owners and managers of forests (Chirici et al., 2011; Mura et al., 2015a).
Many studies have focused attention on the assessment of structural diversity, particularly on the vertical layering, while there is still a great amount of work to be able to assess the
5
specific diversity of forests and other biodiversity indicators (Coops et al., 2016; Danilin & Medvedev, 2004; Mura et al., 2016).
This technology has therefore been a major and fundamental support in the study of forest biodiversity, which is made even more apparent by the important role played by the structural forest diversity (Antonarakis et al., 2008; Næsset, 2005a).
The present work aims to demonstrate the validity of using LiDAR data and multispectral optical images for estimating forest management indicators to be applied to large-scale monitoring.
6
Extended Abstract and keywords
This PhD thesis has investigated the possibility and validity of using metrics extracted from LiDAR data and multispectral images for identifying and estimating useful variables in order to properly monitor forest ecosystems and ensure correct sustainable management. The technology Airborne Laser Scanning (ALS) allows to determine the distance of an object or of a surface by measuring the time elapsed between the emission of a laser pulse and the reception of the backscattered signal (echo). The pulse laser is a coherent beam of energy (generally emitted in the infrared wavelength range) sent from an instrument LiDAR mounted on board an air carrier. The echoes of the laser pulses are georeferenced using satellite positioning of the aircraft constituting point clouds vector with a known geographic location in space. Each echo contains a number of ancillary information such as the intensity, the time in which it was issued and the scan angle of the sensor.
The ALS technique is used more and more widely in the study of forest resources in order to obtain direct information with a high degree of accuracy regarding the horizontal and vertical structure of vegetation (Montaghi et al., 2012). Developing specific predictive models on the basis of data ALS allow to estimate biophysical variables such as basal area, mean diameter, forest cover, the LAI (Leaf Area Index), growing stock and biomass (Corona et al., 2012 ).
ALS technologies have also been used to study the seismic hazard of the Central and Southern Apennines (Walker et al. 2012) and for the 'interpretation and analysis of alpine basins through DTM resolution (Trevisani et al., 2012).
Relatively less explored are the applications aimed at the possibility of recognizing and mapping forest species or forest types. At present Ke et al. (2010) have proposed the synergistic use of very high resolution optical data along with a wide array of metrics derived from the ALS data. More recently Engler et al., (2013), Jakubowski et al., (2013) and Orka et al. (2013) presented their work towards the identification of the individual forest species with different techniques. It is relatively unexplored the possibility of mapping forest types by combining ALS data and optical imagery (Chirici et al., 2011).
7
Forest type is assumed as a system of classification of forests and shrubs on the basis of floristic, ecological, silvicultural and dynamic aspects, usable to support forestry or, more generally, territory planning processes.
The Work envisaged mainly three phases divided into the three years of PhD.
The first year covered the literature review on the ability of the ALS data to directly detect absolute and relative hypsometric measurements that were found to be particularly useful for the estimation of quantitative variables such as biomass and growing stock in forest ecosystems and for the classification of land use/cover categories.
The second year focused on presenting the first results of experiments with an ultra-light helicopter-bornLiDAR. In particular, it was demonstrated that, using the multi-echo LiDAR, it was possible to obtain DTM in densely wooded areas and to estimate the average height of trees from CHM with a 5% error.
The third year consisted in using metrics extracted from satellite imagery, point clouds and CHM in order to determine variables such as tree height, basal area and volume at stand level.
The present work aims to demonstrate the validity of using LiDAR data and multispectral optical images for estimating forest management indicators to be applied to large-scale monitoring.
The study was carried out in the south western part of the Molise Region, over an area of almost 36,000 hectares, where a two-stage forest inventory was made on a sample of 62 study areas. In addition, to each dendrometric parameter, all the aboveground components of the vegetation were used to determine the forest variables. The field data comes from three datasets available from previous project in the area: ItaLid, Forest Focus and Matese. ALS data and multispectral image data RapidEye were used to assess forest inventory variables (i.e. basal area, tree height and volume). From the ALS data, CHMs with a resolution of 1 Km2 were derived. Subsequently, the metrics (min, max, mean, sd, etc.) were extracted at the wise areas.
The same procedure has been applied for RapidEye multispectral images.
By using these metrics, a model for assessing Large-scale Sustainable Forest Management Indicators has been defined and launched.
8
Finally, the ability of using ALS data for the classification of land use/cover categories was investigated.
Keywords:LiDAR, Multispectral Image, CHM, ALS, Remote Sensing, Forest
Management, Forest Structure, Forest Variables.
9
Abstract esteso
Questo lavoro di tesi ha indagato circa la possibilità e la validità di utilizzare metriche estratte da dati LiDAR e da immagini multispettrali per l individuazione e la stima di variabili utili al fine di un corretto monitoraggio degli ecosistemi forestali e della loro corretta gestione sostenibile.
La tecnologia Airborne Laser Scanning (ALS) consente di determinare la distanza di un oggetto o di una superficie misurando il tempo trascorso tra l'emissione di un impulso laser e la ricezione del segnale backscattered (echo). Il laser a impulsi è un fascio di energia coerente (generalmente emesso nell'intervallo di lunghezze d'onda a infrarossi) inviato da uno strumento LiDAR (Light Detection and Ranging) montato a bordo di un vettore aereo. Gli echi degli impulsi laser vengono georeferenziati utilizzando il posizionamento satellitare del velivolo che costituisce il vettore di nuvole di punti con una posizione geografica nota nello spazio. Ogni eco contiene una serie di informazioni accessorie quali l'intensità, l'ora in cui è stat0 emesso e l'angolo di scansione del sensore.
La tecnica ALS viene utilizzata sempre più ampiamente nello studio delle risorse forestali al fine di ottenere informazioni dirette con un elevato grado di precisione rispetto alla struttura orizzontale e verticale della vegetazione (Montaghi et al., 2012).
Lo sviluppo di modelli predittivi specifici in base ai dati di ALS permettono di stimare le variabili biofisiche come l'area basimetrica, il diametro medio, la copertura forestale, LAI (Area del Foglio), lo stock in crescita e la biomassa (Corona et al., 2012).
Le tecnologie ALS sono state utilizzate anche per studiare il pericolo sismico degli Appennini Centrali e Meridionali (Walker et al., 2012) e per l'interpretazione e l'analisi dei bacini alpini mediante risoluzione DTM (S. Trevisani et al., 2012).
Relativamente meno esplorati sono le applicazioni che mirano alla possibilità di riconoscere e mappare specie forestali o foreste. Attualmente Ke et al. (2010) hanno proposto l'uso sinergico di dati ottici ad altissima risoluzione e una vasta gamma di metriche derivate dai dati ALS. Più recentemente Engler et al. (2013), Jakubowski et al., (2013) e Orka et al. (2013) hanno presentato il loro lavoro verso l'individuazione delle singole specie forestali con tecniche diverse.
10
È relativamente inesplorato la possibilità di mappare i tipi forestali combinando dati ALS e immagini ottiche (Chirici et al., 2011).
Il tipo di foresta è considerato un sistema di classificazione delle foreste e degli arbusti sulla base di aspetti floristici, ecologici, selviculturali e dinamici, utilizzabili per sostenere i processi forestali o, più in generale, di pianificazione territoriale.
Il lavoro prevedeva principalmente tre fasi divise in tre anni di dottorato.
Il primo anno ha riguardato la revisione della letteratura sulla capacità dei dati ALS di rilevare direttamente misurazioni ipsometriche assolute e relative che sono risultate essere particolarmente utili per la stima di variabili quantitative come la biomassa e lo stock in crescita negli ecosistemi forestali e per la classificazione dell'uso del suolo / categorie di copertura.
Il secondo anno si è concentrato sulla presentazione dei primi risultati di esperimenti con Lidar applicato ad un elicottero ultraleggero. In particolare, è stato dimostrato che, utilizzando il LiDAR multi-eco, è stato possibile ottenere DTM in aree densamente alberate e stimare l'altezza media degli alberi da CHM con un errore del 5%.
Il terzo anno sono state usate le metriche estratte da immagini satellitari, nuvole di punti e CHM per determinare variabili quali l'altezza dell'albero, l'area basimetrica e il volume. Il presente lavoro mira a dimostrare la validità dell'utilizzo di dati LiDAR e immagini ottiche multispettrali per la stima degli indicatori di gestione forestale da applicare al monitoraggio su larga scala (Chirici et al., 2011; Mura et al., 2015a).
Lo studio è stato condotto nella parte sud-occidentale della Regione Molise, su un'area di quasi 36.000 ettari, dove è stato realizzato un inventario forestale a due stadi su un campione di 62 aree di studio. Inoltre, per ogni parametro dendrometrico, sono stati utilizzati tutti i componenti epigei della vegetazione per determinare le variabili forestali. I dati di campo provengono da tre set di dati disponibili dal progetto precedente nell'area: ItaLid, Forest Focus e Matese.
Dati ALS e dati di immagini multispettrali RapidEye sono stati utilizzati per valutare le variabili dell'inventario forestale (vale a dire area basimetrica, altezza e volume dell'albero). Dai dati ALS, sono stati derivati CHM con una risoluzione di 1 Km2. Successivamente, le metriche (min, max, mean, sd, ecc.) sono state estratte nelle aree di saggio.
11
Utilizzando questi parametri, è stato definito e avviato un modello per la valutazione degli indicatori di gestione forestale sostenibile su larga scala.
Infine, è stata studiata la capacità di utilizzare i dati ALS per la classificazione delle categorie di uso del suolo / copertura.
Keywords:LiDAR, Multispectral Image, CHM, ALS, Remote Sensing, Forest
Management, Forest Structure, Forest Variables.
12
Introduction
Forests cover some 30% of the world’s land area (Figure 1) and many people depend on forests for at least part of their livelihood and well-being (MEA, 2005).
Ensure the continuous provision of forest ecosystem services is the main task of the Sustainable Forest Management (SFM)(Hickey, 2008).
Figure1- Distribution of forest cover in the world. Source (MEA 2005).
Since 1992, the concept of SFM is being object of discussion among international stakeholders’ categories (such as e.g. forest researcher, forest policy and decision makers, forest owners, etc.). Over the years, SFM concept has influenced many initiatives, has led to the revision of forest policies and practices, and has been mainstreamed by local, national and international forestry organizations (Santopuoli et al., 2016). At European level, FOREST EUROPE defined the concept of SFM in 1993 during the second Ministerial Conference on the Protection of Forest in Europe, held in Helsinki, Finland. Since then, Criteria and indicators (C&I) are recognised as a powerful tool for implementing SFM (Wijewardana, 2008; Wolfslehner &Vacik, 2011).
Because C&I characterize the essential components of SFM and provide information for the formulation of sound policies, they represent one of the most important tool for assessing, monitoring and reporting on the sustainability of forest management in Europe (Forest Europe, 2015). Nevertheless, SFM requires a large amount of data in order to describe and
13
assess forest resources. National forest inventory is the most important provider of forest data at large scale such as at national or regional levels (Tomppo et al., 2010).
Although the development of several strategic forest inventories (Haywood et al., 2016), field measurements are still important to enhance an acceptable level of accuracy of data. Even though field measurement are essential, they represent a significant cost of the forest inventory (Chirici et al., 2013), mostly because the large number of field plots that are necessary to meet a desired level of precision in the estimates. In recent decades, remote sensing technology both active and passive airborne and spaceborne imaging and ranging sensors, have found large use in forest inventory(Barrett et al., 2016), reaching a balanced cost effectiveness to acquire information across space and temporal scales (Haywood et al., 2016).
The availability of extensive archives of satellite image time-series facilitate the use of remote sensing for forestry purposes such as for example monitoring and assessing changes and dynamics of forest cover in space and time as forest fire (Chirici et al., 2013; Corona et al., 2008).
Nevertheless, optical images are not sensitive to below-canopy forest attribute, while ALS allow a reliable characterization of both horizontal and vertical forest structure. Tree species composition and stand structure strongly affect the specie richness (flora and fauna) within the forest. For this reason, mapping forest structure would facilitate habitat and diversity assessments for large, remote and steep areas that cannot be safely reached by field crews (Mura et al., 2015b), and thus supporting SFM. The increased availability of data from ALS is encouraging the use of remote sensing data to predict various forest parameters (e.g. tree height, tree diameter, stand structure variability, above ground biomass, carbon stock, etc.). Furthermore, the combined use of ALS data with multispectral satellite images and field measurements strongly support the development of new models for improving the precision of estimates of forest variables.
Sustainable forest management requires a large amount of data describing and quantifying forest variables.
The need to find such data has become more and more important in the last decade because of reporting requirements established by many international processes such as the
14
Ministerial Conference on the Protection of Forests in Europe (2002) and the process of Montreal (2006) which require periodic reports on several indicators.
The data used to extract indicators from forest variables used are traditionally acquired in two different scales: large areas through forest inventories and locally through forest management plans.
At both scales, information comes from expensive field surveys.
This explains the increasing importance attached to remote sensing data, integrated with satellite imagery, with regard to metric extraction to be used in models for evaluating different forest parameters useful for planning proper sustainable forest management.
For remote sensing, we refer to the indirect measure of electromagnetic energy emitted by using a camera or sensor.
The great potential of remote sensing has received considerable attention in recent decades in crop management areas such as nutrition data assessment and mapping of herb density. Recently, there has been an increasing demand for energy crop monitoring using remote sensing instruments.
The advantages of remote data are time resolution, synoptic display, and digital formatting that allow the first processing of large amounts of data.
The high correlation between spectral bands and vegetative parameters provides biomass estimation information on a large area.
So the biomass estimation based on remote sensing attracted the scientists' interest.
One of the most effective methods for estimating and mapping forest attributes using remote data is the k-Nearest Neighbor (k-NN) method that manages to construct continuous mapping of forest attributes (McRoberts et al.,1991) are also used to support local forest management (LeMay & Temesgen, 2005).
Other methods include extracting metrics from remote data, such as LiDAR data, and multispectral images for the construction of parametric and non-parametric models that can automatically estimate, through correlations, forest variables.
LiDAR is a remote sensing technique that allows to determine the distance of an object or a surface using a laser pulse. The distance of the object is determined by measuring the time elapsed between the pulse emission and the reception of the retro - diffused signal.
15
The principle of functioning of the laser scanning system is, therefore, based on the emission of a laser pulse from a platform (aerial, terrestrial or orbital) with a high repeat frequency, in which the time of return of the laser pulses between the platform and the objective is measured by the sensor, and allows us to estimate the distance between the sensor itself and the object (Baltsavias, 1999; Wagner et al.,2004).
The LiDAR technology is based on the same principles used in the RADAR system (Axelsson et. al., , 1999), but instead of using radio waves to identify objects of interest, the LiDAR system uses pulses of light (laser).
The source of a LiDAR system (Akay et al., 2009), as already mentioned, is a laser or a coherent beam of light at a precise wavelength, which is sent to the system to be observed. The time elapsed between the impulse emission and the detection produces the distance between the sensor and the target, and the vertical distribution of the surfaces is recorded using the point pulse for point 45 (discrete return systems for Each point) or continuous data (continuous waveform systems).
ALS discrete return systems have been developed over the last 20 years for the terrain mapping (Wehr, 2008).
State of the art
In the last two decades, active remote sensing technologies such as LiDAR have been shown to be reliable and valuable sources of information for estimating and assessing forest structural parameters. LiDAR is a remote sensing technique that allows to determine the distance of an object or a surface using a laser pulse. The distance of the object is determined by measuring the time elapsed between the pulse emission and the reception of the retro - diffused signal. ALS discrete return systems have been developed over the last 20 years for the terrain mapping (Wehr, 2008).
When predicting forest inventory attributes using ALS data or aerial images, two main approaches can be applied(Montaghi et al., 2013b): the Area-based Approach (AbA) (Næsset, 2002) and the Individual Tree Detection (ITD) approach (Kaartinen et al., 2012; Popescu et al., 2002).Several studies indicate the potential of discrete return ALS, in combination with optical remotely sensed images, for estimating tree or forest variables. For
16
example, tree height can be readily estimated from the ALS point cloud (e.g. Næsset, 2002; Popescu et al., 2002).
Moreover, tree crown variables such as e.g. base height, diameter, area and volume can be estimated using automated, individual tree recognition methods that extract single tree locations and delineate full crowns (e.g.: Hyyppä et al., 2001; Persson et al., 2002; Morsdorf et al., 2004).
Parametric and non-parametric techniques have been used to compare echo-based metrics derived directly from the three-dimensional distribution of the point cloud data and metrics derived from a canopy height model (CHM) for estimating above ground biomass (Chirici et al., 2016a).
The estimation of forest variables that use these data generally seems easier in areas with simple landscape models where there is a limited number of species of sparsely-mixed trees and forests organized in large homogeneous areas compared to areas with more complex landscapes where the shells and Forest types frequently change on small areas (Chiriciet al., 2003).
The importance of forest monitoring is also universally recognized because of the role played by forests and other semi-natural ecosystems in carbon cycle regulation. Explicit spatial information, at several levels on the forest state, is therefore necessary in various technical and scientific applications; In particular, monitoring of a wide range of ecosystem services and support for the development of carbon and bioenergy policies, the identification of land use change and the assessment of carbon stocks (Corona & Chirici, 2002).
One of the most important factors affecting the dynamics of Mediterranean forests is fire, and its intensity and recurrence may substantially affect successional pathways, even preventing post-fire auto-successional trends (Brivio et al.,2009; Moreira et al., 2011). In the period 2006–2009, fires affected approximately 1,366,000 ha of European forests (Forest Europe, 2011).
The European Forest Fire Information System of the European Commission (EC, 2011) indicates that the most affected areas, excluding the Russian Federation, are the five southern member states: Portugal, Spain, France, Italy and Greece. In these five countries,
17
fires burnt a total area of 14,620,968 ha during the period 1980–2010. Annual totals varied from 158,621 ha in 2008 to almost one million ha in 1985.
Fires reduce flows of forest ecosystem services (Mavsar et al.,2012)such as wood and non-wood products, game for hunting, soil protection, recreational and social value, carbon sequestration, biodiversity protection.
The amount of fuel loading, as well as forest composition and forest structure, affect the characteristics and frequency of forest fires (Schmidt et al.,2002).
Thus, an accurate description of the forest in terms of fuel conditions is essential to support fire management and to predict fire risk (Chuvieco et al.,2004).
A lot of studies, for example, have been conducted in Italy using the ALS data in conjunction with an IRS LISS-III image for mapping forest fuel types.
Chirici(Chirici et al., 2013)used ALS data and multi-spectral data for mapping forest fuel types useful for fire management in Mediterranean context, demonstrating that the combination of both ALS and optical data allow to obtain greater accuracy of results rather than the data from either sources alone.
The forest area in Italy is 87,592 km2 (29% of the total area) and has a heterogeneous forest cover (Figure 2).
18
In spite of all, a great deal of environmental information is available to support estimation of forest variables acquired on the field by remote sensing and multispectral images.
All stakeholders interested in proper forest management could benefit from the operational application of these methods.
Forest ecosystems are the largest available biomass source worldwide and their use for energy purposes is part of the international political and economic debate.
Much of this biomass is used for traditional forestry products such as firewood and lumber. Today, energy policy promotes the use of renewable resources with non-negative environmental impacts, such as wood biomass.
This explains why environmental responses from the collection of biomass for energy should be carefully considered in the framework of sustainable forest management practices.
For many reasons (social, economic, cultural, etc.) to support forestry planning, the quantitative estimation of forest wood biomass is urgently required on large areas.
The main source of information for estimating forest resources is the National Forest Inventory.
The consolidated inventory and monitoring of forest ecosystems is recognized as a major support to land-based resource planning programs.
Inventory and monitoring programs focused on a global assessment of ecosystem attributes that evolve into global environmental research programs, but implementation is still limited. Their development and implementation of approaches based on a healthy ecological landscape perspective "for habitats" will bring unique benefits, thus leading to effective integration between sectoral surveys targeted at environmental inventory / environmental monitoring (Barbati et al., 2014).
National Forest Inventories are able to provide information on a large number of aggregate forest variables for large geographic regions (municipalities, counties, provinces and states). More and more maps are also required to represent the spatial distribution of forest resources.
Moreover, a reliable assessment of forest resources, productivity and harvesting is a common goal of environmental monitoring programs at various spatial scale (Corona et al.., 2007; Köhl et al., 2006; McRoberts et al.,2007).
19
In a distinctive way, the evaluation of wood harvesting has become even more important in verifying the sustainability of forest management and quantifying the forest carbon balance. In the last decade, various techniques have been developed for the realization of such maps that combine remote data with field-acquired information in forestry inventories or other similar monitoring programs.
Since local measurements are greatly affected by space heterogeneity, remote sensing techniques are an important tool for classifying forests and monitoring their degradation due to cuts, fires and diseases.
Available satellite VHR images are represented e.g. by Formosat, IKONOS, QuickBird, OrbView-3, SPOT5 HRG, WorldView-2, Pleiades.
On the other hand, the most commonly applied satellite imagery reported in the literature are Landsat (TM or ETM +). Some applications can also be found for low resolution data such as MODIS, NOAA-AVHRR, and SPOT Vegetation.
Multisensor approaches are also exploited, combining the information content of cross sensor imagery(Wulder et al., 2004) or combining satellite imagery with Orthophotos (Saksa et al.,2003) or with radar images (Thiel et al.,2006).
The optical sensors operating on the satellite are widely adopted for this purpose and the complexity of the parameters that can be extracted from these observations can be increased by multi-temporal and multispectral image grading techniques, enabling the monitoring and classification of forests and the Their temporal evolution and providing useful tools for forest management (McRoberts et al, 2010).
Such applications are often based, as already mentioned above, on the existence of a relationship between forest variables and spectral information acquired by satellite imagery. The increasing availability of data from ALS, which is used individually or in combination with multispectral satellite images, is fundamental in the process of increasing the use of remote sensing data, to automatically and accurately predict various forest parameters (e.g. Number of trees, diameter, basal area, volume, structural variability, biomass, carbon stock, etc.).
As already mentioned, the increasing interest in ALS lies in the fact that this technology provides true 3D data both on the ground and canopy compared to the traditional methods used to evaluate forest attributes.
20
They are also more precise, easy to process and less costly (Eid et al.,2004; Holmgren, 2004; Næsset, 2011, 2007, 2005b, 2002).
In several countries, the use of ALS data (eg, Nordic countries, USA, Canada and Australia) is now consolidated, the reader refers to Holmgren ( 2004), Hyyppä( Hyyppä et al., 2008; Hyyppä et al.,2003; Hyyppä et al., J.,2009), Leeuwen e Nieuwenhuis ( 2010), Lefsky et al. (2002), Lim et al. ( 2003), Maltamo et al. (2007), Næsset ( 2003), Næsset et al. (2004), Nilsson et al. (2003), Turner et al. (2011) and Wulder ( 2003).
There are two broad categories of ALS data analysis approaches to support inventory and forestry management: area-based approaches (AB), also called statistical canopy height distribution approaches, and individual tree crown (ITC).
In the second case, the approach concerns the construction of the CHM derived from ALS data that provides the metrics used in the parametric models (e.g. regression) or non-parametric models used to predict forest attributes (such as height, volume, biomass and basal area).These methods provide presentation of the correlation between variables through Cartesian graphs.
Over the last twenty years, the search that exploits the use of ALS data has considerably increased. As reported by Næsset(Næsset et al., 2004), the first published study to estimate the height of a tree through ALS was conducted in the Soviet Union (Solodukhin et al.,1977), followed by similar studies in North America ( Bonnor, 1985; Maclean & Krabill, 1986; Nelson et al.,1984).
In Europe, the first ALS applications for the recovery of forest attributes were conducted in the Nordic countries (Hyyppä,.& Inkinen, 1999; Næsset, 1997a, 1997b, Nilsson, 1996, 1994).
Currently, the use of ALS data is becoming a dominant forest inventory method in Norway and Finland.
Floris (Floris et al.,2009)tested the potential contribution of ALS data to forest photo-interpretation using a CHM and DTM derived from an ALS acquisition carried out in the winter (November 2006) with a first and last pulse Optech ALTM 3033 laser scanner (mean density of 0.48 points/m2). The study area was an Alpine mixed forest located in Val di Fiemme (Trento Province, Northeastern Italy).
21
The CHM and DTM were used as GIS layers, overlayed on a digital aerial photo, to classify forest compartments for planning and management purposes. The results of this experimental analysis have shown a usefulness of the ALS data for monitoring forest resources, especially when compared with traditional methods which required expensive field surveys.
Floris (Floris et al.,2010)developed a forecasting model based on ALS data for estimation of forest timber volume per area unit for the Foresta di Paneveggio ―Site of Community Importance‖ (Trento Province, Northeastern Italy).
Tonolli (Tonolli et al.,2011) investigated estimation of stem volume in a multilayered Alpine forest area using multi-return ALS data from the same ALS data acquisition as Dalponte (Dalponte et al.,.
The study was carried out using 20 ALS metrics extracted from multiple return ALS data, while the field data were obtained from 50 variable radius plots distributed over the study area and six stand level areas derived from the Trento provincial forest inventory.
Dalponte(Dalponte et al.,2011)proposed a system to estimate stem diameter and volume at the individual tree level with Support Vector Regression (SVR) using 37 variables extracted using all ALS returns.
Dalponte (Dalponte et al., 2009; Dalponte et al.,2011) demonstrate the effectiveness of the use of multi-return ALS data in the estimation of tree stem volume at individual tree level in an Alpine forest. A future development of these systems must be comparing the results of the SVR with other nonlinear multiple parametric regression techniques and to analyze the impact of the point density on the estimation results in order to optimize the cost of the ALS acquisition and the precision of the stem diameter and volume estimations.
Dalponte(Dalponte et al.,2011)investigated the role of positioning error of the ground plots and the optimal number of field measurements needed for area-based prediction of stem volume.
This study was carried out in the area of "Molise" (Molise, southern Italy) and aims to demonstrate the correlation between the metrics extracted from LiDAR remote sensing data and satellite imagery, compared with field data, estimating variables Forestry through the use of models.
22
In the specific case of this study, LiDAR data, RapidEye data from satellite, field data derived from three different DataSet (ItaLiD, Forest Focus and Matese), and the Multivariate Linear Model and Random Forest.
23
Aims of the study
The current state of the art highlights that several improvements on the use of ALS data have been done. Nevertheless, further improvements are still necessary in order to reduce the errors in estimates of forest variables.
The overall aim of the work is to test and compare different approaches for assessing forest variables such as tree height (H), basal area (G) and above ground biomass (V) using cloud data belonging different forest types (Chiavetta et al., 2016; Vizzarri et al., 2015) of Molise Region.
This thesis reports the methodological approaches and results obtained from three case studies: (i) combining ALS data and multispectral images for the classification of land use /land cover categories by classifiers; (ii) use of ALS data to reconstruct DTM in densely wooded areas and to estimate the height of the trees; and (iii) comparison of ALS data, multispectral images and a hybrid of them to estimate forest variables using two modeling approaches (Linear Multivariate Regression Model and Random Forest).
(i) The first case study focused on the literature review concern the usefulness of ALS data to detect forest inventory variables, such as biomass, growing stock (Nasset, 1997) or also other forest-related issues as for example for land motion volumes in road design (Coulter et al., 2002, Contreras et al., 2012). In particular, in this case study was investigated the ability of using ALS data, Satellite data and their combination, for the classification of land use/cover categories.
(ii) The second case study aimed to test the use of LiDAR sensor, mounted on the ultra-light helicopter-born, to detect DTM in densely wooded areas. The work focused on the pre-processing and normalization of ALS data which were collected in four different broadleaved forests, in order to create DTM.
(iii) The last case study aimed to assess tree height (H), basal area (G) and volume (V) of forests using ALS metrics, CHM, satellite images and a combined use of them. The study bases the analysis on the echo-based metrics derived directly from the three-dimensional distribution of the point cloud data, metrics derived from a canopy height model (CHM), metrics derived from satellite images and finally all the mentioned metrics together.
24
The expected outcome should facilitate future implementations of ALS technology in forest monitoring and management decision support systems, particularly with respect to selection of the optimal metrics and classification method for forest type mapping.
25
Case studies
Combining ALS data and satellite images for the classification of land
use/land cover
Introduction
The technology ALS allows to determine the distance of an object or of a surface by measuring the time elapsed between the emission of a laser pulse and the reception of the backscattered signal (echo). The pulse laser is a coherent beam of energy (generally emitted in the infrared wavelength range) sent from an instrument LiDAR mounted on board an air carrier. The echoes of the laser pulses are georeferenced using satellite positioning of the aircraft constituting point clouds vector with a known geographic location in space. Each echo contains a number of ancillary information such as the intensity, the time in which it was issued and the scan angle of the sensor.
The ALS technique is used more and more widely in the study of forest resources in order to obtain direct information with a high degree of accuracy regarding the horizontal and vertical structure of vegetation (Montaghi et al. 2012). Developing specific predictive models on the basis of data ALS allow to estimate biophysical variables such as basal area, mean diameter, forest cover, the LAI (Leaf Area Index), growing stock and biomass (Corona et al., 2012 ).
ALS technologies have also been used to study the seismic hazard of the Central and Southern Apennines (Walker et al. 2012) and for the 'interpretation and analysis of alpine basins through DTM resolution (Trevisani et al. , 2012).
Relatively less explored are the applications aimed at the possibility of recognizing and mapping forest species or forest types. At present Ke (Ke et al.,2010) have proposed the synergistic use of very high resolution optical data along with a wide array of metrics derived from the ALS data. More recently Engler (Engler et al.,2013), Jakubowski (Jakubowski et al.,2013) and Orka (Orka et al.,2013) presented their work towards the identification of the individual forest species with different techniques.
It is relatively unexplored the possibility of mapping forest types by combining ALS data and optical imagery (Chirici et al., 2011).
26
Forest type is assumed as a system of classification of forests and shrubs on the basis of floristic, ecological, silvicultural and dynamic aspects, usable to support forestry or, more generally, territory planning processes.
Materials and Methods
Study Area
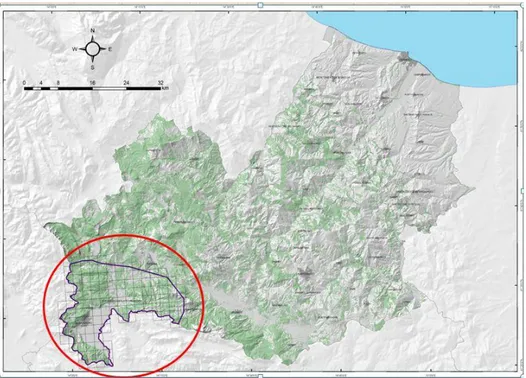
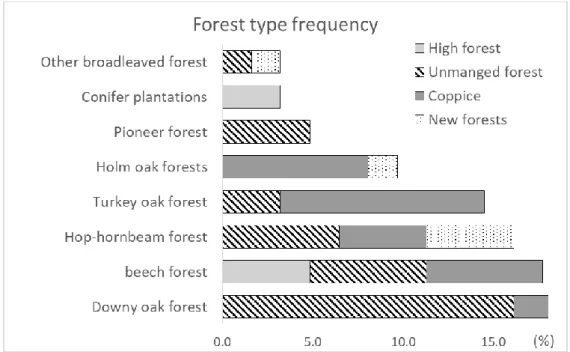
The study area (Figure 3) is located in the south western part of Molise Region in central Italy and its total area is360 km2 (Fig. 1). Forests are coverover 200 km2, comprising approximately 56% of the area. Deciduous oaks (Quercus cerris L and Quercus pubescens
Willd.) cover most of the forest area (60%), while hop hornbeam (Ostrya carpinifolia) and
beech (Fagus sylvatica L.) forests cover approximately 18% and 9% respectively. The most common forest management systems for the oak and hop hornbeam forests in this area is coppice with standards. This forest management system consists of stands that originate from stool shoots or suckers of vegetative origin and it is very common in the Molise Region (Garfì, & Marchetti, 2011), being very representative of private forests.
Figure 3: Forest mask according the forest types map of Molise Region (green). The study area is located in the south western part of the Molise Region (red circle).
At harvesting time, some trees, the standards that are normally trees of seedling rather than coppice origin, are retained for seed dissemination and soil protection.
27
In the study area, rotation periods are usually between 18 and 22 years, with cut widths of 15–20 ha and retention of 70–150 standards/ha. Conversely, most of the beech forests are managed with the shelter wood system or are unmanaged and now have structures approaching old-growth forest status.
ALS data and Multispectral data
For classification tests, ALS data derived from flight on June 2010 with Vector Partenavia P68, (LiDAR: Optech Pegasus; scan angle: 20°; frequency: 100 KHz; average density: 1,5 pulse/m2; projection: UTM 33N WGS 84).
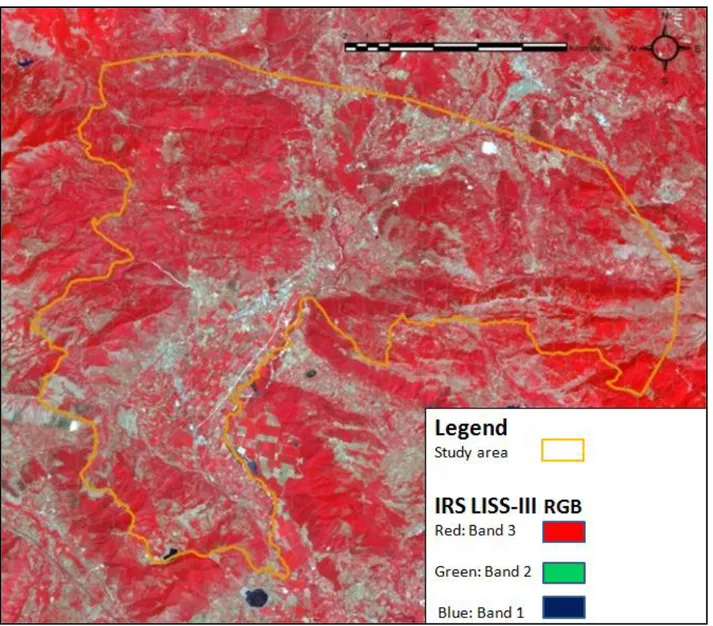
ALS data has tiling 2 km x 2 km and was automatically classified as Ground/non-ground. Multispectral information is derived from the LISS-III sensor on the IRS satellite and consists in four near-infrared green strips with a 20 m geometric resolution (Figure 4).
28
The LiDAR dataset was suitably pre-processed for the elimination of disturbance signals and was used to generate a series of information layers for each pixel in the IRS image and containing a set of metrics derived from relative and absolute hypothetical values.
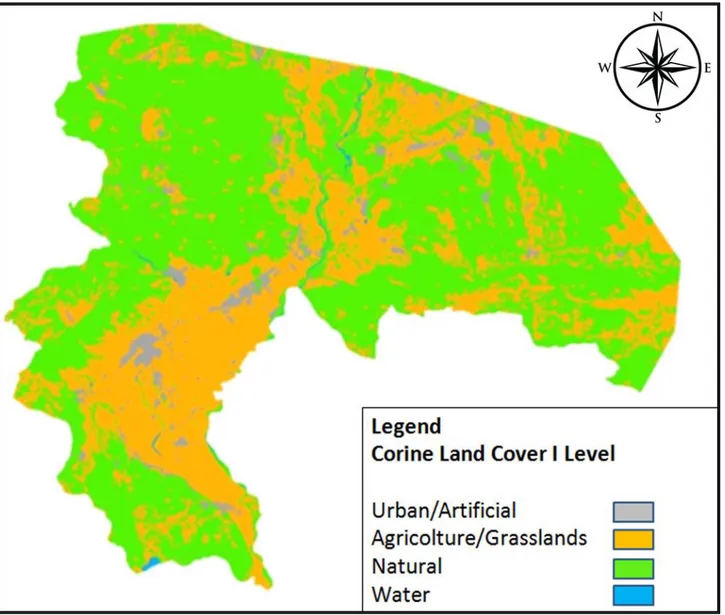
The reference cartographic base, assumed as ground truth, is the land use and cover map of the Molise Region, derived from photo-interpretation and integrated by local land surveys. The map was classified at first level of Corine Land Cover (Urban/Artificial, Agriculture/Grasslands, Natural and Water) (Figure 5).
Figure 5: Corine Land Cover classification (1st level) of study area.
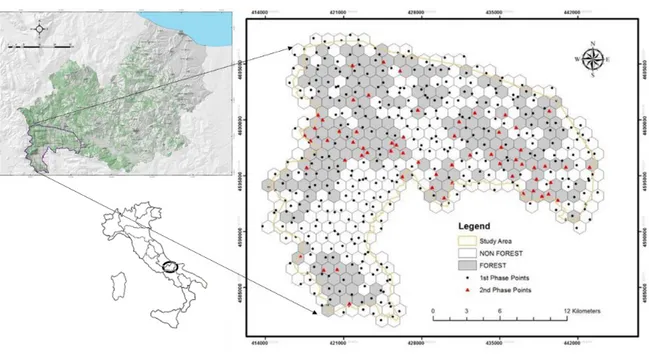
The dataset was subsequently rasterized (Figure 6) and randomly divided into training sets (70%) to guide the supervised classification and test set (30%) for the Overall Accuracy evaluation (OA).
29 Figure 6: Representation of the Raster segmentation results of the IRS image. .
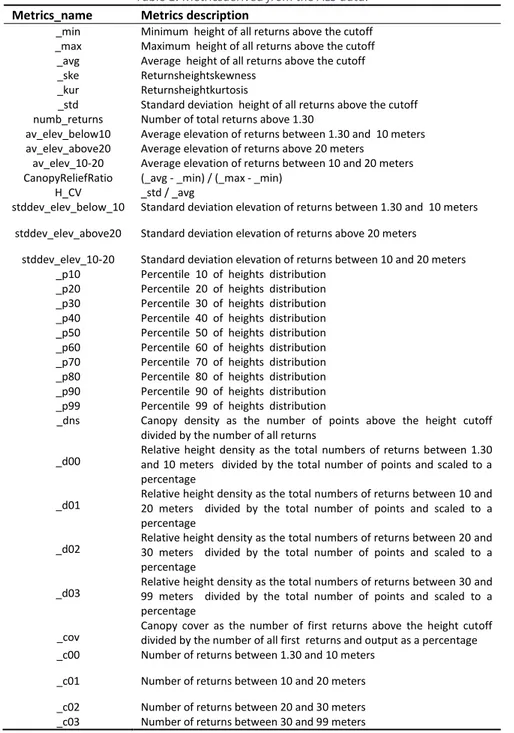
The object-oriented segmentation was performed using IDRISI Selva to delineate and classify polygons based on the raster images derived from the 4 IRS bands and from the 35 ALS metrics (Table 1).
Segmentation is the subdivision of an image into separated and homogenous regions, grouping adjacent pixels into image segments according to their spectral or metrics similarity.
The object-oriented procedure used three different classifiers: Linear Discriminant Analysis (LDA), Minimum Distance to Mean Classifier (MINDIST) and k-Nearest Neighbors (k- NN).
LDA is a supervised statistical method to find linear combinations of features that achieve good separation of classes. It makes some assumptions of normality and homoscedasticity over the data, and projects samples onto new coordinates that best discriminate classes.
30
These techniques may be convenient, each in very different types of problems (Charte at al., 2018).
MINDIST is a remote sensing classification system in which the mean point in digital parameter space is calculated for pixels of known classes, and unknown pixels are then assigned to the class which is arithmetically closest when digital number values of the different bands are plotted.
k-NN is an-parametric estimation method, which is well-documented for use with forest inventory data, for producing spatially contiguous predictions of forest attributes by combining field and remotely sensed data (Chirici et al., 2007).
Table 1: Metricsderived from the ALS data.
Metrics_name Metrics description
_min Minimum height of all returns above the cutoff _max Maximum height of all returns above the cutoff _avg Average height of all returns above the cutoff _ske Returnsheightskewness
_kur Returnsheightkurtosis
_std Standard deviation height of all returns above the cutoff numb_returns Number of total returns above 1.30
av_elev_below10 Average elevation of returns between 1.30 and 10 meters av_elev_above20 Average elevation of returns above 20 meters
av_elev_10-20 Average elevation of returns between 10 and 20 meters CanopyReliefRatio (_avg - _min) / (_max - _min)
H_CV _std / _avg
stddev_elev_below_10 Standard deviation elevation of returns between 1.30 and 10 meters stddev_elev_above20 Standard deviation elevation of returns above 20 meters
stddev_elev_10-20 Standard deviation elevation of returns between 10 and 20 meters _p10 Percentile 10 of heights distribution
_p20 Percentile 20 of heights distribution _p30 Percentile 30 of heights distribution _p40 Percentile 40 of heights distribution _p50 Percentile 50 of heights distribution _p60 Percentile 60 of heights distribution _p70 Percentile 70 of heights distribution _p80 Percentile 80 of heights distribution _p90 Percentile 90 of heights distribution _p99 Percentile 99 of heights distribution
_dns Canopy density as the number of points above the height cutoff divided by the number of all returns
_d00 Relative height density as the total numbers of returns between 1.30 and 10 meters divided by the total number of points and scaled to a percentage
_d01 Relative height density as the total numbers of returns between 10 and 20 meters divided by the total number of points and scaled to a percentage
_d02 Relative height density as the total numbers of returns between 20 and 30 meters divided by the total number of points and scaled to a percentage
_d03 Relative height density as the total numbers of returns between 30 and 99 meters divided by the total number of points and scaled to a percentage
_cov Canopy cover as the number of first returns above the height cutoff divided by the number of all first returns and output as a percentage _c00 Number of returns between 1.30 and 10 meters
_c01 Number of returns between 10 and 20 meters _c02 Number of returns between 20 and 30 meters _c03 Number of returns between 30 and 99 meters
31
The procedure was repeated for single IRS dataset and ALS datasets, and their combination (IRS + ALS).
Results and Discussion
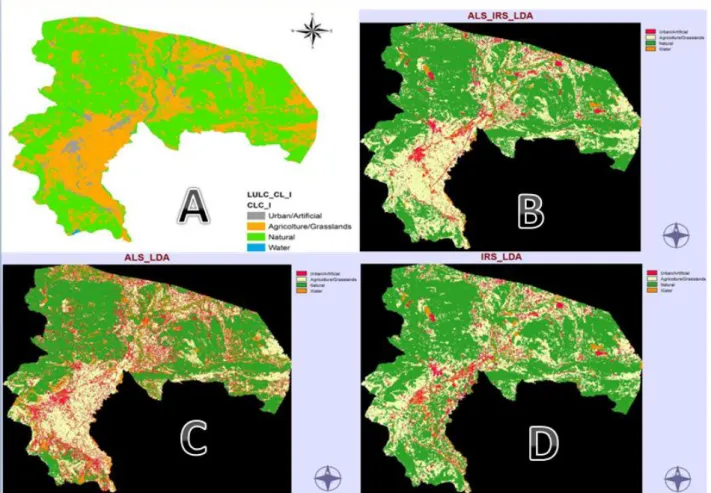
Nine maps are derived from the combination of three classifiers and tree datasets, but only maps derived from LDA have been showed (Figure 7), because resulted more accurate. The maps obtained from the three classification approaches were more fragmented than the original map.
Particular significant are the results obtained from the combined use of IRS and ALS data with LDA approach.
The landscape fragmentation mirrors the heterogeneity of forests (tree species composition and management systems) which are present in the investigated area.
Figure 7: Comparison of the Land Use classification according to the LDA approach. Map of Land Use Land Cover according the CLC level 1 (a); LDA classification based on the combined use of ALS+IRS (b); LDA classification based on the ALS data (c); LDA classification based on IRS data (d).
32
The classification algorithms LDA-based have yielded the best results when applied to individual ALS dataset and IRS dataset, but above all to the ALS + IRS combination (OA = 80%). Algorithms K-NN-based and MINDIST algorithms returned lower OA values both for individual datasets and their integration (Table 2)
.
They showed similar values of OA for the ALS and IRS separately, but if consider
the combined method with ALS and IRS together, k-NN results more suitable.
The heterogeneity of forest structure could represent a limit for the implementation of
these classification approaches.
Table 2 Result of OA for the 3 classificators using ALS dataset, IRS dataset and their combination.
IRS ALS ALS + IRS
MINDIST 48% 54%
61%
LDA
54% 63%
80%
KNN
49% 56%
73%
From this experience, although preliminary results are presented, some important conclusions can be drawn.
Neural networks based algorithms provided greater accuracy than other models, as well as the combination of ALS data and multispectral data compared to individual datasets.
The ALS data has greater advantages over the multispectral data only, which modestly improves the performance resulting from the use of only ALS data.
Conclusion
The increasing availability of data derived from ALS offers the potential to use this three-dimensional (3D) information, alone or in combination with satellite multispectral images, to automatically and accurately predict forest characteristics (e.g., tree height, single tree detection, stem diameter, basal area, stem volume, structure, biomass, carbon stock, etc.). The growing interest in ALS resides in the fact that this technology provides true 3D data of both the ground and canopy.
Compared with traditional methods used to assess forest attributes (comprising field inventories and conventional remote sensing techniques like photogrammetry), ALS data are more accurate, easy to be processed automatically and economically attractive (Eid et al.,2004; Holmgren, 2004; Næsset, 2002, 2005a, 2007, 2011).
33
Furthermore, ALS data can even provide additional attributes not retrievable by conventional (optical) remote sensing (Gobakken and Næsset, 2005).
Forest structure is a three-dimensional characteristic, comprising the lateral as well as the vertical distribution of the vegetation above the ground. Passive optical sensors are much less sensitive to vertical under-canopy structure than LiDAR instruments, which present a more under-canopy penetration potential.
One reason for this is that passive sensors only provide 3D data from areas in the forest canopies that are visible from more than one sensor position and that scatter back the sunlight. On the other hand, LiDAR is a range resolved technique, that gives for each emitted laser shot information on the distance to the backscattering objects, i.e. the canopy and understory elements, within the beam diameter (Montaghi et al.,2013).
This work has shown how LiDAR data and satellite data are reliable for classification of land use. Combined use of ALS and Satellite data results in better performance than the use of individual datasets. Even with simple classifiers an OVERALL ACCURACY of the 80%is obtained. Therefore, searching for a more refined classification approaches could be useful to improve the quality of results in terms of size and shapes of segments and to provide a more detailed thematic maps.
34
Testing the use of LiDAR sensor to reconstruct Digital Terrain Model
and Canopy Height Model in densely wooded areas
Introduction
The data from ALS are useful for monitoring in both built up (Murakami et al., 1999; Rottensteiner et al., 2007) and natural areas (Corona et al., 2012, Lim et al., 2003, Montaghi et al., 2013, Wulder et al., 2008).Howewer, the use of this data is often limited by the high costs of acquisition, (e.g., the rental of the aircraft and its crew).
Recently, improvements on the use of LiDAR for forestry application is became very common among forest managers. It offers unprecedented accuracy and is emerging as a preferred technique in the fields of forestry management and related operational activities. Moreover it allows to collect information on forest areas located in steeped mountains, where field data collection are difficult or impossible to obtain. The large amount of data that it provides are strongly helpful for forest management purposes. Nevertheless, its spatial field is limited respect to the satellite imagery, due to the weight of sensor and other remotely piloted aerial vehicles rules.
Often, LiDAR sensor are mounted on the ultra-light-helicopter or on unmanned aerial vehicles (UAVs). Since the costs for rent ultra-light-helicopter are rather expensive, recent technology advances of remote control and autonomous have led to more frequent use of UAVs such as e.g. remote sensing platforms equipped with active or passive sensors, especially for relief of small areas. The weight of LiDAR sensor impacts on the effectiveness of the UAVs, which requires a lot of energy to fly.
Only more recently the LiDAR systems have been miniaturized and made more lightweight in order to be transported on UAV platforms (Wallace et al., 2014).
These systems allow to fly at a smaller share and with a cruising speed reduced, if compared with the manned aircraft, thus returning a greater density of points (echoes/m2). This aspect is of considerable importance, especially in forestry applications (Jaakkola et al., 2010 ). This work aims to test the use of LiDAR sensor to detect Digital Terrain Model (DTM) and Canopy Height Model (CHM) in the densely wooded areas, using lightweight platform. The comparison between the DTM obtained from CTR and ALS data was made.
35
Study area
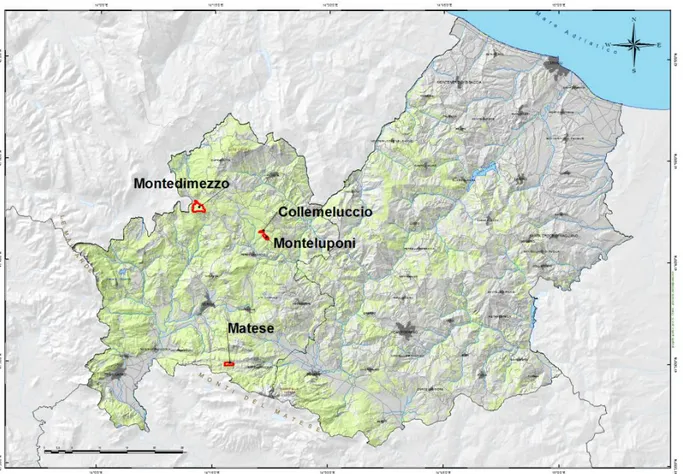
The LiDAR data were acquired in four case study areas (Figure 8) in the Molise Region (Fig. 8): (i) Montedimezzo forest; (ii) Collemeluccio forests; (iii) Monteluponi forest; (iv) Matese forest, covering more than 410 ha.
Montedimezzo forest is natural reserve located in Molise, in the province of Isernia, which includes about 300 hectares belonging to the territory of the municipality of Vastogirardi. It was established in 1977 and since then is a reserve of strategic importance included in the UNESCO International Program MAB - Man and Biosphere (Man and Biosphere).
The vegetation is arboreal, with prevalence of oak (Quercus Cerris L.) and beech (Fagus
sylvatica L.), two species that dominate one another on the basis of slope, altitude,
pedological substrate and microclimatic variations. The oak grows predominantly on clayey and marnious substrates, with intermediate climatic conditions and with drought-tolerant times.
The Collemelluccio Natural Reserve is a protected natural area of the Molise Region, in the province of Isernia. It is entirely in the municipal area of Pescolanciano and covers an area of347 ha.
It was established in 1971 and is a UNESCO Man and Biosphere Reserve, an internationally recognized UNESCO environmental conservation and protection center, within the Man and Biosphere Program.
Collemeluccio forest is characterized by more than 80% of the silver fir (Abies alba Mill.), with spontaneous formations such as the wreck of the ancient abetines that in the centuries and millenniums back covered the Apennine ridge and that today, as well as Molise, they find themselves with small patches in Abruzzo, Tuscany and Calabria. In this particular reality, past management, based on moderation of cuts and their distribution over the entire surface of the forest, has resulted in a good conservation of the silver fir.
Matese forest is comprised of two regions (Molise and Campania) and four provinces (Campobasso, Isernia, Caserta and Benevento).
The flora varies according to the altitude with beech and silver fir at high and middle altitudes, and chestnut (Castanea sativa Mill.) and oak, particularly turkey oak and downy oak (Quercus pubescent Willd.), at lower altitudes. In addition, holm oak (Quercus ilex L.) forests are located in the sunny watersheds at lower altitudes.
36 Figure 8: Four case study areas in Molise Region: Montedimezzo, Collemeluccio, Monteluponi and Matese.
Materials and methods
The sensor (Figure 9) used has dimensions of 15x15x15 cm and a weight of 2 kg, and is capable of recording up to 3 return echoes per pulse, with absolute accuracy of 15 cm.
37
The sensor was set with a maximum scan angle of 50 (FOV: field of view), and a pulse frequency of 20 kHz, resulting in an average density of 30 pulses/m2 for single strip-run. The sensor has been mounted on a small ultra-light helicopter (Figure 10).
Figure10:LiDAR sensor mounted on a small ultra-light helicopter, used for this study..
LiDAR data were collected in two different days during the summer season in 2013.
The average density of the returning echoes in strip of acquisition was found to be about 50 points/m2. The data acquired in the individual strips were subjected to a pre-processing phase using the software CloudCompare (CC). The pre-processing phase aimed to aligning and normalize the strips (Figure 11). In order to describe the alignment procedure we considered only two strips between their contiguous labeled namely L0 and L1.
Hereinafter all steps for the alignment procedure are listed:
Fix the reference strip (for example L0);
Identify the common area to crawl L0 and L1 as L0L1;
Apply the alignment procedure, implemented the joint portion between the two strips (L0L1). The result of this procedure is an array of roto-translation;
Apply the roto-traversing the strip L1, renamed L1fit;
As the number of strips increases the alignment operation is carried out between the strip Li + 1 and the common portion of the latter aligned with the portion of L0fitL1fit ... L1fit.
Considering the two strips (L0 and L1fit) the alignment operation tends to minimize the overlay error between the two strips.
This is equivalent to saying that the optimization will be maximum in the overlapping area while it might show some inconsistency in areas distant from that of the overlap.
38 Figure 11: Example of strips and Unaligned-Aligned problem..
The ALS data were processed with lastools in order to create DTM and CHM.
In particular, the tolls used were: lasground (to classify LIDAR airborne points into ground points and non-ground points); blast2dem (to triangulate points a seamless TIN, and to raster the TINonto a DEM); and lascanopy (to compute height and other popular forestry metrics, and grids them onto a raster).
Results and Discussion
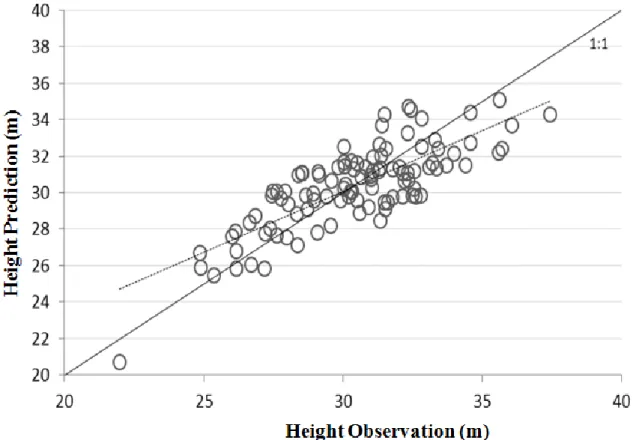
The preliminary comparison between the two DTM (by CTR and ALS) has allowed to underline a good correlation between the two albeit with an underestimation average of approximately 10 m of the one from ALS compared to that from CTR (Figure 12). This difference is probably caused by a bias in the CTR, since the study areas are often completely under crown cover and the DTM from CTR is obtained by photogrammetric procedure from aerial stereograms.
The average height of the trees within the plot area of 1 ha in Montedimezzo was estimated with a relative error of 5%, 29,02 m to 27,55 m CHM against the second pads to the ground. The comparison to single tree was significant only using a CHM with step 5 considering the plants with dominant height.
39 Figure 12: Graph of the result derived from ALS data.
The acquired experience has allowed us to optimize the technique of acquisition and pre-processing of data ALS (Figure 13) in areas with complex morphology. The sensor demonstrated its potential use in forestry, accurately estimating the average height of the vegetation, main parameter for the study of forest stands by ALS.
Figure 13: Graphical representation of the cloud points in FugroViewer software (a and b). Example of pre-processing ALS data in areas with complex morphology with lasviewsoftware (c).
Further experiments currently underway are designed to assess the accuracy of the data acquired in winter phenological conditions and the use of LiDAR sensor installed on UAV.
40
Conclusion
DTM is crucial for the characterization of a forest area and the estimation of forest parameters such as height of the trees.
The important techniques presented and the practical experience gained allow us to outline new scenarios in the monitoring of the territory.
Recent technological innovations such as the autocorrelation of digital images, the use of inertial and GNSS platforms, the availability of more and more refined satellite sensors and the new data processing techniques, offer new high quality products while delivering high precision , allow you to get information on vast land extensions in a short time and with limited investment.
This work has demonstrated the validity of the acquisition of LiDAR data by the use of an ultra-light vehicle.
Utilizing ALS data for DTM construction in densely wooded areas and for tree heights estimation has yielded excellent results.
This work has also laid the foundation for the use of drones for the acquisition of ALS data through LiDAR tools.
41
Combine ALS data, multispectral images and CHM to detect forest
variables
Introduction
In recent decades, the use of LiDAR sensors has been widely used to study forest resources. The rapidity and the ability to acquire large area data, even unavailable, by integrating land-based sampling data, have encouraged the development and diffusion of remote sensing techniques to evaluate the state of the forests (Valbuena et al.,2016; Valbuena et al.,2017)through monitoring of sustainable forest management indicators (e.g. biomass above ground, tree species composition).
Monitoring of forest ecosystems and their management are always current issues and require continuous studies in order to simplify the data acquisition and at the same time ensure high reliability of the collected information (McRoberts & Walters, 2012).
Increased interest in forest resources, both in terms of biodiversity conservation and adaptation to climate change, as regards the exploitation of the short chain and the production of energy from renewable sources, highlight the need to develop innovative methodologies for monitoring the state of forest resources by supporting more sustainable forest management of these resources.
Several studies (Chirici et al., 2016; Lim et al.,2001) have shown that LiDAR technology is a reliable and valuable remote sensing tool for collecting and evaluating forest structural parameters and sustainable forest management indicators.
The use of multispectral images data and laser scanner data has become increasingly common among the forestry sector with several applications for monitoring and planning support (Lasserre et al., 2011; Maselli et al., 2014; Montaghi et al., 2013).
The remarkable amount of data that can be obtained through the elaboration of the points cloud has opened new horizons for the use of drones to support forestry management by agreeing to both scholars of forestry and forest owners and managers of forests (Chirici et al., 2011; Mura et al.,2015).
Many studies have focused attention on the assessment of structural diversity, particularly on the vertical layering, while there is still a great amount of work to be able to assess the
42
specific diversity of forests and other biodiversity indicators(Coops et al., 2016; Danilin, I.; Medvedev, 2004; Mura et al.,2016).
This technology has therefore been a major and fundamental support in the study of forest biodiversity, which is made even more apparent by the important role played by the structural forest diversity (Antonarakis et al.,2008; Næsset, 2005).
The present work aims to demonstrate the validity of using LiDAR data and multispectral optical images for estimating forest management indicators to be applied to large-scale monitoring
Materials and Methods
Study area
The study area (Figure 14) is located in the southwestern part of Molise Region in central Italy and includes 360 km2. Forests are spread over 200 km2, comprising approximately 56% of the area. Deciduous oaks ( cerris L. and Quercus pubescens Willd.) cover most of the forest area (60%), while hop hornbeam (Ostrya carpinifolia) and beech (Fagus sylvatica L.)forests cover approximately 18% and 9% respectively. the most common forest management systems for the oak and hop hornbeam forests in this area is coppice with standards. This forest management system is very common belonging the Molise Region (Garfì, & Marchetti, 2011), and it is very representative of private forests. Coppice systems consist of stands that originate from stool shoots or suckers of vegetative origin.