1
UNIVERSITÀ DEGLI STUDI DI CATANIA
DIPARTIMENTO DI SCIENZE BIOLOGICHE, GEOLOGICHE E AMBIENTALI
Dottorato di Ricerca in
Scienze Geologiche, Biologiche e Ambientali
- XXIX CICLO -
Marisa Giuffrida
MAGMA STORAGE, ASCENT AND DEGASSING HISTORIES
TRACED BY TEXTURES AND CHEMICAL ZONING IN
CRYSTALS: APPLICATION TO THE CO2-RICH BASALTIC
SYSTEM OF MT. ETNA VOLCANO
Tutor
Prof. Marco VICCARO
Coordinatore del Dottorato di Ricerca Prof. Agata DI STEFANO
2
MAGMA STORAGE, ASCENT AND DEGASSING HISTORIES TRACED BY TEXTURES AND CHEMICAL ZONING IN CRYSTALS:
APPLICATION TO THE CO2-RICH BASALTIC SYSTEM OF MT. ETNA VOLCANO
Marisa Giuffrida
INDEX
1.
INTRODUCTION 52.
MT. ETNA: A CASE STUDY FOR UNDERSTANDING MAGMADYNAMICS IN CO2-RICH BASALTIC SYSTEMS 10
2.1. Brief history of Mt. Etna 10
2.2. The eruptive activity between January 2011 and April 2013 14
3.
CONSTRAINING THE NATURE AND TIMESCALES OF MAGMATICPROCESSES 19
3.1. Strategy of investigation 19
3.2. Sampling and selection of the volcanic products 20
3.3. Analytical procedures 22
3.3.1 Whole rock analyses 22
3.3.2 In-situ microanalytical data 22
3.4. Geochemical and petrological characterization of volcanic rocks 26
3.4.1 Bulk rock geochemistry 26
3.4.2 Petrography and chemistry of minerals 32
3.5. Textural and compositional features of plagioclase and olivine crystals 37
3
3.5.2 Minor and trace element zoning in plagioclase and their
relation with major element variations 42
3.5.3 Lithium compositional gradients in plagioclase 53
3.5.4 Olivine chemical zoning patterns 55
3.6. Discussion 62
3.6.1 Evidence of magma evolution throughout the 2011-13 activity of
Mt. Etna 62
3.6.2 The importance of investigating mineral textures and zoning 65 3.6.3 Processes controlling major, minor and trace element zoning in
plagioclase 67
3.6.4 Crystallization conditions and magma dynamics inferred from
chemical zoning and textures of plagioclase 70 3.6.5 Magma storage zones and recharging processes inferred from
olivine compositional zoning 77
3.6.6 Time constraints of magma residence and transfer by modeling
the chemical zoning of plagioclase and olivine crystals 92
3.6.6.1 Plagioclase residence time in the plumbing system of Mt. Etna 93
3.6.6.2 Fe-Mg diffusion modeling in olivine crystals and timescale of
magma storage and recharge beneath Mt. Etna 101
3.6.7 The origin of lithium chemical gradients in plagioclase crystals 110
3.6.7.1 Lithium diffusion and timescales of magma degassing 115
3.6.8 General picture of Mt. Etna dynamics beneath the New South
East Crater 118
4.
UNDERSTANDING THE INFLUENCE OF CARBON DIOXIDE ONMINERAL STABILITY DURING MAGMA STORAGE AT
INTERMEDIATE AND SHALLOW CRUSTAL LEVELS 121
4.1. Introduction 121
4.2. Experimental methods 122
4.2.1 Anhydrous glass synthesis 122
4
4.2.3 Crystallization and flushing experiments in Internally Heathed
Pressure Vessels [IHPV] 125
4.3. Analytical methods 129
4.3.1. KFT measurements of H2O content in initial hydrous glasses 129
4.3.2. Determination of sample fluid compositions after experiments 130
4.3.3. Electron Microprobe Analysis (EMPA) 132
4.4. Experimental Results 132
4.4.1 Mineral assemblage and composition of the post-run hydrated
products 132
4.4.2 Mineral assemblage and composition of the products after CO2
flushing 133
4.4.3 Composition of the experimental glasses 138
4.5. Discussion 140
4.6. Implications on natural samples 144
5.
CONCLUDING REMARKS 1495
MAGMA STORAGE, ASCENT AND DEGASSING HISTORIES TRACED BY TEXTURES AND CHEMICAL ZONING IN CRYSTALS:
APPLICATION TO THE CO2-RICH BASALTIC SYSTEM OF MT. ETNA VOLCANO
1. INTRODUCTION
Continuous advancement in the quality of geophysical methods and accessibility of in-situ analytical techniques during the last twenty years has led to an exponential increase in the knowledge of the geometry of volcanic feeding systems and of the processes of magma emplacement, transfer and degassing that catalyze an eruption. Among the multiple techniques of investigation of plumbing system dynamics, analysis of textures and chemical zoning in minerals has been established as one of the most efficient tools (e.g. Davidson et al., 2001; 2007; Ginibre et al., 2007; Humphreys et al., 2006; Morgan and Blake, 2006; Streck, 2008; Viccaro et al., 2010; 2012; 2016a; Kahl et al., 2011; 2013; 2015). Minerals can be highly sensitive to gradual or sudden changes in the volcanic system, and for this reason, decades ago, they started to be employed as archives of magmatic processes (i.e. Larsen et al., 1938). With development of high- precision in-situ analytical techniques, such as electron microprobe (Castaing, 1951), ion microprobe (Slodzian, 1964), laser ablation mass spectrometry (Ginibre et al., 2007), and microdrilling (Davidson et al., 2007), it became evident that crystals preserve a huge source of information in their textural and compositional zoning, providing evidence for changes in chemical (i.e. melt and fluid composition) and/or physical (i.e. temperature,
6
pressure and oxygen fugacity) conditions of the magmatic system during their growth history (Singer et al., 1995; Wallace and Bergantz, 2002, 2004; Ginibre et al., 2007; Streck, 2008; Viccaro et al., 2010; Kahl et al., 2011, 2013).
Additionally, diffusion chronometry applied to compositionally zoned crystals has proved to be valuable for determining the timescales that lead to such changes (e.g., Zellmer et al., 1999; 2003; Costa et al., 2003, 2008; Costa and Chakraborty, 2004; Costa and Morgan, 2010; Morgan et al., 2004; Morgan and Blake, 2006; Kahl et al., 2011, 2013, 2015; Druitt et al., 2012; Viccaro et al., 2016a, 2016b). Measurements of compositional gradients in minerals and glasses have been used to quantify the timing of residence and ascent of magma bodies, as well as of magma chamber processes (e.g. addition of new melts and mixing), over periods >105 years (e.g., Zellmer et al., 1999, 2003; Costa and
Chakraborty, 2004; Morgan et al., 2004; Morgan and Blake, 2006). More recent innovations in geochemical analyses, such as secondary ion mass spectrometry (SIMS), permit measurement of a variety of trace elements (e.g. Li and B) that are inaccessible by other analytical techniques, but are crucial for the study of late-stage degassing processes that occur just prior to or during the eruption (e.g. Genareau et al., 2007; Genareau and Clarke, 2010; Charlier et al., 2012; Cabato et al., 2013).
However, studies of volcanic processes rarely attempt to decipher the time-space relationships among multiple pre-eruptive processes by integrating different types of data (i.e., in-situ major and trace elements, chemical diffusion, textural heterogeneities) on more than one single mineral phase. Indeed, many different events are generally involved at the same time in the petrogenesis of volcanic rocks. This makes complex the quantification of the rates at which many important processes operate, from the early
7
stages of magma ascent to eruption, and therefore limits a full understanding of how a volcano works.
To properly interpret the textural and compositional records preserved in magmatic crystals, awareness of the role of volatile species is also needed because of the profound influence volatiles have on melt properties and phase equilibria (Sparks and Pinkerton, 1978; Sparks, 2003), and consequently on magma ascent dynamics and styles of eruption
(Papale and Dobran, 1994; Papale et al., 1998; Blundy and Cashman, 2001; Sparks et al.,
2003; Cashman, 2004). Typically, the composition of magmatic volatiles is dominated by H2O and CO2. These two components behave quite differently in the melt during ascent,
as a result of their strong pressure-dependent and contrasting solubilities (e.g., Holloway and Burnham, 1972; Holloway, 1976; Burnham, 1979; Webster et al., 1999; Lowenstern, 2001; Newman and Lowenstern, 2002; Shishkina et al., 2014b; Witham et al., 2012). In the last decade, understanding the behavior of mixed volatile components,especially H2O
and CO2, during magma ascent has become an important aspect of experimental studies
aimed at unraveling the effects of ascent rates on kinetics of magma vesiculation, crystallization and eruption (e.g. Mourtada-Bonnefoi and Laporte, 2002; Cichy et al., 2011; Pichavant et al., 2013; Riker et al., 2015; Fiege et al., 2015). In spite of the increasing interest in reproducing crystallization paths of multicomponent volatile-bearing systems,previous studies did not address changes in crystal stability in response to variations in the CO2 proportion of the magmatic system. The interpretation of textural
and compositional features of crystals has been so far conducted through experimental reproduction of processes of crystal dissolution/resorption or growth in presence of a pure-H2O magmatic fluid phase (e.g. Logfren, 1974, 1980; Kirkpatrick, 1981;
8
Tsuchiyama and Takahashi, 1983; Tsuchiyama, 1985; Housh and Lurh (1991); Kawamoto, 1992; Hummer and Rutherford, 2002), whilst the influence of CO2 on mineral
textural and compositional changes has been generally neglected and, at present, it is still not understood.
Such general lack of information precludes a proper interpretation of natural samples. In particular, it makes problematic the study of CO2-rich magmatic systems,
where the deep exsolution of CO2 and its flushing at shallow levels may play a dominant
role in triggering eruptions. In this regard, several authors have provided evidence that sudden onset of explosive activity at CO2-rich basaltic volcanoes is directly associated
with fast ascent of CO2 from the deep plumbing system (Aiuppa et al., 2007, 2010b;
Cannata et al., 2008; Ferlito et al., 2014; Shinohara et al., 2008; Allard, 2010;Pichavant et
al., 2013).Among basaltic systems largely enriched in CO2, Mt. Etna volcano has been
particularly distinguished in the last decade for its recurrent, high-energy eruptions. The paroxysmal activitybetween 2011 and 2013 at the volcano summit represents one of the most impressive chapters in the history of Mt Etna, which produced in this period more than 40 paroxysmal episodes with sustained lava fountains and eruptive columns of several kilometres.
This study offers an innovative petrological approach that combines the textural, chemical and temporal records of magmatic crystals with experimental simulations to produce a realistic spatial-temporal reconstruction of magmatic dynamics that precede and accompany the beginning of paroxysmal eruptions at Mt. Etna between 2011 and 2013. Selection of Mt. Etna as case-study provides the opportunity to evaluate modes and timescales of magma transfer across a very dynamic and complex plumbing system. The
9
investigation of this recent paroxysmal activity also allows focus on factors controlling explosivity at basaltic volcanoes through investigation of less commonly explored evolutionary dynamics of magmas (e.g. processes of CO2 flushing) during storage in deep
and shallow reservoirs.
Topics of this study have been handled following two main tasks of investigation. The first task aims to constrain the nature of the plumbing system dynamics (e.g. storage conditions, intrusion and mixing, degassing) and their space-time relationships during the 2011-2013 eruptive sequence. This required a detailed investigation of the textural and compositional characteristics of crystals in terms of major, minor and trace element zoning, along with a thermodynamic analysis of the system and the definition of time constraints through diffusive chemical equilibration of crystal zoning.The second task of investigation includes crystallization experiments on H2O+CO2-bearing K-trachybasalts
of the post-2011 activity of Mt. Etna, with the aim to test the influence of CO2-flushing
on mineral stability and melt chemistry during storage in the intermediate and shallow plumbing system.
Topics and tools introduced in this study allow development of a comprehensive model of the plumbing system dynamics at Mt. Etna and offer the basis for a better comprehension of the chemical and physical processes driving the eruption onset at basaltic volcanoes enriched in CO2. Relevance of this study mainly relies on the
quantification of volcanic processes at depth that may have considerable consequences in development of unusual, high-energy eruptions at basaltic volcanoes that are, otherwise, acknowledged to be characterized by weak to mild explosive activity.
10
2. MT. ETNA: A CASE STUDY FOR UNDERSTANDING MAGMA DYNAMICS IN CO2-RICH BASALTIC SYSTEMS
2.1. Brief history of Mt. Etna
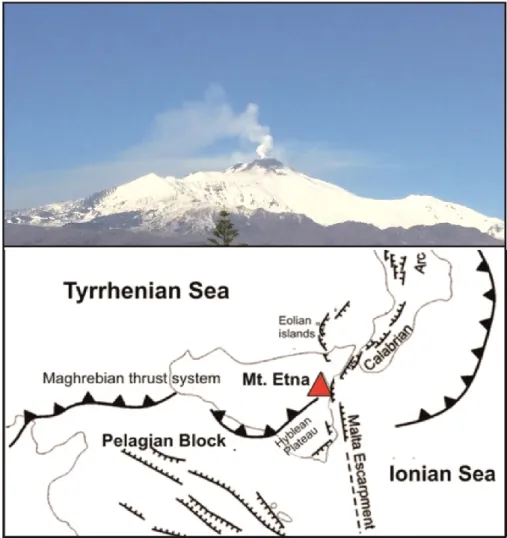
Mt. Etna is a persistently active open-conduit volcano that rises up 3329 m a.s.l. on the eastern coast of Sicily (Southern Italy). The volcano lies at the intersection of three structural domains: the Apennine - Maghrebian overthrust belt system, the Hyblean Plateau and the oceanic Ionian domain (e.g., Cristofolini et al., 1985; Ciliberto et al., 2009; Fig.1). In this area, processes of extensional tectonics are active, as evidenced by the presence of several eruptive fissures and deep normal faults, cutting a ~22 Km thick continental crust, that accommodate extensional processes at a regional scale (Monaco et al., 1997).
Over centuries, Mt. Etna has produced both effusive and explosive eruptions with predominant emissions of tholeiites and OIB-type alkali basalts. The volcanic activity began ~600 ka ago with effusion of submarine tholeiitic pillow lavas, followed ~300 ka ago by the eruption of subaerial tholeiites, which still outcrop on the southern flanks of the volcano (Branca et al., 2008). Composition of erupted magmas changed to transitional, and then become Na-alkaline ~220 ka (e.g., Cristofolini and Romano, 1982; Tanguy et al., 1997; Viccaro and Cristofolini, 2008; Viccaro et al., 2011). The first evidence of explosive eruptions dates back to 122-130 ka to the building of central-conduit edifices that occurred with cycles of Strombolian and Plinian eruptions (cf. Branca et al., 2008). At present, traces of the volcanic centers related to this phase of activity are visible in the Valle del Bove depression. Activity in the last 15 ka has
11
displayed very variegate eruptive styles, including central and fissure flank effusions, moderately explosive summit eruption ranging in style from Strombolian to lava fountaining and, more rarely, exceptionally violent explosive episodes (sub-Plinian to Plinian eruption) that produced several pyroclastic deposits (Coltelli et al., 1998).
composition
Figure 1. View of the southeastern flank of Mt. Etna volcano (top) and its geodynamic framework
12
Compositions of these products span from picritic and alkali basalt to trachytes, with hawaiites being the dominant rocks (D’Orazio et al., 1994). Historic eruptions in the last few centuries were dominantly effusive, producing primarily subaphyric to mildly porphyritic hawaiites; however, the magma chemistry and eruptive behavior have changed significantly over the last four decades. Indeed, Etna has been increasingly more active since 1971, showing higher eruption frequency and output rate (Hughes et al., 1990; Branca and Del Carlo, 2005; Bonaccorso and Calvari, 2013). Erupted lavas have also evolved compositionally, becoming more basic and richer in alkali elements and Sr and B isotopes. In contrast, Th and Nd-Pb-Hf isotope ratios are more depleted than the former lavas (e.g., Tanguy et al. 1997; Clocchiatti et al. 2004; Metrich et al., 2004; Viccaro and Cristofolini, 2008; Viccaro et al. 2011; Correale et al., 2014). Changes of the product chemistry toward K-trachybasaltic compositions were observed particularly after the 2001 A.D. and have been attributed to progressive replenishment of the plumbing system by more alkaline, volatile-rich magma with a new geochemical signature (cf. Clocchiatti et al. 2004; Métrich et al. 2004; Rizzo et al. 2006; Viccaro et al. 2006; Corsaro et al. 2009; Ferlito et al., 2012; Nicotra and Viccaro 2012a).
The volcanic activity during the last 20 years has displayed more explosive behavior, with spectacular explosive flank eruptions, such as in 2001 and 2002-2003 (Andronico et al., 2005) and an increasing number of paroxysms at the summit craters (Allard et al., 2006; Bonaccorso and Calvari, 2013; Viccaro et al., 2014, 2015). Main paroxysmal episodes occurred at the South East Crater (SEC) between September 1998 and February 1999 (23 events) and between January and June 2000 (64 events; La Delfa et al. 2001; Andronico and Corsaro 2011). Later, another short sequence of paroxysms
13
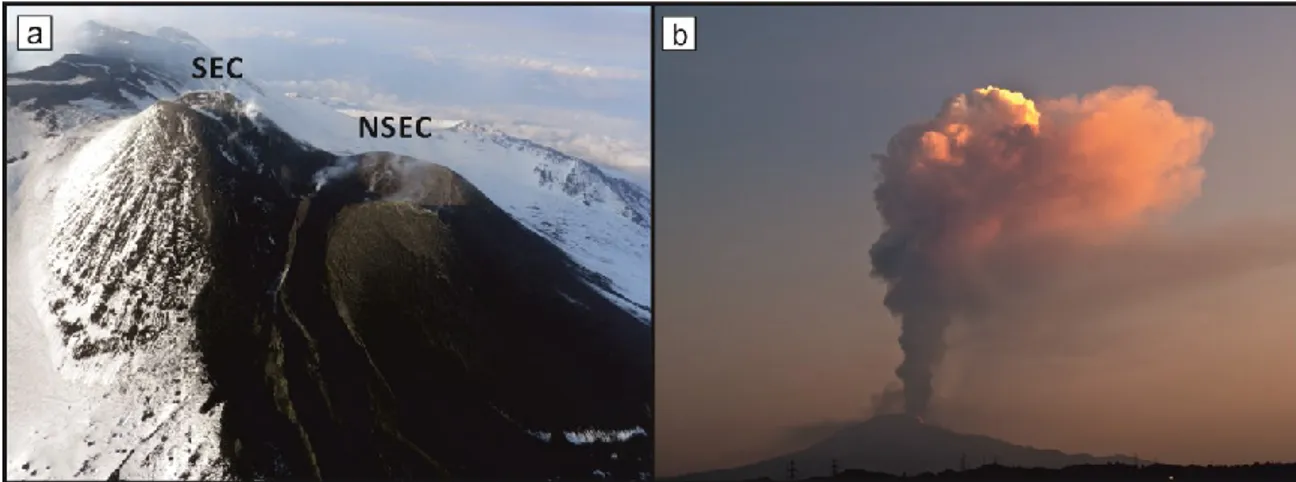
took place during the period March - September 2007, with a limited series of 7 eruptions at the SEC (Andronico et al. 2008). Since 2011, the main site of activity has moved to a newly formed summit crater, i.e. the New South East Crater (NSEC; Behncke et al.; 2014) that was the locus of a long sequence of paroxysmal episodes between 2011 and 2013 (Fig. 2). The episodes that took place at the NSEC have shown similarity with the series of paroxysms that occurred at the South East Crater (SEC) during 1998-1999, 2000 and 2007 A.D. for what concern the general evolution of the eruptive phenomena that always started with increasing Strombolian explosions evolving to sustained lava fountains. The fountaining phase typically extinguished in few hours, but often occurred together with lava flow emissions.
Figure 2 . a) Aerial view of the Etna’ New South East Crater (NSEC ) and the nearby South East Crater
(SEC) at the date of March 4, 2013. The South East cone, on the left side, last erupted on May 2007, whereas the New South East Crater cone, on the right, has entirely grown between 2011 and 2013; photo provided by INGV-Osservatorio Etneo (www.ct.ingv.it); b) Eruptive column produced during the culminating phase of the August 12, 2011 paroxysmal episode, seen from Catania. Photo by Marco Viccaro, University of Catania..
14
After a brief period of dominantly effusive behavior that followed the 2011-2013 paroxysmal sequence, Mt Etna has had new exceptionally violent paroxysmal episodes during the months of December 2015 and May 2016. Eruptions took place at the summit crater Voragine that was the site of some of the most explosive episodes recorded during the last two decades, producing several kilometers-high eruptive columns and lava fountains more than 1 km in height. Episodes of severe ash and tephra fall-out affected the volcano flanks and, in the case of the most energetic eruptions (i.e. the paroxysm of December 3, 2015), the dispersion of a huge amount of ash also forced the shutdown of the nearby airport of Catania for hours.
2.2. The eruptive activity between January 2011 and April 2013
The spectacular sequence of lava fountaining that occurred in the period 2011-2013 led to the formation of a large cone, called the New South East Crater (NSEC; Fig.2; Behncke et al.; 2014), in a relatively short time span. With a 44 paroxysmal events between January 2011 and December 2013 (38 at the date of April 27, 2013,which are the focus of the present work; Table 1), this young summit crater could be likely considered the most important expression of high explosivity at Mt. Etna of the last decade.
The NSEC began to grow on November 6, 2009, after a ̴ 5 m-wide pit crater opened at the southeastern base of the SEC. During the months of April and May 2010, the bottom of the pit-crater underwent progressive widening and deepening, rapidly evolving into a new summit crater. After eight months of rest, the NSEC erupted again on January 2–3, 2011 with low-intensity Strombolian explosions that were accompanied by pulsating
15
emission of gasses. An increase in activity was observed on January 11, with cycles of explosions becoming progressively more powerful and close in time until the evening of January 12. At 22.00 (Local Time UTC+1), Strombolian explosions abruptly increased in intensity and frequency, finally culminating in sustained lava fountains. The paroxysmal phase lasted about 2 hours and was accompanied by lava flow emission from the crater and conspicuous ash-lapilli fallout on the eastern flank of the volcano. At around 23.30 (Local Time UTC+1), the activity rapidly declined and ended after a series of weak Strombolian explosions.
All the 38 episodes between January 2011 and April 2013 that follow this first paroxysmal eruption had similar main characteristics, although they differed in intensity and duration (see Table 1): in all the cases, paroxysmal activity started with increasing Strombolian explosions, evolving in short times to lava fountaining and sustained eruptive columns, having average height of 5-6 km. Most of the events lasted less than 24 hours, considering the time span from the beginning of intensification of the Strombolian activity to the end of eruption (Behncke et al. 2014; Viccaro et al., 2014, 2015). Average duration of the paroxysmal phases during the entire 2011–2013 period vary between 20 minutes and a couple of hours, with some exceptions of paroxysmal phases lasting more than 5 h (e.g., the episodes of February 18, April 10 and July 24, 2011, and the February 9, 2012 eruptions; Behncke et al., 2014; Table 1). Some of the main differences among the paroxysmal eruptions also concern the duration of the Strombolian activity preceding the lava fountaining (cf. Viccaro et al., 2015). In this regard, some events showed slow intensification of the Strombolian activity, which often lasting for a long time (up to some days); other episodes exhibited very fast evolution of the eruptive phenomena, reaching
16 N° ofthe
event Date of the event
Start of the paroxysmal phase (GMT) End of the paroxysmal phase (GMT) 1 January 12, 2011 21:50 22:55 2 February 18, 2011 3:30 14:30 3 April 10, 2011 8:00 14:00 4 May 12, 2011 2:00 6:10 5 July 9, 2011 13:45 15:30 6 July 19, 2011 0:00 2:30 7 July 24, 2011 2:30 6:30 8 July 30, 2011 19:30 21:30 9 August 5, 2011 21:30 0:15 10 August 12, 2011 8:30 10:25 11 August 20, 2011 6:55 7:50 12 August 29, 2011 4:05 4:50 13 September 8, 2011 6:30 8:45 14 September 19, 2011 12:20 13:00 15 September 28, 2011 19:31 20:10 16 October 8, 2011 14:30 17:45 17 October 23, 2011 18:30 21:15 18 November 15, 2011 11:19 12:42 19 January 5, 2012 5:25 7:00 20 February 9, 2012 0:30 5:30 21 March 4, 2012 7:30 9:32 22 March 18, 2012 7:15 9:59 23 April 1, 2012 2:00 3:30 24 April 12, 2012 14:10 15:20 25 April 24, 2012 1:30 2:15 26 February 19, 2013 3:42 5:02 27 February 20, 2013 0:45 2:34 28 February 20, 2013 13:20 14:30 29 February 21, 2013 n.d. n.d. 30 February 23, 2013 18:20 19:20 31 February 28, 2013 10:10 11:00 32 March 5, 2013 23:20 0:10 33 March 16, 2013 17:50 18:10 34 April 3, 2013 14:00 15:35 35 April 12, 2013 04:00 12:00 36 April 18, 2013 11:00 13:15 37 April 20, 2013 15:13 16:40 38 April 27, 2013 16:30 20:00
Table 1 - List of the 38
paroxysmal eruptions occurred during the 2011-2013 period (at the date of April 27). Timing for the start and end of the paroxysmal phase of each event has been derived from the multidisciplinary reports of the INGV - Osservatorio Etneo available at www.ct.ingv.it.
17
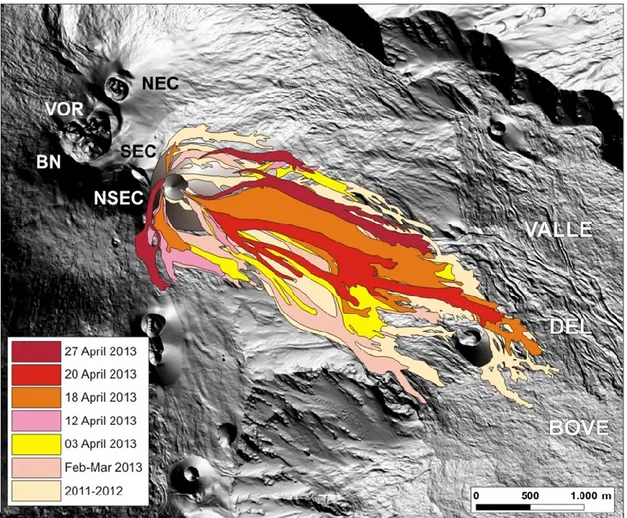
the paroxysmal phase after just few hours of Strombolian activity. Lava fountaining phases were also generally coupled with emplacement of rheomorphic lava flows descending the Valle del Bove flanks for several kilometers (Calvari et al., 2011; Bonaccorso and Calvari, 2013). On 27 April 2013, the continuous superimposition of lava flows generated during paroxysmal eruptions produced a huge lava flow field on the northwestern side of the Valle del Bove depression (Fig.3), yielding important morphological modifications of the landscape on and around the summit area of Mt. Etna. It is also interesting to note that the frequency of the paroxysmal eruptions was not constant over the 2011-2013 eruptive period; 25 episodes took place from January 2011 to April 2012 and, after ~10 months of rest, a further 13 events were recorded between February and April 2013 (cf. Viccaro et al., 2015). Moreover, the time gap between eruptions strongly changes over time; during the first half of 2011 and from November 2011 to the first episode of 2012 (on January 5), paroxysms occur with low frequency of 4-8 weeks. In this period, only two eruptions in July 2011 occur within a limited time span of 6 days (e.g. the events of July 24 and 30, 2011). In this circumstance, also the intensity of volcanic activity was strongly amplified. The short paroxysmal sequence of 2012 has average recurrence time of about two weeks. Eruptive phenomena from February 2013 displayed an unusually high frequency of occurrence; the first five episode of 2013 were separated by only 36 hours, whereas the subsequent eight episodes (until April 27, 2013) had inter-eruptive period between 2 and 10 days.
18
Figure 3. Lava field formed by single flow units emitted between January 2011 and April 2013, as resulted
from the GPS survey performed by Behncke et al. (2014). The map also reproduce the location of the summit craters. NSEC: New South East Crater; SEC: South East Crater; BN: Bocca Nuova; VOR: Voragine; NEC: North East Crater.
19
3. CONSTRAINING MODES AND TIMESCALES OF MAGMATIC PROCESSES
3.1 Strategy of investigation
One of the primary targets of the present work is a detailed definition and quantification of the physical and geochemical magmatic processes driving the eruption onset for the recent 2011-2013 paroxysmal episodes at Mt. Etna. To accomplish these goals, the present study first focused on relevant petrographic and mineral chemical characteristics of a total of 88 lava samples, which represent the paroxysmal sequence that occurred between January 2011 and April 2013 (eruptive episodes listed in Table 1). On selected samples, attention has been mainly focused on textural and in-situ compositional analysis of minerals sensitive to chemical and physical variations of the magmatic system, mainly plagioclase and olivine. Crystals from representative paroxysms within the period under investigation have been analysed using multiple in-situ analytical approaches (i.e. SEM-EDS/WD, LA-ICP-MS, SIMS) with the aim to characterize major, minor and trace element concentrations. Timescales of magma residence and open-system magmatic processes have been constrained through the application of different diffusion modelling approach on the chemical zoning of plagioclase and olivine crystals. A selection of plagioclase crystals has been also analysed in order to quantify dynamics and processes occurring at exceptionally fast timescales, such as gas-rich magma ascent and degassing, through the determination of the 7Li concentration gradients. Lithium
measurements along crystal rims have been finally coupled with diffusion models to determine rates of magma ascent during volatile exsolution upon eruption, and to show
20
how the latest-stage syn-eruptive processes associated with paroxysmal activity can be quantified over unusually short timescales.
3.2 Sampling and selection of the volcanic products
Ten relevant eruptive episodes at Mt. Etna have been selected among the 38 paroxysms between January 2011 and April 2013 AD to test various methodological approaches on mineral phases, including some of the most avant-garde techniques in petrology and geochemistry. Lava rocks used in this study are part of the extensive dataset (88 rock samples) already published by Viccaro et al. (2015). These lavas were sampled during or just after the end of the volcanic activity in order to definitively constrain their date of emission. The main criteria for selection of the samples include petrological differences between lava rocks (i.e. porphyritic index, proportions of any single mineral phase within thin sections, groundmass texture), as well as the duration of the Strombolian activity preceding the fountaining phase, as derived from the reports of INGV-Osservatorio Etneo (www.ct.ingv.it). For volcanic products erupted during the 2011-2012 period of activity, the temporal evolution (high/low rate of increase) of the volcanic tremor amplitude (VTA) during the Strombolian phase preceding the lava fountaining activity has been also considered. Distinction of the paroxysmal episodes based on these seismic signals utilizes geophysical data reported in Viccaro et al. (2014), which showed that amplitude and source location of volcanic tremor drastically change during the evolution of each lava fountain and they are also related to the dynamics of pre-eruptive magmatic processes at depth. Based on these evidences, within the period under investigation, I selected a) five short-lasting eruptions characterized by a rapid
21
intensification of the seismic signal preceding the fountaining and/or preceded by a short (< 4h) Strombolian phase, and b) five long-lasting eruptions, showing low-rates of VTA increase prior to the paroxysm and/or a long Strombolian phase (5-18 h) preceding the fountaining (cf. Viccaro et al., 2014). Selected episodes and their evolutionary features are listed in Table 2.
Date of eruption Intensification Strombolian activity (GMT)* Duration of the Strombolian phase preceding the paroxysm* Rate of VTA increase Eruption type January 12, 2011 21:06 24h 44’ 0.8 LL February 18, 2011 01:41 1h 49’ 6.3 SL April 10, 2011 03:15 28h 50’ 1.2 LL July 30, 2011 03:41 16h 2.1 LL March 04, 2012 04:20 3h 10’ 12.6 SL April 24, 2012 17:33 8h 2.6 LL February 23, 2013 ** 18:00 0h 30’ n.a. SL March 05-06, 2013 ** 21:32 1h 16’ n.a. SL April 12, 2013 ** 06:47 28h 3’ n.a. LL April 18, 2013 ** 11:00 2h n.a. SL
Table 2. Chronology and evolutionary features of the 2011-2013 paroxysmal eruptions that have been
selected for a detailed in-situ microanalisys of mineral phases and quantification of volcanic processes. Classification of the events as LL=Long-lasting and SL=Short- is based on the time gap between the intensification of the strombolian phase and the fountaining phase (>5h for LL events and <5h for SL events) and on the rate of volcanic tremor amplitude increase for those episodes for which is available.
* Information taken from reports of INGV- Osservatorio Etneo and by Behncke et al. (2014)
22 3.3 Analytical procedures
3.3.1 Whole rock analyses
Major element compositions for all the collected volcanic rocks (88 samples) of the 2011-2013 activity were analyzed at the Dipartimento di Biologia, Ecologia e Scienze della Terra of Università della Calabria (Italy) by means of a Philips PW2404 WD-XRF on powder pellets, correcting for the matrix effects. Loss on ignition was determined by gravimetric methods. Trace element abundances were measured at the SGS Laboratories of Toronto (Ontario, Canada) on 40 selected samples representative of the January 2011- April 2013 eruptive sequence. Powdered rock samples were fused by Na-peroxide in graphite crucibles and dissolved using dilute HNO3. Trace element analyses were then
obtained by means of a Perkin Elmer ELAN 6100 inductively coupled plasma mass spectrometer. Four calibration runs were performed on international certified reference materials at the beginning and end of each batch of 20 samples. Precision is better than 5% for all the trace elements analyzed. Whole rock major and trace element measurements for volcanic rocks analyzed in this study are available at the following link:
http://www.volcanology-unict.it/online_material/giuffrida_phd_thesis.
3.3.2 In-situ microanalytical data
In-situ major element compositions were obtained on plagioclase, olivine, clinopyroxene and opaque oxides representative of the main textural and size variability within volcanic rocks. A selection of plagioclase (70 crystals; 4692 spot analyses) and olivine phenocrysts (49 crystals; 2515 spot analyses) were also analyzed for major elements along core-to-rim or rim-to rim transects crosscutting the centers of crystals.
23
Analytical steps in plagioclase vary from 5 to 30 μm depending on the crystal size, whereas spot analyses within olivine are at steps of 7-15 μm. Data were acquired at the Dipartimento di Scienze Biologiche, Geologiche e Ambientali of Catania (Italy) using a Tescan Vega-LMU scanning electron microscope equipped with an EDAX Neptune XM4-60 micro-analyzer using an energy dispersive system characterized by an ultra-thin Be window, and coupled with an EDAX WDS LEXS (wavelength dispersive low energy X-ray spectrometer) calibrated for light elements. Operating conditions for the analysis of major element abundances in mineral phases were 20 kV accelerating voltage and 0.2 nA beam current. Repeated analyses on internationally certified minerals and glass standards during the analytical runs ensure precision for the collected elements between 3 and 5%.
On ~35 plagioclase crystals, the same core-to-rim traverses analyzed for major elements were followed to obtain trace element data by Laser Ablation Inductively Coupled Plasma Mass Spectrometry (LA-ICP-MS). Analyses were conducted at the Istituto Nazionale di Geofisica e Vulcanologia – section of Palermo (INGV-PA, Italy), by using a GeoLasPro 193 nm Excimer Laser system, equipped with an Agilent 7500ce quadrupole ICP-MS. Analyses were performed at 10 Hz and fluency of 14-18 J/cm2. Ablation spots are on the order of 25 μm in diameter, and steps between spots vary from 30 to 50 µm. To determine trace element concentrations in the ablated material, data acquisition was accomplished in peak-jumping mode with one point per peak and 10 ms dwell. Total analysis time was 2 minutes per spot, including 1 minute of background acquisition. Plasma conditions were adjusted to oxide formation rates below 0.6% (monitored using the 248/232 mass ratio), so that no further oxide corrections were necessary. 43Ca and 29Si were used as internal standards for both the geochemical
24
reference materials (NIST SRM 612) and natural samples. NIST SRM 612 served as the external standard and was measured at the beginning and at the end of each group of unknowns (20-30 sample measurements). Data were collected in time-resolved graphics mode to monitor compositional heterogeneities that might be present in the sample at the scale of the laser sampling and to monitor the inter-element fractionation. Data were transmitted to a PC and processed by the GLITTER program (Van Achterbergh et al. 2001). Instrument performance and stability were monitored by repeated measurements of USGS basaltic reference glass BCR-2G during the analytical sessions. At spot size 24 μm, the precision of the analyses is better than 10% for all trace elements, except for Li, Cs, Rb, Zn and Pb for which is between 20-30%. According to Pearce et al. (2011), analyses were corrected for the fractionation index obtained on BCR-2 by dividing the measured value (averaged on repeated analyses) by the accepted one.
The rims of plagioclase crystals from various eruptive events have been also characterized for 7Li concentrations by Secondary Ion Mass Spectrometry (SIMS).
Analyses were performed on selected crystals already characterized for major and trace elements, but along opposite transects with respect to the LA-ICP-MS traverses within the crystal. SIMS analyses were carried out using the IMS 4f Cameca ion microprobe installed at CNR-IGG (Pavia). The plagioclase crystals were selected on rock thin sections that were polished, washed in ultrasonic tank, dried and Pt-coated. The samples were first investigated with an optical microscope under transmitted and reflected light, and suitable micrographs were produced on the selected areas prior to SIMS investigation. A primary beam of 5 nA 16O-, yielding a spot diameter of 6-8 µm at the
25
within the crystals. Experimental set up was the following: -12.5 kV accelerating voltage, 25-µm secondary-ion imaged field, 400-µm contrast aperture and 1800-µm field aperture. The energy filtering technique (range: 75-125 eV) was used to reduce matrix effects and improve analytical precision (Ottolini et al., 1993; Ottolini et al., 2002 and reference therein). A 900 (M/ΔM) mass resolution was used. Experimental data were collected in four, one-day analytical sessions. For the purposes of this paper, the basic run table included 7Li and 30Si. Lithium compositional profiles were obtained by determining
average counts per second for the 7Li isotope and then calculating a ratio with respect to 30Si. This is because the raw Li data provided by SIMS are given in secondary ion
intensity as a function of time. To use the raw data, the ion intensity of the 7Li isotope
need to be first normalized to the intensity of 30Si. 7Li+ and 30Si+ were monitored over 5
analytical cycles with 8 and 4 second acquisition time for each, for a total time of 40 and 20 seconds respectively, after a 450-second waiting time to get steady-state sputtering conditions. NIST-SRM-610, NIST-SRM-612 and NIST-SRM-614 international standards (Gao et al., 2002; Pearce et al., 1997) were used as calibration samples in order to convert the ion signal for Li into Li concentrations (ppm). The resulting analytical reproducibility of the 7Li/30Si count ratios are ±1% (1σ) for NIST-SRM-610 over a one-day session.
After SIMS analysis, thin sections were re-polished smoothly, and the analysed crystals were imaged again using light microscopy to determine the precise analysis pit locations along the crystal margins. SIMS craters were then re-analysed at the Dipartimento di Scienze Biologiche, Geologiche e Ambientali of Catania by scanning electron microscope in order to determine the exact major element composition and anorthite content within the SIMS pit locations. Specifically, the SEM-EDS SiO2 (wt.%) values at each spot were
26
adopted in the SIMS quantification of Li at those micro-areas. Moreover, in order to further reduce the residual matrix effects (see Ottolini et al. (1993) for details), and consider the different SiO2 (wt.%) values among the plagioclase crystals and the NIST
glasses (~ 50 wt.% SiO2 vs. 72.2 wt.% SiO2 in the NIST-series glasses), we applied a
correction to the relative-to-Si ion yields for Li, i.e., I(Li)/I(Si) / Li(at)/Si(at) [where I(Li) and I(Si) represent the ionic signals for Li and Si, and Li(at) and Si(at), their respective atomic concentrations]. The accuracy of the final SIMS data for Li concentration is quoted ≤ 10% rel. The anorthite composition determined at each SIMS analysis spot was finally used to correct the measured 7Li/30Si ratios for the variation in silica. Specifically,
the 30Si count rate was converted in 30Si
i, which is proportional to the amount of
plagioclase sputtered during the analysis. This conversion follows the equation 30Si i=30Si
{(4/3) + 2XAn/3} (cf. Charlier et al., 2012), where the 30Sii value accounts for the number
of tetrahedral sites ablated during analyses, assuming constant ionization efficiency for Si. Therefore, the 7Li/30Si
i signal represents a value proportional to the molar Li content
within the plagioclase, i.e. proportional to the number of Li atoms for tetrahedral site.
3.4 Geochemical and petrological characterization of volcanic rocks
3.4.1 Bulk rock geochemistry
To characterise the volcanic products within the period under investigation, whole rock geochemistry and petrography are provided for a total of 88 lava samples, which represent the sequence of paroxysms that occurred between January 2011 and April 2013 (data available at http://www.volcanology-unict.it/online_material/giuffrida_phd_thesis).
27
Figure 4. Plots of major oxides vs. MgO (wt.%) for volcanic rocks erupted between January 2011 and April 2013 at Mt. Etna volcano.
28
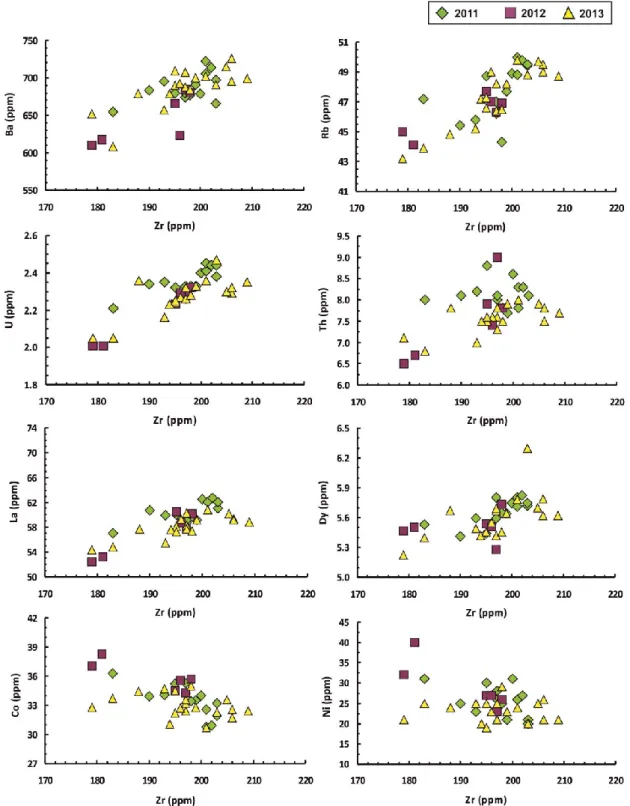
Figure 5. Plots of trace elements vs Zr (ppm) for volcanic rocks erupted between January 2011 and April 2013 at Mt. Etna volcano.
29
All samples fall within the K-trachybasalt field of the TAS diagram. To address the evolution of magmas throughout the period under investigation, the compositions of major oxides were plotted versus Mg (Fig. 4). TiO2, FeOtot, CaO display positive
correlations with respect to MgO, whereas Al2O3, alkalis and P2O5 exhibit negative trends
(Fig. 4). Trace elements were plotted versus Zr, which was used as differentiation index for its marked incompatibility in basaltic liquids. Large Ion Lithophyle Elements (LILE; Ba, Rb and, to a minor extent Sr), the High Field Strength Elements (HFSE; U, Nb and subordinately Th) and the group of Rare Earth Elements (REE) display positive correlations with Zr (Fig. 5). Only the transition metals (Co, Ni, V) show decreasing values at increasing Zr (Fig. 5). In spite of rather similar geochemical signatures, a more detailed analysis of major and trace element abundances reveals, however, the existence of some chemical differences over the considered period. For most of major oxides and trace elements, products related to the 2011 activity display chemical compositions with variations narrower than those of the 2012 and 2013 volcanic rocks (Figs. 4-5). Volcanic products of the 2011 episodes show also slight bimodality for K2O contents, whereas the
other elements are more clustered. Lavas and tephra of the 2012 activity present the widest compositional range compared to the products of the 2011 and 2013 paroxysms, and display the most basic compositions of 2011-2013 sequence, i.e. the samples from the March 04, 2012 eruption. Products of 2013 cover the most extensive range of compositions, but they do not reach compositions that are as basic as those observed in the 2012 paroxysmal samples (Figs. 4-5).
30
Figure 6. Evolution of the major oxide compositions (wt. %) for the volcanic rocks erupted at Mt. Etna volcano throughout the period January 2011 and April 2013.
31
Figure 7. Evolution of some selected trace element concentrations (ppm) for the volcanic rocks erupted at Mt. Etna volcano throughout the period January 2011 and April 2013.
32
Figures 6 and 7 show the time evolution of some major oxides and trace elements for volcanic rocks at Mt. Etna throughout the period under investigation. Products of the 2011 activity become more MgO-rich from January to April, followed by shifting to more evolved compositions starting from May 2011. Volcanic rocks erupted during the period between July and September 2011 have more limited fluctuations maintaining, on the whole, rather constant compositions. Products erupted during the early episodes of 2012 are the most basic of the entire 2011-2013 sequence, but suddenly drop to compositions similar to those of the 2011 activity during the middle-late stage of the 2012 paroxysmal sequence. Reinitiation of volcanic activity on February 2013 yielded emissions of lavas and tephra fairly similar in their chemistry to those erupted during the final episodes of April 2012. For samples from February-March 2013 compositions are rather constant or slightly more evolved, whereas on April 3, the magma is the most basic of 2013. From that moment on, compositions tend to become progressively more evolved with only minor chemical changes (e.g., April 18, 2013; Figs. 6-7).
3.4.2 Petrography and chemistry of minerals
Volcanic rocks emitted at Mt. Etna during the 2011-2013 period display seriate porphyritic texture with the crystal fraction (Porphyritic Index in volume %) ranging between 15 and 30. The Porphyritic Index progressively decreases through time. Phenocrysts are included in a vitrophyric groundmass with transition to hyalopilitic texture. When microlites are present, they are generally acicular plagioclase, augitic clinopyroxene, subordinate olivine and opaque oxides. Mineral phases found as phenocrysts and their abundances related to the phenocryst fraction are: plagioclase
(40-33
60 vol.%), augitic clinopyroxene (30-50 vol.%), olivine (5-10 vol.%) and opaque oxides (<5 vol.%). Plots of compositions of the main mineral phases are shown in Figure 8.
Plagioclase is usually euhedral to subhedral, variable in size from micro-phenocryst (100-200 µm) up to 2-3 mm. Phenocrysts are characterized by a wide compositional and textural variability. Specifically, compositional oscillatory zoning typically occurs together with complex disequilibrium textures that characterize either the plagioclase core or rim. The anorthite content covers a wide range from andesine (An47)
to anorthite (An91) during the considered eruptive period (Fig.8a). Crystals larger than 1
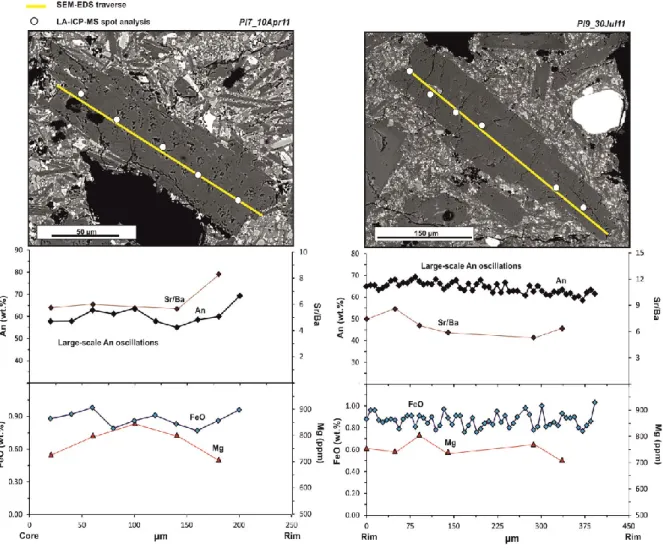
mm generally have more calcic core compositions (An up to 91 mol%) than small plagioclases, most of which have An between 55 and 65 mol%. Variations of the average core compositions throughout the entire period under investigation highlight major increases of An contents from February 18 to August 29, 2011 (An increases of ~25 mol%), and from February 23 to April 3, 2013 (An increases of ~10 mol%; Fig. 9a; cf. Viccaro et al., 2015). Conversely, cores of the crystals from the 2012 activity have, in average, less calcic compositions and record limited An fluctuations on the order of ~5 mol%. Plagioclase rims generally display the same trend as cores, although with lower An content (Fig. 9a). Details of textural features and An zoning patterns in plagioclase from selected episodes, together with variations of minor (Mg, Fe) and trace element (Sr, Ba) are described in the following section.
Clinopyroxene has euhedral to subhedral habitus and size between micro-phenocrysts (~100 µm) up to ~3 mm. Larger crystals with size >1 mm have been found either as single individuals or complex aggregates with the other mafic phases (olivine and oxides). The composition falls in the fields of diopside-salite and augite (Fig. 8b).
35
Most of augitic crystals that were found in lava rocks from short-lasting paroxysmal eruptions (i.e. samples of March 4, 2012 and April 18, 2013) display resorption textures at the rim, similar to sieve textures. The average Mg# measured at the crystal core and rim has limited fluctuations throughout the entire 2011-2013 period (ΔMg# ~0.2; Fig. 9b). The main trends of increasing Mg# in the core (up to Mg# ~81) have been observed from May 12 to August 29, 2011, from March 4 to April 24, 2012, and finally from March 5 to the end of April 2013. Rims typically reveal Mg# higher than core (Fig. 9b).
Olivine is euhedral to subhedral. Sizes vary from micro-phenocrysts up to 1.4 mm. Some of the largest (>1.0 mm) olivine crystals are affected by strong disequilibrium, which manifests as embayments at their edge. It is worth noting that these olivine crystals generally coexist with destabilized clinopyroxene. The complete spectrum of olivine compositions covers the range between Fo70 and Fo84 (Fig. 8c). The core composition of
olivine crystals shows great fluctuations during the 2011 and the 2013 eruptive periods (ΔFo 4-8), whilst crystals from the 2012 activity display more homogeneous compositions, which fall mainly in the range Fo75-80 (Fig. 9c). Based on compositions
measured in the core, olivine crystals have been grouped into 5 populations, hereafter indicated as OPi, each one characterized by multiple zoning patterns. Section 3.5 provides a detailed description of the identified populations and their chemical zoning.
Opaque oxides have subhedral to anhedral habitus and are between 50 and 200 µm. Measured compositions allow their classification as titaniferous magnetite (cf. Viccaro et al., 2015). They are typically enclosed in olivine and clinopyroxene, testifying their early nucleation and growth. Textural relationships among phenocrysts suggest that,
36
after the early crystallization of titaniferous-magnetite, crystallization proceeded from olivine and clinopyroxene to plagioclase.
Figure 9.Compositional variation throughout the January 2011 – April 2013 period of the average An contents in plagioclase, Fo in olivine and Mg# in augitic clinopyroxene. n:number of spot analyses collected at the core and rim of crystals.
37
3.5 Textural and compositional features of plagioclase and olivine crystals
3.5.1 Plagioclase textures
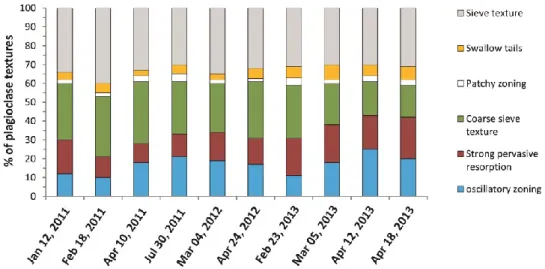
The systematic study under optical and electron microscope of the products erupted at Mt. Etna during the 2011-2013 period of activity illustrates considerable differences concerning the plagioclase textures. The plagioclase assemblage is represented by several textures in variable proportion: oscillatory zoning, core disequilibrium textures (mainly coarse sieve-textures, strong dissolution/resorption), sieve texture at the rim, and other textures that indicate crystal growth at different degrees of undercooling (Viccaro et al., 2010; 2014; 2015; Nicotra and Viccaro, 2012a; 2012b). The frequency of occurrence of each plagioclase texture in volcanic products for the 10 selected episodes during the 2011-2013 period is shown in Figure 10. BSE images of some of the most representative growth and disequilibrium textures of plagioclase are also provided in Figures 11 (growth textures) and 12 (disequilibrium textures).
Figure 10. Percentages of frequency of plagioclase textures in volcanic products for selected paroxysmal eruptions (oscillatory zoning includes both large- and small-scale patterns).
38
Crystals with oscillatory zoning exhibit small (< ΔAn5 compositional variations with short ~10 μm wavelength) and large (~ΔAn5–10 and 20-30 μm wavelength) scale oscillations of the anorthite content that are similar to those already identified for other plagioclases of the recent post-1971 Etnean activity (cf. Viccaro et al., 2010, Nicotra and Viccaro, 2012a; Fig. 11). As a whole, small scale oscillatory zoning commonly pertains to microphenocrysts (100-200 μm size) and cores of large phenocrysts (> 1mm), whereas the large scale oscillation patterns occur with higher frequency in small and medium size crystal cores (200-600 μm size) or at the rims of the larger crystals. These different oscillation patterns can also occur within the same crystal (Fig. 11). Plagioclase characterized exclusively by oscillatory zoning composes approximately 10-20 % of the total crystals observed (Fig. 10) and they are found in all crystal sizes, but are more abundant in microphenocrysts. It is worth noting that the occurrence of large (1.0-1.5 mm) totally oscillatory zoned crystals is limited to few lava samples, e.g. those erupted on March 5-6, 2013. Detailed observations of BSE images reveal that the large-scale oscillatory zoning is commonly interrupted by minor wavy dissolution surfaces (Fig. 11). Moreover, oscillatory-zoned portions of plagioclase are often cross-cut by disequilibrium textures affecting both cores and rims.
Disequilibrium textures at the plagioclase cores show a different pervasive degree of resorption (Fig. 12). Among the more abundant textures are crystals strongly affected by pervasive dissolution/resorption (Fig. 12a) and crystals with coarse-sieve textures (Fig. 12b.). In these cases, evidence for crystal resorption is given by the occurrence of micron-sized glass inclusions randomly distributed within the cores, which generally acquire a rounded shape (Tsuchiyama 1985; Kawamoto 1992; Nakamura and Shimakita, 1998).
39
Both textures mainly affect plagioclase of medium-large size (>500 μm). Coarse-sieve textures occur with high frequency around 30–40%, whereas crystals with strongly resorbed cores (i.e., strong pervasive resorption) compose about 20 % of the textures in plagioclase crystals (Fig. 10). Plagioclase cores are also characterized by textures similar to patchy zoning found in plagioclase crystals from past eruptions (cf. Viccaro et al., 2010; Nicotra and Viccaro 2012a), in which it has been recognized richer and
An-Figure 11. Examples of coexistent small and large scale oscillatory zoning patterns in plagioclase crystals of the 2011-2013 paroxysmal activity. Note the occurrence of irregular surfaces due to minor dissolution events that affect the large scale zoning. All photos by BSE scanning electron microscope.
40
poor areas that are arranged in irregular patches (Fig. 12c-d). This feature is, however, rather unusual in the products under investigation, representing ~2-4 % of the plagioclase textures in observed crystals (Fig. 10).
Figure 12. Example of disequilibrium textures in plagioclase crystals of the 2011-2013 paroxysmal activity. a) plagioclase crystal with core affected by strong resorption; b) crystal showing a coarse-sieve textured core with rounded edge and sieve texture at the rim; c) patchy core characterized by zones at different composition. Darker areas have less calcic composition; d) another example of plagioclase with textures similar to patchy zoning. The crystal shows an oscillatory zoning core mantled by a patchy region with Ca-rich (light areas) and Ca-poor (dark areas) zones;
41
Disequilibrium textures at the rim of plagioclase are present in all of the volcanic rocks under investigation, and affect crystals with very different sizes. In these cases, the rim of crystals is marked by sieved zones characterized by bands of glass inclusions usually cross-cutting the oscillatory zoning patterns (Fig. 12e-h). Some crystals also exhibit multiple sieved regions, sometimes evolving into dusty, thick textures with
Figure 12 (continue). Example of disequilibrium textures in plagioclase crystals of the 2011-2013 paroxysmal activity. e) plagioclase rim with extensive dusty sieve textures; f) complex plagioclase crystal displaying several type of disequilibrium features: the core has coarse-sieve texture and rounded shape; rims are affected by a double sieve texture; g) detail of a sieve texture surrounding a plagioclase core; h) example of an incipient sieve texture at the rim of an oscillatory zoned plagioclase crystal.
42
interconnected melt channels (Fig. 12f). The frequency of sieve texture is between 30 and 40% of the total crystal fraction (Fig.10) and is typical of medium and large size crystals. Microphenocrysts usually exhibit slighter resorption than larger plagioclase phenocrysts, showing thin (15-25 µm large) sieve textures at the outermost rim (Fig. 12g-h).
3.5.2 Minor and trace element zoning in plagioclase and their relation with major element variations
Five to ten representative plagioclase phenocrysts were analyzed for major and minor elements by SEM-EDS in each selected sample; in addition, about a half of crystals was also analyzed for trace elements by laser ablation ICP-MS (compositions available at
http://www.volcanology-unict.it/online_material/giuffrida_phd_thesis). Most of the
Etnean plagioclase are characterized by multiple and extensive resorption zones both at their core and rim; for this reason, the collection of trace elements was limited to crystals wholly oscillatory-zoned or to portions of plagioclase not severely affected by μm-sized glass inclusions caused by disequilibrium. In this section, the anorthite zoning is described together with variations of some minor elements, e.g., Fe and Mg, and the Sr/Ba ratios for plagioclase crystals having different textures. It is worth noting that Mg contents in the Etnean plagioclases are usually lower than 0.8 wt.%. Therefore, in this study the Mg concentrations are evaluated in ppm, by taking into account values obtained by LA-ICP-MS that are more precise than data produced by SEM-EDS/WDS.
In oscillatory-zoned crystals, the anorthite content covers a wide range of composition from An55 to An91. At the core of microphenocrysts An ranges from 55 to 70
43
mol%, with subordinate more calcic compositions of An 79-86 mol % (only 3 plagioclases within the whole population of oscillatory-zoned microphenocrysts; Fig. 13).
Oscillatory-zoned cores of plagioclase with size between 200 and 600 μm show two distinct dominant compositions at An 79-91 (Fig. 14) and An 55-70 mol % (Fig. 15). The
Figure 13. Compositional characteristics of oscillatory-zoned plagioclase microphenocrysts. In diagrams the An zoning ( mol%) is shown together with FeO (wt.%), Mg (ppm) and Sr/Ba profiles. Filled black diamonds: An mol %; filled brown diamonds: Sr/Ba ratio; filled blue diamonds: FeO wt.%; red triangles: Mg ppm.
44
most calcic core compositions of 85-91 mol % were generally found in plagioclase crystals larger than 600 μm (Fig. 16). For all the analyzed crystals, also belonging to different size classes, FeO and Mg do not record important variations. FeO typically ranges between 0.50 and 1.20 wt. % at the core, whereas Mg varies between 370 and 790 ppm (Fig. 13-16).
Figure 14. Compositional characteristics of oscillatory-zoned plagioclase crystals with size between 200 and 600 µm, having low calcic core composition. In diagrams, the An zoning (mol%) is shown together with FeO (wt.%), Mg (ppm) and Sr/Ba profiles. Filled black diamonds: An mol %; filled brown diamonds: Sr/Ba ratio; filled blue diamonds: FeO wt.%; red triangles: Mg ppm.
45
Some of the oscillatory-zoned crystals also show a concomitant enrichment of these two elements in the outermost 10-50 μm of the rims, where FeO and MgO display reverse zoning patterns, with concentrations up to ~2.0 wt.% and 790 ppm respectively. As a whole, the small-scale anorthite zoning of plagioclase generally forms concordant trends
Figure 15. Compositional characteristics of oscillatory-zoned plagioclase crystals with size between 200
and 600 µm, having low calcic core composition. Diagrams show the An zoning( mol%) together with FeO (wt.%), Mg (ppm) and Sr/Ba zoning patterns. Filled black diamonds: An mol %; filled brown diamonds: Sr/Ba ratio; filled blue diamonds: FeO wt.%; red triangles: Mg ppm.
46
with FeO and MgO variations, whereas anorthite fluctuations forming large-scale zoning patterns are concordant with MgO and discordant with respect to FeO variations.
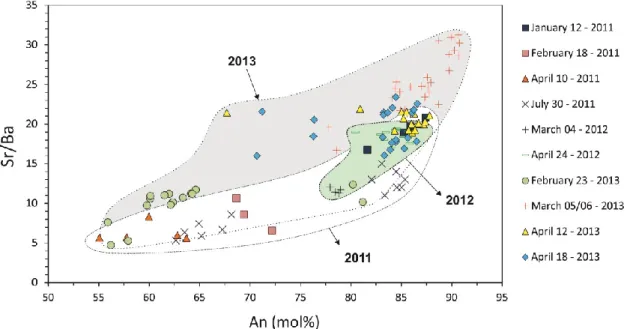
Trace elements measurements across the oscillatory-zoned portions of plagioclase highlight marked difference in the average Sr/Ba ratios of these crystals. Most of the Etnean plagioclase crystals have Sr/Ba fluctuations between 15 and 32 (average Sr/Ba
Figure 16. Compositional characteristics of oscillatory-zoned plagioclase crystals with size >600 µm. Diagrams show the An zoning (mol%) together with FeO (wt.%), Mg (ppm) and Sr/Ba compositions. Filled black diamonds: An mol %; filled brown diamonds: Sr/Ba ratio; filled blue diamonds: FeO wt.%; red triangles: Mg ppm.
47
ratios ~23), however, some crystals display a significantly lower Sr/Ba ratio at comparable An content (average Sr/Ba ratio ~8; Fig. 17). In particular, the average Sr/Ba ratio is lower for products erupted during the 2011 period of activity, from February 2011 to July 2011, and then increased throughout the 2012 and 2013, showing low values only in crystals from the February 23, 2013 eruption and March 04, 2012 (Fig. 17).
Crystals with disequilibrium textures in the core have average An values ~ 80-85 mol%, which are fairly constant throughout the zone of disequilibrium (Fig. 18). In some circumstances, crystals with marked rounding of the core present a sudden drop of anorthite (ΔAn ~20-30) just outboard of the resorption surface (Fig. 18). Iron and Mg display variations within a narrow range ((FeO ~0.4–1.2 wt.%, MgO ~400-650 ppm; Fig.
Figure 17. Sr/Ba ratio plotted against An for oscillatory-zoned plagioclase crystals of the 2011-2013 activity at Mt. Etna. White Area: crystals of the 2011 eruptions; light green area: crystals of the 2012 eruptions; gray area: crystals of the 2013 eruptions.
48
18). Within the patchy cores of the crystals, the An content does not show abrupt compositional shift, rather An varies in a range of 10-15 mol% and FeO variations are generally discordant relative to An (Fig. 19). The average Sr/Ba ratios within cores of crystals affected by disequilibrium textures are generally higher than 16, though few analytical spots at low (<10) Sr/Ba has been also observed in crystals emitted during paroxysmal episodes of 2011 (Fig. 18; see online material at http://www.volcanology-unict.it/online_material/giuffrida_phd_thesis)
.
Figure 18. Plagioclase crystals affected by coarse-sieve textures at the core and their associated An (mol%), FeO (wt.%), Mg (ppm) and Sr/Ba zoning patterns. Filled black diamonds: An mol %; filled purple diamonds: Sr/Ba ratio; filled blue diamonds: FeO wt.%; red triangles: Mg ppm.
49
In sieve-texture regions developed at the rim of plagioclase crystals, anorthite and iron show different trends of variation. Some crystals display concomitant increase of An (up to ~ΔAn20 mol%) and FeO (up to ΔFeO ~0.4 wt.%) within the sieved rims (Fig. 20).
Moreover, in those crystals where collection of La-ICP-MS spot analyses was possible, an increase of Mg was also detected within these high Fe-An sieved zones (Fig. 20).
Figure 19. Plagioclase crystals with patchy textures at the core and their associated An (mol%), FeO (wt.%) zoning patterns. Note that for most of the the crystals, such as those showed in BSE images, Mg (ppm) and Sr/Ba values were not measured. Filled black diamonds: An mol %; filled blue diamonds: FeO wt.%.
50
These compositional variations associated with the sieved rims are typical of crystals found in lavas emitted during long-lasting paroxysmal eruptions, which are also characterized by a low rate of volcanic tremor amplitude increase (see Table 2; cf. Viccaro et al., 2014). Other crystals with sieved textures at the rim show discordant trends of anorthite and iron, with An rather constant or slightly decreasing and FeO that increases (up to ΔFeO ~0.3 wt.%; Fig. 21). This compositional feature in plagioclase sieved rims is commonly related to plagioclases of lavas erupted during events characterized by a rapid temporal evolution, which had a high rate of increase in volcanic tremor amplitude (see Table 2; c.f. Viccaro et al., 2014). In these cases, Mg contents within the sieve textures vary in discordance with iron, showing decreasing concentrations. Due to the pervasive presence of glass inclusions, measurements of trace element concentrations were often not possible across sieve textures, so that changes in Sr/Ba ratios along sieve textures were not evaluated.
51
Figure 15. Plagioclase crystals affected by disequilibrium textures at the rim and their associated An (mol%), FeO (wt.%), Mg (ppm) and Sr/Ba zoning patterns. Filled black diamonds: An mol %; filled brown diamonds: Sr/Ba ratio; filled blue diamonds: FeO wt.%; red triangles: Mg ppm. Diagrams show the type of sieve textures (areas within dotted lines) characterized by coupled increase of FeO, Mg and An contents.
52
Figure 21. Plagioclase crystals affected by disequilibrium textures at the rim and their associated An (mol%), FeO (wt.%), Mg (ppm) and Sr/Ba zoning patterns. Diagrams show the type of sieve textures (areas within dotted lines) characterized by iron increases that are not coupled to concomitant increases of An and/or Mg contents. Simbols as in figure 20.
53
3.5.3 Lithium compositional gradients in plagioclase
Plagioclase crystals investigated by SIMS for lithium concentrations were taken from lavas of six different eruptions characterizing the 2012 and 2013 activity at Mt. Etna. All the crystals analyzed by SIMS are exclusively oscillatory zoning with sizes between ~500 and 950 μm. Li compositional variations are reported as variations of the
7Li/30Si ion ratios along 200-300 μm-long transects that follow the apparent c-axis
orientation of plagioclase (see section 3.2 for the description of analytical procedures).
7Li/30Si values range from 2.7×10⁻³ to 0.4×10⁻⁴, corresponding to absolute Li
concentrations between 6.8 ppm and 0.1 ppm (Table 3). Examinations of the SIMS profiles reveal overall decreasing trends of the 7Li/30Si ratio toward the edge of all
selected crystals (Fig. 22). These variations, which have been plotted in diagrams of Figure 22 together with the An concentrations, are apparently independent from the major element composition of plagioclase. It has been also noted short intervals within the Li profiles where the 7Li/30Si trend changes slope and begins to increase (Fig. 22). Main
peaks of increasing 7Li/30Si have been observed at distance of ~230 μm from the
plagioclase edge (i.e.,crystals P1_24Apr12 and P2_5Mar13), at ~160 μm (i.e. P6_23Feb13 and P7_12Apr13) and, in almost all analyzed crystals, at distance between 110 and 120 μm (i.e., P1_24Apr12, P6_23Feb13, P4_5Mar13, P7_12Apr13, and P7_18Apr13), as well as in the final 40-50 μm of plagioclase growth (i.e., P1_24Apr12, P3_24Apr12, P6_23Feb13, and P4_5Mar13; Fig. 22).
54
Figura 22. 7Li/30Si concentration profiles and An composition for plagioclase crystals from lavas of the
2012-2013 Mt. Etna activity. Arrows of different colors indicate the lithium concentration peaks that were detected at precise distance from the plagioclase edge.