Dottorato di Ricerca in Ingegneria Informatica e delle Telecomunicazioni
XXVIII Ciclo
Ph.D. Thesis
MULTIFACETED ANALYSIS FOR MEDICAL DATA UNDERSTANDING: FROM DATA ACQUISITION TO
MULTIDIMENSIONAL SIGNAL PROCESSING TO KNOWLEDGE DISCOVERY
Ing. Isaak Kavasidis
Coordinatore Chiar.ma Prof.ssa D. Carchiolo Tutor Chiar.ma Prof.ssa D. Giordano
ABSTRACT
Large quantities of medical data are routinely generated each day in the form of text, images and time signals, making evident the need to develop new methodologies not only for the automatization of the processing and management of such data, but also for the deeper un-derstanding of the concepts hidden therein. The main problem that arises is that the acquired data cannot always be in an appropriate state or quality for quantitative analysis, and further processing is often necessary in order to enable automatic processing and manage-ment as well as to increase the accuracy of the results. Also, given the multimodal nature of medical data uniform approaches no longer apply and specific algorithm pipelines should be conceived and devel-oped for each case.
In this dissertation we tackle some of the problems that occur in the medical domain regarding different data modalities and an attempt to understand the meaning of these data is made. These problems range from cortical brain signal acquisition and processing to X-Ray image analysis to text and genomics data-mining and subsequent knowledge discovery.
CONTENTS
1 Introduction 1
1.1 Structure of this Dissertation . . . 3
2 Text Processing: Creating Summaries of Unstructured Medical Records 5 2.1 Introduction . . . 6
2.2 Related Work . . . 8
2.3 Method . . . 10
2.3.1 Text processing and annotation . . . 10
2.3.2 Summary Generation . . . 13
2.4 Experimental Results . . . 16
3 Times Series Analysis: Transcranial Magnetic Stimu-lation 23 3.1 Introduction . . . 24
3.2 Transcranial Magnetic Stimulation . . . 28
3.3 The Proposed Tool . . . 30
3.3.1 Hardware Interaction Module . . . 33
viii CONTENTS
3.3.2 Experiment data management module . . . 34
3.3.3 Diagnosis support system . . . 50
4 Image Processing: Skeletal Bone Age Modeling by Hidden Markov Models 55 4.1 Introduction . . . 56
4.2 Related Works . . . 58
4.3 The Proposed Tool . . . 60
4.4 Experimental Results . . . 72
5 Knowledge discovery in the medical domain 79 5.1 Introduction . . . 80
5.2 Cloud Technologies in Bioinformatics . . . 84
5.2.1 Platform as a Service (PaaS) . . . 86
5.2.2 Software as a Service (SaaS) . . . 90
5.2.3 Infrastracture as a Service (IaaS) . . . 91
5.3 BioCloud . . . 92
5.3.1 Text Mining Module for Hypothesis Generation 95 5.3.2 Validation of Hypothesis Generation against Experimental Data . . . 98
5.3.3 Data Analysis on the Cloud . . . 101
5.4 Experimental Results . . . 103
CHAPTER
ONE
INTRODUCTION
The medical domain is characterized by a profound multimodality in the processing of data. Text, images and time signals are the pre-dominant data formats that are used during screening and diagnostic processes. The main problem that arises though, is that the acquired data cannot always be in an appropriate state or quality for quantita-tive analysis and further processing is often necessary in order not only to enable automatic processing and management, but also to increase the accuracy of the results.
For example, Electroencephalography, is one of the most common examinations that is used for monitoring brain activity and for diag-nosing conditions of the central and peripheral nervous system. Before an EEG signal is considered, it goes under heavy filtering for removing unwanted artifacts and noise that would render the signal unusable. Another example is medical imaging data. Magnetic resonance imag-ing, computer tomography, X-Ray and echography images all need an
2 Chapter 1. Introduction
initial preprocessing step to remove undesired information and to en-hance the quality of the image by using image processing techniques. Quality of the medical information is not the only desired outcome. Manageability of the resources is another requested ability of medical institutions worldwide. For instance, thousands of medical reports are generated daily by medical institutions, but very often, are hand written and when digital systems are used for their management, they do not always use common formats and sharing or migrating text documents between medical institutions require a further integration step that most often comes at prohibitive costs.
Numerous research groups produce resources, but what happens when not identical, but relevant, research tracks are combined in an automatic and exploratory way? Is it possible to bring together re-sources and discover hidden knowledge by analyzing their common parts? Even more interestingly, given the widespread diffusion of med-ical information, is it possible that disparate pieces of information that were not considered before, if combined, could provoke a breakthrough in biomedical research?
During my Ph.D. course, I focused my research efforts on dealing with the aforementioned problems, and for this reason I identified 4 diverse problems of the medical domain that should be dealt with by different approaches. In the following subsection a brief description of such problems is given.
1.1. Structure of this Dissertation 3
1.1
Structure of this Dissertation
This dissertation is organized in seven chapters (including this intro-duction) as follows:
Chapter 2 presents a method for generating automatically sum-maries based on patients’ reports by employing Natural Language Processing techniques. This method aims at creating structured text, based on unstructured text, that can be easily managed, stored and shared.
Chapter 3 presents a method and a suite of tools for assisting neu-rophysiologists to create and execute large-scale experiments based on paired-pulse Transcranial Magnetic Stimulation. The tools contained in the suite cover completely the life-cycle of large-scale medical ex-periments (i.e. experiment definition, stimuli administration, signal acquisition and statistical analysis).
Chapter 4 presents a method and a tool for assessing the skeletal bone age of an individual based on X-Ray images of the left hand. Such a method, is important in many contexts ranging from legal rights assessment, to devolepmental disorders. Machine learning techniques, and in particular Hidden Markov Models, deal with the classification task, achieving remarkable results.
Chapter 5 describes a tool (BioCloud) that conducts knowledge discovery in the biomedical domain by processing a multitude of sources and data formats. It is capable of processing large quantities of scientific literature papers, online genomics databases and disease related databases to establish and verify relations between genes, pro-teins and biological processes that lead to disease. Given the high volumes of data that the tool needs to process, the whole processing
4 Chapter 1. Introduction
and data flow has been parallelized and deployed as a cloud service in order to exploit the high throughput these paradigms can offer.
Finally, in Chapter 6 conclusions are drawn and future directions are given.
Each chapter is independent with each other, as they deal with completely different problems of the medical domain.
CHAPTER
TWO
TEXT PROCESSING: CREATING SUMMARIES
OF UNSTRUCTURED MEDICAL RECORDS
In this chapter we present a system for automatic generation of sum-maries of patients’ unstructured medical reports. The system employs Natural Language Processing techniques in order to determine the most interesting points and uses the MetaMap module for recognizing the medical concepts in a medical report. Afterwards the sentences that do not contain interesting concepts are removed and a summary is generated which contains URL links to the Linked Life Data pages of the identified medical concepts, enabling both medical doctors and pa-tients to further explore what is reported in. Such integration also al-lows the tool to interface with other semantic web-based applications. The performance of the tool were also evaluated, achieving remark-able results in sentence identification, polarity detection and concept recognition. Moreover, the accuracy of the generated summaries was
6
Chapter 2. Text Processing: Creating Summaries of Unstructured Medical Records
evaluated by five medical doctors, proving that the summaries keep the same relevant information as the medical reports, despite being much more concise.
2.1
Introduction
Every day a large amount of medical reports, in the form of free text (i.e. not structured according to a logical scheme) is generated. Not possessing any structural information hampers the ability of automatic document digitization and analysis and subsequently all the applica-tions that could be built upon these. The information included in the text can be deductible only through reading. The adoption of free text documents is done mainly due to the doctors’ lack of time, who have to write reports quickly, or due to hospitals’ internal procedures or traditions. Moreover, the readability of these documents could be-come a problem as it may not be easy for the reader to pinpoint the most important parts.
The medical domain suffers particularly by an overload of information and rapid access to key information is of crucial importance to health professionals for decision making. For instance, a concise and syn-thetic representation of medical reports (i.e. a summary), could serve to create a precise list of what was performed by the health organiza-tion and derive an automatic method for calculating hospitalizaorganiza-tion costs. Given the plethora in number and diversity of sources of medi-cal documents, the purpose of summarization is to make users able to assimilate and easily determine the contents of a document, and then quickly determine the key points of it. In particular, as reported in
2.1. Introduction 7
[1]: “A summary can be loosely defined as a text that is produced from one or more texts, that conveys important information in the origi-nal text(s), and that is no longer than half of the origiorigi-nal text(s) and usually significantly less than that”, but also denotes its most impor-tant challenge: “Identifying the information segments at the expense of the rest is the main challenge in summarization”. Generating sum-maries, however, is not trivial as it implies a deep understanding of the underlying semantics. This is even more challenging in the medical domain since medical reports include a highly specialized vocabulary, words in upper and lowercase letters and numbers that require ad-hoc tokenization. These problems urged the development of domain-specific resources such as PubMed/MEDLINE and PubMedCentral1, ontologies and other semantic lexical resources, such as Gene Ontol-ogy2 and Unified Medical Language System (UMLS)3, and annotated databases, such as Entrez Gene4 which are used heavily by a variety of text mining applications.
The objectives of the work presented herein is 1) to create automati-cally a summary that conveys the key points of medical reports and 2) to provide a tool for annotating the medical concepts found in the text with Linked Life Data (LLD)5, so that the doctors or the patients can explore further what is being reported and also enable interoperability with other semantic web-enabled applications.
The remainder of the chapter is as follows: the next section briefly
1http://www.ncbi.nlm.nih.gov/pubmed 2http://www.geneontology.org/
3http://www.nlm.nih.gov/research/umls/ 4http://www.ncbi.nlm.nih.gov/gene/ 5http://linkedlifedata.com/
8
Chapter 2. Text Processing: Creating Summaries of Unstructured Medical Records
presents related works, while Section 2.3 describes the method in de-tail and in Section 2.4 a performance evaluation of the system is carried out.
2.2
Related Work
Text summarization of medical documents was brought to the atten-tion of the scientific community due to the tremendous growth of infor-mation that are available to physicians and researchers: the growing number of published journals, conference proceedings, medical sites and portals on the World Wide Web, electronic medical records, etc. In particular, in the clinical context, there has been an increase of in-terest in the use of Electronic Medical Records (EMR) systems which may contain large amounts of text data, to improve the quality of healthcare [2]. To make full use of the information contained in the EMR and to support clinical decision, text mining techniques based on Natural Language Processing (NLP) have been especially proposed for information retrieval purposes or for extracting clinical summaries. In [3], an information extraction system that extracts three types of information (numeric values, medical terms and categories) from semi-structured patient records, is presented. An extension to this system is presented in [4]: The MEDical Information Extraction (Me-dIE) system extracts a variety of information from free-text clinical records of patients with breast related diseases. MedIE uses GATE [5], WordNet [6] and UMLS, and employs a graph-based approach for nu-meric attribute extraction capable of performing the majority of in-formation extraction tasks achieving remarkable results. In [7], the
2.2. Related Work 9
Keyphrase Identification Program (KIP) is proposed, for identifying medical concepts in medical documents. KIP combines two functions: noun phrase extraction and keyphrase identification. It automati-cally extracts phrases containing nouns using a part-of-speech tagger achieving fair results (0.26 in precision and 0.60 in recall, best case scenario). KIP ranks all the noun phrases in terms of their relevance to the main subject of the document, and selects only the most rel-evant ones by creating a glossary database from the Medical Subject Headings (MeSH) site. In [8] is presented a pipeline-based system for automated annotation of surgical pathology reports with UMLS terms built on GATE. The system implements a simple method for detecting and annotating UMLS concepts as well as annotating negations based on the NegEx algorithm [9], achieving very good results in terms of precision (0.84) and recall (0.80).
While all of these tools offer great insight on how concept identifica-tion and annotaidentifica-tion can be done they do not offer any funcidentifica-tionalities for single-document text summarization. Such feature can be found in more complex works, as in [10, 11] where summarization of sin-gle documents is done by applying robust NLP techniques combined with conceptual mapping based on ad-hoc ontologies or lexicons. The main problem with these approaches is that the accuracy of the con-cept extraction, and subsequently the accuracy of the summarization, depends on the underlying lexicon, and in this particular case, the ontology. Not using well established ontologies carries the drawback of limiting the available identifiable concepts and also, their inter-operability with other semantic web-based complementary systems. In [12], UMLS is used for concept mapping but the system does not deal with negative expressions leading to misinterpretations in the
fi-10
Chapter 2. Text Processing: Creating Summaries of Unstructured Medical Records
nal summary.
In the next section the description of a system aiming at creating summaries out of medical records written in free text form by imple-menting a GATE pipeline, and also for assigning UMLS codes to the medical entities found inside them, is proposed.
2.3
Method
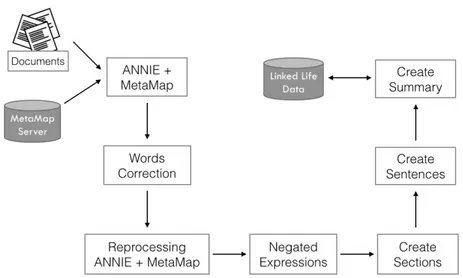
In order to produce a reliable summary, the corpus of medical docu-ments must undergo through several processing steps. In this section, the tools used during this process are introduced and described. The basis of the developed system is GATE, which is the most used tool for implementing NLP-based applications. GATE uses regular ex-pressions to configure all of its components (Tokenization, Sentence Splitter, POS tagging, Named Entity Recognition (N ER) etc...). The general architecture of the proposed system is shown in Fig. 2.1.
2.3.1
Text processing and annotation
ANNIE [13] is the information extraction component of the GATE platform and it substantially encapsulates the main NLP functions. In our case, an ANNIE pipeline was defined that employs the following components:
• English Tokenizer: The text in the corpus is divided into very simple tokens such as numbers, punctuation symbols or simple words. The main objective of this module is to maximize the efficiency and flexibility of the whole process by reducing the complexity introduced by the grammar rules.
2.3. Method 11
• Gazetteer: Its role is to identify the names of entities based on lists, fed into the system in the form of plain text files. Each list is a collection of names, such as names of cities, organizations, days of the week, etc...
• Sentence Splitter: As its name suggests, it splits the text in simple sentences by using a list of abbreviations to distinguish sentence markers.
• Part-of-speech Tagger: Marks a word as corresponding to a particular part of speech based on both its definition and con-text. This is useful for the identification of words as nouns, verbs, adjectives, adverbs, etc. The results of this plug-in are the tokens used for the implementation of regular expressions. • Named Entity Transducer: ANNIE’s semantic tagger
con-tains rules that work on the annotations of the previous phases to produce new annotations. It is used to create annotations regarding the terms related on negations, sections and phrases. • MetaMap Annotator: This module serves the role of
iden-tifying medical terms found in text and map them to UMLS concepts by using NLP methods combined with computational linguistics [14].
• Words Correction: Given that the vast majority of the med-ical reports that we are dealing with were produced in a com-pletely manual manner, misspellings do occur, making the med-ical term identification process less accurate. For this reason, each unannotated term (i.e. a word that does not exist) in the
12
Chapter 2. Text Processing: Creating Summaries of Unstructured Medical Records
text is used as a query term against a dataset containing med-ical terms and the term with the smallest Levenshtein distance is retrieved. The result is used in place of the misspelled word in the original document.
• Negated Expressions: In order to achieve a correct interpreta-tion of the text found in medical documents, it is very important be able to identify negated expressions, which indicate the ab-sence of a particular symptom or condition. MetaMap helps to identify negated concepts by providing a pair of features, namely ”NegExType” and “NegExTrigger”; the former one identifies the negation, while the latter one specifies the term that expresses it. In this phase there are two problems that must be dealt with: a) the negated medical concept must be correlated to the term that triggers the negation effect and b) there are words that imply negation but MetaMap cannot identify them as such (e.g. the word inexistence). To overcome these problems, the Gazetteer is used again, by creating a new class of annotations relating exclusively to terms of negation.
• Section parsing: For this phase, the Gazetteer plug-in is used by defining tags that could be possibly represent section labels. For our experiments the following tags were defined: admitting diagnosis, discharge diagnosis, symptoms, past medical history, family history, social history, hospital course, medications, diag-nostic studies, discharge instructions.
2.3. Method 13
Figure 2.1: General architecture of the proposed system.
2.3.2
Summary Generation
Not all of the annotations generated by the MetaMap Annotator are needed in the final summary. Each MetaMap annotation contains also the semantic type of the corresponding term (e.g. “Body Part” for the word “leg”, “Manufactured Object” for the word “scalpel” etc...). Inevitably, terms belonging to certain semantic types are excluded from the summary because their importance might be negligible.
An issue that needs to be dealt with during summary generation is that many annotated phrases should be merged to one sentence. For example, the sentence “x-rays including left foot, right knee, left shoulder and cervical spine” would normally be divided in the tokens “x-rays”, “left foot”, “right knee”, “cervical spine” and “left shoulder”
14
Chapter 2. Text Processing: Creating Summaries of Unstructured Medical Records
even though all of them belong to the same sentence.
Regular expressions were employed to face this problem. In our case, the following regular expression was used:
(P RE)?(N EG)?((M ET AM AP )(N EG)?)+(P OST CON CEP T )?(P OST )?,
where M ET AM AP denotes the main medical concept identified by MetaMap (e.g. “amoxicillin”, P RE denotes attributes that can precede the main concept (e.g. “significant”, “treated with”, “diag-nosis of”, “presence of” etc...), P OST CON CEP T indicates a word directly correlated to the main concept (e.g. “1 g” for expressing dosage etc...) and P OST denotes eventual tokens that may represent a continuation of the sentence (e.g. commas, conjunctions etc...). Fi-nally, the N EG term indicates whether a token expresses negativity or not.
The “+” and “?” operators describe the cardinality of each term with the “+” operator meaning “at least one or more” and the “?” operator meaning “zero or more”.
For each identified section, the annotations relative to affirmative and negative expressions are created and for each sentence, the an-notations produced by MetaMap are used. The same anan-notations are also used as query terms on the LLD site and the URLs pointing to the corresponding medical concepts are embedded to the final summary and exported in an HTML file.
An example of how the system works is shown below. Given the following discharge summary (the underlined words represent typo-graphical errors):
2.3. Method 15 ADMITTING DIAGNOSES: Intrauterine pregnancy at 36 weeks. Twin gestation. Breech presentation of twin A.
DISCHARGE DIAGNOSES: Intrauterine prengancy at 36 weeks. Twin gestation. Breech presentation of twin A. Status post primary low transverse cesarean section for malpresentation of twins.
CHIEF COMPLAINT: At the time of admission, contractions.
HISTORY: The patient is a 32-year-old pregnant at 36 weeks with known twins with contractions and good fetal movement, no bleeding, no loss of fluids.
OB HISTORY: Present pregnancy with previous receipt of a steroid window. GYN HISTORY: Significant for chamydia, which was treated.
MEDICATIONS: Prenatal vitamins.
SOCIAL HISTORY: No drinking, smoking or drug use. No domestic violence. The father of the baby is currently involved, and the patient is living with a friend.
PHYSICAL EXAMINATION: Temperature is 36.2, pulse 88, respirations 18 and blood pressure 121/58. HEART: Regular rate and rhythm. LUNGS: Clear. ABDOMEN: Soft and gravid.
HOSPITAL COURSE: Postoperatively, the patient did well. She was eating, ambulating and voiding, passing gas by postoperative day 2, and on postoperative day 3, she continued to do well. She had been seen by Social Work and options made aware to the patient. She was ready for discharge. She remained afebrile throughout her hospital course.
DISCHARGE INSTRUCTIONS: She will be discharged to home to follow up in two weeks for a wound check.
MEDICATIONS AT THE TIME OF DISCHARGE: Percocet, Motrin and Colace.
The result is a more compact form of the input document, with both the wrong words corrected and also contains the Linked Life Data links identified by MetaMap:
16
Chapter 2. Text Processing: Creating Summaries of Unstructured Medical Records ADMITTING DIAGNOSIS: Intrauterine pregnancy. Breech presentation of twin.
SYMPTOMS: contractions.
DISCHARGE DIAGNOSIS: Intrauterine pregnancy. Breech presentation of twin. Malpresentation of twins.
DIAGNOSTIC STUDIES: Temperature 36.2, pulse 88, respirations 18 and blood pressure 121/58. HEART. LUNGS. ABDOMEN.VAGINAL
PAST MEDICAL HISTORY : Significant for chlamydia. known twins with contractions and good fetal movement ,. pregnancy. Receipt of a steroid window.
PAST MEDICAL HISTORY NEGATIVE: no bleeding, no loss of fluids. SOCIAL HISTORY NEGATIVE : No drinking, smoking or drug use. No domestic violence.
MEDICATIONS : Prenatal vitamins. Percocet, Motrin and Colace.
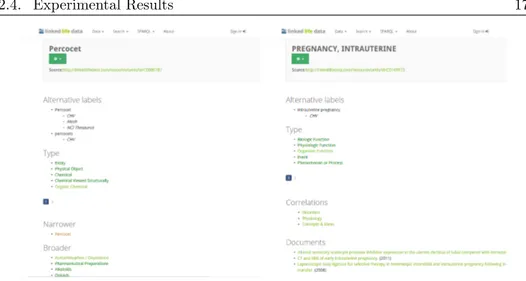
By clicking on the underlined terms, the system redirects the reader to its LLD page (Fig. 2.2).
2.4
Experimental Results
As stated in [1], evaluating the performance of a summarization sys-tem is not a trivial task. To be more precise, while the quantitative evaluation can be based on clear and objective metrics, the qualita-tive one is not that straightforward because summarization efficiency is most often expressed as a subjective opinion of the individual rater (i.e. Inter-rater reliability). Nevertheless, because of the two-fold na-ture of these kind of systems, their performance evaluation should cover both these aspects. So, in order to assess exhaustively the per-formance of the proposed system we tested it under three different perspectives and compared the results to a hand-crafted ground-truth
2.4. Experimental Results 17
Figure 2.2: Image showing the LLD pages of the terms Percocet (left) and Intrauterine pregnancy (right)
(described in Subsection 4.1). For all the evaluations we employed Precision-Recall and F1 measure values defined as follows:
P recision = T P T P + F P , Recall = T P T P + F N and F1 = P recision × Recall P recision + Recall
The F P , T P and F N values are defined separately for each of the aspects tested. The obtained results were compared against a manually created dataset by five medical doctors that contained both positive and negative sentences. The dataset was comprised by 125 medical reports containing 3611 annotated sentences (2824 positive
18
Chapter 2. Text Processing: Creating Summaries of Unstructured Medical Records
and 787 negative) and 15641 annotated medical concepts.
• Medical concept recognition: The first aspect of the system that was tested was its ability to identify correctly the medical concepts found inside the medical reports.
– A True Positive (TP) results when an identified medical concept is the same with the manual annotation.
– A False Negative (FN) results when a medical concept was not identified correctly or was not identified at all.
– A False Positive (FP) results when a medical concept was assigned a different label or when a non medical term was identified as such.
2.4. Exp erimen tal Results 19 Test N TP FP FN P R F1
Medical concept recognition 15641 12499 2419 3142 0.84 0.8 0.82 Sentence identification and polarity detection 3611 2808 531 803 0.84 0.78 0.81 Medical concept recognition 15641 11499 3514 4142 0.77 0.74 0.75 Table 2.1: Performance of the system in recognizing correctly the medical concepts.
20
Chapter 2. Text Processing: Creating Summaries of Unstructured Medical Records
N TP FP FN P R F1
3611 2808 531 803 0.84 0.78 0.81
Table 2.2: Performance of the system on sentence detection and polarity detection.
• Sentence identification and polarity detection: The second aspect of the system that was tested was its ability to extract correctly the single sentences in the medical report and also to assign correctly the negation attribute to the medical concepts detected by the previous test, using regular expressions.
– A True Positive (TP) results when an identified sentence is found also in the ground truth and was assigned the correct polarity.
– A False Negative (FN) results when a sentence found in the ground truth was not identified as such or when an anno-tated sentence was divided erroneously between two other sentences or when the negation property was not assigned to a negative sentence .
– A False Positive (FP) when a sentence is erroneously iden-tified as such, but instead, in the ground truth, its terms do not belong in the same one or when the negation property was assigned to a positive sentence.
• Summary relevance: Additionally, the quality of the pro-duced summary was evaluated. To achieve this, the same five medical doctors were presented with both the original reports and the final results and then asked to assess qualitatively the relevance of the summaries (i.e. express their personal opinions on what medical concepts should be included in the final summary versus what should be excluded). After that, the following parameters were defined:
2.4. Experimental Results 21
N TP FP FN P R F1
15641 11499 3514 4142 0.77 0.74 0.75
Table 2.3: Performance of the system on summary accuracy. The final result was calculated based on the sum of the votes of the medical doctors.
felt that should be included in the final summary and it was.
– A False Negative (FN): A concept that the medical doctors felt that should be included in the final summary but it was not.
– A False Positive (FP): A concept that the medical doctors felt that should not be included in the final summary but it was.
Sentence identification and polarity detection performance was very good. Indeed, an F1score value of 0.81 means that the
algo-rithms employed to do this task performed very well. More detailed inspection of the failing sentences were due to misplaced punctuation marks and missing negative keywords from the employed dictionary that could provoke ambiguity problems if they were ultimately in-cluded (e.g. the word “will” in the sentence “...will develop cancer...” does not imply that the patient has cancer). The results in medical concept recognition are almost equal as high. An F1score value of 0.82
means that the MetaMap module is very accurate in identifying the medical concepts found in the reports. Especially important are the
22
Chapter 2. Text Processing: Creating Summaries of Unstructured Medical Records
results in the summary accuracy test where the subjective opinion of the intended end users of the system (the medical doctors) determine its utility, achieving an F1score of 0.75.
CHAPTER
THREE
TIMES SERIES ANALYSIS: TRANSCRANIAL
MAGNETIC STIMULATION
Transcranial magnetic stimulation (TMS) is the most important tech-nique currently available to study cortical excitability. Additionally, TMS can be used for therapeutic and rehabilitation purposes, re-placing the more painful and invasive transcranial electric stimulation (TES). In this chapter we present an innovative and easy-to-use tool that enables neuroscientists to design, carry out and analyze scientific studies based on TMS experiments for both diagnostic and research purposes, assisting them not only in the practicalities of administer-ing the TMS but also in each step of the entire study’s workflow. One important aspect of this tool is that it allows neuroscientists to specify research designs at will, enabling them to define any parameter of a TMS study starting from data acquisition and sample group defini-tion to automated statistical data analysis and RDF data storage. It
24 Chapter 3. Times Series Analysis: Transcranial Magnetic Stimulation
also supports the diagnosing process by using on-line support vector machines able to learn incrementally from the diseases instances that are continuously added into the system. The proposed system is a neuroscientist-centred tool where the protocols being followed in TMS studies are made explicit, leaving to the users flexibility in explor-ing and sharexplor-ing the results, and providexplor-ing assistance in managexplor-ing the complexity of the final diagnosis. This type of tool can make the re-sults of medical experiments more easily exploitable, thus accelerating scientific progress.
3.1
Introduction
Transcranial magnetic stimulation (TMS) is a noninvasive and pain-less technique for the evaluation of corticospinal tract function as well as of motor cortex excitability of the human brain and it is used to investigate the central motor pathways of several neurological and psy-chiatric diseases. More specifically, TMS is the most important tech-nique currently available to study cortical excitability [15], and can be used for therapeutic and rehabilitation purposes [16] and [17], re-placing the more painful transcranial electric stimulation (TES). In the last twenty years, TMS has been applied to explore the patho-physiology of many neurological and psychiatric diseases [18], such as multiple sclerosis [19], stroke [20], dementia [21], Parkinson’s disease [22], myelopathies [23], depression [24], schizophrenia [25], and as a possible therapeutic tool for some of these disorders [23].
TMS produces a modification of the neuronal activity of the pri-mary motor cortex stimulated by the variable magnetic field generated
3.1. Introduction 25
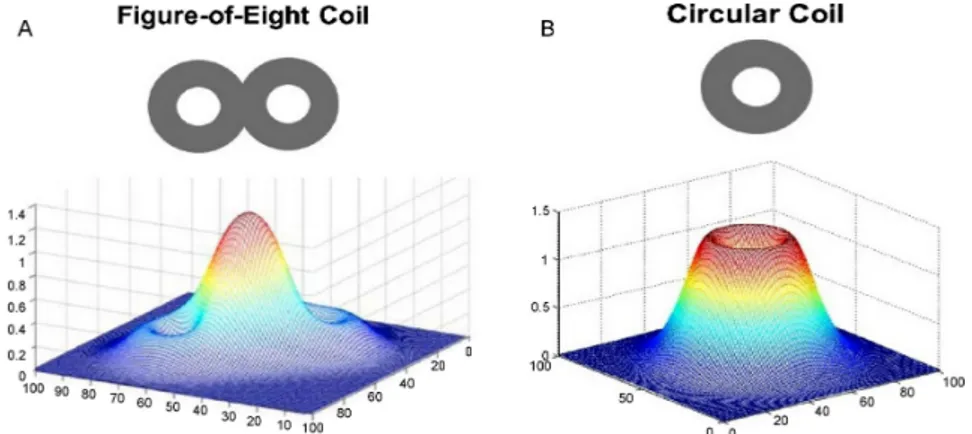
by a coil placed on the scalp. This variable magnetic field, produced by the current flowing in the coil, induces an electric current in the underlying brain tissue. The figure-of-eight or butterfly coil can stim-ulate a relatively focal area (Fig. 3.1), whereas the circular coil a more diffuse one [26].
Figure 3.1: Magnetic field generated by the different coils: (a) mag-netic field by a figure-of-eight coil and (b) magmag-netic field by a circular coil.
When TMS is applied to the primary motor cortex, at appropriate magnetic field intensity, it induces motor evoked potentials (MEP), recorded with an electromyograph, in the muscles that are contralat-eral to the stimulated motor cortex [27].
In clinical practice, TMS may be delivered as either single or paired pulses or regularly repeating pulses (repetitive TMS) in order to assess different parameters about the motor system. The single pulse TMS is used to evaluate the integrity of motor pathways and motor cortex excitability by measuring:
26 Chapter 3. Times Series Analysis: Transcranial Magnetic Stimulation
1. the MEP amplitude (defined as the distance between the lowest negative peak and the highest positive peak and expressed in mV);
2. the motor threshold (defined as the minimum TMS intensity necessary to evoke small-amplitude MEPs, larger than 50 V in amplitude);
3. the central motor conduction time (i.e. the latency difference between the MEPs induced by stimulation of the motor cortex and those evoked by spinal stimulation);
4. the cortical silent period (cSP, defined as a period of electromyo-graphic suppression after a MEP).
Usually, the cortical excitability and intracortical circuits in various diseases are studied by a paired pulse TMS paradigm that couples a subthreshold stimulus (the amplitude is set lower than the patient mo-tor threshold and it is called a conditioning pulse) and a suprathresh-old stimulus (called a test pulse), at different interstimulus intervals (ISIs) through the same coil. The effects of the conditioning pulse on the size of the MEP depend on the duration of the ISIs. Indeed, at ISIs within the range 14 ms there is a strong inhibitory effect on the MEP (in the form of a reduced amplitude) [28], while at ISIs within the range 720 ms there is a facilitatory effect on the MEP (in the form of increased amplitude) [29].
Since there is an extensive use of TMS in different research fields and for each use of TMS several different factors are crucial, a data acquisition and processing system is required to create more standard-ized conditions and to reduce the high intra- and inter-rater variability
3.1. Introduction 27
in the execution of the clinical experiments (typically due to coil po-sitioning and to the time interval between each pulse administration). As far as we know, very few software-based approaches have been proposed for supporting neuroscientists in performing TMS experi-ments. The first attempt was developed in 2000 by Kaelin-Lang and Cohen [30] who tried to help neuroscientists in the execution of TMS experiments, but the system was designed only for data acquisition and for data post-processing, and not for supporting researchers in the whole life-cycle of a research study. In order to improve the func-tionalities of this system, we have recently proposed a flexible TMS data acquisition and processing system affording the scientists an easy and customizable interaction with the TMS hardware, for more effi-cient and accurate data recording and analysis [31]. In this chapter we expand this work by presenting a system that, beyond the cus-tomization of the TMS experiments, uses machine learning techniques to assist scientists in the diagnosing process. In detail, here we pro-pose an easy-to-use tool that enables neuroscientists to design, carry out and analyze scientific studies based on TMS experiments for both diagnostic and research purposes, and assists neuroscientists in each step of the entire study’s workflow. The tool allows neuroscientists to specify any research design, by defining any parameter of a TMS study starting from data acquisition to sample group definition to statistical data analysis. All the data used in the proposed tool, including exper-iment protocol data, is also stored in RDF, thus they can be shared with other systems compliant to semantic web standards. Finally, the tool is also provided with on-line support vector machines (SVM) to help neuroscientists in the diagnosis process.
intro-28 Chapter 3. Times Series Analysis: Transcranial Magnetic Stimulation
duces the signals and the parameters involved in a TMS experiment. In Section 3 the proposed tool is presented, following each step of the workflow carried out by scientists for TMS experiments, from hard-ware interfacing to protocol definition, to experiment execution, to statistical analysis and RDF data storage. In the same section, the proposed on-line SVM approach for supporting scientists in the diag-nosis is described, pointing out its advantages.
3.2
Transcranial Magnetic Stimulation
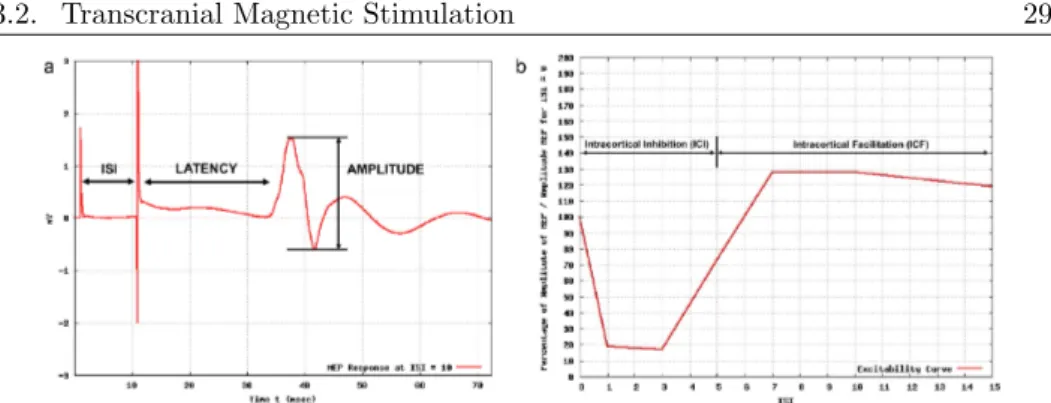
As mentioned in Section 1, TMS may be administered as either sin-gle or paired pulses or regularly repeating pulses (repetitive TMS). Single and paired pulses TMS are used for diagnostic purposes in or-der to assess different parameters about the motor cortex excitability, whereas repetitive TMS is used for therapeutic purposes. Investigat-ing the motor cortex excitability involves measurInvestigat-ing MEP amplitudes, motor threshold and silent period by using the single pulse TMS and the intracortical inhibition (ICI) and facilitation (ICF) by using the paired pulses TMS. The single pulse TMS consists of administering a single pulse and of recording the electromyographic (EMG) response, whereas TMS paired pulses consists of the administration of two pulses (a conditioning one and a test one) with a certain delay, called Inter-Stimulus Interval ISI. Fig. 3.2a shows the MEP response when a paired pulse stimulus is administered to a patient.
In such signals it is possible to identify:
• The latency, which is the time interval between the instant when the stimulation is administered to the subject and the instant
3.2. Transcranial Magnetic Stimulation 29
Figure 3.2: Example of: (a) MEP response when a paired pulse TMS is administered to a patient and (b) cortical excitability curve.
when the muscle starts to move. Latency tends to increase with age and height.
• The amplitude of the muscular response, which is the peak-to-peak excursion expressed in volts of the instrument that mea-sures the muscle response.
The intracortical inhibition (ICI) and facilitation (ICF) are, in-stead, related to the cortical excitability that is estimated by a graph that describes the obtained amplitudes of the muscular responses at varying of the ISIs with respect to the amplitude obtained at ISI = 0. An example of a cortical excitability curve is shown in Fig. 3.2b. Currently all the TMS experiments are carried out by interacting man-ually with the TMS hardware, hence by setting only one ISI per time, whereas the number of repetitions for each ISI is performed by the experimenter by clicking a button on the coil as many times as the number of repetitions. Indeed, although the available TMS equipment is provided with tools allowing the automatic parameter setting, such
30 Chapter 3. Times Series Analysis: Transcranial Magnetic Stimulation
tools use proprietary script languages (similar to programming lan-guages, e.g. the software Signal of the Cambridge Electronic Design) that make the task of designing TMS experiments very difficult and tedious for medical doctors.
In the next section the proposed customizable acquisition and pro-cessing system that permits the full customization of all currently used TMS paradigms (single pulse and paired pulse TMS) is described.
3.3
The Proposed Tool
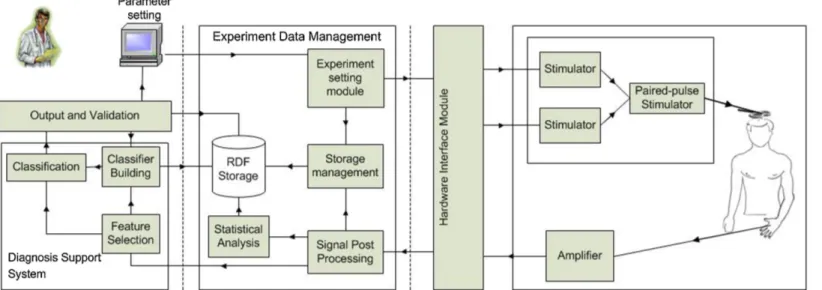
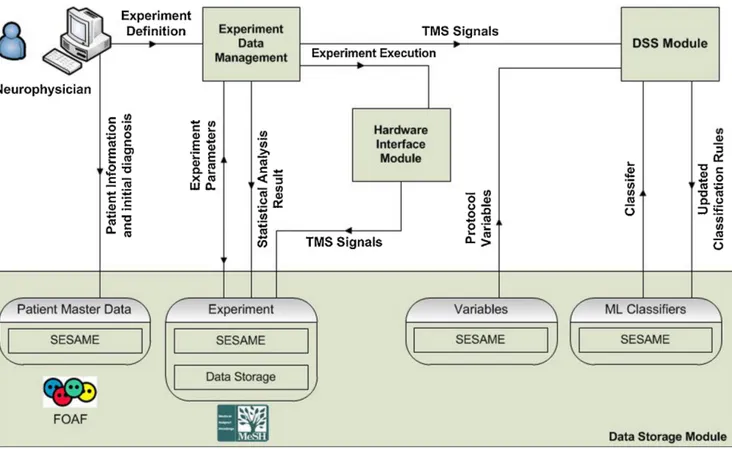
This section describes a customizable data acquisition and process-ing tool that supports neuroscientists in the automatization and cus-tomization of all currently used TMS paradigms, in the data storage and experiment management and in the diagnosis. The architecture of the proposed system is shown in Fig. 3.3 and consists of three main modules:
• Hardware interaction module: it handles the interaction with the hardware equipment for executing TMS experiments; • Experiment data management module: it allows neuroscientists,
through an intuitive interface, to store patient data in RDF for-mat, to set the parameters of TMS experiments, to process the acquired data, to define research studies involving several pa-tients and to analyze data from such studies with statistical tests;
• Diagnosis support system module for supporting neuroscientists especially in the differential diagnosis. This module performs
3.3. The Proposed Tool 31
32 Chapter 3. Times Series Analysis: T ranscranial Magnetic S tim ulation
3.3. The Proposed Tool 33
3.3.1
Hardware Interaction Module
A hardware-interface communicates with the TMS equipment that interacts with a real-time data acquisition unit. This module imple-ments a common programming interface in order to support different data acquisition systems. It is sufficient to import a library (spe-cific for the hardware) for enabling the communication with the TMS hardware.
To date, only the library for communicating with the CED 14011
is present in our system. The CED 1401 A/D is one of the most common signal acquisition systems for TMS response acquisition and stimulation synchronizer and it usually comes with MagStim2
stimu-lators. It features 4 analog inputs capable of acquiring signals with 16 bit resolution at a 500 kHz sampling rate, 2 digital inputs and 2 digi-tal outputs. One of the analog inputs is used to acquire the response signals through a small signal amplifier (CED 1902). Therefore, the CED 1401 receives the user-commands, and synchronizes two stimula-tors MagStims 200, connected on its digital outputs, for the creation of the single pulses, which are further combined in a paired pulse by the Magstim BiStim and are administered to the patient’s cortex through the coil. After the TMS stimulus administration, the muscu-lar response (MEP) is registered by using single-use, low-noise, high conductivity electrodes. Such motor responses are then amplified, us-ing the CED 1902, with a gain rangus-ing from 100 to 1,000,000 (V/V) and a maximum voltage input range 10 V.
1http://ced.co.uk/
34 Chapter 3. Times Series Analysis: Transcranial Magnetic Stimulation
3.3.2
Experiment data management module
To assist the neuroscientists in the entire life-cycle of a TMS based research, the proposed tool provides the users with a set of flexible functionalities for setting all the necessary parameters, for processing the acquired data and for storing the information in order to be pro-cessed by other semantic-based applications or to be shared with other researchers. This module consists of four sub-modules:
• Experiment setting sub-module, for establishing the parameters of a TMS paradigm (ISI, number of repetitions, etc.), the criteria for patients enrollment and the variables (clinical, neuropsycho-logical, etc.) of the patients that should be investigated for the specific scientific research;
• Signal post processing sub-module, for processing the acquired muscular responses in order to remove noise and other inconsis-tencies that may affect the quality of the acquired data;
• Statistical analysis sub-module, for assessing the results of the performed studies;
• Data storage sub-module, for handling the storage of any data produced in the system, from the patient’s data, to statistical analysis results, to classifier’s parameters. It is provided with different RDF repositories for each type of produced data. Experiment setting module
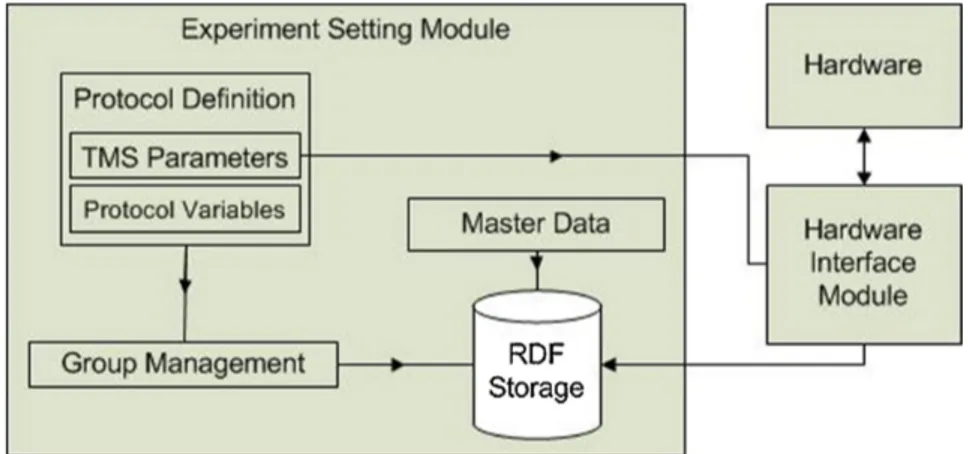
Usually, a research study starts with the definition of a paired TMS protocol that involves the specification of the protocol variables to
3.3. The Proposed Tool 35
be analyzed (clinical, psychiatric, neurophysiological, etc.) that are strictly related to the disease/diseases under investigation, and the TMS parameters, namely the ISIs to administer, the number of rep-etitions for each ISI and the modality of administration (random or sequential). The schema of this module is shown in Fig. 3.4 and the graphical user interface for protocol definition is shown in Fig. 3.5.
36 Chapter 3. Times Series Analysis: T ranscranial Magnetic S tim ulation
3.3. The Proposed Tool 37
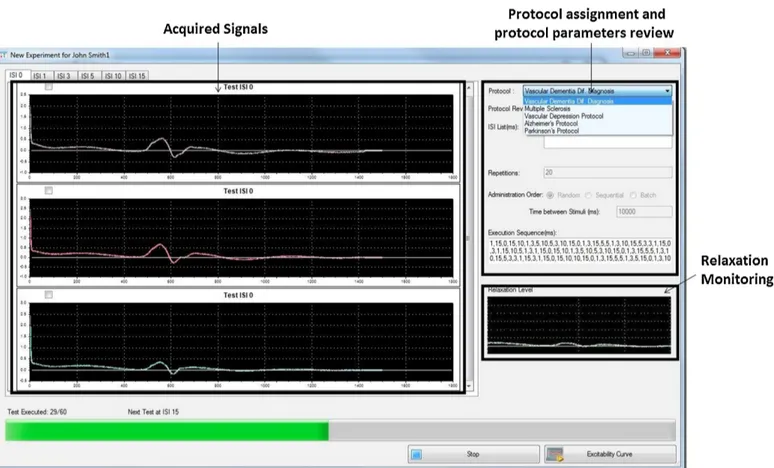
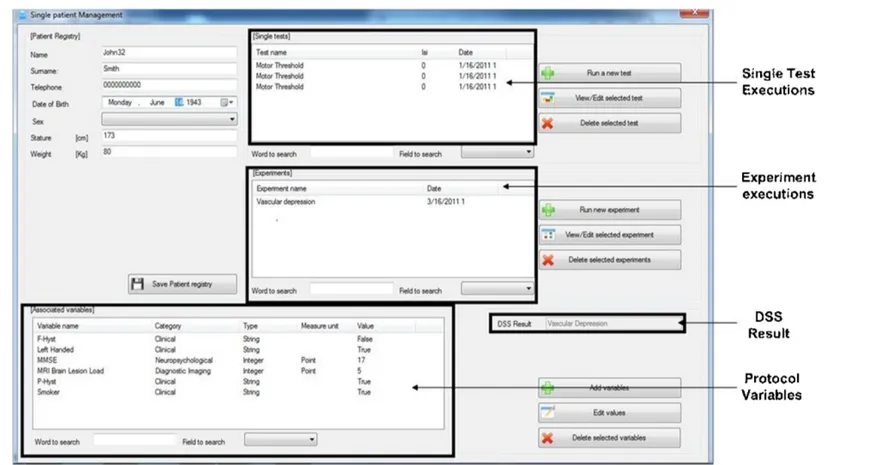
After the protocol definition for a paired-pulse TMS, the data of each patient belonging to a specific study can be acquired. Among the variables specified in the protocol for each study, the common neuro-physiological parameters such as motor threshold, silent period must be estimated using the single pulse TMS. After entering relevant de-mographic/clinical data of the patient under investigation, the paired-pulse TMS with the parameters set during the protocol definition can be administered to the patient. Fig. 3.6 shows the user interface while administrating paired-pulse TMS (with MEP responses) according to a specific protocol: in the left side the plots of MEP responses for a specific ISI are shown, whereas in the right side the TMS protocol set-tings are listed and the monitoring of the subject’s relaxation status is displayed.
38 Chapter 3. Times Series Analysis: T ranscranial Magnetic S tim ulation
3.3. The Proposed Tool 39
Signal post processing module
After protocol setting and execution, the acquired data are processed by the signal post processing module. Indeed, the acquired MEP re-sponses to the administered TMS stimuli rarely respect the quality criteria imposed by the experimenter because of both the variability of the MEP signals during the recording and the noise affecting such signals. MEP signals show, typically, a high variability in the values depending on two main factors: (1) the misalignment of the coil over the patient’s head, which can be corrected by adjusting the coil’s po-sition, and (2) the stimulus administration when the relaxation level of the patient invalidates the muscular response; indeed, if the patient is relaxed the muscular response is generally accurate, whereas if the patient is nervous, suffers from a disease or is on medications that alter the electrical signals that the brain sends to the peripheral nerves, the acquisition of muscular responses is difficult, and often not possible. To deal with this problem, the proposed system includes an on-line monitoring module (right side in Fig. 3.6) that continuously evalu-ates the relaxation level of patients. This module checks the patient’s relaxation level in real-time and eventually informs, in case of inappro-priate levels, the experimenter, who can discard manually the acquired signals. Moreover, the system can be set to discard automatically the MEP responses according to the evaluated relaxation condition. The automatic MEP signal elimination is implemented by estimating if, at the time of the pulse administration, the relaxation level (computed as the area under the muscular response detected by the EMG, e.g. the curve of the MEP signal shown in the right side of Fig. 3.6) is in the range µ ± σ where µ and σ are, respectively, the mean and the
40 Chapter 3. Times Series Analysis: Transcranial Magnetic Stimulation
standard deviation of the previously evaluated relaxation level. The accuracy of the acquired signals may be also influenced by noise. For example, high amplitude 50 − 60 Hz alternate currents are commonly found in any intrinsically noisy environment such as hospitals. The 50 − 60 Hz AC noise is easily predicted and it can be removed by using notch filters in the appropriate frequency range (49 − 51 Hz for Europe, 59 − 61 Hz for the USA). Another type of environmental noise is the high frequency interference due to the us-age of other electrical/electronic devices near to the TMS acquisition equipment. Unfortunately, it is difficult to eliminate such noise with-out altering substantially the base response signal thus our system is provided with a noise removal tool based on Fourier Signal Decom-position. This tool addresses only sinusoidal and predictable noise by analyzing the signal’s frequency components and therefore, the vali-dation of the results is based on visual inspection carried out by the experimenters. The tool permits to re-administer a stimulus if the noise cannot be removed.
Statistical analysis module
After completing the data acquisition phase from the subjects sam-ple, according to the designed protocol, the statistical analysis is per-formed. Usually, this step is done by a statistician, but often medi-cal research centers are not provided by a statistics unit and this is a bottleneck. Therefore, the proposed system implements a statistics module that performs the most common tests for data statistical anal-ysis, in an automatic and transparent way. This module exploits the functionalities of the IBM SPSS software by using the SpssClient API.
3.3. The Proposed Tool 41
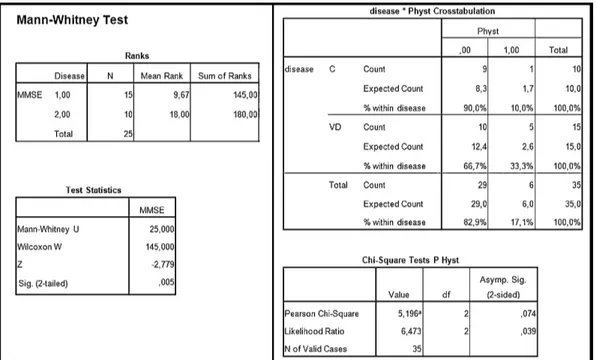
Depending on the variables that the study’s protocol contains, the sta-tistical analysis module is able to automatically decide the appropriate statistical tests to perform. Moreover, according to the distribution of the values of the variables involved in a defined protocol, a specific test is selected. For example, in Fig. 3.7 we have the summary of a TMS protocol carried out on two groups of patients: control patients and patients affected by vascular depression. The variables defined in the protocol are Mini Mental State Examination (MMSE), Familiar History (F-Hyst), Personal History (P-Hyst) and the average (aver-aged on the number of repetition of each ISI) amplitude at ISIs 1, 3, 5, 7, 10 and 15 extracted from the cortical excitability curve.
42 Chapter 3. Times Series Analysis: T ranscranial Magnetic S tim ulation
Figure 3.7: A subset of the patients group on which the vascular depression protocol has been executed. The comparison between these two groups (controls, vascular depression) is performed automatically by means of statistical tests.
3.3. The Proposed Tool 43
According to the type of variable to be compared, our system checks if the variable is a numeric value or a percentage and also performs the normality test to decide if parametric or non-parametric tests should be executed. In the case shown in Fig. 3.7 we have that the MMSE is a numeric variable and it is not normally distributed, therefore the MannWhitney test is performed, whereas since the vari-able P-Hyst is boolean, the comparison between the two groups is performed using the Chi-square test. Fig. 3.8 shows the output of the statistical analysis for the above described example.
44 Chapter 3. Times Series Analysis: T ranscranial Magnetic S tim ulation
3.3. The Proposed Tool 45
Data storage module
The nature of the data processed by the proposed platform permits the adoption of semantic repositories to be used as the system’s storage servers. In fact, by using well established ontologies, like FOAF, and controlled vocabularies, like MeSH3, and by creating an appropriate
schema to describe the whole data structure, including data relation-ships, data can be easily processed by intelligent medical systems, such as the one proposed herein, and by semantic tools. In particular, the whole experiment workflow is enriched with information following an RDF schema that includes:
• The FOAF ontology to describe patient and neuroscientists in-formation;
• The MeSH controlled vocabulary for coding disease, symptoms and signs associated to diseases;
• A set of RDF classes and properties that describe a TMS based scientific study including protocols, variables and TMS technical parameters.
A complete description of the RDF schema is beyond the aim of this chapter, although we provide here some highlights about the underlying design. The variables used in the protocol definition are stored in RDF and are structured as a SKOS vocabulary. In detail, they are grouped in several categories and we have a SKOS collec-tion for each category, e.g. for clinical variable, for neurophysiological variable, for neuropsychological variable, for medical imaging variable.
46 Chapter 3. Times Series Analysis: Transcranial Magnetic Stimulation
We have also defined a class TMSProtocolVariable, for describing the variables (different from the ones above listed) that can be derived only from the TMS, which is also a subclass of SKOS:concept. This allows us to create a collection of TMS variables and to add other features (such as the range of the variables) that are not included in SKOS. In Fig. 3.9 an example of an RDF instance of the proposed schema and describing a generic TMS study is shown.
Personal information about the patient is inserted exclusively by the neuroscientist who carries out the examination and, for privacy purposes, our semantic system replaces the patient’s FOAF profile URI with an appropriate MD5 hash string. The data storage has been implemented by semantic repositories using SESAME servers (see Fig.3.10) to make these information available for other purposes. In detail, four distinct RDF repositories are available:
• The patient master data store is the semantic database where all the information about patients is stored, including parameters for statistical analysis, like age, smoker, gender, etc.
• The variables data store is used for the variables defined during the TMS protocol design.
• The experiment data store is a combination of a semantic repos-itory and a file server. The semantic database stores signal in-formation, such as amplitude, latency, ISI. The file server retains the whole muscular responses in order to extract the aforemen-tioned values and to export the acquired signal in a human read-able format (e.g. an image).
3.3. The Proposed Tool 47
• The classifier data repository, where the classifier’s parameters for diagnosis support are stored.
48 Chapter 3. Times Series Analysis: Transcranial Magnetic Stimulation
3.3. The Prop osed T o ol 49
50 Chapter 3. Times Series Analysis: Transcranial Magnetic Stimulation
3.3.3
Diagnosis support system
Currently, the diagnosis of many neurodegenerative and vascular dis-eases is mainly based on clinical evidence and on imaging techniques such as MRI, PET and SPECT. Often, especially at a very early stage, the clinical evidence of neurodegenerative disorders (e.g. Parkinson disease, Alzheimer disease, etc.) may be very similar to the one of vascular diseases. Medical imaging techniques (especially MRI) may help in such cases: indeed the MRI shows mainly atrophy of the brain in neurodegenerative disorders [32] and ischemic lesions in vascular diseases [33]. The problem arises when both types of evidence are present in an MRI, especially in elderly people who may have brain’s atrophy due to the advanced age, although the main cause of their symptoms could be a vascular disease [34]. An example is the mixed dementia, i.e. the case when neurodegenerative dementia and vascu-lar dementia occur at the same time [35]. The differential diagnosis is difficult not only in the above cases, but also among neurodegen-erative diseases (e.g. Alzheimer disease vs Lewy body disease [36] or Parkinson disease vs Lewy body disease [37]) that could exhibit sim-ilar features at early stages. Therefore, it is necessary to identify the main cause of the observed signs and symptoms in order to provide the appropriate treatment. As mentioned in the introduction, TMS-studies have demonstrated, by investigating motor threshold, cortical silent period ICF and ICI, that the various neurological diseases may involve motor pathways in different ways. Hence, given that TMS pro-vides detailed information about the motor system and since motor system’s alterations have been identified in many neurological dis-eases, an appropriate processing of MEP responses may be used for
3.3. The Proposed Tool 51
supporting the diagnosis.
Under this scenario, a diagnosis support system may play a double role: first, assess if the obtained MEP responses are evidence of neu-rological disorders, and second, support neuroscientists in differential diagnosis. To address the first need, two methods [38] and [39] have been proposed for classifying diseases such as Alzheimer and Subcor-tical ischemic vascular dementia by analyzing the MEP responses of a TMS paradigm. In particular a fuzzy system [39] and a neural net-work [38] were proposed and assessed for the differential diagnosis of Alzheimer and Vascular Dementia by using the following features: la-tency, amplitude, max and min module of the Fourier Transform, max and min module of the Hilbert transform of the MEP responses for ISI 1, 3, 5, 7, 10, and both of them achieved an average accuracy of about 92%. However, since these approaches are disease-specific (the training is done off-line) they cannot be used in a dynamic research and clinical context, such as the one here foreseen, where different TMS paradigms may be implemented for analyzing different diseases. For all of the above reasons, the proposed system is provided with an on-line diagnosis support system (DSS) that uses the above features extracted from a MEP response and it is based on a modified version of a support vector machine for large-scale problems (typically, about 1000 exams per year are executed in a single neurophysiological unit), capable of learning incrementally (averagely, between three and five exams per day are executed). Support vector machines (SVM) have been widely used for implementing classifiers because of their good generalization property [40]. Their main shortcoming is that training is time consuming, thus preventing their use in large-scale problems such as the one at hand. A solution is to resort to a modified SVM
52 Chapter 3. Times Series Analysis: Transcranial Magnetic Stimulation
that supports on-line incremental learning. Several approaches for incremental learning have been proposed. The first attempts were de-veloped by Syed et al. in [41] and by Ruping in [42] by re-training the SVM through new examples combined with the already computed sup-port vectors; however, these approaches are very memory demanding. Differently, to address large-scale issues, approaches based on cluster-ing techniques for down-samplcluster-ing the size of the examples and uscluster-ing the most representative ones for re-training have been proposed [43] and [44]. Therefore, the problems to be solved for on-line SVM are: the on-line selection of the learning data and the re-use of the already computed support vectors. Our diagnosis support system relies on the on-line SVM proposed in [45] that implements on-line training and, at the same time, solves the large scale problem. A detailed evaluation of the achieved performance, in terms of accuracy, and the compari-son with the existing on-line classification systems are beyond the aim of this article, although we can report that in 18 uncertain diagnosis cases, over a totality of about 70 patients, the DSS performed well identifying the four diseases these cases belonged to. The DSS mod-ule is, therefore, used when a new patient whose diagnosis is unknown is inserted into the system (see Fig. 3.11 for the related GUI).
3.3. The Prop osed T o ol 53
CHAPTER
FOUR
IMAGE PROCESSING: SKELETAL BONE AGE
MODELING BY HIDDEN MARKOV MODELS
Having an objective means to evaluate accurately the effective age of individuals, is a problem far from been resolved. Such solution would be very useful in many contexts: from pediatrics, to criminal investigation and to human rights. Assessing effectively the skeletal bone age based on X-Ray images is one way to achieve it but, given the excessive variability in the of the human species machine learning methods are employed to tackle the problem of universal application. There are two globally recognized methods for bone age assess-ment: the Greulich and Pyle method (GP), which is based on the comparison of the X-Ray with an atlas, and the Tanner and White-house method (TW2), which compares the developmental state of a set of bones.
In this chapter, a method and a tool for assessing the skeletal bone
56
Chapter 4. Image Processing: Skeletal Bone Age Modeling by Hidden Markov Models
age using X-Ray images of hands, implementing the TW2 bone age assessment method, is presented. The method combines image pro-cessing methods for enhancing the quality of the input images and Hidden Markov models for the classification task. The method was tested on a dataset made by two expert radiologists and its perfor-mance compared against state-of-the-art methods achieving very high accuracy in the evaluation of the skeletal bone age.
4.1
Introduction
The advancements in computer science have always boosted a large number of scientific fields by both facilitating and hastening the exe-cution of repetitive and/or complex tasks. Image processing methods, in particular, have been used in a variety of applications in diagnostic medicine since their mere conception [46, 47] improving the diagnostic accuracy [48, 49].
Projection radiography was the first non-invasive method to depict the internal structures of the human body and it is currently one of the most used imaging methods. During the last decades a notable increase of interest in determining accurately the bone age by pro-cessing X-Rays, has been observed. This interest arises from the fact that having an accurate and, more importantly, objective assessment of the age of an individual results useful in many applications ranging from detecting and evaluating hereditary, hormonal or developmen-tal disorders [50, 51] to creating indisputable evidence in legal cases where the real age of a person can determine his eligibility for criminal sanctions [52], legal rights [53] etc.
4.1. Introduction 57
In the clinical practices two different approaches have been used for skeletal bone age assessment: the Greulich and Pyle (GP) [54] and the Tanner and Whitehouse (TW) [55] methods. Both approaches have been tested from the scientific community and their validity is already confirmed [56, 57, 58, 59].
The GP method, which is the simplest and most intuitive one, relies on comparing a subject’s X-Ray of the left wrist to a gold stan-dard atlas categorized according to age and sex. The TW2 method uses a-priori knowledge and creates a detailed analysis of the features of twenty predetermined regions of interest (ROIs) located in the left hand’s bones, including epiphysis/metaphysis ROI (EMROI), carpal ROI (CROI), radius, and ulna. Each ROI is evaluated by assigning to it a letter, which represents the developmental status, ranging from A, meaning that the bone is completely absent, to I, which represents a fully developed, mature bone. As a final step, by summing up all the ROI scores the effective bone age is calculated.
The GP method is less complicated and generally faster to im-plement than the TW2 method. However, the latter offers better reproducibility and accuracy [60] and, because of its modular nature, TW2 is proner to automatization [61].
Although much research has been carried out the problem of es-timating accurately the bone age of an individual, is far from being solved. This is demonstrated by the evergrowing number of surveys and future directions works (e.g. [62, 63, 64]).
In this chapter, we present a method and a tool aiming at de-termining skeletal bone age based on X-Rays of the left wrist using a modified version of the TW method based on EMROIs only, combined with Hidden Markov Model-based classifiers for refining the obtained
58
Chapter 4. Image Processing: Skeletal Bone Age Modeling by Hidden Markov Models
results. In the next section a review of the existing approaches is found while Section 3 describes in detail the application and its inner workings. The last section shows some performance measurements obtained by the actual usage of the system.
4.2
Related Works
Early attempts for “automating” the process of skeletal bone age as-sessment can be dated back to the early 90’s, and in particular, in [65] where the authors present the first system employing simple image pro-cessing techniques, namely Sobel Gradient and thresholding, in order to make the image more suitable for the bone age assessment task. Measurements of the phalanxes were compared to the standard pha-langeal length table [66] and the effective age was calculated. While this method suffered from the classical “infancy” problems (e.g. image quality, reproducibility etc..), it can be considered as one of the first steps towards more complex and accurate systems for bone age assess-ment. The methods for assessing skeletal bone age can be categorized in three main groups: fuzzy based, deformable models and machine learning mainly trying to reproduce the TW2 method.
Many methods have been proposed for dealing with the skeletal bone age estimation, by using fuzzy logic-based approaches. In [67] the authors present an automatic skeletal bone age assessment system for young children (from 0 to 7 years old) using only carpal bones. This method initially employs fully automatic carpal bone segmen-tation and morphological feature analysis and subsequently applies a fuzzy classification approach in order to assess the real bone age.
4.2. Related Works 59
Other fuzzy-based methods combined with morphologic features of the carpal bones can be found in [68] where the authors also integrate Principal Component Analysis and statistical correlation or Support Vector Machines [69] in order to build a growth model of the carpal bones, declaring a success rate of 87%-89%, although they considered a relatively large admissible error of 1.5 years. Fuzzy classifiers are used in [70] for automating the GP method. Although it achieves a very high accuracy rate at lower age groups (0 to 2 years), its performance deteriorates when X-Rays of older subjects were used.
Deformable models (and especially Active Shape Models) have been largely used for skeletal bone age assessment [71, 72, 73]. Despite deformable model based approaches are capable of modeling EMROI shapes, they are ad-hoc solutions relying on many parameters with results that depend largely on the quality of the input images. The authors in [74] suggest that one of the main difficulties in assessing the age of an individual, is the irregular (i.e. largely varying) development of the trapezium and trapezoid bones and they propose a method, based on the integration of anatomical knowledge and trigonometry theory for the TW2 assessment.
Machine learning techniques have been also employed in automatic skeletal bone age assessment systems. In [75], the X-Ray image is seg-mented by using a K-means clustering algorithm applied on a gray-level co-occurrence matrix but, even though it is stated that the ac-curacy of the method is high, no performance evaluation was carried out extensively. A Support Vector Machine and correlation proto-types [76], and in [77], Support Vector Regression and smart class mapping have been proposed that, however, perform poorly in terms of accuracy.
60
Chapter 4. Image Processing: Skeletal Bone Age Modeling by Hidden Markov Models
Contrary to the majority of the existing systems based on a single evaluation method, BoneXpert [78] is a system for automatic skeletal bone age assessment that combines both the TW and GP methods. The main drawback of BoneXpert, however, is its high image rejec-tion rate, meaning that it does not process low quality images and it often requires a heavy preprocessing step in order to make the image appropriate for processing.
While there exist many computer-based EMROI classification sys-tems that employ machine learning approaches (e.g. Neural Networks, Fuzzy Classifiers, Support Vector Machines etc.) one of the main lim-itations is the lack of methods to model bone shapes effectively and dynamically. To deal with this issue we employ Hidden Markov Mod-els which is a model of a sequential process changing states at discrete sequence intervals thus able to model ROIs’ discrete stage. A further contribution of this chapter is the integration of several existing works, from preprocessing to finger extraction to stage assignment, into a uni-fied tool which can be used by clinicians. In the following section we present a new approach, which extends our previous work [74], for efficiently assessing the skeletal bone age from an X-Ray of the left hand of a subject.
4.3
The Proposed Tool
Generally, the existing applications for skeletal bone age evaluation follow a standard workflow (Fig. 4.1) model. In such model, the in-put image is initially processed by noise removal (for enhancing the clearness of the input image) and background subtraction algorithms