p53 at the endoplasmic reticulum regulates apoptosis
in a Ca
2
+
-dependent manner
Carlotta Giorgia,1, Massimo Bonoraa,1, Giovanni Sorrentinob, Sonia Missirolia, Federica Polettia, Jan M. Suskic, Fabian Galindo Ramirezd,e, Rosario Rizzutof, Francesco Di Virgilioa, Ester Zitog, Pier Paolo Pandolfih,i,
Mariusz R. Wieckowskic, Fabio Mammanod,e, Giannino Del Salb,i, and Paolo Pintona,2
aDepartment of Morphology, Surgery and Experimental Medicine, Section of Pathology, Oncology and Experimental Biology, University of Ferrara, Ferrara 44121, Italy;bLaboratorio Nazionale del Consorzio Interuniversitario per le Biotecnologie (LNCIB), 34012 Trieste, Italy;cDepartment of Biochemistry, Nencki Institute of Experimental Biology, Warsaw 02-093, Poland;dDepartment of Physics and Astronomy, University of Padua, Padua 35129, Italy;eVenetian Institute of Molecular Medicine, Padua 35129, Italy;fDepartment of Biomedical Sciences, University of Padua, Padua 35131, Italy;gDulbecco Telethon Institute, Istituto di Ricerche Farmacologiche Mario Negri, Milan 20156, Italy;hCancer Genetics Program, Department of Medicine and Pathology, Beth Israel Deaconess Medical Center, Harvard Medical School, Boston, MA 02215; andiDipartimento di Scienze della Vita, Univeristà degli Studi di Trieste, 34128 Trieste, Italy
Edited by Carol Prives, Columbia University, New York, NY, and approved December 30, 2014 (received for review June 9, 2014) The tumor suppressor p53 is a key protein in preventing cell
transformation and tumor progression. Activated by a variety of stimuli, p53 regulates cell-cycle arrest and apoptosis. Along with its well-documented transcriptional control over cell-death pro-grams within the nucleus, p53 exerts crucial although still poorly understood functions in the cytoplasm, directly modulating the apoptotic response at the mitochondrial level. Calcium (Ca2+) transfer between the endoplasmic reticulum (ER) and mitochondria represents a critical signal in the induction of apoptosis. However, the mechanism controlling this flux in response to stress stimuli remains largely unknown. Here we show that, in the cytoplasm, WT p53 localizes at the ER and at specialized contact domains be-tween the ER and mitochondria (mitochondria-associated mem-branes). We demonstrate that, upon stress stimuli, WT p53 accumu-lates at these sites and moduaccumu-lates Ca2+homeostasis. Mechanistically, upon activation, WT p53 directly binds to the sarco/ER Ca2+-ATPase (SERCA) pump at the ER, changing its oxidative state and thus leading to an increased Ca2+load, followed by an enhanced transfer to mi-tochondria. The consequent mitochondrial Ca2+overload causes in turn alterations in the morphology of this organelle and induction of apoptosis. Pharmacological inactivation of WT p53 or naturally occurring p53 missense mutants inhibits SERCA pump activity at the ER, leading to a reduction of the Ca2+signaling from the ER to mitochondria. These findings define a critical nonnuclear function of p53 in regulating Ca2+signal-dependent apoptosis.
p53
|
endoplasmic reticulum|
mitochondria-associated membranes|
calcium|
apoptosisT
he master tumor suppressor p53 is the hub of numerous signaling stress pathways that control cell fate (1). The in-activation of p53 function is a pivotal aspect of tumor formation in different human cancers. Its activity is crucial for regulating efficient cell death in cancer cells upon cellular stress (1) evoked by chemotherapeutic drugs or radiation. Many cancer cells, how-ever, contain a mutantTP53 gene or a nonfunctional p53 protein and are thus unable to respond efficiently to these treatments. Indeed, more than 50% of human cancers harbor somaticp53 gene mutations (2). In addition to sporadic tumors, inherited het-erozygous loss-of-function mutations inTP53 cause Li–Fraumeni syndrome, which confers a high familial risk of various types of cancer (3). However, the mechanisms by which wild-type p53 suppresses tumor growth and influences the response to drug treatment by mediating apoptosis are not yet fully understood.Two pools of p53, cytoplasmic and nuclear, have been well-established to independently respond to stress (4) through tran-scription-dependent and -independent mechanisms (5, 6), both of which are regulated by posttranslational modifications that al-low its accumulation and the full activation of its proapoptotic functions (7).
The cytoplasm is the main source of p53 involved in the nontranscriptional pathway through mitochondrial translocation, whereas the nuclear p53 pool is responsible for transcription-dependent mechanisms (4, 6, 7).
We recently demonstrated the unexpected localization of the promyelocytic leukemia protein (PML) at the endoplasmic re-ticulum (ER) and at mitochondria-associated membranes (MAMs) (8), a specialized domain of close contact between the ER and mitochondria that is involved in maintaining a dynamic cross-talk between the two organelles (9). PML is a tumor suppressor that physically interacts and synergizes with p53 during apoptosis in-duction (10). ER–mitochondrial cross-talk is fundamental for the up-regulation of mitochondrial metabolism in stimulated cells (11) and plays a key role in decoding Ca2+-mediated apoptotic signals (12– 16). The down-regulation of ER–mitochondrial Ca2+transfer caused
by B-cell lymphoma 2 (Bcl-2) overexpression or PML impairment is important for the antiapoptotic effects of these proteins (17).
Recent studies have suggested that p53 participates in apo-ptosis induction by acting directly at mitochondria. Because p53 can mediate apoptosis without its DNA-binding domain (the domain proposed to be fundamental for the targeting of p53 to mitochondria), the mitochondrial localization of p53 is likely not the only transcription-independent mechanism by which p53 promotes apoptosis (18).
Significance
Accumulating evidence has underscored the role of cytosolic p53 in promoting cell death. Different reports have revealed that p53 participates in apoptosis induction by acting directly at mitochondria. However, because p53 can mediate apoptosis without its DNA-binding domain (the domain proposed to be fundamental for the targeting of p53 to mitochondria), the mitochondrial localization of p53 is likely not the only transcription-independent mechanism by which p53 promotes apoptosis. Here we demonstrate that p53 at the endoplasmic reticulum (ER) and at mitochondria-associated membranes, interacting with sarco/ER Ca2+-ATPase pumps, modulates ER– mitochondria cross-talk and, in turn, Ca2+-dependent apoptosis. Author contributions: C.G., M.B., and P.P. designed research; C.G., M.B., G.S., S.M., F.P., J.M.S., F.G.R., and E.Z. performed research; C.G., M.B., G.S., S.M., F.P., J.M.S., F.G.R., R.R., F.D.V., E.Z., P.P.P., M.R.W., F.M., G.D.S., and P.P. analyzed data; and C.G., G.D.S., and P.P. wrote the paper.
The authors declare no conflict of interest. This article is a PNAS Direct Submission.
1C.G. and M.B. contributed equally to this work.
2To whom correspondence should be addressed. Email: [email protected].
This article contains supporting information online atwww.pnas.org/lookup/suppl/doi:10.
1073/pnas.1410723112/-/DCSupplemental.
www.pnas.org/cgi/doi/10.1073/pnas.1410723112 PNAS | February 10, 2015 | vol. 112 | no. 6 | 1779–1784
CELL
Here we investigated and discuss whether an extranuclear localization of p53 could mediate its tumor-suppressive function through a nontranscriptional, Ca2+-dependent pathway. Results
p53 Accumulation at the ER/MAM Compartments After Anticancer Treatments Enhances Cell Death. To establish whether another nonmitochondrial p53 aspect could be involved in a nontranscrip-tional proapoptotic pathway, we verified the intracellular localiza-tion of p53 using biochemical and immunofluorescence techniques. Using a previously described subcellular fractionation protocol (19), we purified ER and MAM fractions from primary mouse embryonic fibroblasts (MEFs) and the human colon cancer HCT-116p53+/+cell line. Similar to PML, p53 was localized to the ER and MAMs as well as the cytosolic fraction (Fig. 1A andFig. S1A) under untreated conditions.
Therefore, we investigated whether adriamycin (ADRIA), a chemotherapeutic agent, or H2O2, an oxidative stress mediator,
would change the subcellular localization of p53. An enrichment at the ER/MAMs was detected after p53 induction by either treatment (Fig. 1B and C andFig. S1B and C). We confirmed p53 accumulation at the ER/MAMs by immunofluorescence using digital imaging 3D deconvolution (Fig. 1D–F). The colocalization of p53 and the ER was analyzed in p53+/+MEFs as an overlap between the p53 and ER-marker (Sec61b-GFP) signals. The suitability of a colocalization analysis was verified by sampling the cytoplasmic portion of each cell and performing the randomized Costes et al. method (20). In all of the analyzed samples, the colocalization probability was higher than 99%. As expected, the overlap of p53 signal and ER-marker signal was increased in re-sponse to stress (Fig. 1G).
MEFs have previously been shown to be resistant to apoptosis induced by thapsigargin (TG) in the absence of p53 (21). In ad-dition, p53 localizes to the ER/MAM compartments. Therefore,
we investigated whether p53 could be a fundamental component of the ER stress-induced apoptotic pathway. Using different ER-stress inducers, we showed a marked reduction in the number of apoptotic cells in p53−/− MEFs compared with wild-type (WT) cells using flow cytometry analysis (Fig. 2A and B), cytochrome c release (Fig. 2C and D), and automated cell analysis based on morphological parameters and propidium iodide staining (Fig. 2E). Apoptotic cell death, evoked by H2O2, was blocked in cells
pretreated with a caspase inhibitor (Fig. 2F) but enhanced after ADRIA-induced p53 accumulation at the ER/MAMs (Fig. 2G–I).
Fig. 1. p53 localizes at the ER and MAMs. (A–C) Detection of p53 by immu-noblotting in HCT-116 p53+/+fractions. (A) p53 localization in untreated con-dition (UNT). Accumulation of p53 at the ER and MAMs in HCT-116 p53+/+cells after adriamycin (ADRIA) induction (1μM, 6 h) (B) or after H2O2treatment (500 μM, 6 h) (C). (D–F) Colocalization of p53 (red) and Sec61-GFP (used as ER marker; green) in p53+/+MEFs under untreated conditions (UNT) (D) and after ADRIA (E) or H2O2(F). (Insets) A higher magnification of the images is presented. (G) p53 activation increased its ER colocalization. Colocalization of p53 and ER in p53+/+ MEFs quantified as the proportion of total ER marker overlapping the p53 signal (by Mander’s coefficient colocalization method). To allow for a better appreciation of colocalization of p53 with the ER, a cytoplasmic portion was selected and the contrast was increased. Bars, SEM; *P< 0.05.
Fig. 2. Activation and accumulation of p53 at the ER/MAMs render cells more prone to death. (A and B) Percentage of apoptosis induced by (A) H2O2(500μM, 12 h) in p53+/+or p53−/−MEFs or (B) ceramide (C2; 60μM, 12 h), thapsi-gargin (TG; 2μM, 12 h), tunicamycin (TUN; 6 μM, 12 h), brefeldin A (BFA; 5 mg/mL, 12 h), or menadione (MEN; 15μM, 12 h) in p53−/−MEFs. The data show the percentage of cell death in the whole cell population negative for annexin-V-FITC and propidium iodide (PI) staining, as analyzed by flow cytometry. (C) Detection of cytosolic cytochrome c release and supernatant HMGB1 release (a necrotic marker) by immunoblotting in p53+/+or p53−/−MEFs treated with H2O2(500μM, 12 h) compared with the untreated condition. Actin was used as a loading control for the cytosolic fraction. (D) Cytosolic cytochrome c release in p53+/+and p53−/−MEFs treated with C2 (60μM, 12 h), TUN (6 μM, 12 h), or TG (2μM, 12 h). (E) Percentage of apoptosis versus necrosis analyzed by au-tomated imaging and cell scoring based on morphological parameters and PI staining in p53+/+and p53−/−MEFs treated with H2O2(500μM, 12 h), MEN (15μM, 12 h), TUN (6 μM, 12 h), TG (2 μM, 12 h), or C2 (60 μM, 12 h). (F) Z-VAD-FMK treatment inhibits cell death in p53+/+MEFs (H2O2, 500μM, 6 h). (G) Quantification of cell survival induced by H2O2(500μM, 12 h) through auto-mated nucleus count analysis. Bars, SEM. (H) Representative microscopic fields of p53+/+and p53−/−MEFs under untreated conditions, pretreated with ADRIA (1μM, 6 h) and then H2O2(1 mM, 12 h). (I) Detection of apoptosis by immu-noblotting in p53+/+and p53−/−MEFs and p53+/+pretreated with ADRIA (1μM, 6 h) under untreated conditions and with H2O2(500μM, 6 h).
p53 Induction at the ER/MAMs Regulates Ca2+Homeostasis, Allowing for Mitochondrial Fragmentation and Apoptosis.The key process connecting apoptosis to the ER–mitochondrial interaction is an alteration in Ca2+ homeostatic mechanisms (13, 22, 23) that results in massive and/or prolonged mitochondrial Ca2+overload (13, 24, 25). We thus examined the effect of p53 down-regulation and induction on Ca2+homeostasis. Using recombinant aequorin probes (26), [Ca2+] was measured selectively in the cytosol and in organelles acting as a source (ER) or target (mitochondria) of cellular Ca2+signals. A striking difference was evident in [Ca2+]ER(Ca2+concentration within ER lumen) steady-state
levels (Fig. 3A). After p53 induction by ADRIA the [Ca2+] ER
was higher, whereas the loss of p53 caused a reduction in the [Ca2+]ERcompared with WT. Representative traces are shown in
the figures whereas the full dataset is included inTable S1. In agreement with the [Ca2+]ER data, the [Ca2+] increases
evoked by agonist stimulation (ATP) in the cytosol and in the mitochondria were significantly higher after ADRIA treatment and lower inp53−/−MEFs than in WT MEFs (Fig. 3B and C). Similarly, increased Ca2+traffic from the ER to the mitochon-dria was observed in both HeLa cells overexpressing a WT p53 construct (4) (Fig. S2 A–C) and p53+/+ HCT-116 cells upon ADRIA treatment (Fig. S2D), as well as in p53−/−MEFs after the reintroduction of WT p53 (Fig. S2E). In contrast, ADRIA treatment in p53−/−MEFs had no effect on Ca2+homeostasis (Fig. 3A–C, blue traces). The effect of p53 at the ER was also confirmed by analyzing mitochondrial Ca2+ uptake in permeabilized cells exposed to the same [Ca2+]. Under these conditions, no differences were observed with regard to the p53 levels (Fig. S2F), indicating that the p53-dependent Ca2+responses previously described were due to alterations of the source of the Ca2+signals, the ER.
As mentioned above, there is a strong agreement in the lit-erature linking Ca2+transfer from the ER to the mitochondria and the effects of apoptotic stimuli (13, 22, 23, 25). Therefore, we investigated whether the absence or the induction of p53 could alter [Ca2+]mafter apoptotic stimuli. We observed that the
agonist-dependent mitochondrial Ca2+ response, after the oxi-dative apoptotic inducer H2O2, was reduced proportional to
p53 expression (Fig. S3A). Using the ER-targeted, FRET-based Ca2+-sensitive D1ER-YC4.3 probe, we measured the effect of p53 on the progressive release of Ca2+from the ER caused by H2O2. The normalized FRET ratio (proportional to [Ca2+]ER)
was observed to correlate with p53 levels (Fig. 3D andFig. S3B). Administration of H2O2 caused a progressive depletion of
Ca2+from the ER (as revealed by a reduction in the normalized FRET ratio) with consequent increases in [Ca2+] in the cytosol (Fig. 3E andFig. S3C) and mitochondria (Fig. 3F andFig. S3D). Furthermore, this event appeared to be proportional to p53 levels. To assess whether the observed ER Ca2+ overload is a proapoptotic condition, we analyzed the mitochondrial morphology after apoptotic stress induction. The mitochondria of WT p53 and p53−/−MEFs were labeled with targeted GFP, and the mitochondrial structure was evaluated by confocal microscopy. Treatment with H2O2for 3 h caused a strong reduction in the
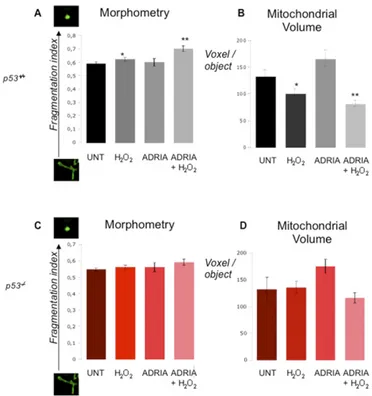
average mitochondrial volume in WT cells, as expected, upon network breakage (Fig. 3G, i and ii, and H, i and ii, andFig. S4A andB). The induction of p53 by ADRIA alone did not significantly affect mitochondrial morphology (Fig. 3G, iii, and H, iii, andFig. S4 A and B), whereas ADRIA treatment followed by H2O2exposure
induced a stronger increase in the fragmentation index value (Fig. 3 G, iv, and H, iv, andFig. S4A and B) compared with H2O2alone.
p53−/−cells treated with H
2O2did not show significant changes in
the mitochondrial network (Fig. 3I and J andFig. S4C and D). Fig. 3. Deregulation of Ca2+homeostasis after p53 induction is a stress signal for mitochondrial struc-ture and a trigger for apoptosis. (A–C) Measure-ments of [Ca2+] using recombinant aequorin upon agonist stimulation (100μM ATP) in the ER (A), cy-tosol (B), and mitochondria (C). (D) ER Ca2+release induced by H2O2measured using a FRET-based Ca2+ -sensitive D1ER-YC4.3 probe; the normalized FRET ratio of D1ER-YC4.3 was assumed as the intraluminal [Ca2+]. (Insets) A magnified portion of the first 2 min of the recording as basal. (E) Cytosolic Ca2+response induced by H2O2(2 mM) in MEFs loaded with the Ca2+-sensitive fluorescent dye Fura-2. The kinetic behavior of the [Ca2+]c(Ca2+concentration within cytoplasm) re-sponse is presented as the ratio of fluorescence at 340 nm/380 nm. (F) Analysis of [Ca2+]m(Ca2+ con-centration within mitochondrial matrix) during oxida-tive stress upon H2O2stimulation (2 mM). Isosurface rendering of representative p53+/+(G and H) and p53−/ −(I and J) MEFs expressing mitochondrial GFP in basal conditions (UNT), after adriamycin (1μM, 6 h), and/or H2O2exposure (500μM, 3 h). (H and J) High-resolution imaging of mitochondrial fragmentation during p53 activation and oxidative stress induction in p53+/+and p53−/−MEFs.
Giorgi et al. PNAS | February 10, 2015 | vol. 112 | no. 6 | 1781
CELL
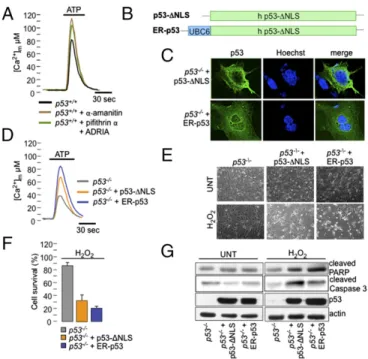
Naturally Occurring p53 Mutants Lose Their Ability to Modulate Ca2+ Responses. To exclude the possibility that a transcription-dependent pathway of p53 accounts for its effect on Ca2+ homeo-stasis (and, in turn, on the sensitivity of ER-stress apoptotic stimuli), we used different strategies: specific drugs blocking the transcriptional arm of p53 (Fig. 4A) and p53-targeted chimeras, p53-ΔNLS (a nuclear import-deficient p53 mutant; Fig. 4 B and C) and ER-p53 (a chimera containing the human p53-ΔNLS protein targeted to the outer surface of the ER; Fig. 4B and C) (27).
As pharmacological treatments, we usedα-amanitin, a highly specific and potent inhibitor of RNA polymerase II transcrip-tion, or a combination of pifithrinα, which selectively blocks p53-mediated transcription, and ADRIA to activate the remaining p53 pathways (28). As expected, we observed increased mitochon-drial Ca2+responses under both conditions (Fig. 4A), reflecting increased ER Ca2+ release and indicating a nontranscriptional role for p53 in Ca2+modulation.
Moreover, the expression of p53-ΔNLS or ER-p53 chimeras in p53−/−MEF (Fig. 4D), HeLa (Fig. S5A), and H1299 (Fig. S5B)
cells enhanced mitochondrial Ca2+signaling, similar to the effect of p53 induction by ADRIA (Fig. 3C). This effect was further associated with a reestablished sensitivity to apoptosis induced by ER stress (Fig. 4E), as determined by cell count analysis (Fig. 4F) and PARP and caspase 3 cleavage (Fig. 4G).
In contrast, MDA-MB 468 cells, harboring the p53 273H mutant, were not sensitive to p53-ADRIA induction (Fig. 5A).
Accordingly, naturally occurring p53 mutants expressed in HCT-116p53−/−cells (or in HeLa and H1299 cells;Fig. S5A and B) lost their ability to increase the Ca2+response (Fig. 5B).
Moreover, those mutants were unable to modulate Ca2+ ho-meostasis also failed to rescue the sensitivity to apoptosis after oxidative stress treatment (Fig. 5C–E), although the apoptotic genes were expressed equally in cells expressing mutant p53 (Fig. S5C). A similar effect was observed when these mutations were introduced into p53-ΔNLS or ER-p53 chimeras (Fig. S6).
These data show that Ca2+-mediated apoptosis is a transcrip-tion-independent pathway regulated by p53 at ER/MAMs. p53 Modulates Ca2+Homeostasis and Apoptosis by Interacting with the Sarco/ER Ca2+-ATPase Pump at the ER, Changing Its Redox State. To dissect the mechanism by which WT p53 exerts its impact on Ca2+ homeostasis upon activation and accumulation at ER/ MAM compartments, we examined whether p53 modulates the activity of sarco/ER Ca2+-ATPase (SERCA) pumps, which me-diate ER Ca2+ reaccumulation. Thus, we tested whether p53 functionally and physically interacts with SERCA. The in vitro interaction between p53 and endogenous SERCA was first detected using an MBP pull-down assay (Fig. 6A andFig. S7A) in H1299 cells lacking p53, and the interaction was confirmed by the endogenous coprecipitation of the two proteins in WT MEFs (Fig. S7B). Next, we mapped the region of p53 involved in the interaction with SERCA. To this end, we used HA-tagged p53 deletion constructs: HAp53 1–175, HAp53 175–393, HAp53 294–393, and the full-length HA-p53. In coimmunoprecipitation experiments performed in H1299 cells transfected with the HA-p53 constructs, SERCA selectively bound to the C-terminal regulatory domain of p53, a region where posttranslational mod-ifications can modify the interaction of p53 with partner proteins Fig. 4. p53 controls mitochondrial Ca2+homeostasis and, in turn, apoptotic
sensitivity from ER/MAM compartments. (A) Agonist-dependent [Ca2+]m re-sponse in p53+/+MEFs after pharmacological block of the transcriptional arm of p53. (B) Schematic representation of p53-ΔNLS and ER-p53 chimeras. (C) Im-munofluorescence images of p53−/−MEF cells expressing the p53-ΔNLS or ER-p53 constructs stained with anti-ER-p53 antibody (green) and Hoechst (nuclear marker). (D) Mitochondrial Ca2+response in p53−/−MEFs after the reintro-duction of an ER-targeted chimera, ER-p53 or p53-ΔNLS. (E) Representative microscopic fields, from three independent experiments, of p53−/− MEFs expressing p53-ΔNLS and ER-p53 before and after H2O2treatment (1 mM, 12 h). (F) Evaluation of cell-death induction by H2O2(500μM, 12 h) through auto-mated nucleus count analysis in p53−/−MEFs, p53−/−MEFs expressing ER-p53, and p53−/−MEFs expressing p53-ΔNLS. Bars, SEM. (G) Analysis of apoptotic markers by immunoblot in p53−/−MEFs and p53−/−MEFs expressing p53-ΔNLS and ER-p53 under untreated conditions and after H2O2treatment (500μM, 6 h).
Fig. 5. p53 mutants cannot modulate the mitochondrial Ca2+response and thus apoptosis. (A) Mitochondrial Ca2+response after agonist stimulation in HCT-116 p53−/−cells and HCT-116 p53−/−cells after reintroduction of the p53-ΔNLS and ER-p53 chimeras or naturally occurring p53 mutants R175H and R273H. (B) Mitochondrial [Ca2+] after ATP stimulation measured in MDA-MB 468 cells, harboring p53 273H mutation, under control conditions and after adriamycin treatment (1μM, 6 h). (C and D) Evaluation of apoptosis induction in HCT-116 p53−/−cells expressing p53-ΔNLS and ER-p53 chimeras or naturally occurring p53 mutants R175H and R273H after treatment with H2O2using (C) immunoblot detection of cleaved PARP and cleaved caspase 3 (500μM, 6 h) and (D) automated cell count analysis (500μM, 12 h). Bars, SEM. (E) Repre-sentative images of HCT-116 p53−/−cells expressing different p53 constructs under untreated conditions and after H2O2treatment (1 mM, 12 h).
(Fig. 6B andFig. S7C). However, the interacting fragment alone was not sufficient to modulate Ca2+homeostasis and apoptosis (Fig. S7D and E), suggesting that the entire p53 protein (or the majority of it) is required for its biological activity.
Interestingly, the naturally occurring p53 mutants R175H and R273H were unable to be coimmunoprecipitated with the SERCA protein. In contrast, the p53-ΔNLS protein retained this ability (Fig. 6C).
Finally, to establish whether p53 has a direct effect on SERCA activity, we analyzed the kinetics of ER Ca2+accumulation both in vivo and in vitro. The Ca2+accumulation rate was higher in the ER vesicles isolated from the liver ofp53+/+ mice treated intraperitoneally with ADRIA compared with those obtained fromp53+/+andp53−/−mice (Fig. 6D). Similarly, the rate of ER
Ca2+accumulation, measured in MEFs, increased proportionally in a time-dependent manner with the induction of p53 by ADRIA, indicating a stimulatory role of p53 in SERCA activity (Fig. 6E), without affecting SERCA expression levels (Fig. S8A). These data were confirmed in HeLa cells overexpressing WT p53 and p53-NLS chimera (Fig. S8 B and C). To confirm the importance of SERCA activity in the Ca2+-dependent apoptotic pathway, we evaluated the effect of SERCA overexpression on the Ca2+ re-sponse and cell death in p53−/− MEFs. We observed an in-creased mitochondrial Ca2+uptake (Fig. S8D) that correlated with increased levels of cleaved caspase 3 upon H2O2treatment
(Fig. S8E), indicating that the activation of SERCA is sufficient to rescue the sensitivity to apoptosis in p53-deficient cells.
Next, we investigated the possible mechanism by which p53 stimulates SERCA activity upon binding. To this end, we ana-lyzed whether p53 activation affects the oxidative state of the SERCA protein, which is known to modulate its activity (29). We thus compared the level of hyperoxidized sulfenylated proteins in HCT-116p53+/+and MDA-MB 468 cells after the induction of WT p53 and mutant p53, respectively. Cells and lysates were exposed to dimedone, a chemical that selectively modifies sulfenylated cys-teines, and the dimedone-modified proteins were detected by im-munoblotting with an antibody to dimedone (30). In the absence of dimedone, the antibody gave a weak background signal (Fig. S9).
To understand whether the levels of sulfenylated SERCA were different in HCT-116p53+/+and MDA-MB 468 cells, both cell types were exposed to dimedone to quench the sulfenylated cysteines, and the proteins were immunopurified using a mono-clonal SERCA antibody. Immunoblotting of the SERCA immunocomplex with an antibody to dimedone revealed the presence of sulfenylated SERCA, which was lower in HCT-116 p53+/+ cells treated with doxorubicin (Fig. 6F). In contrast, in
MDA-MB 468 cells, SERCA oxidation was unchanged after ADRIA treatment. These results were then confirmed by mea-suring SERCA activity. Fig. 6G shows that ADRIA required WT p53 to be effective. Indeed, in MDA-MB 468 cells, SERCA ac-tivity was not sensitive to ADRIA induction of p53.
Discussion
In recent years, it has become evident that the ER, mitochon-dria, and region of close contact between these two organelles (MAMs) play a central role in different human diseases, in-cluding cancer (15, 31). One important process occurring in these intracellular domains is apoptosis.
A key signal transduction pathway connecting apoptosis to ER–mitochondrial interactions is an alteration in Ca2+
homeo-static mechanisms (32). The switch from a life to a death signal has been argued to occur when Ca2+signaling between the ER and mitochondria is distorted, leading to a breakdown of mito-chondrial function (9).
Interestingly, in recent years, many tumor suppressor proteins, such as PML (8), PTEN (33), Bax and Bak (34), BOK (35), PERK (36), ERO1α (37), and Bap31 and Fis1 (38), have been demonstrated to be localized to the ER and at MAMs, where they modulate cell death.
In the present study, we investigated whether p53 also shares this intracellular localization and whether, as for PML, PTEN, Bax, and Bak, p53 regulates apoptosis in a Ca2+-dependent manner. p53 is a well-known tumor suppressor that coordinates different cell-death programs, mainly associated with its function as a transcription factor. Several studies have, however, de-scribed a transcription-independent function for p53, although the importance of the cytoplasmic pool of p53 for p53-mediated apoptotic cell death remains highly controversial.
We showed that a fraction of p53 is associated with the ER and MAMs. We demonstrated that this nonnuclear fraction of p53 is able to modulate Ca2+homeostasis in response to both physiological and pathological stimulation. The activation and accumulation of p53 at ER/MAM compartments induced by anticancer drugs or stress allow apoptotic stimuli to rapidly and efficiently overload mitochondria with Ca2+, a priming step for Fig. 6. p53 interacts with SERCA and stimulates Ca2+accumulation in the ER,
changing the SERCA oxidative state. (A) In vitro binding of endogenous SERCA to MBP-p53. H1299 cell lysates were incubated with bacterially expressed MBP-p53 protein or MBP as a control. Ponceau staining shows the amount of MBP pro-teins used in the experiments. (B) Full-length (FL) and HA-tagged p53 deletion mutants transiently expressed in H1299 cells were immunoprecipitated by anti-HA antibody and analyzed by Western blot (WB). IP, immunoprecipitation. (C) H1299 cells were transiently transfected with different p53 constructs (FL, full-length p53 WT;ΔNLS, p53-ΔNLS; R175H, p53 R175H; R273H, p53 R273H) and then harvested for immunoprecipitation and immunoblotting as indicated. WCL, whole cell lysate. (D and E) Rate analysis of Ca2+uptake measured in the ER vesicles isolated from the (D) liver of p53−/−and p53+/+mice and p53+/+mice treated with adriamycin (1μM, 6 h) or (E) ER compartments of p53−/−and p53+/+ MEFs at different times after ADRIA (1μM, 30 min, 3 h, 6 h) treatments. (F) Immunoblot with an antibody reactive to dimedone-conjugated cysteine resi-dues of the protein sample extracts from HCT-116 p53+/+and MDA-MB 468 cells after ADRIA induction that were immunopurified using a monoclonal SERCA2 antibody. Cells with an active p53 reveal lower cysteinyl sulfenic acid-modified SERCA. (G) Analysis of ER Ca2+uptake in HCT-116 p53+/+and MDA-MB 468 cells after ADRIA induction. Bars, SEM.
Giorgi et al. PNAS | February 10, 2015 | vol. 112 | no. 6 | 1783
CELL
the release of caspase cofactors and induction of apoptosis via the intrinsic pathway. As a consequence, cells are more prone to die through mitochondrial permeability transition pore opening (39), mitochondrial fragmentation, and cytochromec release.
p53 present in the ER/MAM fraction physically interacts with SERCA, thus potentiating in vitro and in vivo Ca2+ ac-cumulation in the ER lumen under stress conditions. In cancer cells, this proapoptotic mechanism is impaired due to the functional inactivation of p53, contributing to disease progression. In agree-ment with these results, SERCA overexpression, and thus its in-creased activity, and the subsequent ER Ca2+overload have been previously demonstrated to increase spontaneous apoptosis (40). Our data suggest that the activation of WT p53 reduces the oxi-dation of SERCA (Fig. 6), thus modulating SERCA activity. In-deed, prooxidative modification of SERCA decreased its activity (29), and a critical cysteine in the SERCA sequence (41) that reg-ulates this posttranslational modification is accessible from the cy-tosolic compartment (42), where p53 is localized.
Altogether, these results reveal a previously unidentified Ca2+-dependent mechanism through which p53 exerts its po-tent proapoptotic role in response to anticancer treatments. Materials and Methods
Reagents, solutions, cell culture, and transfection are described inSI Mate-rials and Methods.
Detection of Cell Death. For cell-death induction, the cells were treated in complete medium as indicated in the text. Apoptosis was determined by
different methods, as indicated in the text. Details are reported in SI Materials and Methods.
Calcium Measurements. Calcium analyses were performed by aequorin- (26), Fura-2–, and FRET-based measurements as specified inSI Materials and Methods. Subcellular Fractionation. Fractionations were performed as described (19). IP3R, laminin, tubulin, and VDAC were used as markers.
SERCA Activity. The analysis of SERCA activity in vitro was obtained on traces performed with an aequorin targeted to the ER. The analysis of SERCA activity in vivo was obtained by the measurement of ER vesicle Ca2+uptake in rectangular cuvettes using a spectrofluorimeter. Details are reported inSI Materials and Methods.
Detection of Sulfenylated SERCA2 in Cultured Cells. Proteins modified with sulfenic acid were detected following the procedure of Seo and Carroll (30). Animals. Procedures involving animals and their care were in conformity with institutional guidelines and all experimental protocols were approved by the Animal Ethics Committee of Ferrara and Warsaw institutions.
ACKNOWLEDGMENTS. This study was supported by the Italian Association for Cancer Research (C.G., G.D.S., and P.P.); the Italian Ministry of Education, University and Research (COFIN, FIRB, and Futuro in Ricerca; G.D.S. and P.P.); NCI grants (to P.P.P.); Polish National Science Centre (UMO-2011/01/M/NZ3/ 02128); Polish Ministry of Science and Higher Education Grant W100/HFSC/ 2011 and Grant HFSP RGP0027/2011 (to M.R.W.); and a Telethon Career Award (TDEZ00112T; to E.Z.).
1. Green DR, Kroemer G (2009) Cytoplasmic functions of the tumour suppressor p53. Nature 458(7242):1127–1130.
2. Vousden KH, Lane DP (2007) p53 in health and disease. Nat Rev Mol Cell Biol 8(4): 275–283.
3. Vogelstein B, Lane D, Levine AJ (2000) Surfing the p53 network. Nature 408(6810): 307–310.
4. Marchenko ND, Wolff S, Erster S, Becker K, Moll UM (2007) Monoubiquitylation promotes mitochondrial p53 translocation. EMBO J 26(4):923–934.
5. Haupt S, Berger M, Goldberg Z, Haupt Y (2003) Apoptosis—The p53 network. J Cell Sci 116(Pt 20):4077–4085.
6. Moll UM, Wolff S, Speidel D, Deppert W (2005) Transcription-independent pro-apoptotic functions of p53. Curr Opin Cell Biol 17(6):631–636.
7. Sorrentino G, et al. (2013) The prolyl-isomerase Pin1 activates the mitochondrial death program of p53. Cell Death Differ 20(2):198–208.
8. Giorgi C, et al. (2010) PML regulates apoptosis at endoplasmic reticulum by modu-lating calcium release. Science 330(6008):1247–1251.
9. Giorgi C, De Stefani D, Bononi A, Rizzuto R, Pinton P (2009) Structural and functional link between the mitochondrial network and the endoplasmic reticulum. Int J Bio-chem Cell Biol 41(10):1817–1827.
10. Bernardi R, Papa A, Pandolfi PP (2008) Regulation of apoptosis by PML and the PML-NBs. Oncogene 27(48):6299–6312.
11. Rowland AA, Voeltz GK (2012) Endoplasmic reticulum-mitochondria contacts: Func-tion of the juncFunc-tion. Nat Rev Mol Cell Biol 13(10):607–625.
12. Csordás G, et al. (2006) Structural and functional features and significance of the physical linkage between ER and mitochondria. J Cell Biol 174(7):915–921. 13. Giorgi C, et al. (2012) Mitochondrial Ca(2+) and apoptosis. Cell Calcium 52(1):36–43. 14. Hayashi T, Su TP (2007) Sigma-1 receptor chaperones at the ER-mitochondrion
in-terface regulate Ca(2+) signaling and cell survival. Cell 131(3):596–610.
15. Pinton P, Giorgi C, Siviero R, Zecchini E, Rizzuto R (2008) Calcium and apoptosis: ER-mitochondria Ca2+transfer in the control of apoptosis. Oncogene 27(50):6407–6418. 16. Sano R, et al. (2009) GM1-ganglioside accumulation at the mitochondria-associated ER membranes links ER stress to Ca(2+)-dependent mitochondrial apoptosis. Mol Cell 36(3):500–511.
17. Pinton P, Giorgi C, Pandolfi PP (2011) The role of PML in the control of apoptotic cell fate: A new key player at ER-mitochondria sites. Cell Death Differ 18(9):1450–1456. 18. Haupt Y, Rowan S, Shaulian E, Vousden KH, Oren M (1995) Induction of apoptosis in
HeLa cells by trans-activation-deficient p53. Genes Dev 9(17):2170–2183. 19. Wieckowski MR, Giorgi C, Lebiedzinska M, Duszynski J, Pinton P (2009) Isolation of
mitochondria-associated membranes and mitochondria from animal tissues and cells. Nat Protoc 4(11):1582–1590.
20. Costes SV, et al. (2004) Automatic and quantitative measurement of protein-protein colocalization in live cells. Biophys J 86(6):3993–4003.
21. Li J, Lee B, Lee AS (2006) Endoplasmic reticulum stress-induced apoptosis: Multiple pathways and activation of p53-up-regulated modulator of apoptosis (PUMA) and NOXA by p53. J Biol Chem 281(11):7260–7270.
22. Orrenius S, Zhivotovsky B, Nicotera P (2003) Regulation of cell death: The calcium-apoptosis link. Nat Rev Mol Cell Biol 4(7):552–565.
23. Mattson MP, Chan SL (2003) Calcium orchestrates apoptosis. Nat Cell Biol 5(12):1041–1043.
24. Akl H, Bultynck G (2013) Altered Ca(2+) signaling in cancer cells: Proto-oncogenes and tumor suppressors targeting IP3 receptors. Biochim Biophys Acta 1835(2):180–193. 25. Clapham DE (2007) Calcium signaling. Cell 131(6):1047–1058.
26. Bonora M, et al. (2013) Subcellular calcium measurements in mammalian cells using jellyfish photoprotein aequorin-based probes. Nat Protoc 8(11):2105–2118. 27. Yang M, Ellenberg J, Bonifacino JS, Weissman AM (1997) The transmembrane domain
of a carboxyl-terminal anchored protein determines localization to the endoplasmic reticulum. J Biol Chem 272(3):1970–1975.
28. Vaseva AV, Moll UM (2009) The mitochondrial p53 pathway. Biochim Biophys Acta 1787(5):414–420.
29. Knyushko TV, Sharov VS, Williams TD, Schöneich C, Bigelow DJ (2005) 3-Nitrotyrosine modification of SERCA2a in the aging heart: A distinct signature of the cellular redox environment. Biochemistry 44(39):13071–13081.
30. Seo YH, Carroll KS (2009) Profiling protein thiol oxidation in tumor cells using sulfenic acid-specific antibodies. Proc Natl Acad Sci USA 106(38):16163–16168.
31. Raturi A, Simmen T (2013) Where the endoplasmic reticulum and the mitochondrion tie the knot: The mitochondria-associated membrane (MAM). Biochim Biophys Acta 1833(1):213–224.
32. Patergnani S, et al. (2011) Calcium signaling around mitochondria associated mem-branes (MAMs). Cell Commun Signal 9:19.
33. Bononi A, et al. (2013) Identification of PTEN at the ER and MAMs and its regulation of Ca(2+) signaling and apoptosis in a protein phosphatase-dependent manner. Cell Death Differ 20(12):1631–1643.
34. Scorrano L, et al. (2003) BAX and BAK regulation of endoplasmic reticulum Ca2+: A control point for apoptosis. Science 300(5616):135–139.
35. Echeverry N, et al. (2013) Intracellular localization of the BCL-2 family member BOK and functional implications. Cell Death Differ 20(6):785–799.
36. Verfaillie T, et al. (2012) PERK is required at the ER-mitochondrial contact sites to convey apoptosis after ROS-based ER stress. Cell Death Differ 19(11):1880–1891. 37. Seervi M, Sobhan PK, Joseph J, Mathew KA, Santhoshkumar TR (2013)
ERO1α-dependent endoplasmic reticulum-mitochondrial calcium flux contributes to ER stress and mitochondrial permeabilization by procaspase-activating compound-1 (PAC-1). Cell Death Dis 4:e968.
38. Iwasawa R, Mahul-Mellier AL, Datler C, Pazarentzos E, Grimm S (2011) Fis1 and Bap31 bridge the mitochondria-ER interface to establish a platform for apoptosis induction. EMBO J 30(3):556–568.
39. Bonora M, et al. (2013) Role of the c subunit of the FO ATP synthase in mitochondrial permeability transition. Cell Cycle 12(4):674–683.
40. Brini M, Bano D, Manni S, Rizzuto R, Carafoli E (2000) Effects of PMCA and SERCA pump overexpression on the kinetics of cell Ca(2+) signalling. EMBO J 19(18): 4926–4935.
41. Qin F, et al. (2013) Hydrogen peroxide-mediated SERCA cysteine 674 oxidation con-tributes to impaired cardiac myocyte relaxation in senescent mouse heart. J Am Heart Assoc 2(4):e000184.
42. Bishop JE, Squier TC, Bigelow DJ, Inesi G (1988) (Iodoacetamido)fluorescein labels a pair of proximal cysteines on the Ca2+-ATPase of sarcoplasmic reticulum. Biochemistry 27(14):5233–5240.
Supporting Information
Giorgi et al. 10.1073/pnas.1410723112
SI Materials and Methods
Reagents and Solutions.ATP, digitonin, H2O2, menadione (MEN),
tunicamycin (TUN), thapsigargin (TG), ceramide (C2), brefeldin A (BFA), adriamycin (ADRIA),α-amanitin, pifithrin, and phtha-locynine were purchased from Sigma; coelenterazine was obtained from SynChem, and Fura-2 AM was obtained from Invitrogen.
Krebs Ringer buffer contained the following: 125 mM NaCl, 5 mM KCl, 1 mM MgSO4, 1 mM Na2HPO4, 5.5 mM glucose, 20
mM NaHCO3, 2 mML-glutamine, and 20 mM Hepes (pH 7.4),
supplemented with 1 mM CaCl2.
Cell Culture, Transfection, and Detection of Cell Death.Primary p53+/+ and p53−/−MEFs were prepared from embryos at day 13.5 of development (E13.5). Early passage (P2–P5) MEFs, grown in DMEM supplemented with 10% (vol/vol) FBS, were used in all experiments.
MEFs were transfected with different constructs using the MicroPorator (Digital Bio).
HCT-116 cells were grown in McCoy’s medium supplemented with 10% (vol/vol) FBS, 1% penicillin/streptomycin, and 1% (vol/vol)L-glutamine and transfected using a standard
calcium-phosphate procedure.
HeLa and H1299 cells were grown in DMEM supplemented with 10% (vol/vol) FBS and transfected using a standard calcium-phosphate procedure.
MDA-MD 468 cells were grown in DMEM supplemented with 10% (vol/vol) FBS and infected with adenovirus expressing a mitochondria-targeted aequorin chimera.
MEF, HCT-116, and MDA-MD 468 cells were treated with 1μM ADRIA for 6 h, 10 μg/mL α-amanitin for 6 h, and 15 μM pifithrinα for 30 min.
Detection of Cell Death.For cell-death induction, cells were treated in complete medium as indicated in the text.
Apoptosis was determined by different methods as indicated in the text: (i) blotting for different cell-death markers, such as cleaved PARP and cleaved caspase 3; (ii) analysis of cytochrome c release; (iii) FACS analysis of cells stained with annexin-V-FITC/PI (BioVision); and (iv) automated count analysis. Automated nucleus count analysis. p53+/+or p53−/− MEFs were seeded at 50,000 cells on a 25-mm coverslip, allowed to grow for 48 h, and then treated with ADRIA, H2O2, or both. Coverslips
were stained with 10 μM Hoechst, placed in an incubation chamber with a controlled temperature, and mounted on an Axiovert 200M microscope equipped with a motorized stage. Nuclei were acquired with a 10× Fluar objective (Zeiss) and a CoolSNAP HQ CCD camera (Photometrics). Twenty random fields were acquired with the random stage scan tools in Meta-Morph (Universal Imaging) and analyzed with the nucleus count application.
Automated image-based cell death.MEF cells were seeded on Cell-Carrier 96-well plates (PerkinElmer); after 24 h, cell death was induced as previously described. After cell-death induction, the cells were stained with PI (1μg/mL) for 10 min at 37 °C and then fixed in 4% paraformaldehyde in PBS. After fixation, the cells were stained with Alexa Fluor 488 phalloidin (1:1,000 dilution) and DAPI.
Images were then acquired on the Olympus Scan^R station using laser-based hardware and an image-based automatic au-tofocus. Ten fields were acquired for each well using 20× mag-nification, N.A. 0.75, whereas different fluorophores were excited by an MT20 illumination system (Olympus). The exci-tation filters that were used were 377/50, 498/20, and 595/30 for
DAPI, FITC, and TRITC, respectively, allowing for shorter ex-posure times (5 ms for DAPI, 20–50 ms for FITC, and 50–150 ms for TRITC). Images were collected using an Orca-05G2 (Hamamatsu Photonics) at full-frame. The cells were then scored and counted using Scan^R analysis software; necrotic cells were detected by PI+nuclei, whereas apoptotic cells were detected by cell shrinkage (based on phalloidin signal) in PI−cells.
Generation of ER-p53 Chimera Expression Vectors.p53 was targeted to the external surface of the ER by a fusion sequence from the yeast UBC6 (1) protein to the N-terminal end of the cDNA encoding human p53-ΔNLS. The chimera, named ER-p53, was cloned in the pcDNA3 vector.
Aequorin Measurements.Cells grown on 13-mm-round glass cov-erslips at 50% confluence were transfected with the appropriate cytosolic (cyt), mitochondrial (mt), or endoplasmic reticulum (er) targeted aequorin (Aeq) chimeras (2) alone or together with expression constructs ER-p53, WT p53, or p53-ΔNLS.
All aequorin measurements were performed in KRB. Agonists and other drugs were added to the medium as specified in the figure legends. The experiments were terminated by lysing the cells with 100μM digitonin in a hypotonic Ca2+-rich solution (10 mM CaCl2 in H2O), thus discharging the remaining aequorin
pool. The light signal was collected and calibrated into [Ca2+] values, as previously described (2).
In the experiments using permeabilized cells, a buffer mim-icking the cytosolic ionic composition (intracellular buffer) was used: 130 mM KCl, 10 mM NaCl, 0.5 mM K2HPO4, 5 mM succinic
acid, 1 mM MgSO4, 3 mM MgCl2, 20 mM Hepes, 1 mM pyruvate,
0.5 mM ATP, and 0.1 mM ADP (pH 7 at 37 °C). The intracellular buffer was supplemented with either 100 μM EGTA (intracel-lular buffer/EGTA) or 2 mM EGTA plus 2 mM Hydroxy-2-ethylenediaminetriacetic acid (HEEDTA)-buffered [Ca2+] of 1 or 4μM (intracellular buffer/Ca2+), as calculated with Chelator soft-ware (3). MEF cells were permeabilized by a 1-min perfusion with 50μM digitonin (added to the intracellular buffer/EGTA) during the luminescence measurements. The mitochondrial Ca2+uptake rate was calculated as the first derivative by using OriginLab software. The higher value reached during Ca2+addition repre-sents the maximal Ca2+uptake rate.
Fura-2 Measurements.The cytosolic Ca2+response was evaluated using the fluorescent Ca2+indicator Fura-2 AM (Life Technol-ogies, Invitrogen). MEF cells were grown on 24-mm coverslips and incubated at 37 °C for 30 min in 1 mM Ca2+/KRB supple-mented with 2.5 mM Fura-2 AM, 0.02% Pluronic F-68 (Sigma-Aldrich), and 0.1 mM sulfinpyrazone (Sigma-Aldrich). The cells were then washed and supplemented with 1 mM Ca2+/KRB. To determine the cytosolic Ca2+response, the cells were placed in an open Leyden chamber on a 37-°C thermostat-controlled stage and exposed to 340 nm/380 nm wavelength light using the Olympus xcellence multiple-wavelength high-resolution fluores-cence microscopy system equipped with an ORCA ER CCD camera (Hamamatsu Photonics) and an Uplan FLN 40× oil objective (Olympus). The fluorescence data collected are ex-pressed as emission ratios.
FRET-Based Measurements of ER Ca2+.Single-cell measurements of ER luminal Ca2+were performed in MEF cells transfected with D1ER-YC 4.3. After 36 h, the cells were imaged on an Axiovert 100TV microscope equipped with the Optosplit dual view sys-tem (Cairn Research) and the Evolve 512 EMCCD camera
(Photometrics). D1ER-YC 4.3 was excited through an ET436/ 20× band-pass filter and emission was collected through a 63× plan apochromatic oil immersion, N.A. 1.4 (Zeiss). Emission light was split into two camera sensors through a T510 LPXR dichroic mirror and further separated through ET485/32 m and ET535/30 m band-pass filters for Cyan and FRET, respectively (filters and dichroic mirror were from Chroma). The fluores-cence images were corrected for background and fluoresfluores-cence bleed-through. The exposure time was typically 10 ms, and im-ages were collected every 15 s. A ratiometric image was gener-ated offline using the open-source software ImageJ (NIH), and the average ratio values were collected on an Excel spreadsheet. Ratiometric measurements were then normalized to the smallest value of the entire kinetic measurement.
Subcellular Fractionation.Fractionations were performed as de-scribed (4, 5).
IP3R, laminin, tubulin, and VDAC were used as markers. ER, endoplasmic reticulum; MAMs, mitochondria-associated mem-branes; C, cytosol.
Western Blotting.A total of 30μg of protein was separated by SDS/PAGE, transferred onto a nitrocellulose membrane, and probed using the following antibodies: anti-p53 (mouse; 1:1,000; Cell Signaling), p53 (human; 1:500; Santa Cruz), anti-cleaved PARP (1:500; Cell Signaling), anti-anti-cleaved caspase 3 (1:500; Cell Signaling), anti-cytochrome c (1:1,000; BD Phar-mingen), anti–IP3R-3 (1:500; BD PharPhar-mingen), anti-tubulin (1:5,000; Sigma), anti-laminin (1:1,000; Abcam), anti-panVDAC (1:5,000; Abcam), anti-actin (1:10,000; Sigma), and anti-SERCA 2b (1:500; Abcam). Isotype-matched horseradish peroxidase-conjugated secondary antibodies were used, followed by de-tection using chemiluminescence (PerkinElmer).
Immunolocalization of p53 Protein.Cells (MEFs, H1299, and HCT-116) were fixed in 3.7% formaldehyde in PBS for 20 min, washed three times with PBS, and then incubated for 10 min in PBS supplemented with 50 mM NH4Cl. Permeabilization of cell
membranes was accomplished with a 5-min incubation with 0.1% Triton X-100 in PBS, followed by a 1-h wash with 2% BSA in PBS. The cells were then incubated overnight at 37 °C in a wet chamber with a mouse anti-p53 antibody (1C12; Cell Signaling) diluted 1:50 with 2% BSA in PBS. Staining was then performed with Alexa 633 rabbit anti-mouse secondary antibodies. After each antibody incubation, the cells were washed four times with PBS. Images were acquired using an Axiovert 200M fluorescence microscope (Zeiss) equipped with 63× oil or 40× water immer-sion objectives (Zeiss) and a CoolSNAP HQ camera (Photo-metrics). Fifty-one planes along thez axis were acquired for each field, and the axial and lateral resolutions were established ac-cording to the Nyqist rate; then, 3D digital deconvolution was performed using the open-source software Fiji (fiji.sc/fiji). After deconvolution, colocalization between the Sec61-GFP and p53 signals was observed using the center-based object method in the JACoP plugin (rsb.info.nih.gov/ij/plugins/track/jacop.html). MBP Pull-Down Assay.p53 cDNA was cloned in the pMAL protein fusion system (New England Biolabs). The MBP-fused protein was expressed inEscherichia coli, extracted in column buffer (20 mM Tris·HCl, pH 7.5, 200 mM NaCl, 1 mM EDTA, pH 8, and 10 mMβ-mercaptoethanol), and purified with amylose resin (New England Biolabs) following the manufacturer’s instructions. The cells were harvested in lysis buffer (20 mM Tris·HCl, pH 8.0, 150 mM NaCl, 1 mM EDTA, 5% glycerol, 0.5% Nonidet P-40, 5 mM NaF, 1 mM Na3VO4, and a protease inhibitor mixture).
The cell lysate was incubated with 2.5μg MBP-p53 or MBP for 2 h and then washed three times in lysis buffer.
Coimmunoprecipitation.Extracts from WT MEFs were prepared using lysis buffer containing 50 mM NaCl, 50 mM Tris·HCl (pH 7.4), and 0.1% Nonidet P-40 supplemented with 1 mM PMSF and protease/phosphatase inhibitors. Protein extracts were pre-cleared with protein G/A beads (Pierce) and then precipitated with rabbit anti-p53 FL-393 (Santa Cruz) overnight at 4 °C. Protein G beads were added and rocked for 5 h at 4 °C. After-ward, the beads were washed with 50 mM NaCl, 50 mM Tris·HCl (pH 7.4), and 0.1% Nonidet P-40 at 4 °C. The samples were separated by SDS/PAGE and analyzed by standard Western blotting techniques.
For HAp53-SERCA coimmunoprecipitation, the cells were lysed in co-IP buffer (50 mM Tris·HCl, pH 8, 150 mM NaCl, 1% Nonidet P-40, and 10% glycerol) with a protease inhibitor mix-ture (Sigma), 1 mM PMSF, 5 mM NaF, and 1 mM Na3VO4.
Then, 2 mg of the cleared lysates was incubated for 2 h with monoclonal anti-HA 12CA5 antibody covalently bound to pro-tein G Sepharose (Amersham) using 5 mg/mL dimethylpimeli-midate (Pierce).
Mitochondrial Morphology Analysis. p53+/+or p53−/− MEFs were seeded at 50,000 cells on 25-mm coverslips, allowed to grow for 24 h, and then infected with a GFP targeted to the mitochondria inserted in an adenoviral vector (Ad-mtGFP). After 36 h, the cells were treated as described and then imaged with a Nikon Swept Field confocal equipped with CFI Plan Apo VC60XH objective (N.A. 1.4) and an Andor DU885 EMCCD camera. Coverslips were placed in an incubated chamber with controlled temperature, CO2, and humidity, and then z stacks were
ac-quired in 21 planes with a 0.6-mm distance to allow acquisition of the whole cell. Morphometric parameters were calculated on the best focused plane with NIS Elements (Nikon), and isosur-face rendering and volume measurements were obtained with the 4D tools of MetaMorph (Universal Imaging).
Isolation of the Microsomal Fraction.Liver microsomes were pre-pared from WT and p53−/−mice at 2 mo of age. In brief, pieces of minced livers were gently homogenized at 0 °C, and the debris was removed by centrifugation at 600 × g for 3 min (twice). Next, mitochondrial membranes were removed by centrifugation at 12,000 × g for 10 min (twice to remove all mitochondrial contamination). Finally, the heavy ER fraction (SERCA- and IP3R-enriched) was obtained by centrifuga-tion at 25,000 × g for 15 min. The microsomal pellet was resuspended in medium containing 150 mM KCl and 10 mM Tris·HCl (pH 7.4), and centrifuged again at 25,000 × g for 15 min. The protein concentration in the microsomal fraction was de-termined according to Bradford’s method using the Bio-Rad protein estimation kit.
SERCA Activity. The analysis of SERCA activity in vitro was obtained on traces performed with an aequorin targeted to the ER (erAeq). Briefly, time records from each single experiment were imported into Origin 6.0 (OriginLab), and the derivative was calculated. The first half of the accumulation phase was isolated, and five points around the maximum value were collected for an average calculation. This value was used as an indicator of the maximum speed of Ca2+import into the ER and is proportional to SERCA activity or expression.
The analysis of SERCA activity in vivo was obtained by the measurement of ER vesicle Ca2+uptake in rectangular cuvettes using a spectrofluorimeter (3-mL volume, 1-cm light path). ER vesicles were isolated as described above by standard procedures. The standard measurement medium contained 20 mM Tris/Mops, 20 mM histidine, 5 mM MgC12, 5 mM potassium oxalate, and
1 mM ATP (pH 6.8). The experiments were performed at 25 °C. To test the method and demonstrate that Ca2+can be amassed in the vesicles, 1 mM calcium ionophore A23187 was added. Similarly,
1 mM thapsigargin (a SERCA inhibitor) was used to inhibit Ca2+uptake and prove SERCA involvement in the Ca2+uptake in the experimental model. For the determination of Ca2+ uptake, Fluo-3 pentaammonium salt (membrane-impermeable) was present in the measurement medium. The fluorescence decrease caused by the Ca2+ diminution in the measurement medium, related to the Ca2+uptake by the vesicles, was examined at 509 and 535 nm excitation and emission wavelengths, respectively, in a Hitachi F-7000 spectrofluorimeter.
Detection of Sulfenylated SERCA2 in Cultured Cells.Proteins modi-fied with sulfenic acid were detected following the procedure of Seo and Carroll (6). Sulfenylated SERCA2 was detected by immunoblot using a rabbit serum reactive to proteins modified by sulfenic acid (Millipore) after immunoprecipitation with a monoclonal SERCA2 antibody (Santa Cruz).
Statistical Analyses.Statistical data are presented as the mean± SD. Significance was calculated by Student’s t test, and correla-tion analysis was performed with SigmaPlot 5.0 software (SPSS).
1. Yang M, Ellenberg J, Bonifacino JS, Weissman AM (1997) The transmembrane domain of a carboxyl-terminal anchored protein determines localization to the endoplasmic reticulum. J Biol Chem 272(3):1970–1975.
2. Bonora M, et al. (2013) Subcellular calcium measurements in mammalian cells using jellyfish photoprotein aequorin-based probes. Nat Protoc 8(11):2105–2118. 3. Schoenmakers TJ, Visser GJ, Flik G, Theuvenet AP (1992) CHELATOR: An improved
method for computing metal ion concentrations in physiological solutions. Bio-techniques 12(6):870–874, 876–879.
4. Wieckowski MR, Giorgi C, Lebiedzinska M, Duszynski J, Pinton P (2009) Isolation of mitochondria-associated membranes and mitochondria from animal tissues and cells. Nat Protoc 4(11):1582–1590.
5. Vance JE (1990) Phospholipid synthesis in a membrane fraction associated with mito-chondria. J Biol Chem 265(13):7248–7256.
6. Seo YH, Carroll KS (2009) Profiling protein thiol oxidation in tumor cells using sulfenic acid-specific antibodies. Proc Natl Acad Sci USA 106(38):16163–16168.
Fig. S1. p53 localizes at ER and MAM compartments. (A) Localization of p53 shown by immunoblot after subcellular fractionation in p53+/+MEFs under untreated conditions (UNT). (B) Immunofluorescence staining of p53 KO MEFs as negative p53 antibody control. (C) Representative immunostaining images of p53+/+MEFs under untreated conditions, after adriamycin (1μM, 6 h) induction, and after H2O2(500μM, 6 h) treatment. p53 is in red and Sec61-GFP, used as an ER marker, is in green.
Fig. S2. Overexpression or activation of p53 WT induces alteration of Ca2+homeostasis. (A–C) Analysis of Ca2+homeostasis in ER (A), cytosol (B), and mi-tochondria (C) in HeLa cells in the control condition and after overexpression of p53 WT. Measurements were obtained with aequorin-targeted chimeras after agonist stimulation (100μM histamine; His). HeLa: [Ca2+]
ERpeak 228± 35 μM; [Ca2+]mpeak 42± 21 μM; [Ca2+]cpeak 3.1± 0.2 μM. HeLa overexpressing p53 WT: [Ca2+]ERpeak 355± 29 μM; [Ca2+]mpeak 53± 11 μM; [Ca2+]cpeak 3.7± 0.25 μM; n = 10 from five independent experiments and P < 0.01. (D) [Ca2+]mafter ATP stimulation measured in HCT-116 p53+/+cells in control conditions and after adriamycin treatment (1μM, 6 h) (HCT-116 p53+/+: control peak 1.36± 0.5 μM; ADRIA peak 1.7± 0.6 μM). (E) Analysis of [Ca2+]
mresponse in p53−/−MEFs and after reintroduction of p53 WT (p53−/−peak 46.3± 6.4 μM; p53−/−+ p53 WT peak 78.1± 11.2 μM); n = 5 from five independent experiments and P < 0.01. (F) Mitochondrial Ca2+uptake measured in permeabilized MEFs exposed to the same [Ca2+]. Rate of Ca2+uptake in the first 100 s (p53+/+1.59± 0.20; p53−/−1.61± 0.19; p53+/++ ADRIA 1.63 ± 0.12); n = 6 from three independent experiments and P< 0.05.
Fig. S3. Activation of p53 potentiates the effect of H2O2response increasing [Ca2+]ERsteady state and, by consequence, cytosolic and mitochondrial Ca2+ responses. (A) Decreased ATP-dependent mitochondrial Ca2+responses in p53+/+, p53−/−, and p53+/++ ADRIA (1 μM, 6 h) in untreated conditions and after H2O2pretreatments (1 mM, 30 min). p53+/+UNT peak 83.4± 6.3 μM, p53+/+H2O2peak 52.2± 8.5 μM; p53−/−UNT peak 33.6± 4.7 μM, p53−/−H2O2peak 30.2± 4.1μM; p53+/++ ADRIA UNT peak 110.0 ± 8.5 μM, p53+/++ ADRIA H2O2peak 42.4± 2.1 μM; n = 12 from five independent experiments and P < 0.01. (B–D) Histograms related to (B) Ca2+release from the ER, (C) percentage of cytosolic Ca2+release normalized asΣ(F340/F380) over time, or (D) area under the traces of mitochondrial Ca2+uptake, induced by H2O2, based on Fig. 2 D–F. At least 10 cells from three independent experiments were analyzed for the experiments shown in B and C and Fig. 2 D and E; n= 10 from three independent experiments for the experiment shown in D and Fig. 2F. Bars, SEM.
Fig. S4. Activation of p53 induces mitochondrial fragmentation in response to apoptotic stimulation. Analysis of mitochondrial morphology in p53+/+(A and B) and p53−/−(C and D) MEFs under untreated conditions and pretreated with adriamycin (1μM, 6 h) and then with H2O2(500μM, 3 h). MEFs expressing mitochondrial GFP were acquired and analyzed with 2D morphological descriptors and 3D volume measurements. Two-dimensional analysis of fragmentation index was calculated as the ratio of shape factor and elongation factor. Mitochondrial volumes were calculated as the average voxel amount for a single object in isosurface rendering of the same samples; n= 45 from at least three independent experiments and *P < 0.05, **P < 0.01. Bars, SEM.
Fig. S5. p53-ΔNLS and ER-p53, but not naturally occurring p53 mutants, restore mitochondrial Ca2+response in p53−/−and in turn apoptosis, without altering apoptotic gene expression. (A) [Ca2+]mresponse measured in HeLa cells expressing p53-ΔNLS chimera and p53 mutants after agonist stimulation (His) (HeLa control peak: 40.1± 14 μM; p53-ΔNLS peak: 60.5 ± 10.3; p53 R175H peak: 37.7 ± 11.2 μM; p53 R273H peak: 36.8 ± 6.2 μM). (B) [Ca2+]mresponse after agonist stimulation (ATP) in H1299 p53−/−cells after introduction of p53-ΔNLS and ER-p53 chimeras and p53 mutants (H1299 control peak: 0.43 ± 0.06 μM; p53-ΔNLS peak: 0.67± 0.07; ER-p53 peak: 0.75 ± 0.08 μM; p53 R175H peak: 0.5 ± 0.17 μM; p53 R273H peak: 0.5 ± 0.23 μM). (C) Western blot analysis of extracts from HCT-116 p53−/−cells expressing the two chimeras p53-ΔNLS and ER-p53 or the two mutants p53 R175H and p53 R273H. Antibodies for typical apoptotic markers, noncleaved PARP and noncleaved caspase 3, were used under untreated conditions.
Fig. S6. Introduction of R175H or R273H mutation into p53-ΔNLS or ER-p53 prevents mitochondrial Ca2+increase and thus apoptosis. (A) [Ca2+]mresponse after agonist stimulation (ATP) in HCT-116 p53−/−cells expressing p53-ΔNLS or ER-p53 chimeras with R175H or R273H mutation. (B) H2O2-induced apoptosis analyzed by Western blot in HCT-116 p53−/−cells expressing p53-ΔNLS or ER-p53 chimeras with R175H or R273H mutation, using cleaved PARP and cleaved caspase 3 as markers. Untreated condition is indicated by“UNT.” (C) Percentage of cell survival after H2O2treatment (500μM, 12 h) evaluated by automated cell counting. (D) Representative microscope images of HCT-116 p53−/−cells under untreated or H2O2(1 mM, 12 h)-treated conditions. Bars, SEM.
Fig. S7. p53 interacts with the SERCA pump. (A) Schematic representation of MBP-p53 pull-down experiment. (B) Coimmunoprecipitation of p53 with SERCA in p53+/+MEFs. (C) Schematic representation of HA-tagged p53 deletion mutants used for immunoprecipitation. DBD, DNA binding domain; OD, oligomer-ization domain; PR, proline reach domain; REG, regulatory domain; TA, transactivation domain. (D) [Ca2+]mresponse in HCT-116 p53−/−cells expressing p53 fragments (EV, empty vector; FL, full-length p53) (p53−/−+ EV peak: 2.90 ± 0.15 μM; p53−/−+ FL peak: 5.80 ± 0.28 μM; p53−/−+ 1–175 peak: 2.97 ± 0.19 μM; p53−/−+ 175–393 peak: 3.13 ± 0.13 μM; p53−/−+ 294–393 peak: 2.93 ± 0.19 μM). (E) Cell-death analysis after H
2O2treatment (500μM, 12 h) by automated cell counting in HCT-116 p53−/−cells expressing p53 fragments. Bars, SEM.
Fig. S8. p53 modulates SERCA activity and thus Ca2+response and apoptosis. (A) p53 induction with adriamycin does not alter SERCA expression levels in MEF cells. (B) Western blot analysis of SERCA levels in HeLa cells in control conditions and after overexpression of p53 WT and p53-ΔNLS chimera. (C) Analysis of the rate of ER lumen Ca2+refilling in HeLa cells (μM[Ca2+]/s 4.15± 0.23, n = 8) and after overexpression of p53 WT (μM[Ca2+]/s 8.05± 2.1, n = 8) and p53-ΔNLS (μM [Ca2+]/s 9.4± 3.1, n = 8) chimera. Bars, SEM. Data were obtained from at least three independent experiments. (D) [Ca2+]
mresponse after agonist stimulation in p53−/−MEFs overexpressing SERCA pumps (MEF p53−/−control peak: 41± 5.2 μM; MEF p53−/−+ SERCA peak: 73.2 ± 10.4). Data were obtained from at least two independent experiments. (E) Increased cleaved caspase 3 in p53−/−MEFs overexpressing SERCA after H2O2treatment (500μM, 6 h).
Fig. S9. Analysis of sulfenylated SERCA. Immunoblot of extracts from HCT-116 p53+/+and MDA-MB 468 cells exposed to the sulfenic acid-reactive probe dimedone with an antibody reactive to dimedone-conjugated cysteine residues (A) and with a SERCA2 antibody (B) as positive control. The asterisk indicates a background band.
Table S1. Descriptive statistic of Ca2+measurement shown in main-text figures
Experiment Measurement Mean± SD n P value† Fig.
MEF p53+/+* [Ca2+]ER 360± 21 ≥15 3A
MEF p53+/++ ADRIA [Ca2+]ER 431± 28 ≥15 <0.01
MEF p53−/− [Ca2+]ER 272± 32 ≥15 <0.01
MEF p53−/−+ ADRIA [Ca2+]ER 265± 23 ≥15 <0.01
MEF p53+/+* [Ca2+]c 2.5± 0.31 ≥15 3B
MEF p53+/++ ADRIA [Ca2+]c 2.9± 0.22 ≥15 <0.01
MEF p53−/− [Ca2+]c 1.85± 0.31 ≥15 <0.01
MEF p53−/−+ ADRIA [Ca2+]c 1.74± 0.11 ≥15 <0.01
MEF p53+/+* [Ca2+]m 80.0± 16.4 ≥15 3C
MEF p53+/++ ADRIA [Ca2+]m 105.3± 14.1 ≥15 <0.01
MEF p53−/− [Ca2+]m 43.2± 9.3 ≥15 <0.01
MEF p53−/−+ ADRIA [Ca2+]
c 40.7± 10.5 ≥15 <0.01
MEF p53+/+* [Ca2+]
m 85.0± 9.1 ≥12 4A
MEF p53+/++ pifithrin α + ADRIA [Ca2+]
m 100.2± 6.2 ≥12 <0.05
MEF p53+/++ α-amanitin [Ca2+]
m 110.3± 12.1 ≥12 <0.05 MEF p53−/−* [Ca2+] m 35.1± 6.8 ≥12 4D MEF p53−/−+ p53-ΔNLS [Ca2+] m 65.4± 11.2 ≥12 <0.05 MEF p53−/−* [Ca2+]m 40.6± 8.7 ≥12
MEF p53−/−+ ER-p53 [Ca2+]m 81.5± 15.6 ≥12 <0.05
HCT-116 p53−/−* [Ca2+]m 2.1± 0.2 ≥12 5A HCT-116 p53−/−+ p53 R175H [Ca2+]m 2.4± 0.4 ≥12 HCT-116 p53−/−+ p53 R273H [Ca2+]m 2.7± 0.4 ≥12 HCT-116 p53−/−+ p53-ΔNLS [Ca2+]m 4.8± 0.3 ≥12 <0.05 HCT-116 p53−/−+ ER-p53 [Ca2+]m 5.3± 0.2 ≥12 <0.05 HCT-116 p53−/−+ p53 FL [Ca2+]m 5.1± 0.3 ≥12 <0.05 MDA-MB 468 [Ca2+]m 6.5± 1.3 ≥12 5B
MDA-MB 468+ ADRIA [Ca2+]m 6.5± 1.2 ≥12
Liver p53−/− Rate of ER Ca2+uptake 86.9± 20.91 5 6D
Liver p53+/+* Rate of ER Ca2+uptake 100.0± 2.60 5
Liver p53+/++ ADRIA 6 h Rate of ER Ca2+uptake 114.4± 31.40 5 <0.05
MEF p53−/− Rate of ER Ca2+uptake 3.73± 0.11 ≥12 6E
MEF p53+/+* Rate of ER Ca2+uptake 6.71± 0.60 ≥12
MEF p53+/++ ADRIA 30 min Rate of ER Ca2+uptake 7.76± 0.82 ≥12 <0.05
MEF p53+/++ ADRIA 3 h Rate of ER Ca2+uptake 8.81± 0.45 ≥12 <0.05
MEF p53+/++ ADRIA 6 h Rate of ER Ca2+uptake 9.31± 1.15 ≥12 <0.05
HCT-116 p53+/+* Rate of ER Ca2+uptake 12.34± 3.95 ≥12 6G
HCT-116 p53+/++ ADRIA Rate of ER Ca2+uptake 19.20± 3.56 ≥12 <0.01
MDA-MB 468 Rate of ER Ca2+uptake 9.44± 1.56 ≥12
MDA-MB 468+ ADRIA Rate of ER Ca2+uptake 9.57± 1.51 ≥12
*Relative control for statistical analysis. †Versus relative control for statistical analysis.


![Fig. S3. Activation of p53 potentiates the effect of H 2 O 2 response increasing [Ca 2+ ] ER steady state and, by consequence, cytosolic and mitochondrial Ca 2+ responses](https://thumb-eu.123doks.com/thumbv2/123dokorg/4722394.45718/11.877.186.681.76.575/activation-potentiates-response-increasing-consequence-cytosolic-mitochondrial-responses.webp)