1
Università degli Studi di Ferrara
DOTTORATO DI RICERCA IN
BIOCHIMICA, BIOLOGIA MOLECOLARE E BIOTECNOLOGIE
CICLO XXV
COORDINATORE Prof. Bernardi Francesco
Characterization of human vascular smooth
muscle cells from atherosclerotic and
non-atherosclerotic carotid artery
Settore Scientifico Disciplinare BIO/10
Dottorando Tutore
Dott. Guastella Giuseppe Prof. Marchetti Giovanna
3 Introduction
Normal vasculature Endothelial cells
Vascular Smooth Muscle Cells Atherosclerosis
Pathogenesis of atherosclerosis Classification of type lesion SMC distinct phenotype
Animal model of atherosclerosis Citoscheletal proteins
Alpha-Smooth muscle actin Desmin
Vimentin
Smooth muscle myosyn heavy chain
Calmodulin (CaM)
Nephroblastoma overexpressed protein (NOV)
Ectonucleotide pyrophosphatase/phosphodiesterase 2 (ENPP2)
Aim of the study
Materials and Methods
Tissue explantation Cell Culture
Co-culture experiments RNA extraction
Reverse transcription and Real-Time Quantitative PCR Antibodies
4
Immunofluorescence tissue staining Immunohistochemistry
Statistical Analysis Results
Isolation of SMCs by tissue explantation Distinct SMCs phenotypes
Distinctive features of SMCs
Isolation and Characterization of Plaque-Derived Macrophages
Plaque, Plaque-Derived Macrophages and Plaque-Derived CM Induce SMC
Phenotypic Transition
CaM inhibition with W-7
RNA studies in cultured VSMCs and in atherosclerotic and
non-atherosclerotic portions of carotid artery
Immunofluorescence of NOV in large and small VSMCs
Histological and immunohistochemical characterization of the arterial tissues NOV expression in human atherosclerotic lesions
Discussion and Conclusion Bibliography or References
5
Introduction
Normal vasculature
The basic constituents of the walls of blood vessel are endothelial cells, smooth muscle cells, and extracellular matrix, including elastic elements, collagen and proteoglycans.
They are arranged in concentric layers: • Intima (adjacent to the lumen)
• Media
• Adventitia (externally)
6
underlying subendothelial connective tissue. It is separated from the media by a dense elastic membrane called internal elastic lamina. The outer limit of the media of most arteries is marked by a well-defined external elastic lamina.
In the large and medium-sized arteries, the smooth muscle cell layer of the media near the vessel lumen depends primarily on direct diffusion of oxygen from the vessel for their nutritional needs. Diffusion is facilitated by holes (fenestration) in the internal elastic membrane (Robins-Pathologic basis of disease, 1999)
Endothelial cells
Endothelial cells form a monolayer that lines the entire vascular systems (the endothelium). Vascular endothelium is a versatile multifunctional tissue having many synthetic and metabolic properties. Endothelial cells can respond to various abnormal stimuli by adjusting some of the constitutive function, by expressing newly acquired (induced) properties (Sumagin et al, 2008). The term endothelial dysfunctions are often used to describe several types of potentially reversible changes in the functional state of endothelial cells that occur in response to environmental stimuli (Selwyn AP
et al, 1997).
Vascular Smooth Muscle Cells
Vascular smooth muscle cells (SMCs) are the stromal cells of the vascular wall, continually exposed to mechanical signals and biochemical components generated in the blood compartment. They are involved in all the physiological functions and the pathological changes taking place in the vascular wall. Owing to their contractile tonus, VSMCs of resistance vessels participate in the regulation of blood pressure and also in hypertension. VSMCs of conduit arteries respond to hypertension-induced increases in wall stress by an increase in cell protein synthesis (hypertrophy) and extracellular matrix secretion (Lacolley, 2012).
7
As the predominant cellular element of the vascular media, smooth muscle cells constitute an important element not only normal vascular repair, but also pathological such us atherosclerosis. The media is accessible to soluble plasma components, which are outwardly convected from the circulating blood through the vascular wall (Michel, 2007). Resting vascular smooth muscle cells are spindle shaped, with single, elongated nuclei resembling fibroblast.
Cytoplasmatic filaments that contain actin and myosin mediate the contractile function of SMCs. During the healing response, smooth muscle cells undergo changes that resemble dedifferentiation (Bochaton-Piallat ML & Gabbiani G, 2005). SMCs migrating from the media to the intima lose the capacity to contract, gain the capacity to divide, and increase the synthesis of extracellular matrix molecules, often designated a shift from that contractile phenotype to the proliferative synthetic phenotype. Structurally, there is a decrease in the thick myosin-containing filaments and an increase in the amount of organelles involved with protein synthesis, such us rough endoplasmic reticulum and Golgi apparatus. The contractile state of vascular smooth muscle influences arterial blood pressure and regulates organ blood flow. The contractile apparatus of vascular smooth muscle is composed of thin and thick filaments, and that force generated between these two filaments provides the mechanism for cell shortening. The molecular events that initiate the interaction between these filaments are dependent upon the free sarcoplasmic concentration of activator calcium, which is regulated by the cell membrane and at subcellular sites. Changes in electrical activity of the cell membrane and interaction of pharmacologic agents with membrane receptors alter the cell, causing either a decrease or increase in sarcoplasmic calcium concentration and thus changing the contractile state of the vascular smooth muscle cell. Alterations in the cellular mechanisms that regulate intracellular calcium concentration may contribute
8
Atherosclerosis is a condition in which patchy deposits of fatty material develop in the walls of medium-sized and large arteries, leading to reduced or blocked blood flow.
Atherosclerosis is caused by repeated injury to the walls of arteries. Many factors contribute to this injury, including high blood pressure, tobacco smoke, diabetes and high levels of cholesterol in the blood (Besler et al, 2008). Often, the first symptom is pain or cramps at times when blood flow cannot keep up with the tissues need for oxygen. To prevent atherosclerosis, people need to stop using tobacco, improve their diet, exercise regularly, and maintain control of their blood pressure and diabetes (Taylor DA & Zenovich AG, 2008). In the most developed countries, atherosclerosis is the leading cause of illness and death.
Arteriosclerosis literarily means hardening of arteries; more accurately, however, it is a generic term for three patterns of vascular disease that have in common thickening and loss of elasticity of arterial walls:
•The dominant patter is atherosclerosis, characterized by the formation of intimal fibrous plaques that often have a central core rich in lipid
•Arteriolosclerosis: sclerosis and thickening of the walls of arterioles. Atherosclerosis is characterized by intimal lesion called atheromas or fibrofatty plaques that protrude into the lumen, and undergo a series of complication.
9
Figure (2). Atherosclerosis primarily affects elastic arteries (e.g., aorta, carotid and iliac arteries) and large and medium sized muscular arteries (e.g. coronary and popliteal arteries). The disease often begins in childhood, but symptoms are not usually evident until middle age or later when the arterial lesions precipitate organ injury (Milei, 2003).
Symptomatic atherosclerotic disease is most often localized to arteries supplying the heart, brain, kidneys, lower extremities, and small intestine. Myocardial infarction (heart attack), cerebral infarction (stroke), and aortic aneurysms are the major consequences of this disease. Thus, epidemiologic data on atherosclerosis are expressed largely in terms of the incidence of or the number of death caused by ischemic heart disease (Robins-Pathologic basis of disease, 1999).
Pathogenesis of atherosclerosis
The development of atherosclerosis is complicated, but the primary event seems to be repeated, subtle injury to the artery‘s wall through various mechanisms. These mechanisms include physical stresses from turbulent blood flow (such as occurs
10
where arteries branch, particularly in people who have high blood pressure) and inflammatory stresses involving the immune system, certain infections, or chemical abnormalities in the bloodstream (high cholesterol, diabetes)(Arora S & Nicholls SJ, 2008).
The pathogenesis of atherosclerosis has not been well defined, however, association of fatty degeneration and vessel stiffing was the first definition of atherosclerosis. Principal events of atherosclerosis are the follow:
•The development of focal regions of chronic endothelial injury, usually subtle, with resultant endothelial permeability and increased leukocyte adhesion (Crowther MA, 2005)
•Insudation of lipoproteins into vessel wall, mainly LDL with its high cholesterol content and also very-low-density lipoprotein (VLDL), and modification of such lipoprotein by oxidation (Torzewski M & Lackner KJ, 2006)
•Adhesion of blood monocytes (and other leukocytes) to endothelium, followed by migration of monocytes into the intima and their transformation into macrophages and foam cells (Doran AC et al, 2008)
•Adhesion of platelets to focal areas of denudation (when present) or to adherent leukocytes (DiCorleto PE, 1993)
•Release of factors from activated platelets, macrophage, or vascular cells that cause migration of smooth muscle cells from media in to the intima (Bochaton- Piallat ML,
11
Figure (3). Classification of type lesions.
Classification of type lesion Type I Lesions
Type I lesions consist of the first microscopically and chemically detectable lipid deposits in the intima and the cell reactions associated with such deposits. These lesions have been characterized in studies in which the sequence of lesions was deduced from examining many persons who died at different ages (Stary et al, 1994).
Type II Lesions
Type II lesions include fatty streaks, which on gross inspection may be visible as yellow colored streaks, patches, or spots on the intimal surface of arteries. Fatty streaks stain red with Sudan III4958 or Sudan IV.
The precursors of advanced lesions are divided into three morphologically characteristic types. Both type II lesions and I represent small lipid deposits in the arterial intima, and type II includes those lesions generally referred to as fatty streaks.
12
Fatty streaks are not significantly raised and thus do not cause any disturbance in blood flow. They may be precursor however of the most ominous atheromatouse plaque (Herbert et al, 1995).
Type III Lesions
The designation "type III lesion" applies only to lesions that form the morphological and chemical bridge between type II lesions and atheromas.
The type III lesion is also known as the intermediate lesion, the transitional lesion, and as preatheroma. Its characteristic histological features are microscopically visible (Stery et al, 1994).
Type IV
In type IV lesion a dense accumulation of extracellular lipid occupies an extensive but well-defined region of the intima. This type of extracellular lipid accumulation is known as the lipid core. A fibrous tissue increase is not a feature, and complications such as defects of the lesion surface and thrombosis are not present. The type IV lesion is also known as atheroma. Type IV is the first lesion considered advanced in this classification because of the severe intimal disorganization caused by the lipid core. The characteristic core appears to develop from an increase and the consequent confluence of the small isolated pools of extracellular lipid that characterize type III lesions (Stary HC, 1989).
Type V
Type V lesions are defined as lesions in which prominent new fibrous connective tissue has formed. When the new tissue is part of a lesion with a lipid core (type IV), this type of morphology may be referred to as fibroatheroma or type Va lesion. A type V lesion in which the lipid core and other parts of the lesion are calcified may be referred to as type Vb. A type V lesion in which a lipid core is absent and lipid in general is minimal may be referred to as type Vc. With these lesions, arteries are variously narrowed, generally more than with type IV (Herbert et al, 1995).
13
Type IV or V lesions with one or more of these additional features are classified as type VI and may also be referred to as complicated lesions. The superimposed features may subdivide type VI:
Role of vascular smooth muscle cells in the atherosclerotic plaque development
The initiation of atherosclerosis results from complex interactions of circulating factors and various cell types in the vessel wall, including endothelial cells, lymphocytes, monocytes, and smooth muscle cells (SMCs). Human autopsy studies, in vitro mechanistic studies, and in vivo correlative data confirm the important role for SMCs in the initiation of atherosclerosis (Orlandi et al, 2006). In response to the initial lipid injury, certain medial SMCs acquire a synthetic and proliferative phenotype and lose several markers of their physiological contractile function.
14
Primary cultures of SMCs recapitulate these phenotypic modifications in vitro. There is strong evidence that alterations in the differentiated state of SMCs play an important role in fibrous cap formation and in post-angioplasty restenosis. Medial VSMCs migrate, proliferate, produce proteoglycans with less affinity for LDLs and collagens in the fibrous cap in response to many stimuli, including PDGF, LPS (Inaba, 2009). Foam VSMCs can evolve either towards cell death, promoting intimal proliferation of adjacent VSMCs (Yu et al, 2011) and plaque calcification (Clarke et al, 2008)
hence participating in plaque progression, or towards more complex and tissue-integrated responses. Apoptosis and cell death are frequent biological events in the initial as well as in more evolved plaques (Bjorkerud et al, 1996).
SMCs are also capable of functions typically attributed to other cell types. Like macrophages, SMCs can express a variety of receptors for lipid uptake and can form foam-like cells, thereby participating in the early accumulation of plaque lipid (Doran et al, 2008). Like endothelial cells, SMCs can also express a variety of adhesion molecules such as vascular cell adhesion molecule-1 and intercellular adhesion molecule-1 to which monocytes and lymphocytes can adhere and migrate into the vessel wall (Doran et al,2008).
If the hypercholesterolemia (or other inciting event) persist, smooth muscle cells proliferation and extracellular matrix deposition in the intima continue and are the major processes that convert a fatty streak into a mature fibrofatty atheroma, accounting for the progressive growth of atherosclerotic lesion (Rosenfeld ME, 2000). Arterial smooth muscle cells synthesize collagen elastin and glycoproteins. Several growth factors have been implicated in the proliferation of SMCs: PDGF, which is release by platelets adherent to the focus of endothelial injury, macrophage, endothelial cells, smooth muscle cells; FGF; and TGF-a. SMCs proliferation is modulated by inhibitors, including heparin-like molecules present in endothelial cells and smooth muscle cells and TGF-b derived from endothelial cells or macrophages (Robbins- Pathologic basis of disease, 1999).
15 SMC distinct phenotype
Normally, adult medial SMCs (termed “contractile”) are arranged in concentric layers and are filled with myofilaments and dense bodies but contain a relatively poorly developed Golgi apparatus and rough endoplasmatic reticulum. In contrast, SMCs characteristic of the intimal lesion of atheroma atherosclerosis (termed “synthetic”) have lost this appearance and are characterised by an abundance of rough endoplasmatic reticulum and sometime no evident myofilaments (Campbell GR,
Campbell JH, 1990). During atherosclerosis progression SMCs switching from a
contractile to a synthetic phenotype, the concept is that a predisposed SMC subpopulation is responsible for the production of intimal thickening (IT). This possibility has been raised on the basis of original work by Beneditt and Beneditt (Beneditt EP, Beneditt JM, 1973) who reported that human atheromatouse plaque have been featured of a monoclonal lesion, recently it has been demonstrate that human plaques are at least oligoclonal (Swarts Sm & Murry CE, 1998). The concept of SMC heterogeneity has been established by the description of contractile and synthetic phenotypes in vivo and in vitro (Thyberg J et al, 1995).
The contractile phenotype is typical of the differentiated artery, and the synthetic one is typical of developing and pathologic arteries. A further step was the characterization in vitro of morphologically distinct SMC populations, which has been observed in many species, including humans (Thomas WA, 1983).
16
Figure (5). Schematic representation of atherosclerotic process
Animal model of atherosclerosis
Several animals have been used for the study of atherosclerosis, such as the non-human primates, swine, mice, guinea pigs and hamsters. However there is no one perfect animal model that completely replicates the stages of human atherosclerosis, cholesterol feeding and mechanical endothelial injury are two common features shared by most models of atherosclerosis (Dhanya SP, Hema CG, 2008).
It is important to note that not all animal models for atherosclerosis develop intimal thickening as a precursor to lesion formation. While intimal thickening is observed in primate and chicken models, it is not found any of the commonly used rodent models (Stary et al, 1992). Although several works have attempted to study atherosclerosis in rodent models by injuring vessels and disrupting internal elastic lamina to induced SMC proliferation, the plaque that results from this approach differ significantly from spontaneous human atherosclerosis (Doran et al, 2008).
17
However, until now, the most-studied species has been the rat. The initial description of SMC heterogeneity was made in the rat carotid artery injury model, wherein 2 SMC populations were identified: a spindle-shaped phenotype, with the classic "hill-andvalley" growth pattern, obtained from the normal media, and an epithelioid phenotype, in which cells grow as a monolayer and exhibit a cobblestone morphology at confluence, isolated from the IT 15 days after endothelial injury (Orlandi A et al, 1994). The findings of 2 SMC distinct phenotype have been confirmed by many laboratories (Bochaton- Piallat ML et al, 1996; Yan ZQ, Hansson GK, 1998).
Irrespective of the species studied, epithelioid and rhomboid phenotypes, when compared with spindle-shaped SMCs, have in common several features, among which the most relevant are (1) enhanced proliferative activity, including serum-independent growth in some species; (2) enhanced migratory activity; (3) increased proteolytic activity; (4) poor level of differentiation, as defined by citoscheletal and contractile protein expression and (5) high sensitivity to apoptotic stimuli. In all species studied, epithelioid and rhomboid SMCs show a higher proliferative activity than do spindleshaped SMCs; however, contrary to spindle-shaped SMCs, they stop growing at confluence as a result of cell contact inhibition (Hao et al, 2003).
Citoscheletal proteins
Alpha-Smooth muscle actin
Alpha-Smooth Muscle Actin (a-SMA), an isoform typical of smooth muscle cells (SMC) and present in high amounts in vascular SMC.
Despite the structural similarities between different actin isoform, there is evidence for functional diversity. Alpha-Smooth Muscle Actin also appears during vascular development but, during maturation, becomes the single most abundant protein in adult vascular smooth muscle cells (Gabbiani et al, 1984). Likewise, a- SMA is the major isoform of vascular tissue, such as the aorta, while γ-smooth muscle actin
18
predominates in the gastrointestinal and genital tracts (J. Vandekerckhove & K.
Weber; 1979).
Stress fibers, which have been studied mainly in cultured cells, are considered to be contractile organelles and are associated with the generation of isometric tension (Wang et al, 2006).
In smooth muscle cells, SMA comprises a very large proportion of total cell protein, while the content of SMA in non-muscle cells such as myofibroblasts is much lower (P.D. Arora and C.A. McCulloch. 1994).
Desmin
Desmin is a type III intermediate filament found near the Z line in sarcomeres. It was first purified in 1977, the gene was characterized in 1989, and the first knock-out mouse was created in 1996(Costa M et al, 2004). Desmin is only expressed in vertebrates, however homologous proteins are found in many organisms. It is a 52kD protein that is a subunit of intermediate filaments in skeletal muscle tissue, smooth muscle tissue, and cardiac muscle tissue.
Vimentin
Vimentin is a member of the intermediate filament family of proteins. Intermediate filaments are an important structural feature of eukaryotic cells. They, along with microtubules and actin microfilaments, make up the cytoskeleton. Although most intermediate filaments are stable structures, in fibroblasts, Vimentin exists as a dynamic structure (Tang DD, 2008).
19
Myosin II is a major contractile protein of skeletal, cardiac and smooth muscles. It is composed of two heavy chains (approximately 200 kDa) and two pairs of light chains (approx. 20 kDa). The myosin heavy chains form a dimer consisting of two globular amino-terminal heads and carboxy-terminal c (-helical coiled coil tails).
The heads bind the light chains and contain the ATP- and actin-binding sites whereas the tails are involved in the assembly of myosin molecules into filaments.
Four smooth muscle specifc myosin heavy chain isoforms are known (Quevillon-
Chéruelet al, 1999). Two isoforms (named SMB and SMA) are defined by the
presence or the absence of an insert of seven amino acids in the N-terminal globular head region.
The study of citoscheletal proteins, which are accepted as reliable differentiation markers, has allowed characterization of the contractile versus the synthetic phenotype.
20
It should be noted that when placed in culture, all SMCs tend to show a dedifferentiated phenotype. With this limitation, the phenotypic variation of cultured SMCs furnishes important information concerning the influence of many factors on their biologic features. α-SMA is expressed in vascular SMCs, even at early stages of development, and thus represents the most general marker of SMC lineage. Although α-SMA is permanently expressed in SMCs, it is more abundant in spindle-shaped SMCs than in epithelioid or rhomboid SMCs. Desmin, an intermediate filament protein, and SMMHC are expressed in well-differentiated SMCs are relatively well studied. In cultured rat SMCs, Desmin generally disappears. In larger animals, Desmin is maintained at a significant level of expression in spindle-shaped SMCs, whereas it is hardly detectable in epithelioid and rhomboid SMCs. SMMHC are clearly expressed more importantly in spindle-shaped SMCs than in epithelioid and rhomboid SMCs (Schwartz et al, 1995; Shanahan CM et al, 1998;
Owens GK, 1998; Sartore S et al, 1999).In general, SMCs isolated from larger
animals, including humans, are more differentiated than those isolated from rodents. Porcine spindle-shaped SMCs maintain appreciable expression of α-SMA, SMMHC, Desmin, and Smoothelin. SMMHC, calponin, h-caldesmon, and metavinculin are abundantly expressed in bovine spindle-shaped SMCs (Frid MG et al, 1997; Hao H
et al, 2002).
Taken together, the data obtained in different species suggest that the degree of differentiation of SMCs changes with the phenotype; this integrates well into a view that reconciles the heterogeneity of SMCs with the modulation concepts. Once distinct populations have been defined, the ultimate aim is to identify genes and/or proteins that are differentially expressed and to test whether they are involved in the phenotypic changes that occur in vivo. Studies on the possibility that an SMC phenotype can evolve into another have shown that the results depend on the species used. The specific phenotype of SMC observed in vitro is maintained when they are placed back into an in vivo environment. The evolution of the lesion in vivo appears
21
to depend on the relative replicative activity and/or susceptibility to apoptosis of these phenotypes. Moreover, in the rat, an agent that influences the biologic behaviour of epithelioid SMCs, i.e., retinoic acid, inhibits IT formation. In the pig, the situation is different, in that spindleshaped SMCs can modulate into rhomboid SMCs and, if the stimulus ceases, can return to their original phenotype, at least in vitro (Hao et al, 2003).
Calmodulin (CaM)
Calmodulin (CaM) is an ubiquitous calcium sensor protein which, in vertebrates and in plants, is encoded by a multigene family exhibiting complex regulation. One of the most striking features of the CaM gene family is the high degree of conservation among family members within a species as well as across species. Strikingly, CaM exists as an identical protein with no amino acid substitutions in all vertebrates including humans, rats, chicken, frogs, and fish. In Humans there are three different genes coding for CaM that are 80–81% identical to each other (Fischer, 1988). CaM is known to regulate the activity of numerous proteins with diverse cellular functions including DNA synthesis and cell division (Crocker et al, 1988; Boynton et al 1980). Moreover, it has been documented that CaM may be also located extracellularly and, therefore, may have substantial functions outside cells (Ma Et al, 2000). Calmodulin is an intensely studied modulator and protein regulator of many catalytic reactions in the cell (Klee, 1982; Means et al, 1982; Carafoli et al,1987; Cohen et al, 1988). Interestingly, many of these reactions reveal an apparent paradox of requiring CaM in reactions of opposing effects. For example, CaM activates adenylyl cyclase as well as cyclic nucleotide phosphodiesterase. CaM, therefore, is essential in both the synthesis and degradation of a prominent second messenger molecule, cyclic AMP, and these opposing reactions must obviously be carefully controlled. CaM is assumed to be involved in many diseases including Parkinson, Alzheimer, and rheumatoid arthritis (Emilie et al, 2013).
22 Nephroblastoma overexpressed protein NOV
CCN3 (also termed nephroblastoma overexpressed, NOV) belongs to the CCN family, which has five additional members: cystein-rich protein 61 (Cyr61), connective tissue growth factor (CTGF), Wnt-1-induced secreted protein (WISP)-1, WISP-2 and WISP-3. CCN proteins are involved in fundamental biological processes such as cell proliferation, attachment, migration, differentiation, wound healing, angiogenesis and tumorigenesis (Perbal B, 2001).
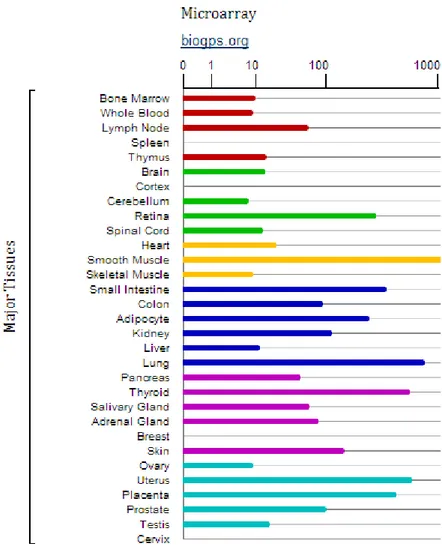
The CCN3 protein is detectable at varying levels in the, kidney, muscle, cartilage, brain, lung, ovary and heart (Joliot et al, 1992; Chevalier et al, 1998; Perbal et al, 2001),as well as its mRNA (Fig. 7).The functions of CCN3 protein among these different tissues are, however, different. CCN3 was originally described as antiprolif-erative (Joliot et al, 1992), and its expression was associated with differentiation of Wilms' tumor (Chevalier et al, 1998), rhabdomyosarcomas (Manara et al, 2002), neuroblastomas (Perbal, 2006), cartilaginous tumors (Yu et al, 2003), adrenocortical tumors (Doghman et al, 2007) and with inhibition of the growth and decrease in tumorigenicity of several tumor cell lines including glioblastoma (Gupta et al, 2001), choriocarcinoma (Gellhaus et al 2004) and Ewing's sarcoma (Benini et al, 2005). Furthermore, CCN3 expression was correlated with the increased proliferative index of 3T3 fibroblast (Liu et al, 1999) and tissue samples of the prostate (Maillard et al, 2001). Although CCN3 reduced the growth rate of Ewing's sarcoma transfectants ex vivo, CCN3 expression was associated with poor prognosis and shown to increase cell motility, resulting in enhanced metastatic potential (6,12).
23
Figure (7). NOV RNA levels by microarray analysis in different human tissues. The figure is taken
from the following link http://www.genecards.org/ and shows a study of microarray conducted in human tissues. The bars are representative of quantity of NOV in the different districts.
All CCN proteins have a similar modular structure, which consists of an amino-terminal secretory peptide followed by four conserved domains with sequence homologies to insulin-like growth factor-binding proteins, the von Willebrand factor C (VWC) domain, thrombospondin type 1 repeat (TSR) and a carboxy-terminal domain that contains a cysteine-knot motif (BOX 1). A non-conserved, protease-sensitive central hinge region bisects the proteins into two halves that bind to distinct
24
cell-surface receptors. The expression of CCN proteins is exquisitely regulated on transcriptional, post-transcriptional and translational levels in response to changes in environmental stimuli, including those encountered during tissue repair (BOX 1; FIG. 8).
Figure (8). Representation of NOV gene.
CCN proteins have been implicated in several vascular pathologies, including atherosclerosis, restenosis, thrombosis and hypertension. CCN3 expression is substantially reduced following balloon injury. CCN3 inhibits smooth muscle cell proliferation in culture, and CCN3-null mice suffer from enhanced neointimal thickening when challenged with vascular injury, which indicates that CCN3 inhibits neointimal hyperplasia (Shimoyama et al, 2010). Likewise, CCN5 inhibits vascular smooth muscle cell proliferation and motility, and its expression is substantially reduced in arteries after balloon-induced injury (Lake et al, 2003).
Targeting strategies, such as the use of siRNA or antisense oligonucleotides to downregulate the expression of genes encoding specific CCN proteins, have been successful in animal model (Brigstock, 2009). The use of synthetic peptides as targeting agents for CCN proteins has not been explored in as much detail but nevertheless has some therapeutic potential.
Ectonucleotide pyrophosphatase/phosphodiesterase 2 ENPP2
Ectonucleotide pyrophosphatase/phosphodiesterase 2 (ENPP2) also known as Autotaxin, is a secreted lysophospholipase D that generates the lipid mediator lysophosphatidic acid (LPA), which in turn activates G protein-coupled receptors to evoke various cellular responses. ATX is essential for normal development, is implicated in various physiological processes, and is also associated with pathological conditions such as cancer, pain and fibrosis. Despite its importance, the
25
molecular mechanism of ENPP2-catalyzed LPA production has long been elusive (Nishimasu et al, 2012). As many other biological active lipids, LPA is an autacoid: it is formed locally on demand, and it acts locally near its site of synthesis. LPA has a plethora of biological activities on blood cells (platelets, monocytes) and cells of the vessel wall (endothelial cells, smooth muscle cells, macrophages) that are all key players in atherosclerotic and atherothrombotic processes. The specific cellular actions of LPA are determined by its multifaceted molecular structures, the expression of multiple G-protein coupled LPA receptors at the cell surface and their diverse coupling to intracellular signalling pathways. Numerous studies have now shown that LPA has thrombogenic and atherogenic actions (Schober & Siess, 2012).
26
Aim of the study
The principal aim of this study was to reproducibly isolate and thoroughly characterize human arterial SMC subpopulations in order to evaluate their role in atheroma formation and their phenotypic changes associated to the atherosclerotic process. Additional aim of this study was to analyze the expression profiles of human arterial SMC subpopulations, in particular to validate signals stemming from a previous microarray study. In addition investigations of these signals both at RNA and protein level, on cultured SMCs cells and on carotid tissues directly, was addressed.
The feasibility of this study has been largely supported by well-established collaborations between our laboratory and i) the Unit of Vascular and Endovascular Surgery of Sant’Anna University Hospital, of Ferrara, leader Francesco Mascoli, who provided us with samples of atherosclerotic and non-atherosclerotic human carotid artery from patients undergone to carotid endarterectomy and ii) the group of Marie Luce Bochaton Piallat of the Department of Pathology and Immunology (CMU) at the University of Geneva, for its expertise on SMC characterization by istological, immunoistochemical and immunofluorescence analysis.
27
Materials and Methods
Tissue explantation
Carotid endo-arterectomy (CEA) specimens were obtained at surgery from thirty patients who underwent conventional CEA for extracranial high-grade internal carotid artery stenosis (>70% luminal narrowing for symptomatic patients according to NASCET criteria for carotid stenosis11). Arteriotomy was performed on the common carotid artery and extended to the internal carotid artery. The specimen was removed intact as a single piece and was further cut into two portions: non-diseased portion (NP) and diseased portion (DP), characterized by diffuse atherosclerotic lesions. Representative tissue blocks were obtained from each segment and processed for immunohistochemistry or immunofluorescence.
For cell culture specimens retrieved at surgery were conserved in cold sterile Roswell Park Memorial Institute (RPMI) supplemented with 2% HEPES, 100 U/ml penicillin, 100 μg/ml streptomycin and 2 mM L-glutamine (Gibco-Invitrogen, Carlsbad, CA). Specimens were carried to the laboratory with in 1 hour from surgical intervention. Specimens were washed several times with warm (37°C) phosphate buffered saline (PBS) to remove blood in excess.
The abluminal surface of tissue were gently scraped to remove any connettive tissue, whereas the luminal surface underwent the same treatment to remove endothelial cells. For tissue explantation, (CEA) specimens were cut into 3x3x3-mm pieces. The abluminal side of the explants was carefully placed in contact with the culture dish (5-10 tissue pieces for the nondiseased portion NP and 15- 20 tissue pieces for the diseased portion DP per 60-mm dish). After 20 minutes, during which specimens dried, RPMI (10% FBS, 100 U/ml penicillin, 100 μg/ml streptomycin, 400mM l-glutamine) was added to petri dish.
28
Once outgrowth from explanted tissue rinse confluences, cells were passed by a 1:2 spit ratio and cultured in RPMI plus 10% FBS, containing 100 U/ml of penicillin and 100 μg/ml of streptomycin and 400mM l-glutamine (All reagent from Gibco, Invitrogen).Cells were maintained at 37 °C in a humidified atmosphere of 95% air and 5% of CO2. Cells were usually used at third and fourth passage. The mean proportion of explants yielding SMC outgrowth was higher for the NP media than for the DP media. Although large SMCs started to grow from the explants more rapidly than did small SMCs (at 5-7 and 6-10 days, respectively), small SMCs reached confluence after 10-14 days from the appearance of the first cells whereas large SMCs only formed subconfluent monolayers at 14-21 days. Explanted tissue pieces were removed 7 to 10 days after the first SMCs appeared. Both phenotypes remained stable after several passages.
Co-culture experiments
Co-culture of plaque and macrophages with large cells was performed by using the Transwell system (24-mm diameter Transwell clear polyester membrane, 0.4-μm pore size, Costar). Plaque-derived conditioned medium (CM) was collected from cultures of DP plaque pieces 72 hours after plating. CM was diluted 1:1 (v/v) with fresh medium supplemented with 10% FBS and added to passaged SMCs for 72 hours. Large cells were plated into the lower compartment in RPMI plus 10% FBS, plaque and macrophages were plated in the upper compartment. CaM inhibition was accomplished with N-(6-aminohexyl)-5-chloro-1-naphthalene sulphonamide (W-7; Fluka/Sigma-Aldrich). To evaluate the effect of W-7 on phenotypic transition, large SMCs were plated in RPMI supplemented with 10% FBS at a density of 80 cells/mm2 with or without plaque-derived conditioned medium (CM) in combination or not with W-7 (10 µM) for 3 (immunofluorescence staining) or 7 (cell proliferation) days.
29 RNA extraction
RNA was extracted both from cells and tissue specimens. Cells were directly lysed in a culture dish by adding 1 ml of Trireagent® solution (SIGMA) to a 3.5 cm diameter dish. A more complex process was used for the lysis of the sample tissues. In fact, NP and DP specimens were collected immediately in liquid nitrogen after surgical operation. They were conserved at -80°C until further processing. Specimens were cutted into slides of 10 µm with cryostat and 1 mL of was added for 50-100 ng of tissue.
The mixture was drawn up and down with a small bead inside a 2 ml heppendorf through tissue lyser to help break up. The heppendorf was perturbed for 2 minute at 20 Hz. After it was chilled in ice and again was perturbed for 2 minute at 20 Hz. To remove insoluble material from the homogenate a centrifugation at 12,000 g for 10 minutes at 4°C was performed. The resulting pellet contains extracellular membranes, and high molecular weight DNA, while the supernatant contains RNA. In samples with fatty acids as DP portions, an excess of fat collects as a top layer were removed. In each case, the cleared homogenate solution was transferred to a fresh tube. From this step the procedure is the same for cells and tissues.
200 μL of chloroform was added and the mixture was shaken vigorously by hand for 15 s. The mixture was incubated for 3 min at room temperature and then centrifuged at 12,000 g for 15 minutes at 4°C to separate the 3 layers. The upper, aqueous, phase contains mostly RNA, and the interphase contains mostly DNA.
A 500 μL aliquot of the aqueous phase was collected in a fresh tube and an equal volume of cold isopropanol was added. The mixture was chilled on ice for 10 min and then centrifuged at 12,000 g for 10 min at 4°C to yield an RNA precipitate.
The pellet was identified and the supernatant discarded. The pellet was washed with 1ml of 70% cold ethanol at 4°C and then dried at room temperature to ensure that no contaminating ethanol remained.
30
Ribonuclease-free water (treated with diethylpyrocarbonate) was added (20-40 μL, depending on the size of the RNA pellet) and the RNA concentration was determined by spectrophotometry. The quality of the RNA was valued with 1% of agarose gel.
Reverse transcription and Real-Time Quantitative PCR
The RNA quality and quantity were determined by Experion RNA StdSens Analysis Kit (BioRad, Hercules, CA) or checking on 1% agarose gel. For each sample 1μg of total RNA was reverse transcribed using SuperScript VILO cDNA Synthesis Kit (Gibco-Invitrogen) according to the manufacturer’s recommendations in the following thermal conditions: 10 minutes at 25°C, then 60 minutes at 42°C, followed by 5 minutes at 85°C. Specific primers for human NOV, CCN2, ENPP2, B2M, ACTB and 18S mRNA were designed as follows: 5’-
TGAGATGCTGAAACAGACTCGGCT-3’ (forward) and 5’-
TTGAGTGACTTCTTGGTGCGGAGA -3’ (reverse) covering a fragments of 111bp of NOV, 5’- CTTGCGAAGCTGACCTGGAA -3’ (forward) and 5’- AAAGCTCAAACTTGATAGGCTTGGA -3’ (reverse) covering a fragments of 90bp of CCN2, 5’- TATCCTGCTTTCAAACGGGTCTGG -3’ (forward) and 5’- GTTGGAACAGGAATGGAACTGCCT -3’ (reverse) covering a fragments of 182 bp of ENPP2, 5’- TTTCATCCATCCGACATTGA -3’ (forward) and 5’- CCTCCATGATGCTGCTTACA -3’ (reverse) covering a fragments of 228bp of B2M, 5’- CATCGAGCACGGCATCGTCA -3’ (forward) and 5’- TAGCACAGCCTGGATAGCAAC -3’ (reverse) covering a fragments of 211bp of ACTB and 5’-GTAACCCGTTGAACCCCATT-3’ (forward) and 5’-CCATCCAATCGGTAGTAGCG-3’ (reverse) covering a fragments of 153bp of 18S. Specific primers for human CALM1, CALM2, CALM3 were designed as follows: 5’-TGACTTCCCCGAATTTTTTGAC-3’ (forward) and 5’-TGTCCGTCTCCATCAATATCT-3’ (reverse) covering nucleotides 394 to 609 of CALM1, AAGTTGATGAAATGATCAGGGAAG-3’ (forward) and
5’-31
TGAAGTCCTAATTACTATACATGCATA-3’ (reverse) covering nucleotides 520 to 739 of CALM2, ATGATGACTGCAAAGTGAAGGCCC-3’ (forward) and 5’-GAGCAATCATGCAGCTTGGGACAA-3’ (reverse) covering nucleotides 613 to 797 of CALM3. Real time SsoFast EvaGreen Supermix PCR (BioRad) was performed in a Chromo4 Real-Time PCR Detection System (BioRad). Denaturation was performed at 95°C for 30 seconds, then DNA was amplified for 40 cycles of 5 seconds at 95°C, and 10 seconds at 60°C. Each reaction was performed in triplicate. The relative levels of each RNA were calculated by the comparative CT method. Results were normalized to amplified 18S, or/and B2M and ACTB transcripts in the same samples and were expressed as fold change in small compared to large SMCs and plaque-derived CM treated large SMCs to untreated large SMCs. Each real-time PCR experiment was repeated at least twice.
Antibodies
The following primary mouse monoclonal antibodies were used: IgG2a recognizing α-smooth muscle actin (α-SMA) clone 1A412; IgM recognizing S100A4 (clone 4B4); IgG1 recognizing calmodulin (CaM, clone CaM85, Zymed-Invitrogen, Carlsbad, CA); IgG1 recognizing smoothelin A and B (clone R4A); IgG1 recognizing CD68, marker of macrophages (clone KP1, Dako); Rabbit polyclonal IgGs recognizing NOV (clone GTX103377, Gene Tex) was also used.
Immunofluorescence cell staining
Cells from 3rd to 6th passage were growth on glass cover slips. SMCs were fixed for 20 minutes using 1% paraformaldehyde (PFA) (Sigma Aldrich) in RPMI with 2% HEPES (Gibco, Invitrogen Corporation) then rinsed in Phosphate Buffered Saline (PBS). They were further incubated for 7 minutes in methanol at -20°C and double stained with anti-α-SMA and either anti-NOV or anti-CaM; Rhodamine-conjugated
32
goat anti-mouse IgG1, fluorescein-conjugated goat anti-mouse IgG2a and rhodamine-conjugated goat-anti-rabbit IgG were used as secondary antibodies (Southern Lab, Birmingham, AL).
Nuclei were stained with 4',6-diamidino-2-phenylindole dihydrochloride (DAPI, Fluka/Sigma-Aldrich). Slides were mounted in buffered polyvinyl alcohol (PVA) (Fluka/Sigma-Aldrich). SMC images were taken by means of an Axioskop 2 microscope (Carl Zeiss, Jena, Germany) equipped with oil immersion Plan-Neofluar ×40/1.4 and ×63/1.25 objectives and a high sensitivity, high-resolution digital color camera (Axiocam, Carl Zeiss). The number of αSMA, NOV and CAM-positive cells was counted by using an Eclipse 50i microsope (Nikon) at x40 magnification in 10 different fields for each sample. Images of immunofluorescence staining were acquired and overlaid by using Adobe Photoshop.
Immunofluorescence tissue staining
Three μm thick sections from formalin-fixed paraffin-embedded specimens were incubated in tris/EDTA pH 9.1 for 20 minutes in microwave at 250W. Double immunofluorescence staining was performed with anti-α-SMA (1:50) and anti-Nov (1:400). Rhodamine-conjugated goat anti-rabbit IgG and fluorescein-conjugated goat anti-mouse IgG2a were used as secondary antibodies (Southern Lab, Birmingham, AL). Nuclei were stained with DAPI. Slides were mounted in buffered polyvinyl alcohol. Images were taken as described above.
Immunohistochemistry
Representative specimens of the NP (n=3) and DP (n=3) from the same patient and 4 additional DP specimens were fixed with 4% buffered formalin and embedded in paraffin. Three μm thick sections were stained with standard histological techniques: hematoxylin and eosin (HE), Masson trichrome and Miller. Immunostaining for
α-33
SMA (1:200), NOV (1:500), CD68 (1:200) was performed on adjacent sections. Before using the first antibody, immunoreactivity was intensified by microwave treatment (750W, 5 minutes) in citrate buffer (10 mM, pH 6.0) for α-SMA, by pressure cooker treatment in citrate buffer 3 minutes for NOV. Goat anti-mouse or anti-rabbit biotinylated antibodies (Dako, Glostrup, Denmark) were used as secondary antibodies. The presence of the specific proteins was revealed by means of the streptavidin-biotin peroxidase complex and staining was visualized with the 3,3'-diamino-benzidine (Dako). Hemalun was used as counterstaining. Images were taken by means of an Axioskop 2 microscope (Carl Zeiss, Jena, Germany) equipped with Plan-neofluar ×10/0.3 and oil immersion Plan-Neofluar ×40/1.4 objectives and a high sensitivity, high-resolution digital color camera (Axiocam, Carl Zeiss).
Statistical Analysis
Comparisons between treated and control groups were analyzed by Student t test. Multiple comparisons were performed by ANOVA. Differences were considered statistically significant at values of P<0.05.
34
Results
Isolation of SMCs by tissue explantation
In order to obtain primary culture of SMCs from CEA specimens, from both diseased portion (DP) and grossly normal portion (NP) tissue explantation technique was used. After four days, from tissue explantation, wells containing specimens were observed daily with phase-contrast microscopy, to record cellular outgrowth.
Cells outgrew from fifth to tenth day after tissue explantation but time for outgrowth was different, in fact cells from NP came out before cells from DP. After two weeks specimens were removed from well.
Confluence was rise at different days, in fact while NP cells raised the confluence nine days after cellular outgrowth, DP cells took about seven day to raise confluence.
Distinct SMC phenotypes
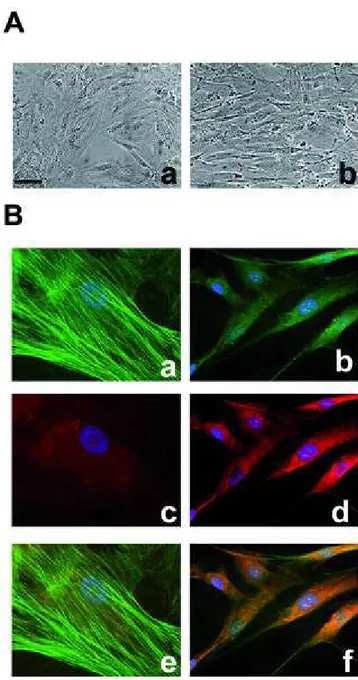
Observation of cells by phase-contrast microscopy clearly showed morphological differences between NP- and DP-derived cells (figure 9)
Figure (9). Phase-contrast micrographs showing large SMCs isolated from the media of the proximal (“normal” portion NP) portion (a), and small SMCs isolated from the media of the distal diseased portion (DP) (b).
35
Cells from NP are “large”, grow as a monolayer and exhibit flat morphology at confluence, while DP cells are “small” and grow multilayer with the classic "hill-and-valley" growth pattern.
Distinctive features of SMC
Differences between the two cell populations were further analyzed by investigating the expression of a characteristic molecular marker of the SMC lineage. For this purpose immunofluorescences staining was used. Since mature SMCs express alpha smooth muscle actin (α-SMA) identification of this marker in these cells is necessary to define them as smooth muscle cells. In parallel, the expression of S100A4, a small calcium-binding protein marker of atheroma-prone SMCs in pig (Brisset et al, 2007), was analyzed at the Department of Immunology and Pathology in Geneva, in the same cell populations cultured at the lab in Ferrara.
Figure (10). Immunofluorescence staining of large (a, c) and small (b, d,) SMCs for α-SMA (a, b) and S100A4 (c,d). Nuclei are stained in blue by DAPI. Note that α-SMA is located in stress fibers in large SMCs (a) whereas it shows a more diffuse pattern in small SMCs. S100A4 is diffusely expressed in small SMCs (d). Bar= 20 µm.
36
The majority of large SMCs (82.9±8.8%) displayed a typical α-SMA staining pattern with strongly positive stress fibers (Figure 10, a); both the number of α-SMA positive cells (68.8±12.1%) and the intensity of the staining was lower in small SMCs (Figure 10, b) compared to large SMCS. Large SMCs stained negative for S100A4 (Figure 10, c) whereas small SMCs expressed S100A4 (42.0±6.6%) with a diffuse staining pattern (Figure 10, d).
Isolation and Characterization of Plaque-Derived Macrophages
Many round cells (50-100 for each explant) emerged from the DP plaque explants 24- 48 hours after plating (n=3). They displayed a flattened appearance (figure 11, a) and a foamy cytoplasm. Positive staining for CD68 (figure 11, b) identified them as macrophage-derived foam cells.
Macrophages remained viable in culture for a period of 3 to 4 weeks, then they started detaching.
Figure (11).Characterization of macrophage-derived foam cells. Phase-contrast image (a) and CD68 (b) staining. These cells are positive for CD68, marker of the macrophage lineage. Bar= 50 μm.
Plaque, Plaque-Derived Macrophages and Plaque-Derived CM Induce SMC Phenotypic Transition
Large cells and plaque or macrophages were placed in two different compartments. Transwell membranes (Corning Corporation) were used, a system suitable for coculture experiments. This polyester membrane is supported on a plastic small
37
basket, inserted in wells (made of polystyrene). The membrane has holes of 0,4μ that does not allow the cells to cross it, but permit medium to diffuse from a compartment to other. The transwell system could permit to grossly mimic the structure of the vessel wall, in which cells of media and plaque are separate by elastic lamina, but they can communicate and influence each other by secreting biological molecules, able to diffuse from a compartment to another. The cells were located in the bottom and were cultured in three different conditions, in the presence of: macrophages or plaque located in the upper compartment (fig 12, a; c) and conditioned medium added directly to the cells (fig 12, b). Conditioned medium was collected from cultures of DP plaque pieces 72 hours after plating. CM was diluted 1:1 (v/v) with fresh medium supplemented with 10% FBS and added to passaged SMCs for 72 hours.
Figure (12).Schematic representation of cell growth system.
After coculture with plaque pieces from the DP, plaque-derived macrophages, or culture with plaque-derived CM, large SMCs underwent a transition from the flat, polygonal morphology to the small, elongated appearance typical of small SMCs. (Fig 13 A).
b
c
Large cells
Large cells
Large cells
38
By immunofluorescence we observed that the transition from large to small phenotype was associated with a diffuse α-SMA staining and a reduced α- SMA content. This transition occurred in the majority of large cells (Fig 13 B).
Figure (13). SMC phenotypic transition. A. Phase-contrast images of large SMCs in control condition (a) and after culture with plaque derived CM (b). B. Immunofluorescence staining of large SMCs in control conditions (a, c, e) and after culture with plaque derived CM (b, d, f) for α-SMA (a, b), and CaM (c, d). Double-labeled structures appear in yellow on merged pictures (e, f). Nuclei are stained in blue with DAPI.
39
While we were studying the changes in the phenotype and proliferation promoted by the treatment with plaque, plaque-derived CM, and plaque-derived macrophages, the group of Marie-Luce Bochaton Piallat in Geneva performed proteomic analysis on large and small populations, which have been cultured in our laboratory in Ferrara. From the analysis of 2D-PAGE spots calmodulin (CaM) emerged as differentially expressed between cell populations, particularly it was predominantly expressed in small cells.
By immunofluorescence analysis we observed that large to small phenotypic transition, induced by the different treatments (see above), was associated with a significant increase in the proportion of CaM-positive cells (fig 13, c; d).
When large SMCs were cocultured with plaque pieces from the DP (n=3) or plaque-derived macrophages (n=2) they grew more rapidly compared with control condition (large alone, percent growth rate at 7 days 193.226.9%, P<0.001, and 177.361.4%, P<0.01, respectively; figure 13, a). Similar results were obtained when large SMCs were cultured with plaque-derived CM (n=3; percent growth rate at 7 days 234.364.4%, P<0.01; figure 13, a).
41
Figure (14). SMC phenotypic transition. Proliferative activity (a) and quantification of typical -SMA (b) and CaM (c) positive SMCs in control conditions, after coculture with plaque pieces from the DP and plaque-derived macrophages, after culture with plaque-derived CM and after co-treatment with W-7. **, P<0.01 and ***, P<0.001 compared with control; #, P<0.05 compared with culture with plaque-derived CM.
CaM inhibition with W-7
W-7 was chosen as a CaM inhibitory compound to investigate if inhibition of CaM could prevent the phenotypic changes, observed after treatment with macrophage-derived foam cells or atherosclerotic plaque conditioned media.
Large SMCs populations were plated in RPMI medium with or without plaque derived CM in combination or not with W7. We found that the proliferative effect of plaque-derived CM (Figure 14, a; percent growth rate at 7 days 67.7±32.77%) on large SMCs was prevented by co-treatment with W-7 (percent growth rate at 7 days 29.76±21.16%).
Immunofluorescence staining (Figure 15 and 14, b;c) showed a significant increase in the number of typical α-SMA-positive SMCs (n=2; 37.2±7.2%) accompanied by a reduction in the percentage of SMCs displaying a diffuse and/or practically negative α-SMA staining (62.8±7.2%) compared with SMCs treated with plaque-derived CM (15.9±4.7% and 84.1±4.0%, respectively, P<0.05 for both).
42
Figure (15). SMC. Immunofluorescence staining of large SMCs in control conditions (a, c, e) and after culture with plaque derived CM + W7 (b, d, f) for α-SMA (a, d), and CaM (b, e). Double-labeled structures appear in yellow on merged pictures (c, f). Nuclei are stained in blue with DAPI.
CALM mRNA Expression
We investigated the RNA expression levels of the three genes for CALM on cultured SMCs by QPCR. Level of CALM1, CALM2 and CALM3 were found similar in small (n=3) and large (n=3) SMC populations (fold change 1.63±0.87, 1.93 ±0.27, and 1.66±0.29, respectively). The large to small phenotypic transition was not associated with significant differences in the fold change of CALM1, CALM2 and CALM3 mRNA expression after coculture with plaque pieces from the DP (n=2; 0.87±0.15, 1.29±0.33, and 1.01±0.14, respectively) or plaque-derived macrophages (n=2; 0.61±0.23, 1.10 ±0.79, and 1.25±0.25, respectively), and after culture with plaque-derived CM (n=1; 1.43, 1.24, and 1.49, respectively) compared with untreated large SMCs (n=3).
RNA studies in Cultured SMCs and in tissue specimens
a
b
c
43
An additional aim of this study was to analyze the expression profiles of human arterial SMC subpopulations, in particular to validate signals stemming from a previously conducted RNA microarray study in our laboratory.
The analysis was also extended to carotid tissues directly both at RNA and protein level.
The RNA profiling microarray study, which was conducted on a small number of RNA samples, from three couples of small and large populations, showed 255 genes differentially expressed (fold change >2; P<0.05).
To validate by qPCR signals from RNA profiling, for each gene we designed one of the two primers in the same exon recognized by the probe used in the microarray, in order to analyze approximately the same region tested by the microarray approach. We decided to investigate NOV because it was one of the genes found more expressed in small than in large cell populations in the RNA profiling (by using two different probes, fold change small/large populations = 4.54 and 4.77 respectively, P<0.05).
NOV mRNA level evaluation by qPCR was conducted in cell populations (n=8) cultured from couples (n=4) of NP and DP carotid portions. NOV mRNA was found more expressed in cells (small) obtained from the DP than in those (large) from the respective NP (fold change D/N=2.19±0.51 and 2.62±0.8 using 18s and B2M as control genes respectively).
44
Figure (16). QPCR of NOV in large and small populations, 18S and B2M are used as control
genes. . Large cells are set to one as control. Data are reported as mean±SEM.P=ns
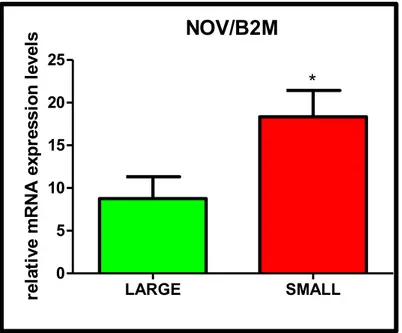
The study of NOV mRNA expression levels was further extended to 5 populations of large and 5 populations of small cells from different CEA specimens. Significant differences were observed in expression levels (fold change small/large populations= 2.10±0.63, P<0.05 by unpaired t-test). NOV/B2M LARGE SMALL 0 5 10 15 20 25 * re la ti ve m R N A e xp re ss io n l ev el s
Figure (17). QPCR of NOV in large and small populations, B2M is used as control gene. Data are reported as mean±SEM. *=P<0.05
As these results were obtained in culture of SMCs, a model that does not reproduce the in vivo condition, and can cause a shift in the transcriptome (Bijnens et al, 2005), we decided to “go back” to the tissue removed by carotid endarterectomy.
Thus, to investigate RNA expression level directly in the tissue from which SMC primary cultures were obtained by tissue explantation, we analyzed the RNA extracted from 4 couples of diseased and normal portions of carotid artery. A higher expression of NOV in DP than in NP was detected (fold change DP/NP= 2.24±1.10 and 2.27±1.45 using as refer genes ACTB and 18s respectively, P=ns).
45
Figure (18). QPCR of NOV in NP and DP populations, 18S and B2M are used as controls. mRNA levels of the NP portions are set to one as control. Data are reported as mean±SEM.
Taken together, results from qPCR for NOV mRNA indicated that the fold change in expression levels between cultured small and large cell populations was similar to that between DP and NP tissue specimens.
Successively we wondered if genes, coding for proteins interacting with NOV could be differentially expressed in the SMC subpopulations. From the literature NOV is involved in many pathways and the inspection of STRING database revealed that NOV interacts with many other proteins (fig. 19) and among these, CCN2 (CTGF) which belongs to the same family of NOV.
NOV/ACTB NP DP 0 1 2 3 4 re la ti ve m R N A e xp re ss io n l ev el s NOV/18S NP DP 0 1 2 3 4 re la ti ve m R N A e xp re ss io n l ev el s
46
Figure (19). Interactions of NOV with other genes/proteins. This image is taken from the following
web site: http://string-db.org/ .
Interestingly previous studies have reported CCN2 expression levels much more higher in smooth muscle than other tissue(Fig. 20).
47
Figure (20). CCN2 levels by microarray analysis in different human tissues. The figure is taken
from the following link and shows a study of microarray conducted in human tissues. The bars are representative of quantity of CCN2 in the different districts. The highest expression here represented as out of scale is in the smooth muscle tissue.
By qPCR we analyzed CCN2 mRNA levels in 4 couples of small and large cell populations. CCN2 mRNA levels were found slightly higher in cells cultured from the DP (small cells) than in cells from the NP (large cells) (fold change small/large populations=1.36±0.40 and 1.81±0.67 using ACTB and 18S as control genes respectively, P=ns).
48
Figure (21). QPCR of CCN2 in large and small populations, ACTB and 18s are used as control genes. Data are reported as mean±SEM.
As for NOV, we investigated the RNA levels for CCN2 also at tissue level, NP and DP specimens. CCN2 mRNA was found more expressed in NP than in DP (fold change DP/NP=0.69±0.12 and 0.39±0.09 using ACTB and 18s as control genes respectively, P=ns).
Figure (22). QPCR of CCN2 in NP and DP, ACTB and 18s are used as housekeeping genes. Data are reported as mean±SEM.
CCN2/ACTB NP DP 0.0 0.5 1.0 1.5 re la ti ve m R N A e xp re ss io n l ev el s CCN2/18S NP DP 0.0 0.5 1.0 1.5 re la ti ve m R N A e xp re ss io n l ev el s
49
The analysis of the chromosome 8 region (8q24) encompassing the NOV gene showed that downstream to NOV is located the ENNP2 gene that codes for autotaxin the enzyme that generates LPA (see introduction). Thus ENPP2 gene was selected for further analysis at RNA levels both in cultured SMC populations and in carotid tissues.
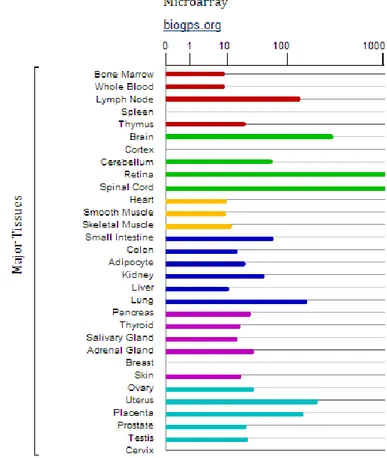
From the literature, the ENPP2 mRNA levels in smooth muscle evaluated by microarray (fig. 23) were comparable to those of NOV mRNA (fig 7 introduction).
Figure (23). ENPP2 levels by microarray analysis in different human tissues. The figure is taken from the following link http://www.genecards.org/ and as below, shows a study of microarray conducted in human tissues. The bars are representative of quantity of ENPP2 in the different tissues.
QPCR for ENPP2 was conducted in 3 large and in 3 small cell populations. Although significant differences were not observed, a trend for a higher expression of ENNP2 mRNA in small than in large was detected (fold change small/large
50
populations=5.67±2.36 and 4.02±1.69 using ACTB and 18S as control genes respectively).
In the previously performed RNA microarray in SMC subpopulations, a higher fold change for ENPP2 was found between small and large cell populations (P value < 0.05).
Figure (24). QPCR of ENPP2 in large and small populations, ACTB and 18s are used as housekeeping genes. Data are reported as mean±SEM. P=ns
Also analysis of mRNA levels in tissues showed that ENPP2 mRNA levels were higher in DP( n=4) than in NP ( n=4) specimens (fold change DP/NP=1.99±0.64 and 1.72±0.56 using 18S and ACTB as control genes respectively, P=ns).
ENPP2/ACTB LARGE SMALL 0 2 4 6 8 10 re la ti ve m R N A e xp re ss io n l ev el s ENPP2/18S LARGE SMALL 0 2 4 6 re la ti ve m R N A e xp re ss io n l ev el s ENPP2/18S NP DP 0 1 2 3 re la ti ve m R N A e xp re ss io n l ev el s ENPP2/ACTB NP DP 0.0 0.5 1.0 1.5 2.0 2.5 re la ti ve m R N A e xp re ss io n l ev el s
51
Figure (25). QPCR of ENPP2 mRNA in NP and DP, ACTB and 18s are used as housekeeping genes. Data are reported as mean±SEM.
Immunofluorescence of NOV in large and small SMCs
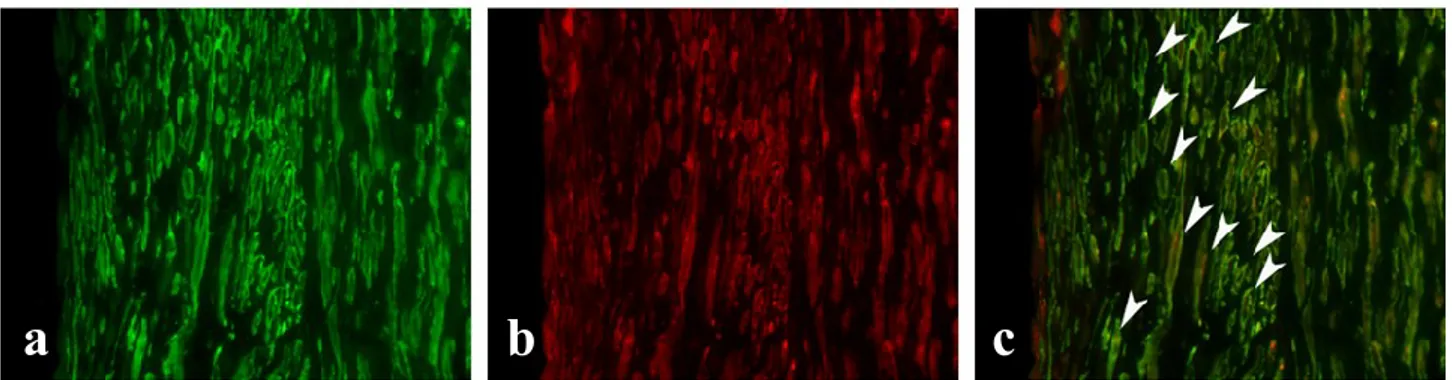
We investigated the expression of NOV protein in cultured SMC populations by immunofluorescence. We analyzed 5 large and 4 small populations of SMCs. For each population, cells were seeded at the density of 50000 for each well (six-well plate). Positive cells for the marker of differentiation, α-SMA, and the NOV protein were counted in 10 different fields for each sample.
The large SMCs displayed a typical α-SMA pattern (stress fibers) and the 49.8 ± 7.27% of cells was strongly positive. Among the small cells, the 31.7 ± 12.76% was positive for α-SMA with a diffuse staining. While 23.01 ± 3.38% of small SMCs was positive for NOV, only 4.72 ± 1.95% of large cells was positive. Thus a 4.87 fold change in immunofluorescence signal for NOV between small and large populations was observed.
52
Figure (26). Immunofluorescence staining of large (a, b, c) and small (d, e, f) SMCs for α-SMA (a, d), NOV (b, e) and merge (c, f). Nuclei are stained in blue by DAPI.
Histological characterization of arterial tissues
This part of the research was conducted during my five month stage at the laboratory of Marie-Luce Bochaton Piallat in Geneva.
Representative tissue blocks obtained from NP (n=3) and DP (n=10) specimens were processed for histology characterization. All CEA specimens included the entire intima and the media comprising the layers up to the external elastic lamina. NP specimens exhibited a media and a thin thickened intima, consistent with American Heart Association (AHA) type III intermediate lesion (Figure 26, a, c and e). DP specimens exhibited a media underlying an atheromatous plaque corresponding to AHA type IV-V atheroma-fibroatheroma (Figure 26, b, d and f). Miller and Masson’s trichrome staining showed the typical structure of a muscular artery with abundant elastic fibers in the media (Figure 26, c, d, e and f). The atherosclerotic plaques of the carotid artery showed in all the samples a substantial fibrous cap overlying the necrotic core containing extracellular lipids in which cells were totally absent. The atherosclerotic lesions were composed of a large number of SMCs cells. Calcifications were present near cholesterol clefts in one of the samples.