https://doi.org/10.1007/s00592-018-1124-0
ORIGINAL ARTICLE
Predictors of treatment response to liraglutide in type 2 diabetes
in a real‑world setting
N. Simioni
1· C. Berra
2· M. Boemi
3· A. C. Bossi
4· R. Candido
5· G. Di Cianni
6· S. Frontoni
7· S. Genovese
8· P. Ponzani
9·
V. Provenzano
10· G. T. Russo
11· L. Sciangula
12· A. Lapolla
13· C. Bette
14· M. C. Rossi
15· ReaL (NN2211-4118) Study
Group*
Received: 10 January 2018 / Accepted: 28 February 2018 / Published online: 12 March 2018 © The Author(s) 2018. This article is an open access publication
Abstract
Aims
There is an unmet need among healthcare providers to identify subgroups of patients with type 2 diabetes who are
most likely to respond to treatment.
Methods
Data were taken from electronic medical records of participants of an observational, retrospective study in Italy.
We used logistic regression models to assess the odds of achieving glycated haemoglobin (HbA
1c) reduction ≥ 1.0% point
after 12-month treatment with liraglutide (primary endpoint), according to various patient-related factors. RECursive
Parti-tioning and AMalgamation (RECPAM) analysis was used to identify distinct homogeneous patient subgroups with different
odds of achieving the primary endpoint.
Results
Data from 1325 patients were included, of which 577 (43.5%) achieved HbA
1creduction ≥ 1.0% point (10.9 mmol/
mol) after 12 months. Logistic regression showed that for each additional 1% HbA
1cat baseline, the odds of reaching this
endpoint were increased 3.5 times (95% CI: 2.90–4.32). By use of RECPAM analysis, five distinct responder subgroups
were identified, with baseline HbA
1cand diabetes duration as the two splitting variables. Patients in the most poorly
con-trolled subgroup (RECPAM Class 1, mean baseline HbA
1c> 9.1% [76 mmol/mol]) had a 28-fold higher odds of reaching the
endpoint versus patients in the best-controlled group (mean baseline HbA
1c≤ 7.5% [58 mmol/mol]). Mean HbA
1creduction
from baseline was as large as − 2.2% (24 mol/mol) in the former versus − 0.1% (1.1 mmol/mol) in the latter. Mean weight
reduction ranged from 2.5 to 4.3 kg across RECPAM subgroups.
Conclusions
Glycaemic response to liraglutide is largely driven by baseline HbA
1clevels and, to a lesser extent, by diabetes
duration.
Keywords
Liraglutide · Type 2 diabetes · Response to therapy · RECPAM analysis · GLP-1RA
Managed by Massimo Porta.M. Boemi: Deceased. * M. C. Rossi [email protected]
1 Presidio Ospedaliero di Cittadella, Cittadella, Padua, Italy 2 Humanitas Research Hospital, Rozzano, MI, Italy 3 IRCCS INRCA , Ancona, Italy
4 ASST Bergamo Ovest, Treviglio, BG, Italy
5 Azienda Sanitaria Universitaria Integrata di Trieste, Trieste,
Italy
6 Ospedale di Livorno, Livorno, Italy 7 University of Rome Tor Vergata, Rome, Italy 8 IRCCS Centro Cardiologico Monzino, Milan, Italy
9 Ospedale La Colletta, ASL3 Genovese, Arenzano, Italy 10 Centro Regionale di Riferimento Diabetologia ed Impianto
Microinfusori Sicilia, Partinico, Palermo, Italy
11 University of Messina, Messina, Italy
12 IRCCS Multimedica - Ospedale di Castellanza, Varese, Italy 13 University of Padua, Padua, Italy
14 Novo Nordisk Spa, Rome, Italy
15 CORESEARCH – Center for Outcomes Research
and Clinical Epidemiology, Via Tiziano Vecellio, 2, 65124 Pescara, Italy
Introduction
Liraglutide is a once-daily human glucagon-like
pep-tide-1 (GLP-1) analogue available for the treatment of
type 2 diabetes (T2D), and its efficacy and safety have
been demonstrated in the Liraglutide Effect and Action
in Diabetes (LEAD) study programme [
1
–
7
]. Liraglutide
has also cardioprotective benefits in patients with T2D at
increased risk of cardiovascular disease [
8
]. Liraglutide
was approved in the EU in 2009, and data from real-world
observational studies have further demonstrated that the
benefits of liraglutide on glycated haemoglobin (HbA
1c)
and body weight loss were consistent with those obtained
in the randomised LEAD trials [
9
]. Long-term studies
indicated that the benefits were sustained for up to 3 years
[
10
,
11
].
Liraglutide has been demonstrated to have benefits
across a diverse spectrum of patients with T2D, but the
extent of HbA
1cimprovement differs within patient groups
having different demographics and clinical characteristics
[
12
]. Thus, there is an unmet need to identify subgroups
of patients with T2D receiving liraglutide who are most
likely to have the greatest response to treatment. This
information would help healthcare providers
individu-alise treatment options and assess cost benefits. Patients
and healthcare professionals could benefit from a more
detailed understanding of factors associated with improved
response to liraglutide.
The ReaL study (ClinicalTrials.gov identifier:
NCT02255266) was the largest observational study of
lira-glutide in Italian clinical practice, showing that 43.5% of
patients achieved HbA
1creduction ≥ 1% (10.9 mmol/mol)
after 12 months of treatment (primary endpoint). This
manuscript reports findings from a secondary analysis
per-formed to identify subgroups or classes of patients with
T2D who were more likely to have an improved response
to liraglutide owing to specific combinations of clinical
and socio-demographic characteristics.
Materials and methods
ReaL was an observational, retrospective, longitudinal,
multicentre study involving 45 Italian diabetes clinics
throughout the country. The design and methods of this
real-world study have been previously reported [
13
].
Briefly, all consecutive patients aged ≥ 18 years
diag-nosed with T2D and receiving their first prescription of
liraglutide in 2011 were eligible for the study. This study
was conducted in accordance with the Declaration of
Helsinki (last amended by 59th WMA General
Assem-bly, Seoul, October 2013) and the Guidelines for Good
Pharmacoepidemiology Practices (ICH-GPP Revision
2, April, 2007). A written informed consent, approved
by an independent ethics committee, was signed by all
patients before data collection. Data on a range of key
clinical variables were obtained from electronic medical
records. Information on fasting plasma glucose (FPG),
body weight, body mass index (BMI), diabetes duration,
presence of diabetes complications, liraglutide treatment,
and treatment with other oral antidiabetic drugs (OADs)
was extracted at the date of the first liraglutide prescription
at baseline in 2011 and after 12 months. The frequency
of patients achieving HbA
1creduction ≥ 1% (10.9 mmol/
mol) after 12 months’ treatment (primary endpoint) was
calculated. This primary endpoint was selected because it
represents a mean effect seen in randomised clinical trials
of liraglutide and is a strong indicator of effectiveness that
is meaningful to both patients and clinicians. It is also in
line with the trend in clinical care to individualise
spe-cific HbA
1ctargets. Information on side effects and adverse
events was not explored, since it was not available in the
electronic medical records in a standardised format.
Statistical analysis
Results are expressed as mean and standard deviation (SD)
for continuous variables, and proportion and percentages for
categorical measures, respectively. Between-group patient
characteristics were compared with a Mann–Whitney U test
or Student’s t test (as appropriate) for continuous variables,
or a Chi-square test for categorical variables. Univariate
logistic regression was used to identify baseline
character-istics of patients who achieved the primary endpoint (HbA
1creduction ≥ 1.0% [10.9 mmol/mol] at 12 months), compared
with those who did not.
Multivariate logistic regression analysis was performed
to identify independent factors associated with the
end-point after adjustment for other variables. Covariates
included in the multivariate analysis were age, sex,
dia-betes duration, baseline HbA
1c, FPG, BMI, presence of
diabetes complications, treatment at the first prescription
of liraglutide (baseline), treatment modality, liraglutide
dose, hypertension, dyslipidaemia, and estimated
glomer-ular filtration rate (eGFR) levels. Standardised criteria
which were used for diagnosis of hypertension were not
established a priori for this study. Data were collected
from electronic medical records, but in the Italian national
guidelines, hypertension and dyslipidaemia cut-offs are
blood pressure (BP) values ≥ 140/90 mmHg and
low-den-sity lipoprotein (LDL)-cholesterol ≥ 100 mg/dl,
respec-tively. Covariates used in the multivariate analysis were
chosen based on clinical judgment and did not depend on
reaching statistical significance in the univariate analysis.
Results are shown as odds ratios (ORs) and 95%
confi-dence intervals (CI).
RECursive Partitioning and AMalgamation (RECPAM)
analysis, a tree-based statistical method that integrates
standard regression and tree-growing techniques, was used
to detect potential interactions among the different variables
in predicting reduction of at least 1% in HbA
1cand
iden-tify homogeneous and distinct subgroups of patients with
increased likelihood of reaching the endpoint [
14
]. In
dia-betes, RECPAM analysis has been previously used to
iden-tify: patients with T2D at risk of microalbuminuria [
15
],
factors associated with impaired quality of life in patients
using continuous subcutaneous insulin infusion [
16
], and
patients at higher risk of cardiovascular disease [
17
]. The
RECPAM analysis was performed using SAS
®(Release 9.4
Cary, NC, USA) and a macro-routine written by F. Pellegrini
and updated by M. Scardapane and G. Lucisano. At each
partitioning step, the RECPAM method automatically chose
the covariate and best binary split to maximise the difference
in risk of experiencing the outcome. The algorithm stopped
when user-defined stopping rules were met. In this case,
each final class was required to have at least 100 patients in
total and 30 patients with the target endpoint.
The set of variables tested in the RECPAM analysis was
the same tested in the multivariate logistic regression
analy-sis. Continuous variables were not categorised so as to allow
the algorithm to choose the natural cut-off points when
iden-tifying distinct subgroups of patients. For each subgroup or
class, the proportions (%) of patients reaching the endpoint
and the likelihood (ORs and 95% CI) to reach the endpoint
versus the reference subgroup were obtained. Finally, to
detect additional global correlates (i.e. variables playing a
role for all patients, irrespective of the interactions detected
by RECPAM), a logistic regression model with
RECPAM-identified subgroups and all the covariates ruled out by the
algorithm was performed. No imputation was used for
miss-ing data, and sensitivity analyses were not performed.
Results
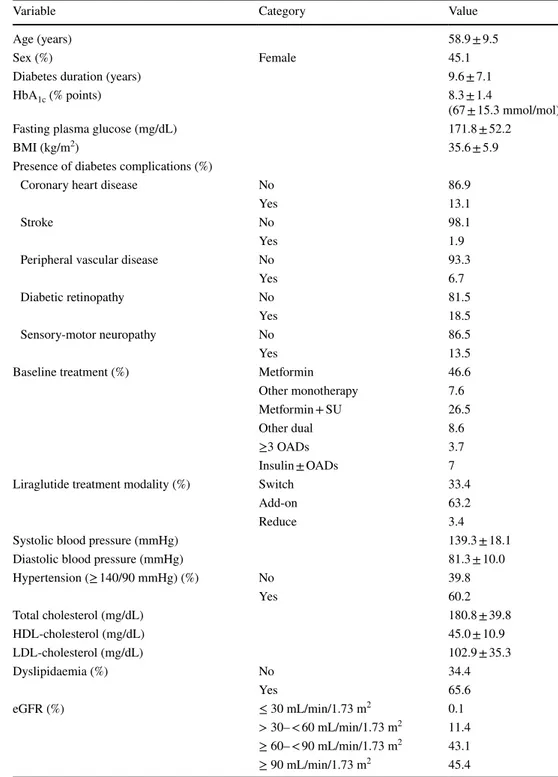
A total of 1723 patients were included in the analysis.
Base-line characteristics, including diabetes complications and
prior treatment regimens, are shown in Table
1
. At
base-line, most patients were being treated with metformin, either
as monotherapy (n = 803, 46.6%) or with sulphonylureas
(n = 457, 26.5%). Few patients (n = 100, 5.8%) received
insu-lin. Most patients received liraglutide as an add-on to
previ-ous therapies (63.2%), with 33.4% replacing another prior
drug with liraglutide, and 3.4% reducing the number of prior
therapies. Mean BMI at baseline was 35.6 ± 5.9 kg/m
2, with
83.3% of patients considered to have obesity (BMI > 30 kg/
m
2).
By 12 months (primary endpoint analysis), a total of
194/1723 (11.2%) patients had discontinued liraglutide
treatment. For those with a known reason (n = 166), most
(n = 75/166) were owing to lack of effectiveness. An
addi-tional 35 discontinued due to liraglutide intolerance, 28
owing to gastrointestinal side effects, and 20 discontinued
for other reasons. A total of 19 patients were non-adherent
to therapy. At 12 months, there were 1325 (76.9%) patients
with HbA
1cvalues available at both baseline and 12 months,
and 577/1325 (43.5%) reached the primary endpoint (HbA
1creduction ≥ 1.0% [10.9 mmol/mol]).
Patients who reached the endpoint had a shorter mean
diabetes duration (9.1 ± 6.9 vs. 10.0 ± 7.0 years, p = 0.04),
higher mean HbA
1cat baseline (9.0 ± 1.4 [75 ± 15.3 mmol/
mol] vs. 7.7 ± 1.0% [61 ± 10.9 mmol/mol], p < 0.0001),
higher mean diastolic BP (82.6 ± 10.0 vs. 80.3 ± 9.8 mmHg,
p = 0.0002) and higher mean total cholesterol levels
(183.1 ± 41.8 vs. 177.2 ± 37.4 mg/dL, p = 0.02) compared
to those who failed to reach the primary endpoint. Mean
BMI was nearly identical in the two groups (35.6 ± 5.8 vs.
35.5 ± 5.8 kg/m
2, p = 0.72), and there were no significant
dif-ferences in mean high-density lipoprotein (HDL)-cholesterol
(p = 0.11) or mean LDL-cholesterol (p = 0.16). There were
no significant differences between the two groups in the
pro-portion of patients using antihypertensive or lipid-lowering
medications or other diabetes treatments at baseline.
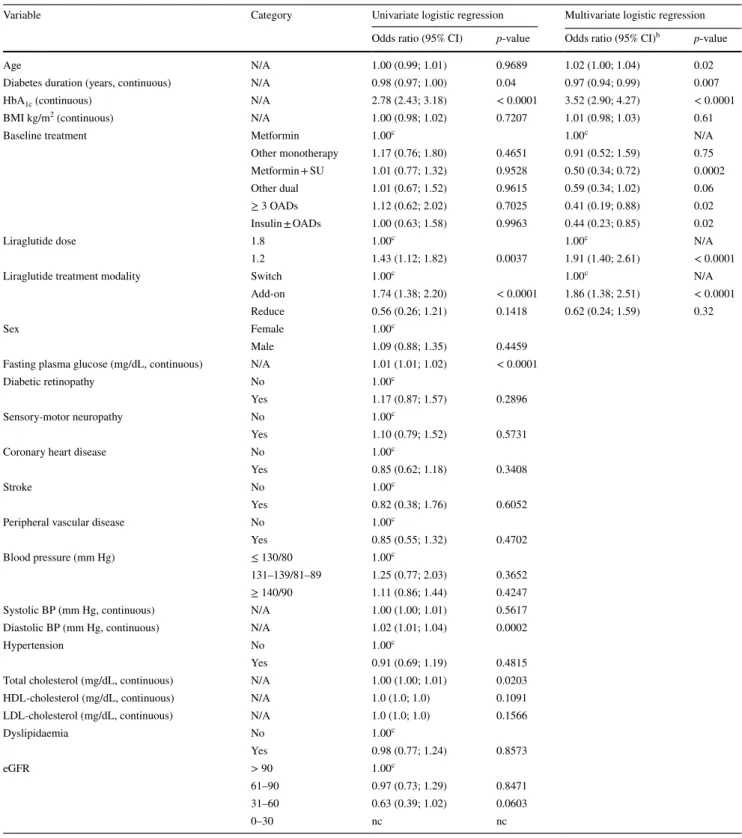
Logistic regression analysis
The odds of achieving the primary endpoint, by patient
char-acteristic, are shown in Table
2
. In the univariate analysis,
higher HbA
1cat baseline was associated with significantly
higher odds (OR 2.78; 95% CI [2.43; 3.18]; p < 0.0001).
Shorter diabetes duration was associated with a significantly
lower odds of reaching the endpoint (OR 0.98; 95% CI [0.97;
1.00]; p = 0.04). Higher diastolic BP (OR 1.02; 95% CI
[1.01; 1.04]; p = 0.0002) and higher total cholesterol (OR
1.00; 95% CI [1.00; 1.01]; p = 0.0203) were also associated
with significantly increased odds of reaching the endpoint.
Other patient characteristics, such as age, sex, BMI,
pres-ence of various diabetes complications, dyslipidaemia or
eGFR levels, were not significantly associated with odds of
reaching the endpoint.
Prior treatment (including insulin) was not significantly
associated with reaching the primary endpoint (p > 0.05).
However, after adjusting for potential confounding in the
multivariate analysis, all prior treatment regimens (except
for other dual therapy, p = 0.06) were associated with a
significantly lower odds of achieving the endpoint
com-pared with metformin monotherapy (Table
2
). Regarding
treatment modality, patients who had liraglutide added
to their prior therapy had a significantly higher odds of
achieving the primary endpoint (OR 1.74 95% CI [1.38;
2.20]; p < 0.0001) compared with patients who switched to
liraglutide from their previous therapy. Those results were
confirmed in the multivariate analysis.
The proportion of patients using liraglutide at higher
doses increased with successive follow-up, with over a third
(36.1%) using 1.8 mg at 12 months compared to 5.3% at
Table 1 Baseline characteristics of 1723 patients with type 2 diabetes prior to starting liraglutide treatment
Values are mean ± SD or %
Add-on, liraglutide added to prior therapy; BMI, body mass Index; eGFR, estimated glomerular filtration rate (using the Chronic Kidney Disease-Epidemiology Collaboration formula); HbA1c, glycated
haemo-globin; HDL, high-density lipoprotein; LDL, low-density lipoprotein; reduce, number of prior OADs was reduced with addition of liraglutide; OAD, oral antidiabetic drug; SU, sulphonylurea; switch, switch to lira-glutide from prior therapy
Variable Category Value
Age (years) 58.9 ± 9.5
Sex (%) Female 45.1
Diabetes duration (years) 9.6 ± 7.1
HbA1c (% points) 8.3 ± 1.4
(67 ± 15.3 mmol/mol)
Fasting plasma glucose (mg/dL) 171.8 ± 52.2
BMI (kg/m2) 35.6 ± 5.9
Presence of diabetes complications (%)
Coronary heart disease No 86.9
Yes 13.1
Stroke No 98.1
Yes 1.9
Peripheral vascular disease No 93.3
Yes 6.7
Diabetic retinopathy No 81.5
Yes 18.5
Sensory-motor neuropathy No 86.5
Yes 13.5
Baseline treatment (%) Metformin 46.6
Other monotherapy 7.6
Metformin + SU 26.5
Other dual 8.6
≥3 OADs 3.7
Insulin ± OADs 7
Liraglutide treatment modality (%) Switch 33.4
Add-on 63.2
Reduce 3.4
Systolic blood pressure (mmHg) 139.3 ± 18.1
Diastolic blood pressure (mmHg) 81.3 ± 10.0
Hypertension (≥ 140/90 mmHg) (%) No 39.8 Yes 60.2 Total cholesterol (mg/dL) 180.8 ± 39.8 HDL-cholesterol (mg/dL) 45.0 ± 10.9 LDL-cholesterol (mg/dL) 102.9 ± 35.3 Dyslipidaemia (%) No 34.4 Yes 65.6 eGFR (%) ≤ 30 mL/min/1.73 m2 0.1 > 30– < 60 mL/min/1.73 m2 11.4 ≥ 60– < 90 mL/min/1.73 m2 43.1 ≥ 90 mL/min/1.73 m2 45.4
Table 2 Univariate and multivariate analysis of factors predicting reduction of HbA1c ≥ 1.0% (10.9 mmol/mol) among 1325 patientsa after
12 months of treatment with liraglutide
Add-on, liraglutide added to prior therapy; BMI, body mass index; BP, blood pressure; CI, confidence interval; eGFR, estimated glomerular filtration rate; HbA1c, glycated haemoglobin; LDL, low-density lipoprotein; N/A, not applicable; nc, not calculated; OAD, oral antidiabetic drug;
reduce, number of prior OADs was reduced with addition of liraglutide; SU, sulphonylurea; switch, switch to liraglutide from prior therapy
a Patients who had HbA
1c data recorded at 12 months b Adjusted for age, sex, duration of diabetes, baseline HbA
1c, FPG, BMI, presence of diabetes complications, hypertension, dyslipidaemia, eGFR
levels, treatment scheme at the first prescription of liraglutide, treatment modality, and liraglutide dosage
c Reference category
Variable Category Univariate logistic regression Multivariate logistic regression Odds ratio (95% CI) p-value Odds ratio (95% CI)b p-value
Age N/A 1.00 (0.99; 1.01) 0.9689 1.02 (1.00; 1.04) 0.02 Diabetes duration (years, continuous) N/A 0.98 (0.97; 1.00) 0.04 0.97 (0.94; 0.99) 0.007 HbA1c (continuous) N/A 2.78 (2.43; 3.18) < 0.0001 3.52 (2.90; 4.27) < 0.0001
BMI kg/m2 (continuous) N/A 1.00 (0.98; 1.02) 0.7207 1.01 (0.98; 1.03) 0.61
Baseline treatment Metformin 1.00c 1.00c N/A
Other monotherapy 1.17 (0.76; 1.80) 0.4651 0.91 (0.52; 1.59) 0.75 Metformin + SU 1.01 (0.77; 1.32) 0.9528 0.50 (0.34; 0.72) 0.0002 Other dual 1.01 (0.67; 1.52) 0.9615 0.59 (0.34; 1.02) 0.06 ≥ 3 OADs 1.12 (0.62; 2.02) 0.7025 0.41 (0.19; 0.88) 0.02 Insulin ± OADs 1.00 (0.63; 1.58) 0.9963 0.44 (0.23; 0.85) 0.02 Liraglutide dose 1.8 1.00c 1.00c N/A
1.2 1.43 (1.12; 1.82) 0.0037 1.91 (1.40; 2.61) < 0.0001 Liraglutide treatment modality Switch 1.00c 1.00c N/A
Add-on 1.74 (1.38; 2.20) < 0.0001 1.86 (1.38; 2.51) < 0.0001 Reduce 0.56 (0.26; 1.21) 0.1418 0.62 (0.24; 1.59) 0.32 Sex Female 1.00c
Male 1.09 (0.88; 1.35) 0.4459 Fasting plasma glucose (mg/dL, continuous) N/A 1.01 (1.01; 1.02) < 0.0001 Diabetic retinopathy No 1.00c
Yes 1.17 (0.87; 1.57) 0.2896 Sensory-motor neuropathy No 1.00c
Yes 1.10 (0.79; 1.52) 0.5731 Coronary heart disease No 1.00c
Yes 0.85 (0.62; 1.18) 0.3408 Stroke No 1.00c
Yes 0.82 (0.38; 1.76) 0.6052 Peripheral vascular disease No 1.00c
Yes 0.85 (0.55; 1.32) 0.4702 Blood pressure (mm Hg) ≤ 130/80 1.00c
131–139/81–89 1.25 (0.77; 2.03) 0.3652 ≥ 140/90 1.11 (0.86; 1.44) 0.4247 Systolic BP (mm Hg, continuous) N/A 1.00 (1.00; 1.01) 0.5617 Diastolic BP (mm Hg, continuous) N/A 1.02 (1.01; 1.04) 0.0002 Hypertension No 1.00c
Yes 0.91 (0.69; 1.19) 0.4815 Total cholesterol (mg/dL, continuous) N/A 1.00 (1.00; 1.01) 0.0203 HDL-cholesterol (mg/dL, continuous) N/A 1.0 (1.0; 1.0) 0.1091 LDL-cholesterol (mg/dL, continuous) N/A 1.0 (1.0; 1.0) 0.1566 Dyslipidaemia No 1.00c Yes 0.98 (0.77; 1.24) 0.8573 eGFR > 90 1.00c 61–90 0.97 (0.73; 1.29) 0.8471 31–60 0.63 (0.39; 1.02) 0.0603 0–30 nc nc
baseline. Patients using liraglutide 1.2 mg had an increased
odds (OR 1.43; 95% CI [1.12; 1.82]; p = 0.0037) of
reach-ing the endpoint compared to those usreach-ing the highest dose
(1.8 mg).
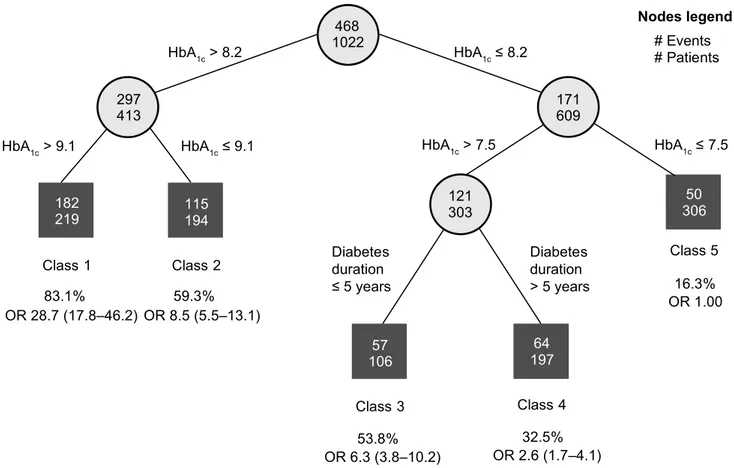
RECPAM analysis
The RECPAM analysis identified five distinct patient
sub-groups or classes with increasing odds of achieving an
HbA
1creduction ≥ 1.0% (10.9 mmol/mol) after 12 months
(Fig.
1
, Table
3
). The proportion of patients reaching the
endpoint ranged from 16.3% (reference group) to 83.1%.
The splitting variables indicated that baseline HbA
1cand,
to some extent, diabetes duration were the primary
driv-ers of degree of response to liraglutide, whereas other
patient-related factors were not identified as important in
discriminating responder subgroups. With patients
hav-ing baseline HbA
1c≤ 7.5% (58 mmol/mol) considered
the reference class (OR = 1.00), the odds of patients in
the other classes achieving the endpoint were: Class 4:
OR 2.6; 95% CI [1.7; 4.1], patients with HbA
1cbetween
7.5% (58 mmol/mol) and 8.2% (66 mmol/mol), diabetes
duration > 5 years; Class 3: OR 6.3; 95% CI [3.8; 10.2],
HbA
1cbetween 7.5% (58 mmol/mol) and 8.2% (66 mmol/
mol), diabetes duration < 5 years; Class 2: OR 8.5; 95%
CI [5.5; 13.1], HbA
1cbetween 8.2% (66 mmol/mol) and
9.1% (76 mmol/mol); and Class 1: OR 28.7; 95% CI [17.8;
46.2], HbA
1c> 9.1%.
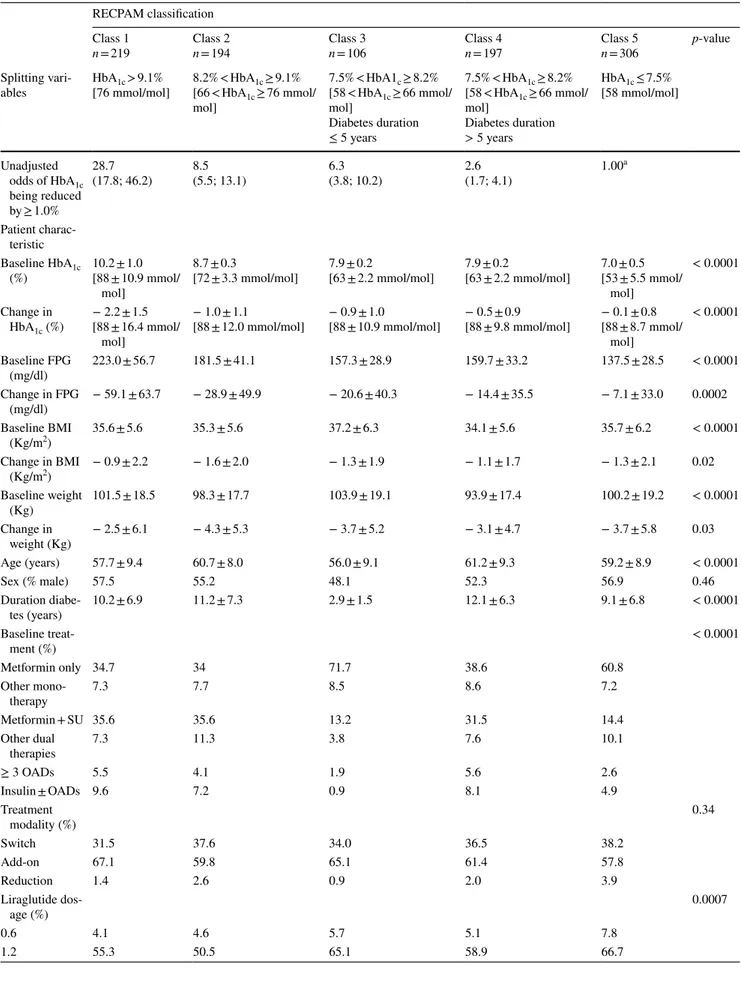
Although all RECPAM classes showed HbA
1creduction,
the patient subgroup with the greatest odds of achieving an
HbA
1creduction ≥ 1.0% (10.9 mmol/mol) can be described
as having the following: mean HbA
1cof 10.2% (88 mmol/
mol), mean FPG of 223.0 mg/dL, mean diabetes duration
of 10.2 years at baseline, metformin treatment ±
sulphony-lureas at initiation of liraglutide treatment, and liraglutide
as an adjunct to prior therapy (versus discontinuation of
prior treatment) (Table
3
). Each RECPAM class showed a
reduction in mean weight, ranging from 2.5 to 4.3 kg, after
468
1022
297
413
171
609
HbA
1c> 8.2
HbA
1c≤ 8.2
182
219
HbA
1c> 9.1
HbA
1c≤ 9.1
115
194
HbA
1c>
7
.
5
H
b
A
1c≤ 7.5
50
306
57
106
197
64
Diabetes
duration
≤ 5 years
Diabetes
duration
> 5 years
Class 5
16.3%
OR 1.00
53.8%
Class 1
83.1%
OR 28.7 (17.8–46.2) OR 8.5 (5.5–13.1)
OR 6.3 (3.8–10.2)
OR 2.6 (1.7–4.1)
32.5%
Class 2
Class 3
Class 4
59.3%
Nodes legend
# Events
# Patients
121
303
Fig. 1 Subgroups of patients with type 2 diabetes with different odds of achieving a HbA1c reduction ≥ 1.0% (10.9 mmo/mol) after
12 months of treatment with liraglutide, identified using RECPAM analysis. The tree-growing algorithm modelled the odds for achiev-ing HbA1c reduction ≥ 1.0%-point using multivariate logistic
regres-sion. Splitting variables were automatically selected by the RECPAM routine among the covariates used in the multivariate analysis and are shown between branches. Cut-offs sending patients to the left or
right sibling were also automatically chosen by the RECPAM routine and are reported on the relative branches. %, proportion of patients in subgroup achieving a reduction in HbA1c ≥ 1.0% (10.9 mmol/mol);
circles indicate subgroups of patients and squares indicate final REC-PAM classes. Numbers inside circles and squares indicate number of patients achieving HbA1c reduction ≥ 1.0% (10.9 mmol/mol). HbA1c,
glycated haemoglobin; OR, unadjusted odds ratio (95% confidence interval); RECPAM, RECursive Partitioning and AMalgamation
Table 3 Clinical characteristics, at baseline and after 12 months of treatment with liraglutide, by RECPAM class RECPAM classification
Class 1
n = 219 Class 2n = 194 Class 3n = 106 Class 4n = 197 Class 5n = 306 p-value
Splitting
vari-ables HbA[76 mmol/mol]1c > 9.1% 8.2% < HbA[66 < HbA1c1c ≥ 76 mmol/ ≥ 9.1%
mol] 7.5% < HbA1c ≥ 8.2% [58 < HbA1c ≥ 66 mmol/ mol] Diabetes duration ≤ 5 years 7.5% < HbA1c ≥ 8.2% [58 < HbA1c ≥ 66 mmol/ mol] Diabetes duration > 5 years HbA1c ≤ 7.5% [58 mmol/mol] Unadjusted odds of HbA1c being reduced by ≥ 1.0% 28.7 (17.8; 46.2) 8.5(5.5; 13.1) 6.3(3.8; 10.2) 2.6(1.7; 4.1) 1.00 a Patient charac-teristic Baseline HbA1c (%) 10.2 ± 1.0[88 ± 10.9 mmol/ mol] 8.7 ± 0.3
[72 ± 3.3 mmol/mol] 7.9 ± 0.2[63 ± 2.2 mmol/mol] 7.9 ± 0.2[63 ± 2.2 mmol/mol] 7.0 ± 0.5[53 ± 5.5 mmol/ mol] < 0.0001 Change in HbA1c (%) − 2.2 ± 1.5 [88 ± 16.4 mmol/ mol] − 1.0 ± 1.1
[88 ± 12.0 mmol/mol] − 0.9 ± 1.0[88 ± 10.9 mmol/mol] − 0.5 ± 0.9[88 ± 9.8 mmol/mol] − 0.1 ± 0.8[88 ± 8.7 mmol/ mol] < 0.0001 Baseline FPG (mg/dl) 223.0 ± 56.7 181.5 ± 41.1 157.3 ± 28.9 159.7 ± 33.2 137.5 ± 28.5 < 0.0001 Change in FPG (mg/dl) − 59.1 ± 63.7 − 28.9 ± 49.9 − 20.6 ± 40.3 − 14.4 ± 35.5 − 7.1 ± 33.0 0.0002 Baseline BMI (Kg/m2) 35.6 ± 5.6 35.3 ± 5.6 37.2 ± 6.3 34.1 ± 5.6 35.7 ± 6.2 < 0.0001 Change in BMI (Kg/m2) − 0.9 ± 2.2 − 1.6 ± 2.0 − 1.3 ± 1.9 − 1.1 ± 1.7 − 1.3 ± 2.1 0.02 Baseline weight (Kg) 101.5 ± 18.5 98.3 ± 17.7 103.9 ± 19.1 93.9 ± 17.4 100.2 ± 19.2 < 0.0001 Change in weight (Kg) − 2.5 ± 6.1 − 4.3 ± 5.3 − 3.7 ± 5.2 − 3.1 ± 4.7 − 3.7 ± 5.8 0.03 Age (years) 57.7 ± 9.4 60.7 ± 8.0 56.0 ± 9.1 61.2 ± 9.3 59.2 ± 8.9 < 0.0001 Sex (% male) 57.5 55.2 48.1 52.3 56.9 0.46 Duration diabe-tes (years) 10.2 ± 6.9 11.2 ± 7.3 2.9 ± 1.5 12.1 ± 6.3 9.1 ± 6.8 < 0.0001 Baseline treat-ment (%) < 0.0001 Metformin only 34.7 34 71.7 38.6 60.8 Other mono-therapy 7.3 7.7 8.5 8.6 7.2 Metformin + SU 35.6 35.6 13.2 31.5 14.4 Other dual therapies 7.3 11.3 3.8 7.6 10.1 ≥ 3 OADs 5.5 4.1 1.9 5.6 2.6 Insulin ± OADs 9.6 7.2 0.9 8.1 4.9 Treatment modality (%) 0.34 Switch 31.5 37.6 34.0 36.5 38.2 Add-on 67.1 59.8 65.1 61.4 57.8 Reduction 1.4 2.6 0.9 2.0 3.9 Liraglutide dos-age (%) 0.0007 0.6 4.1 4.6 5.7 5.1 7.8 1.2 55.3 50.5 65.1 58.9 66.7
12 months’ treatment with liraglutide. There was no
obvi-ous relationship between mean HbA
1creduction and mean
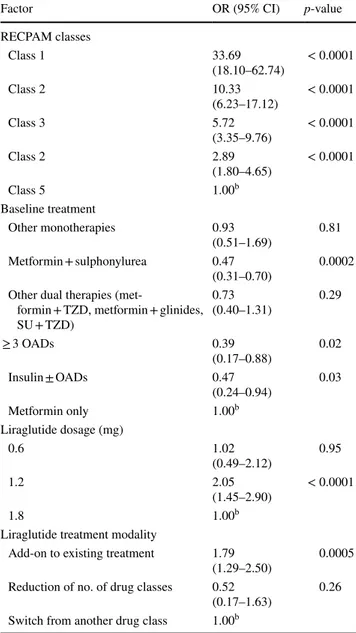
weight loss. A final logistic model adjusted with other
covar-iates deemed clinically important and with RECPAM classes
forced into the model is shown in Table
4
. The final logistic
model with both the RECPAM classes and the covariates not
entering the tree forced in the model (Table
4
) showed that
additional global variables associated with the likelihood
of reaching the endpoint were baseline treatment scheme,
liraglutide dosage and treatment modality.
Discussion
This is the first RECPAM analysis to identify distinct
groups of patients with T2D who were prescribed
liraglu-tide in routine clinical practice according to their predicted
degree of response to liraglutide treatment. These data can
improve clinical practice by providing a deeper knowledge
of factors influencing liraglutide’s impact on metabolic
control. The key message of this analysis is that only
base-line HbA
1cand to a lesser extent diabetes duration were
Table 3 (continued)
RECPAM classification Class 1
n = 219 Class 2n = 194 Class 3n = 106 Class 4n = 197 Class 5n = 306 p-value
Splitting
vari-ables HbA[76 mmol/mol]1c > 9.1% 8.2% < HbA[66 < HbA1c1c ≥ 76 mmol/ ≥ 9.1%
mol] 7.5% < HbA1c ≥ 8.2% [58 < HbA1c ≥ 66 mmol/ mol] Diabetes duration ≤ 5 years 7.5% < HbA1c ≥ 8.2% [58 < HbA1c ≥ 66 mmol/ mol] Diabetes duration > 5 years HbA1c ≤ 7.5% [58 mmol/mol] 1.8 40.6 44.8 29.2 36.0 25.5 Baseline SBP (mmHg) 142.0 ± 18.4 140.3 ± 16.6 138.0 ± 17.9 140.3 ± 18.7 137.4 ± 16.8 0.09 Change in SBP (mmHg) − 4.2 ± 18.5 − 2.6 ± 16.7 − 4.4 ± 16.0 − 6.3 ± 19.2 − 5.4 ± 17.6 0.57 Baseline DBP (mmHg) 83.5 ± 10.6 81.2 ± 9.4 81.7 ± 10.1 81.0 ± 9.6 80.0 ± 10.0 0.02 Change in DBP (mmHg) − 1.8 ± 11.2 − 0.6 ± 9.6 − 1.0 ± 10.6 − 2.4 ± 11.0 − 1.7 ± 11.1 0.60 Baseline total cholesterol (mg/dl) 187.9 ± 43.6 181.5 ± 36.3 185.2 ± 38.1 175.2 ± 34.9 174.8 ± 38.0 0.007 Change in total cholesterol (mg/dl) − 16.2 ± 40.1 − 9.8 ± 32.3 − 19.9 ± 39.6 − 7.2 ± 34.7 − 7.1 ± 31.0 0.06 Baseline HDL-cholesterol (mg/dl) 42.9 ± 9.5 45.2 ± 11.5 43.5 ± 10.9 46.5 ± 12.0 44.7 ± 10.4 0.07 Change in HDL-choles-terol (mg/dl) 0.6 ± 7.1 1.6 ± 8.3 1.6 ± 7.5 1.8 ± 8.2 0.9 ± 7.9 0.42 Baseline LDL-cholesterol (mg/dl) 104.2 ± 38.8 104.4 ± 30.7 108.5 ± 36.2 96.9 ± 32.1 101.1 ± 32.8 0.13 Change in LDL-choles-terol (mg/dl) − 9.4 ± 35.7 − 10.8 ± 30.9 − 20.4 ± 36.2 − 7.3 ± 31.8 − 8.7 ± 30.6 0.15 Baseline triglycerides (mg/dl) 211.6 ± 120.0 169.6 ± 80.1 182.9 ± 81.8 163.7 ± 77.9 150.8 ± 75.6 <0.0001 Change in triglycerides − 35.4 ± 110.2 − 7.3 ± 85.8 − 16.6 ± 82.2 − 11.4 ± 64.6 − 0.4 ± 60.8 0.002
predictive of liraglutide effectiveness. Furthermore, these
results for the first time clarify that HbA
1creduction can
exceed 2.0% when baseline levels are > 9.0%. This finding
has important clinical and health policy implications for
the Italian Drugs Agency (AIFA) regulations,
consider-ing that patients with HbA
1c≥ 8.5% are currently excluded
from the GLP-1 receptor agonists’ reimbursement policy,
which requires HbA
1cbetween 7.5 (58 mmol/mol) and
8.5% (69 mmol/mol) (AIFA regulations).
Different patterns have been reported in clinical trials
with regard to dose response with liraglutide. In this study,
patients using the 1.2-mg liraglutide dose as maintenance
dose were more likely to reach the primary endpoint than
those using the higher maintenance dose (1.8 mg). This is
likely due to an indication bias because patients struggling
to achieve good glycaemic control were up-titrated to the
higher dose, but owing to their disease severity, they still did
not respond as well as healthier patients who did not require
an increased dose. Escalation from the starting liraglutide
dose of 0.6–1.2 mg likely occurred earlier after initiation,
whereas when escalation to 1.8 mg occurred, it tended to be
later in the study.
In line with existing findings [
18
–
20
], we found that the
higher the baseline HbA
1clevel, the higher the reduction
achieved. Multivariate analysis showed that the likelihood
of reaching the endpoint increased by 3.5 times for every
1% HbA
1cincrease at baseline. In addition, by applying the
RECPAM analysis, the study showed that the likelihood of
reaching the endpoint was 28 times higher with baseline
HbA
1c> 9.1% as compared to baseline levels < 7.5%. In
the EVIDENCE study [
21
], conducted in France by
gen-eral practitioners and specialists, on 2029 patients, there
was a mean (± SD) HbA
1creduction from baseline of
1.01 ± 1.54% (from 8.46 ± 1.46 to 7.44% ± 1.20; p < 0.0001);
after 2 years, 29.9% (95% CI 27.7; 31.2) of patients still had
HbA
1c≤ 7.0%; in the cohort treated within specialist care
settings (N = 1398), HbA
1creduction was − 0.8%.
In the current study, although there were differences in the
degree of liraglutide response, each RECPAM class showed
decreases in HbA
1cfrom baseline after 12 months of
treat-ment. As might be expected, a greater proportion of patients
with the poorest glycaemic control at baseline achieved the
primary endpoint of HbA
1creduction ≥ 1.0% (10.9 mmol/
mol) after 12 months, since it would be incrementally more
difficult to achieve that degree of absolute HbA
1creduction
in patients already at or near glycaemic targets.
Neverthe-less, these results suggest that there is a distinct subgroup
of patients for whom liraglutide treatment can help achieve
HbA
1creductions in excess of 2.0% (21.9 mmol/mol), a
find-ing that may have important clinical implications.
The RECPAM algorithm selected only baseline HbA
1cand diabetes duration as important splitting variables
when creating the responder subgroups or classes. This
indicated that other patient variables were less important
Table 3 (continued)
RECPAM classification Class 1
n = 219 Class 2n = 194 Class 3n = 106 Class 4n = 197 Class 5n = 306 p-value
Splitting
vari-ables HbA[76 mmol/mol]1c > 9.1% 8.2% < HbA[66 < HbA1c1c ≥ 76 mmol/ ≥ 9.1%
mol] 7.5% < HbA1c ≥ 8.2% [58 < HbA1c ≥ 66 mmol/ mol] Diabetes duration ≤ 5 years 7.5% < HbA1c ≥ 8.2% [58 < HbA1c ≥ 66 mmol/ mol] Diabetes duration > 5 years HbA1c ≤ 7.5% [58 mmol/mol] Baseline albuminuria (mg/l) 73.7 ± 150.3 39.0 ± 92.0 37.2 ± 55.7 40.6 ± 64.9 38.0 ± 84.1 0.07 Change in albuminuria (mg/l) − 20.0 ± 119.2 0.6 ± 58.6 − 1.2 ± 43.3 − 15.2 ± 75.6 − 13.2 ± 89.7 0.91 Baseline eGFR (%) 0.16 0–60 5.5 8.2 2.8 7.6 8.2 61–90 62.1 57.2 68.9 64.5 55.2 > 90 32.4 34.5 28.3 27.9 36.6
Values are mean ± SD unless otherwise stated
BMI, body mass index; DBP, diastolic blood pressure; FPG, fasting plasma glucose; HbA1c, glycated haemoglobin; HDL, high-density
lipopro-tein; LDL, low-density lipoprolipopro-tein; n, number of subjects in class; OAD, oral antidiabetic drug; RECPAM, RECursive Partitioning and AMalga-mation; SBP, systolic blood pressure; SU, sulphonylurea
in determining the degree of response to liraglutide.
Although BMI was not selected by the algorithm, this
too may be because of the high prevalence of obesity in
the sample.
Multivariate logistic regression with RECPAM
catego-ries forced into the model further confirmed that
liraglu-tide is best used as an add-on to, rather than replacement
for, prior treatment regimens (generally OADs) in T2D
(OR 1.79; 95% CI [1.29; 2.50]). This finding is in line with
current treatment guidelines [
22
]. Interestingly, the largest
patient subgroup (n = 306, RECPAM Class 5) (Table
3
)
had comparatively good HbA
1ccontrol (≤ 7.5% [58 mmol/
mol]), suggesting that there is also a patient subgroup who
may initiate liraglutide to pair the glycaemic control to
weight loss.
Regarding the role of diabetes duration, a previous study
on liraglutide reported a higher efficacy in patients with
short diabetes duration [
12
], while the ReaL study [
13
]
found improvements in metabolic control also in patients
with long diabetes duration. RECPAM analysis clarifies that
diabetes duration can play a role mainly for patients with
HbA
1clevels between 7.5 and 8.2%; in particular, one in
two patients with diabetes duration ≤ 5 years reached the
endpoint, compared to one in three for a diabetes
dura-tion > 5 years. The role of BMI and previous therapy as
independent predictors emerging in other studies [
19
,
23
]
was not confirmed in our study.
A strength of this study was the large sample size. Use
of real-world data also makes the findings more
generalis-able to patient populations seen in regular clinical practice.
The observational nature of the study may introduce bias
in the selection of patients who were prescribed
liraglu-tide; however, consecutive enrolment of all patients was
adopted to minimise this. Since these results reflect the
clinical usage of liraglutide in Italy, they may not be
gen-eralisable to countries with different usage patterns. As a
retrospective study based on electronic medical records,
the completeness of information depended on the ability
of participating centres to record clinical data. It should
be noted that data completeness was judged satisfactory
(i.e. 97.2–56.3% complete for the adjustment variables
used). Insulin secretion capacity was not evaluated as a
potential predictor of HbA
1creduction with liraglutide,
although several studies have suggested the usefulness of
this parameter in predicting the effectiveness of liraglutide
[
24
,
25
]. This would be useful to explore in future
stud-ies. We cannot exclude the involvement of other factors,
besides HbA
1cand partly diabetes duration, in determining
HbA
1creduction through liraglutide, but we analysed all
factors easily available to diabetologists to guide routine
clinical practice.
In conclusion, in this study, glycaemic response to
lira-glutide was largely driven by baseline HbA
1clevels and to
a lesser extent by diabetes duration. The clinical benefit
seems to be maximised when used as an add-on to prior
therapies. All RECPAM classes showed weight loss, which
appeared independent of mean HbA
1creduction. RECPAM
analyses suggest an urgent need to revise the AIFA criteria
for reimbursement due to the finding that HbA
1creduction
can exceed 2.0% in people with HbA
1c> 9.0%.
Table 4 Final logistic modela showing key factors predicting
reduc-tion of HbA1c ≥ 1.0% [10.9 mmol/mol] among 1325 patients after
12 months of treatment with liraglutide, with RECPAM classes forced in the model
BMI, body mass index; CI, confidence interval; eGFR, estimated glo-merular filtration rate; FPG, fasting plasma glucose; HbA1c, glycated
haemoglobin; OAD, oral antidiabetic drug; OR, odds ratio; SU, sul-phonylurea; TZD, thiazolidinedione
a Model was adjusted for age, sex, FPG, BMI, presence of diabetes
complications, hypertension, dyslipidaemia, and eGFR levels
b Reference category
Factor OR (95% CI) p-value
RECPAM classes Class 1 33.69 (18.10–62.74) < 0.0001 Class 2 10.33 (6.23–17.12) < 0.0001 Class 3 5.72 (3.35–9.76) < 0.0001 Class 2 2.89 (1.80–4.65) < 0.0001 Class 5 1.00b Baseline treatment Other monotherapies 0.93 (0.51–1.69) 0.81 Metformin + sulphonylurea 0.47 (0.31–0.70) 0.0002
Other dual therapies
(met-formin + TZD, met(met-formin + glinides, SU + TZD) 0.73 (0.40–1.31) 0.29 ≥ 3 OADs 0.39 (0.17–0.88) 0.02 Insulin ± OADs 0.47 (0.24–0.94) 0.03 Metformin only 1.00b Liraglutide dosage (mg) 0.6 1.02 (0.49–2.12) 0.95 1.2 2.05 (1.45–2.90) < 0.0001 1.8 1.00b
Liraglutide treatment modality
Add-on to existing treatment 1.79
(1.29–2.50) 0.0005
Reduction of no. of drug classes 0.52
(0.17–1.63) 0.26
Acknowledgements It is with regret that we announce the death of co-author Dr M. Boemi, to whom this article is dedicated. He par-ticipated actively in the drafting and approved the final version of this manuscript. The authors thank Antonio Nicolucci, Michele Sacco and Marco Scardapane (CORESEARCH – Center for Outcomes Research and Clinical Epidemiology, Pescara, Italy) for data management, data analysis, and assistance with manuscript preparation. We thank Cris-tiano Bette, Margit Kaltoft and Elena Startseva (Novo Nordisk), for their review and input to the manuscript. Medical writing assistance and editorial/submission support were provided by Gary Patronek and Izabel James, of Watermeadow Medical, an Ashfield Company, part of UDG Healthcare plc, funded by Novo Nordisk A/S. This study was funded by Novo Nordisk A/S. The datasets generated during and/or analysed during the current study are available from the corresponding author on reasonable request.
*ReaL Study Group Expert board and writing committee: Natalino Simioni1, Cesare Berra2, Massimo Boemi3, Antonio Carlo Bossi4,
Riccardo Candido5, Graziano Di Cianni6, Simona Frontoni7, Stefano
Genovese8, Paola Ponzani9, Vincenzo Provenzano10, Giuseppina
Russo11, Luigi Sciangula12, Annunziata Lapolla13, Cristiano Bette14,
Maria Chiara Rossi15 on behalf of the ReaL (NN2211-4118) Study
Group*
1Presidio Ospedaliero di Cittadella, Cittadella, Padua, Italy, 2Humanitas Research Hospital, Rozzano (MI), Italy, 3IRCCS INRCA,
Ancona, Italy, 4Ospedale Treviglio Caravaggio, Treviglio, Italy, 5Ass 1 Triestina, Trieste, Italy, 6Ospedale di Livorno, Livorno, Italy, 7University of Rome Tor Vergata, Rome, Italy, 8Centro Cardiologico
Monzino, Milan, Milan, Italy, 9Ospedale La Colletta, ASL3 Genovese,
Arenzano, Italy, 10Centro Regionale di Riferimento Diabetologia ed
Impianto Microinfusori Sicilia, Partinico, Palermo, Italy, 11University
of Messina, Messina, Italy, 12IRCCS Multimedica - Ospedale di
Castel-lanza, Varese, Italy, 13University of Padua, Padua, Italy 14Novo Nordisk
Spa, Rome, Italy, 15CORESEARCH – Center for Outcomes Research
and Clinical Epidemiology, Pescara, Italy.
Investigators: Riccardo Fornengo, Ospedale Civile Chivasso (Torino); Antonio Carlo Bossi, Ospedale Treviglio (Caravaggio), Fab-rizio Querci, Ospedale Pesenti Fenaroli (Alzano Lombardo); Paolo Desenzani, Spedali Civili di Brescia (Montichiari); Luigi Sciangula, Diabetologia Presidio Polispecialistico di Mariano Comense ASST Lariana, Como; Stefano Genovese, IRCCS Multimedica (Milano), Piermarco Piatti, IRCCS (Milano); Enrica Chebat, Ospedale Luigi Sacco (Milano); Cesare Celeste Berra, Humanitas Clinical and Research Center, Rozzano (MI); Paolo Erpoli, Ospedale Sant’Antonio Abate (Milano); Bruno Fattor, Ospedale Generale Regionale (Bolzano), Sandro Inchiostro, Ospedale San Lorenzo (Trento); Alberto Marangoni, Presidio Ospedaliero di Bassano Del Grappa (Vicenza); Loris Con-fortin, Presidio Ospedaliero Di Castelfranco Veneto (Treviso); Anna Coracina, Presidio Ospedaliero Di Montebelluna (Treviso); Carmela Vinci, Presidio Ospedaliero di San Dona’ Di Piave (Venezia); Natalino Simioni, Presidio Ospedaliero di Cittadella (Padova), Annunziata Lapolla, Complesso Ospedaliero Dei Colli (Padova); Riccardo Can-dido, ASS 1 Triestina (Trieste); Giuseppe Felace, Ospedale S Giovanni Dei Battuti (Udine); Paola Ponzani, Ospedale La Colletta dii Aren-zano (Genova); Marcello Monesi, Ospedale Sant’Anna Di Cona (Fer-rara); Francesca Pellicano, Ospedale S Maria Delle Croci (Ravenna); Fabio Baccetti, Ospedale Ss Giacomo e Cristoforo (Massa Carrara); Michele Di Carlo, Ospedale Civile Campo Di Marte (Lucca); Graziano Di Cianni, Ospedale Di Livorno (Livorno); Massimo Boemi, IRCCS INRCA (Ancona); Simona Frontoni, University of Rome Tor Ver-gata (Roma); Sergio Leotta, Ospedale Sandro Pertini (Roma); Davide Lauro, Policlinico Tor Vergata (Roma); Claudio Ventura, Ospedale Israelitico (Roma); Dario Pitocco, Policlinico A. Gemelli (Roma); Franco Tuccinardi, Ospedale Monsignor Diliegro (Latina); Gaetano Leto, Ospedale Regionale S. Maria Goretti (Latina); Pasquale Alfidi,
Ospedale SS Filippo Nicola (Avezzano); Ercole D’Ugo, ASL 2 Lan-ciano Vasto Chieti (Vasto); Stefania Donatelli, ASL 2 LanLan-ciano Vasto Chieti (Chieti); Ercole Memoli, ASL Avellino (Avellino); Damiano Gullo, Ospedale Nuovo Garibaldi (Catania); Giuseppina Russo, Poli-clinico G Martino (Messina); Manfredi Rizzo, PoliPoli-clinico Universita P. Giaccone (Palermo); Vincenzo Provenzano, Ospedale Civile Di Par-tinico (Palermo); Giuseppe Mattina, ASP Palermo (Palermo); Mario Rizzo, Ospedale Buccheri La Ferla (Palermo).
Other responsible parties: Contract research organisation (CRO) responsible for the submissions to Independent Ethics Committees (IECs), study closure procedures, creation and delivery of study files: TFS People S.r.l - Via Lucrezio Caro 63, 00193, Rome, Italy (Simona Foglietta). CRO responsible for data management: Istituto di Ricerche Farmacologiche Mario Negri - Via Giuseppe La Masa 19, 20156, Milan, Italy (Roberto Latini). CRO responsible for statistical analysis and medical writing: CORESEARCH – Center for Outcomes Research and clinical Epidemiology - S.r.l.Via Tiziano Vecellio 2, 65124, Pes-cara, Italy (Antonio Nicolucci, Maria Chiara Rossi, Michele Sacco, Marco Scardapane).
Compliance with ethical standards
Conflict of interest Simioni N: Consulting fees from Novo Nordisk, Lilly, Boehringer Ingelheim and Abbott; member of advisory boards for Novo Nordisk, Lilly and Boehringer Ingelheim; investigator in clin-ical trials sponsored by Novo Nordisk. Berra C: consulting fees from Novo Nordisk, Lilly, Boehringer Ingelheim, Sanofi, Johnson & Johnson and Bayer; research support from AstraZeneca and Takeda; member of advisory boards for Novo Nordisk, Lilly, Boehringer Ingelheim, Astra-Zeneca and Sanofi; investigator in clinical trials sponsored by Lilly and Sanofi. Boemi M: member of advisory boards for Lilly, Boehringer Ingelheim and Sanofi; investigator in clinical trials sponsored by Novo Nordisk, Boehringer Ingelheim and Merck SD. Bossi AC: investigator in clinical trials sponsored by Novo Nordisk, Artsana, Lilly, Bayer and Sanofi; consulting fees from AstraZeneca, Roche, Johnson & Johnson and Takeda; research support from Merck SD and Sigma-Tau; mem-ber of advisory board for Boehringer Ingelheim. Candido R: investi-gator in clinical trials sponsored by Novo Nordisk, Lilly and Merck SD; consulting fees from AstraZeneca, Roche and Johnson & Johnson; member of advisory board for Boehringer Ingelheim. Di Cianni G: investigator in clinical trials sponsored by Novo Nordisk, AstraZeneca and Sanofi; member of advisory boards for Lilly and Sanofi. Frontoni S: member of advisory boards for Novo Nordisk, Lilly, AstraZeneca, Johnson & Johnson, Takeda and Sigma-Tau; investigator in clinical tri-als sponsored by Novo Nordisk and Boehringer Ingelheim. Genovese S: consulting fees from Novo Nordisk, Lilly, Boehringer Ingelheim, AstraZeneca, Merck SD, Sanofi, Johnson & Johnson, Takeda, Abbott Diabetes Care, Bristol Myers & Squibb, Janssen, Lifescan, Menarini and Novartis; member of advisory boards for Novo Nordisk, Boehring-er Ingelheim, AstraZeneca, MBoehring-erck SD, Sanofi, Johnson & Johnson, Takeda, Abbott Diabetes Care, Bruno Farmaceutici, Janssen, Lifescan and Novartis; research support from Novartis; investigator in clinical trials sponsored by Novo Nordisk, Lilly, Boehringer Ingelheim, As-traZeneca, Merck SD, Takeda, Janssen, Novartis and Sanofi. Ponzani P: investigator in clinical trials sponsored by Boehringer Ingelheim, Sanofi, Johnson & Johnson, Bayer and Novartis; member of advisory boards for Novo Nordisk and AstraZeneca. Provenzano V: consulting fees from Novo Nordisk, Lilly, Boehringer Ingelheim, AstraZeneca, Merck SD, Sanofi and Takeda; member of advisory boards for Novo Nordisk, Lilly, Boehringer Ingelheim, AstraZeneca and Sanofi; inves-tigator in clinical trials sponsored by Novo Nordisk, Lilly, Boehringer Ingelheim, AstraZeneca, Merck SD, Sanofi and Roche. Russo GT: in-vestigator in clinical trials sponsored by Lilly, Boehringer Ingelheim, Merck SD, Sanofi and Johnson & Johnson; member of advisory boards for Novo Nordisk, Lilly and Boehringer Ingelheim, member of
advi-sory boards for, and consulting fees from, Novo Nordisk, Lilly and Boehringer Ingelheim. Sciangula L: member of advisory boards for Novo Nordisk, Lilly, AstraZeneca and Johnson & Johnson; consult-ing fees from Roche; investigator in clinical trials sponsored by Novo Nordisk. Lapolla A: investigator in clinical trials sponsored by Novo Nordisk, Lilly, Boehringer Ingelheim and Sanofi. Bette C: employee of Novo Nordisk SpA (Rome, Italy). Rossi MC: research grant from Novo Nordisk, Sanofi, Dexcom, AstraZeneca, Sigma-Tau, Eli Lilly, Artsana and Medtronic.
Ethical approval This study was conducted in accordance with the Declaration of Helsinki and the Guidelines for Good Pharmacoepide-miology Practices. According to Italian law (Italian Republic. Deter-mination of the Italian Medicines Agency of March 20, 2008. Official Gazette of the Italian Republic. General Series No. 76; March 31, 2008), prior to study initiation, the protocol, patient informed consent form and patient enrolment procedures were reviewed and approved by an Independent Ethics Committee (IEC). The study protocol was submitted to the Coordinating Centre IEC in advance, then after its official approval, the study documentation was submitted to the local IECs of all participating centres.
Informed consent Informed consent was obtained from all individual participants included in the study.
Open Access This article is distributed under the terms of the Crea-tive Commons Attribution 4.0 International License (http://creat iveco mmons .org/licen ses/by/4.0/), which permits unrestricted use, distribu-tion, and reproduction in any medium, provided you give appropriate credit to the original author(s) and the source, provide a link to the Creative Commons license, and indicate if changes were made.
References
1. Victoza® summary of product characteristics (2016)
2. Garber A, Henry R, Ratner R et al (2009) Liraglutide versus glimepiride monotherapy for type 2 diabetes (LEAD-3 Mono): a randomised, 52-week, phase III, double-blind, parallel-treatment trial. Lancet 373:473–481
3. Marre M, Shaw J, Brändle M et al (2009) Liraglutide, a once-daily human GLP-1 analogue, added to a sulphonylurea over 26 weeks produces greater improvements in glycaemic and weight control compared with adding rosiglitazone or placebo in subjects with Type 2 diabetes (LEAD-1 SU). Diabet Med 26:268–278 4. Nauck M, Frid A, Hermansen K et al (2009) Efficacy and safety
comparison of liraglutide, glimepiride, and placebo, all in combi-nation with metformin, in type 2 diabetes: the LEAD (liraglutide effect and action in diabetes)-2 study. Diabetes Care 3:84–90 5. Zinman B, Gerich J, Buse JB et al (2009) Efficacy and safety
of the human GLP-1 analog liraglutide in combination with metformin and TZD in patients with type 2 diabetes mellitus (LEAD-4 Met + TZD). Diabetes Care 32:1224–1230
6. Russell-Jones D, Vaag A, Schmitz O et al (2009) Liraglu-tide vs insulin glargine and placebo in combination with met-formin and sulfonylurea therapy in type 2 diabetes mellitus (LEAD-5 met + SU): a randomised controlled trial. Diabetologia 52:2046–2055
7. Buse J, Rosenstock J, Sesti G et al (2009) Liraglutide once a day versus exenatide twice a day for type 2 diabetes: a 26-week rand-omized, parallel-group, multinational, open-label trial (LEAD-6). Lancet 374:39–47
8. Marso SP, Daniels GH, Brown-Frandsen K et al (2016) Liraglu-tide and cardiovascular outcomes in type 2 diabetes. N Engl J Med 375:311–322
9. Ostawal A, Mocevic E, Kragh N, Xu W (2016) Clinical effective-ness of liraglutide in type 2 diabetes treatment in the real-world setting: a systematic literature review. Diabetes Ther 7:411–438 10. Ponzani P, Scardapane M, Nicolucci A, Rossi MC (2016)
Effec-tiveness and safety of liraglutide after three years of treatment. Minerva Endocrinol 41:35–42
11. Rondinelli M, Rossi A, Gandolfi A et al (2017) Use of liraglutide in the real world and impact at 36 months on metabolic control, weight, lipid profile, blood pressure, heart rate, and renal function. Clin Ther 39:159–169
12. Ratner R, Brett J, Khutoryansky N, Aroda VR (2012) Identify-ing predictors of response to liraglutide in type 2 diabetes usIdentify-ing recursive partitioning analysis. Diabetologia 55(Suppl 1):S332 13. Lapolla A, Berra C, Boemi M et al (2017) Long-term effectiveness
of liraglutide for treatment of type 2 diabetes in a real-life setting: a 24-month, multicenter, non-interventional, retrospective study. Adv Ther. https ://doi.org/10.1007/s1232 5-017-0652-2
14. Ciampi A (1992) Constructing prediction trees from data: the RECPAM approach. In: Proceedings from the Prague 1991 sum-mer school on computational aspects of model choice. Physica-Verlag, Heidelberg, pp 105–152
15. Rossi MC, Nicolucci A, Pellegrini F et al (2008) Identifying patients with type 2 diabetes at high risk of microalbuminuria: results of the DEMAND (Developing Education on Microalbumi-nuria for Awareness of reNal and cardiovascular risk in Diabetes) Study. Nephrol Dial Transplant 23:1278–1284
16. Franciosi M, Maione A, Pomili B et al (2010) Correlates of quality of life in adults with type 1 diabetes treated with continuous sub-cutaneous insulin injection. Nutr Metab Cardiovasc Dis 20:7–14 17. Marzona I, Avanzini F, Lucisano G et al (2017) Are all people
with diabetes and cardiovascular risk factors or microvascular complications at very high risk? Findings from the risk and pre-vention study. Acta Diabetol 54:123–131
18. DeFronzo RA, Stonehouse AH, Han J, Wintle ME (2010) Rela-tionship of baseline HbA1c and efficacy of current glucose-lower-ing therapies: a meta-analysis of randomized clinical trials. Diabet Med 27:309–317
19. Lapolla A, Frison V, Bettio M et al (2015) Correlation between baseline characteristics and clinical outcomes in a large popula-tion of diabetes patients treated with liraglutide in a real-world setting in Italy. Clin Ther 37:574–584
20. Toyoda M, Yokoyama H, Abe K, Nakamura S, Suzuki D (2014) Predictors of response to liraglutide in Japanese type 2 diabetes. Diabetes Res Clin Pract 106:451–457
21. Gautier JF, Martinez L, Penfornis A et al (2015) Effectiveness and persistence with liraglutide among patients with type 2 dia-betes in routine clinical practice–EVIDENCE: a prospective, 2-year follow-up, observational, post-marketing study. Adv Ther 32:838–853
22. American Diabetes Association (2017) Standards of medical care in diabetes—2017. Diabetes Care 40:S1–S138
23. Inoue K, Maeda N, Fujishima Y et al (2014) Long-term impact of liraglutide, a glucagon-like peptide-1 (GLP-1) analogue, on body weight and glycemic control in Japanese type 2 diabetes: an observational study. Diabetol Metab Syndr 6:95
24. Kozawa J, Inoue K, Iwamoto R et al (2012) Liraglutide is effective in type 2 diabetic patients with sustained endogenous insulin-secreting capacity. J Diabetes Invest 3:294–297
25. Iwao T, Sakai K, Sata M (2013) Postprandial serum C-peptide is a useful parameter in the prediction of successful switching to liraglutide monotherapy from complex insulin therapy in Japanese patients with type 2 diabetes. J Diabetes Complicat 27:87–91