1
UNIVERSITÀ DEGLI STUDI DI MESSINA Dipartimento di Medicina Clinica e Sperimentale
Dottorato di Ricerca in Scienze Biomediche Cliniche e Sperimentali XXXIII Ciclo
Coordinatore: Ch.mo Prof. Francesco Squadrito
_____________________________________________________________________
Appraising the counter-balancing ischemia and bleeding risks for
dual antiplatelet therapy duration after coronary stenting
Candidato
Dr. Francesco Costa
Tutor
Prof. Scipione Carerj
_____________________________________________________________________ Anno accademico 2019-2020
21
References
1. Costa F, van Klaveren D, James S et al. Derivation and validation of the predicting bleeding complications in patients undergoing stent implantation and subsequent dual antiplatelet therapy (PRECISE-DAPT) score: a pooled analysis of individual-patient datasets from clinical trials. Lancet 2017;389. 2. Wallentin L, Becker RC, Budaj A et al. Ticagrelor versus clopidogrel in
patients with acute coronary syndromes. N Engl J Med 2009;361:1045-57. 3. Koskinas KC, Raber L, Zanchin T et al. Clinical impact of gastrointestinal bleeding in patients undergoing percutaneous coronary interventions. Circ Cardiovasc Interv 2015;8.
4. Valgimigli M, Bueno H, Byrne RA et al. 2017 ESC focused update on dual antiplatelet therapy in coronary artery disease developed in collaboration with EACTS: The Task Force for dual antiplatelet therapy in coronary artery disease of the European Society of Cardiology (ESC) and of the European Association for Cardio-Thoracic Surgery (EACTS). Eur Heart J 2017. 5. Shamir R. Mehta, Kevin R. Bainey, Warren J. Cantor et al. 2018 Canadian
Cardiovascular Society (CCS)/Canadian Association of Interventional Cardiology (CAIC) Focused Update of the Guidelines for the use of Antiplatelet Therapy. Can J Cardiol 2018.
22 6. Valgimigli M, Costa F, Byrne R, Haude M, Baumbach A, Windecker S.
Dual antiplatelet therapy duration after coronary stenting in clinical practice: results of an EAPCI survey. EuroIntervention 2015;11:68-74.
7. Giustino G, Chieffo A, Palmerini T et al. Efficacy and Safety of Dual Antiplatelet Therapy After Complex PCI. J Am Coll Cardiol 2016;68:1851-1864.
8. Yeh RW, Kereiakes DJ, Steg PG et al. Lesion Complexity and Outcomes of Extended Dual Antiplatelet Therapy After Percutaneous Coronary
Intervention. J Am Coll Cardiol 2017;70:2213-2223.
9. Pilgrim T, Heg D, Roffi M et al. Ultrathin strut biodegradable polymer sirolimus-eluting stent versus durable polymer everolimus-eluting stent for percutaneous coronary revascularisation (BIOSCIENCE): a randomised, single-blind, non-inferiority trial. Lancet 2014;384:2111-22.
10. Raber L, Kelbaek H, Ostojic M et al. Effect of biolimus-eluting stents with biodegradable polymer vs bare-metal stents on cardiovascular events among patients with acute myocardial infarction: the COMFORTABLE AMI
randomized trial. JAMA 2012;308:777-87.
11. Gwon HC, Hahn JY, Park KW et al. Six-month versus 12-month dual
antiplatelet therapy after implantation of drug-eluting stents: the Efficacy of Xience/Promus Versus Cypher to Reduce Late Loss After Stenting
23 (EXCELLENT) randomized, multicenter study. Circulation 2012;125:505-13.
12. Feres F, Costa RA, Abizaid A et al. Three vs twelve months of dual antiplatelet therapy after zotarolimus-eluting stents: the OPTIMIZE randomized trial. JAMA 2013;310:2510-22.
13. Valgimigli M, Campo G, Monti M et al. Short- versus long-term duration of dual-antiplatelet therapy after coronary stenting: a randomized multicenter trial. Circulation 2012;125:2015-26.
14. Kim BK, Hong MK, Shin DH et al. A new strategy for discontinuation of dual antiplatelet therapy: the RESET Trial (REal Safety and Efficacy of 3-month dual antiplatelet Therapy following Endeavor zotarolimus-eluting stent implantation). J Am Coll Cardiol 2012;60:1340-8.
15. Colombo A, Chieffo A, Frasheri A et al. Second-generation drug-eluting stent implantation followed by 6- versus 12-month dual antiplatelet therapy: the SECURITY randomized clinical trial. J Am Coll Cardiol 2014;64:2086-97.
16. Valgimigli M, Patialiakas A, Thury A et al. Zotarolimus-eluting versus bare-metal stents in uncertain drug-eluting stent candidates. J Am Coll Cardiol 2015;65:805-15.
24 17. Chesebro JH, Knatterud G, Roberts R et al. Thrombolysis in Myocardial
Infarction (TIMI) Trial, Phase I: A comparison between intravenous tissue plasminogen activator and intravenous streptokinase. Clinical findings through hospital discharge. Circulation 1987;76:142-54.
18. Cutlip DE, Windecker S, Mehran R et al. Clinical end points in coronary stent trials: a case for standardized definitions. Circulation 2007;115:2344-51.
19. Altman D, Machin D, Bryant T, Gardner M. Statistics with Confidence: Confidence Intervals and Statistical Guidelines.
20. Navarese EP, Andreotti F, Schulze V et al. Optimal duration of dual antiplatelet therapy after percutaneous coronary intervention with drug eluting stents: meta-analysis of randomised controlled trials. BMJ 2015;350:h1618.
21. Mauri L, Kereiakes DJ, Yeh RW et al. Twelve or 30 months of dual
antiplatelet therapy after drug-eluting stents. N Engl J Med 2014;371:2155-66.
22. Adriaenssens T, Joner M, Godschalk TC et al. Optical Coherence Tomography Findings in Patients With Coronary Stent Thrombosis: A Report of the PRESTIGE Consortium (Prevention of Late Stent Thrombosis
25 by an Interdisciplinary Global European Effort). Circulation 2017;136:1007-1021.
23. Wijns W, Steg PG, Mauri L et al. Endeavour zotarolimus-eluting stent reduces stent thrombosis and improves clinical outcomes compared with cypher sirolimus-eluting stent: 4-year results of the PROTECT randomized trial. Eur Heart J 2014;35:2812-20.
24. Stone GW, Rizvi A, Newman W et al. Everolimus-eluting versus paclitaxel-eluting stents in coronary artery disease. N Engl J Med 2010;362:1663-74. 25. Urban P, Meredith IT, Abizaid A et al. Polymer-free Drug-Coated Coronary
Stents in Patients at High Bleeding Risk. N Engl J Med 2015;373:2038-47. 26. Hermiller JB, Krucoff MW, Kereiakes DJ et al. Benefits and Risks of
Extended Dual Antiplatelet Therapy After Everolimus-Eluting Stents. JACC Cardiovascular interventions 2016;9:138-47.
27. Cavallari I, Morrow DA, Creager MA et al. Frequency, Predictors, and Impact of Combined Antiplatelet Therapy on Venous Thromboembolism in Patients With Symptomatic Atherosclerosis. Circulation 2018;137:684-692. 28. Amin AP, Bachuwar A, Reid KJ et al. Nuisance bleeding with prolonged
dual antiplatelet therapy after acute myocardial infarction and its impact on health status. J Am Coll Cardiol 2013;61:2130-8.
26 29. Valgimigli M, Costa F, Lokhnygina Y et al. Trade-off of myocardial
infarction vs. bleeding types on mortality after acute coronary syndrome: lessons from the Thrombin Receptor Antagonist for Clinical Event
Reduction in Acute Coronary Syndrome (TRACER) randomized trial. Eur Heart J 2017;38:804-810.
30. Levine GN, Bates ER, Bittl JA et al. 2016 ACC/AHA Guideline Focused Update on Duration of Dual Antiplatelet Therapy in Patients With Coronary Artery Disease: A Report of the American College of Cardiology/American Heart Association Task Force on Clinical Practice Guidelines. J Am Coll Cardiol 2016;68:1082-1115.
31. Costa F, Vranckx P, Leonardi S et al. Impact of clinical presentation on ischaemic and bleeding outcomes in patients receiving 6- or 24-month duration of dual-antiplatelet therapy after stent implantation: a pre-specified analysis from the PRODIGY (Prolonging Dual-Antiplatelet Treatment After Grading Stent-Induced Intimal Hyperplasia) trial. Eur Heart J 2015;36:1242-51.
32. Qiu M, Li Y, Li J et al. Impact of six versus 12 months of dual antiplatelet therapy in patients with drug-eluting stent implantation after risk
27 analysis of the I-LOVE-IT 2 trial. Catheter Cardiovasc Interv 2017;89:565-573.
33. Costa F, Adamo M, Ariotti S et al. Left main or proximal left anterior descending coronary artery disease location identifies high-risk patients deriving potentially greater benefit from prolonged dual antiplatelet therapy duration. EuroIntervention 2016;11:e1222-30.
34. Redfors B, Ben-Yehuda O, Lin SH et al. Quantifying Ischemic Risk After Percutaneous Coronary Intervention Attributable to High Platelet Reactivity on Clopidogrel (From the Assessment of Dual Antiplatelet Therapy with Drug-Eluting Stents Study). Am J Cardiol 2017;120:917-923.
35. Ibrahim H, Schutt RC, Hannawi B, DeLao T, Barker CM, Kleiman NS. Association of immature platelets with adverse cardiovascular outcomes. J Am Coll Cardiol 2014;64:2122-9.
36. Chitalia VC, Shivanna S, Martorell J et al. Uremic serum and solutes
increase post-vascular interventional thrombotic risk through altered stability of smooth muscle cell tissue factor. Circulation 2013;127:365-76.
37. Udell JA, Bonaca MP, Collet JP et al. Long-term dual antiplatelet therapy for secondary prevention of cardiovascular events in the subgroup of patients with previous myocardial infarction: a collaborative meta-analysis of randomized trials. Eur Heart J 2016;37:390-9.
28
Figure Legends
Figure 1: Flow-chart describing the PRECISE-DAPT pooled dataset population.
Figure 2: Venn’s Diagram for complex PCI elements interrelation in the
PRECISE-DAPT population (2 groups with 4 elements). Taking two groups as a reference (i.e. ≥3 stents implanted and >60mm total stent length) we explored their relation with the pair bifurcation with 2 stents and the pair ≥3 lesions treated and 3 vessels treated respectively. The relation between bifurcation, CTO, lesions treated and 3 vessel disease was not explored in the figure as it was not possible to draw a figure taking into account the relation of the 6 groups at the same time. CTO: chronic total occlusion.
Figure 3: PRECISE-DAPT score quartiles distribution among single complex PCI
definition parameters. PCI: percutaneous coronary intervention.
Figure 4: Ischemic (A) and bleeding (B) events overtime for patients with/without high bleeding risk (HBR) and with/without complex percutaneous coronary intervention (PCI). Kaplan-Meier estimates for
29 vessel revascularization (TVR)(A), and TIMI major or minor bleeding (B) during the 24 months follow-up are presented. Log-rank test was used for comparison. The occurrence of MI, def ST, stroke or TVR was higher among patients with complex PCI or HBR and highest in the group where both characteristics were present (A). The occurrence of TIMI major or minor bleeding was higher among patients with HBR but not among those with complex PCI alone (B).
Figure 5: Ischemic (A) and bleeding (B) events overtime for patients at very-low,
low, moderate and high bleeding risk (BR) and with/without complex PCI.
Figure 6: Ischemic events among patients randomized to a long or short treatment with DAPT with/without high bleeding risk and PCI complexity.
Twenty-four month Kaplan-Meier estimates of myocardial infarction (MI), definite stent thrombosis (def ST), stroke or target vessel revascularization (TVR) for
patients randomly assigned to long (12–24 months) or short (3–6 months) dual antiplatelet therapy (DAPT) in the four explored groups with/without high
bleeding risk and with/without complex percutaneous coronary intervention (PCI). Long DAPT was associated with a reduction of MI, def ST, stroke or TVR in patients without high bleeding risk and non-complex PCI and with a borderline reduction in patients in the complex PCI stratum (upper panels). In contrast, long
30 DAPT provided no benefit among patients with high bleeding risk (lower panels) irrespective of complex PCI features.
Figure 7: Bleeding events among patients randomized to a long or short treatment with DAPT with/without high bleeding risk and PCI complexity.
Twenty-four month Kaplan-Meier estimates of TIMI major or minor bleeding for patients randomly assigned to long (12–24 months) or short (3–6 months) dual antiplatelet therapy (DAPT) in the four explored groups with/without high
bleeding risk and with/without complex percutaneous coronary intervention (PCI). Long DAPT was not associated with an increase of TIMI major or minor bleeding in patients without high bleeding risk (upper panels) irrespective of PCI
complexity. In contrast, long DAPT was associated with an increase of TIMI major or minor bleeding among patients with high bleeding risk and non-complex PCI features (lower panels).
Figure 8: Risk difference for long vs. short DAPT duration for bleeding*, ischemic† and net adverse clinical events‡ in patients stratified according to the PRECISE-DAPT score and with/without complex PCI (A) or with/without complex patient criteria (B). *Bleeding endpoint defined according the TIMI
31 composite of myocardial infarction, definite stent thrombosis, stroke or target vessel revascularization. ‡ Net adverse clinical events defined according to the composite of myocardial infarction, definite stent thrombosis, stroke, target vessel revascularization or TIMI major/minor bleeding. Complex PCI is defined as the presence of a PCI with ≥3 stents implanted and/or ≥3 lesions treated and/or 3 coronary vessels treated and/or bifurcation with 2 stents implanted and/or total stent length > 60 mm and/or treatment of a chronic total occlusion. Complex patient is defined as the presence of at least one element of the prior mentioned complex PCI definition and/or the presence of acute coronary syndrome at
presentation. DAPT: dual antiplatelet therapy. NACE: Net adverse clinical events.
Figure 9: Risk difference for long vs. short DAPT duration for bleeding and
ischemic events in the overall patient population and in patients with high/non-high PRECISE-DAPT score, stratified according to the number of elements qualifying for complex PCI. DAPT: dual antiplatelet therapy. MI: myocardial infarction. Def ST: definite stent thrombosis. TVR: target vessel revascularization.
32
Table 1: Baseline characteristics in the four explored groups by bleeding risk and intervention complexity
PRECISE-DAPT<25 (non-HBR) Non-Complex PCI (N=8,982) PRECISE-DAPT<25 (non-HBR) Complex PCI (N=2,273) PRECISE-DAPT ≥25 (HBR) Non-Complex PCI (N=2,863) PRECISE-DAPT ≥25 (HBR) Complex PCI (N=845) P value PRECISE- DAPT<25 (non-HBR) Non-Complex PCI Vs. Complex PCI P value PRECISE-DAPT≥25 (HBR) Non-Complex PCI Vs. Complex PCI Age (years) 61 (54-68) 62 (55-68.6) 76.4 (71.8-81) 77.2 (72.9-82) 0.04 0.008 Women (vs. Man) 25.8% 23.6% 42.6% 40.6% 0.03 0.30 Hypertension 69.4% 68.7% 79.0% 80.9% 0.49 0.23 Dyslipidemia 62.2% 65.7% 56.0% 57.3% 0.002 0.50 Current smoking 29.0% 31.1% 12.7% 12.1% 0.06 0.61 Diabetes 26.7% 28.5% 29.4% 34.6% 0.06 0.003 Insulin dependent 5.2% 5.6% 4.9% 7.6% 0.41 0.002 PVD 6.1% 8.1% 17.3% 21.5% 0.02 0.03 Prior MI 19.2% 19.5% 20.7% 23.0% 0.76 0.15 Prior PCI 15.0% 17.0% 17.7% 18.1% 0.02 0.78 Prior CABG 5.1% 5.9% 8.4% 7.6% 0.13 0.43 Prior stroke 2.7% 4.0% 5.4% 5.7% 0.003 0.77 Prior bleeding 0.0% 0.0% 5.3% 5.4% 1.00 0.91
33 Weight (Kg) 75 (66-85) 75 (66-85) 68.4 (60-78) 70 (61-80) 0.94 0.03 Creatinine clearance (ml/min) 89.3 (76-106.6) 89.4 (76.7-103.9) 52.3 (40.5-62.2) 51.9 (41.1-62.7) 0.99 0.41
White blood cells count (103 units/µL) 7.7 (6.2-10.1) 7.8 (6.4-9.7) 8.2 (6.7-10.6) 8.0 (6.7-10.4) 0.42 0.39 Hemoglobin (g/dL) 14.0 (13.1-15) 14.2 (13.2-15.1) 12.7 (11.4-14.1) 12.4 (11.1-13.7) 0.05 0.03 Left ventricle ejection fraction (%) 55.0 (50.0-61) 55.0 (45.0-64.4) 55.0 (45.0-60.0) 54.0 (40.0-60.4) <0.001 0.94 Left ventricle ejection fraction less than 35% 6.7% 8.9% 13.2% 15.7% 0.001 0.08 Clinical presentation SCAD 45.7% 48.4% 40.1% 35.0%
34 UA 23.2% 20.1% 23.5% 21.4% <0.0001 <0.0001 NSTEMI 11.3% 13.8% 18.3% 28.2% STEMI 19.8% 17.7% 18.1% 15.5% Single vessel disease 64.9% 38.2% 48.4% 23.8% <0.0001 <0.0001 Number of vessel treated 1 87.0% 60.8% 81.3% 41.4% <0.0001 <0.0001 2 12.8% 31.7% 18.5% 44.9% 3 0.2% 7.5% 0.2% 13.7%
More than one lesions treated 18.0% 50.5% 20.6% 67.4% Overall stent length (mm) 24.0 (18.0-33.0) 58.0 (36.0-78.0) 24.0 (18.0-33.0) 63.0 (43.0-81.0) <0.0001 <0.0001 Type of stent implanted BMS 11.5% 8.5% 19.4% 16.3% <0.0001 0.004 1st generation DES 7.5% 8.5% 9.4% 6.8% 2nd generation DES 81.0% 83.0% 71.2% 76.9%
35 Therapy at discharge Aspirin 99.1% 99.1% 97.3% 97.0% 0.92 0.70 Clopidogrel 87.6% 78.0% 90.2% 83.5% <0.0001 <0.0001 Prasugrel 8.1% 12.1% 3.2% 4.4% <0.0001 0.10 Ticagrelor 2.8% 8.5% 2.3% 8.5% <0.0001 <0.0001 Statin 90.8% 90.7% 84.6% 87.4% 0.95 0.05 Beta blocker 74.4% 76.9% 71.9% 73.9% 0.02 0.27 ACE/ARB 65.8% 70.8% 66.0% 66.5% <0.0001 0.80 PPI 34.2% 29.6% 51.3% 51.3% 0.004 0.99
HBR= high bleeding risk. PVD= peripheral vascular disease. MI= myocardial infarction. PCI= percutaneous coronary intervention. CABG= coronary artery bypass graft. SCAD= stable coronary artery disease. UA= unstable angina. NSTEMI= non-ST segment elevated myocardial infarction. STEMI= ST segment elevated myocardial infarction. ACE/ARB: ACE inhibitor or angiotensin-II receptor blocker. PPI= proton pump inhibitor.
36
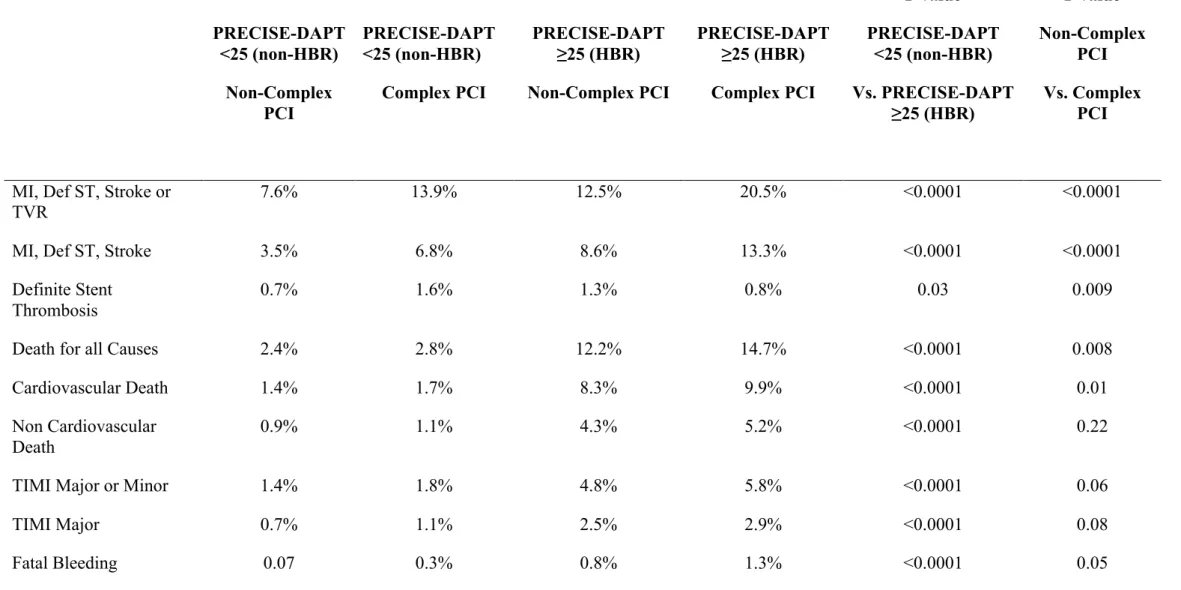
Table 2: Ischemic and bleeding events according to bleeding (PRECISE-DAPT) and intervention complexity risk profiles.
PRECISE-DAPT <25 (non-HBR) Non-Complex PCI PRECISE-DAPT <25 (non-HBR) Complex PCI PRECISE-DAPT ≥25 (HBR) Non-Complex PCI PRECISE-DAPT ≥25 (HBR) Complex PCI P value PRECISE-DAPT <25 (non-HBR) Vs. PRECISE-DAPT ≥25 (HBR) P value Non-Complex PCI Vs. Complex PCI
MI, Def ST, Stroke or TVR
7.6% 13.9% 12.5% 20.5% <0.0001 <0.0001
MI, Def ST, Stroke 3.5% 6.8% 8.6% 13.3% <0.0001 <0.0001
Definite Stent Thrombosis
0.7% 1.6% 1.3% 0.8% 0.03 0.009
Death for all Causes 2.4% 2.8% 12.2% 14.7% <0.0001 0.008
Cardiovascular Death 1.4% 1.7% 8.3% 9.9% <0.0001 0.01
Non Cardiovascular Death
0.9% 1.1% 4.3% 5.2% <0.0001 0.22
TIMI Major or Minor 1.4% 1.8% 4.8% 5.8% <0.0001 0.06
TIMI Major 0.7% 1.1% 2.5% 2.9% <0.0001 0.08
Fatal Bleeding 0.07 0.3% 0.8% 1.3% <0.0001 0.05
37
HBR= high bleeding risk. MI= myocardial infarction. ST= stent thrombosis. TVR= target vessel revascularization. Def/Prob= definite or probable. TIMI= thrombosis in myocardial infarction.
38
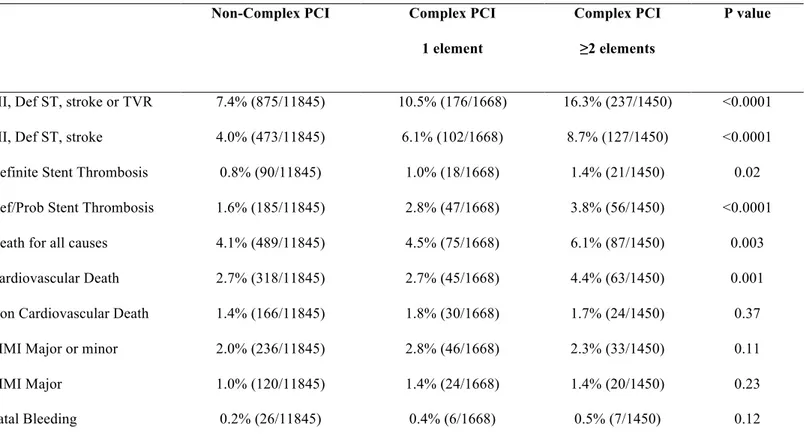
Table 3: Ischemic and bleeding events according to the number of complex PCI features (complex PCI score)
Non-Complex PCI Complex PCI
1 element
Complex PCI ≥2 elements
P value
MI, Def ST, stroke or TVR 7.4% (875/11845) 10.5% (176/1668) 16.3% (237/1450) <0.0001 MI, Def ST, stroke 4.0% (473/11845) 6.1% (102/1668) 8.7% (127/1450) <0.0001 Definite Stent Thrombosis 0.8% (90/11845) 1.0% (18/1668) 1.4% (21/1450) 0.02 Def/Prob Stent Thrombosis 1.6% (185/11845) 2.8% (47/1668) 3.8% (56/1450) <0.0001 Death for all causes 4.1% (489/11845) 4.5% (75/1668) 6.1% (87/1450) 0.003 Cardiovascular Death 2.7% (318/11845) 2.7% (45/1668) 4.4% (63/1450) 0.001 Non Cardiovascular Death 1.4% (166/11845) 1.8% (30/1668) 1.7% (24/1450) 0.37 TIMI Major or minor 2.0% (236/11845) 2.8% (46/1668) 2.3% (33/1450) 0.11
TIMI Major 1.0% (120/11845) 1.4% (24/1668) 1.4% (20/1450) 0.23
Fatal Bleeding 0.2% (26/11845) 0.4% (6/1668) 0.5% (7/1450) 0.12
39
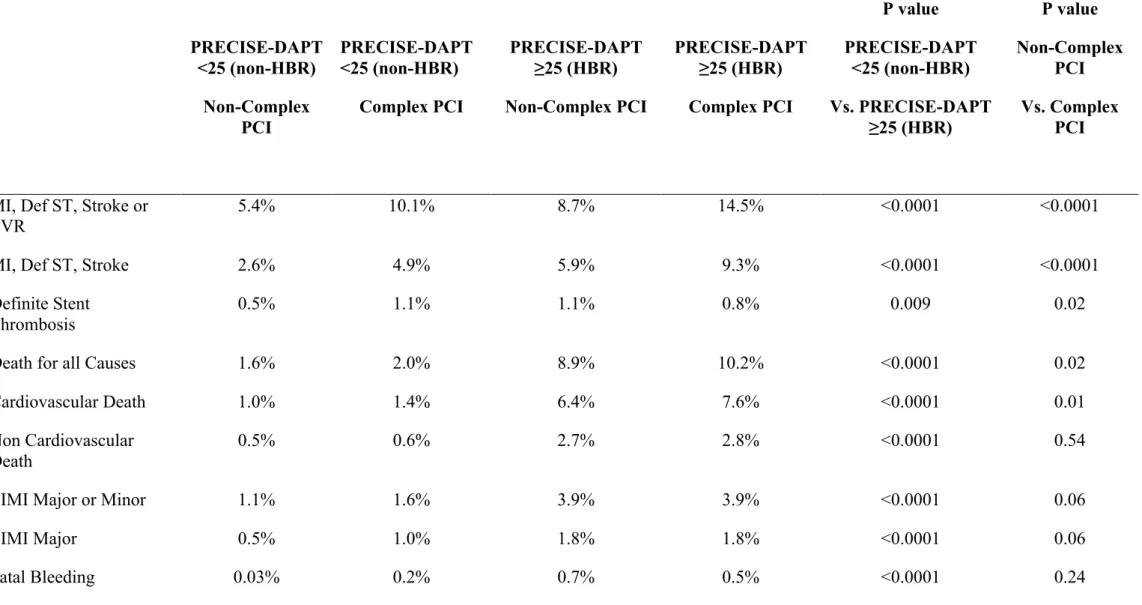
Table 4: Ischemic and bleeding events at 12 months according to bleeding (PRECISE-DAPT) and intervention complexity risk profiles
PRECISE-DAPT <25 (non-HBR) Non-Complex PCI PRECISE-DAPT <25 (non-HBR) Complex PCI PRECISE-DAPT ≥25 (HBR) Non-Complex PCI PRECISE-DAPT ≥25 (HBR) Complex PCI P value PRECISE-DAPT <25 (non-HBR) Vs. PRECISE-DAPT ≥25 (HBR) P value Non-Complex PCI Vs. Complex PCI
MI, Def ST, Stroke or
TVR 5.4% 10.1% 8.7% 14.5% <0.0001 <0.0001
MI, Def ST, Stroke 2.6% 4.9% 5.9% 9.3% <0.0001 <0.0001
Definite Stent Thrombosis
0.5% 1.1% 1.1% 0.8% 0.009 0.02
Death for all Causes 1.6% 2.0% 8.9% 10.2% <0.0001 0.02
Cardiovascular Death 1.0% 1.4% 6.4% 7.6% <0.0001 0.01
Non Cardiovascular
Death 0.5% 0.6% 2.7% 2.8% <0.0001 0.54
TIMI Major or Minor 1.1% 1.6% 3.9% 3.9% <0.0001 0.06
TIMI Major 0.5% 1.0% 1.8% 1.8% <0.0001 0.06
Fatal Bleeding 0.03% 0.2% 0.7% 0.5% <0.0001 0.24
Twelve months Kaplan Meier estimates are presented. Log-rank test was used for comparison.
40
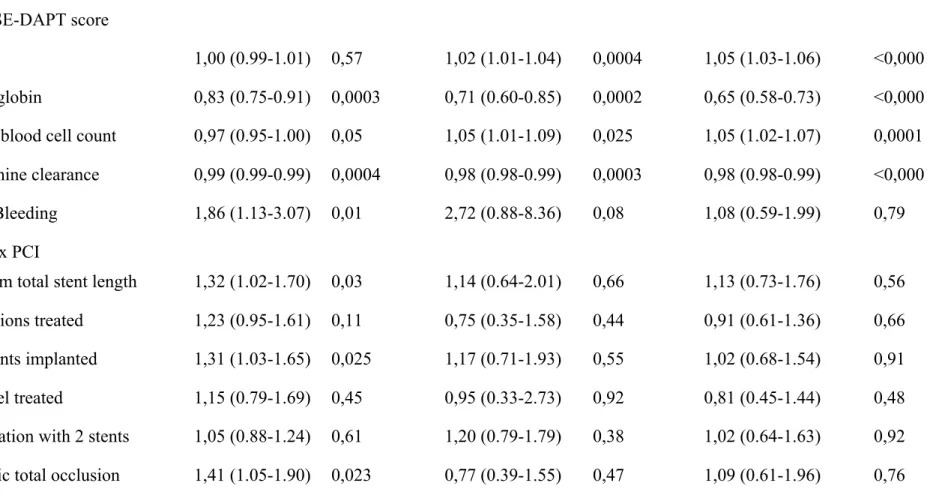
Table 5: Multivariable models exploring events’ predictors*
Events MI, Definite ST, stroke or
TVR
TIMI major or Minor All cause death
Hazard Ratio P Hazard Ratio P Hazard Ratio P
Model 1
PRECISE-DAPT score
Age 1,00 (0.99-1.01) 0,57 1,02 (1.01-1.04) 0,0004 1,05 (1.03-1.06) <0,0001 Hemoglobin 0,83 (0.75-0.91) 0,0003 0,71 (0.60-0.85) 0,0002 0,65 (0.58-0.73) <0,0001 White blood cell count 0,97 (0.95-1.00) 0,05 1,05 (1.01-1.09) 0,025 1,05 (1.02-1.07) 0,0001 Creatinine clearance 0,99 (0.99-0.99) 0,0004 0,98 (0.98-0.99) 0,0003 0,98 (0.98-0.99) <0,0001 Prior Bleeding 1,86 (1.13-3.07) 0,01 2,72 (0.88-8.36) 0,08 1,08 (0.59-1.99) 0,79 Complex PCI
>60 mm total stent length 1,32 (1.02-1.70) 0,03 1,14 (0.64-2.01) 0,66 1,13 (0.73-1.76) 0,56 ≥ 3 lesions treated 1,23 (0.95-1.61) 0,11 0,75 (0.35-1.58) 0,44 0,91 (0.61-1.36) 0,66 ≥ 3 stents implanted 1,31 (1.03-1.65) 0,025 1,17 (0.71-1.93) 0,55 1,02 (0.68-1.54) 0,91 3 vessel treated 1,15 (0.79-1.69) 0,45 0,95 (0.33-2.73) 0,92 0,81 (0.45-1.44) 0,48 Bifurcation with 2 stents 1,05 (0.88-1.24) 0,61 1,20 (0.79-1.79) 0,38 1,02 (0.64-1.63) 0,92 Chronic total occlusion 1,41 (1.05-1.90) 0,023 0,77 (0.39-1.55) 0,47 1,09 (0.61-1.96) 0,76
41
Model 2
Complex PCI score† + Age 1,25 (1.20-1.32) 1,01 (1.00-1.02) <0.0001 <0.0001 1,09 (0.96-1.23) 1,04 (1.02-1.05) 0.18 <0.0001 1,04 (0.95 -1.15) 1,07 (1.06-1.08) 0.34 <0.0001 Model 3
Complex PCI score† + Prior bleeding 1,25 (1.19-1.31) 1,88 (1.16-3.07) <0.0001 0.01 1,09 (0.96-1.23) 2,87 (1.08-7.60) 0.18 0.03 1,06 (0.96-1.17) 1,16 (0.62-2.18) 0.24 0.64 Model 4
Complex PCI score† + White blood cell count
1,25 (1.19-1.31) 0,97 (0.95-0.99) <0.0001 0.01 1,09 (0.97-1.24) 1,04 (0.99-1.09) 0.16 0.16 1,06 (0.96-1.17) 1,02 (1.00-1.05) 0.24 0.09 Model 5
Complex PCI score† + Hemoglobin 1,25 (1.19-1.31) 0,91 (0.87-0.94) <0.0001 <0.0001 1,08 (0.95-1.22) 0,82 (0.75-0.88) 0.22 <0.0001 1,03 (0.92-1.14) 0,67 (0.63-0.71) 0.58 <0.0001 Model 6
42 Complex PCI score†
+ Creatinine clearance 1,25 (1.19-1.31) 0,99 (0.99-1.00) <0.0001 <0.0001 1,08 (0.96-1.22) 0,98 (0.98-0.99) 0.20 <0.0001 1,04 (0.94-1.15) 0,97 (0.97-0.98) 0.45 <0.0001 Model 7
Complex PCI score† + PRECISE-DAPT score 1,25 (1.19-1.31) 1,02 (1.01-1.02) <0.0001 <0.0001 1,07 (0.95-1.21) 1,08 (1.07-1.10) 0.25 <0.0001 1,04 (0.94-1.15) 1,10 (1.09-1.11) 0.44 <0.0001 *: All events accounted from study inclusion. †: Complex PCI score represent the discrete number of elements qualifying for PCI complexity (e.g. presence of a total stent length >60 mm and three lesions treated = 2 points).
MI= myocardial infarction. ST= stent thrombosis. TVR= target vessel revascularization. TIMI= thrombosis in myocardial infarction.
43
Table 6: Multivariable model exploring predictors of events among the components of the PRECISE-DAPT score and complex PCI features. Analysis restricted to out-of-hospital events.
Events MI, Definite ST, stroke or TVR TIMI major or Minor All cause death
Hazard Ratio P Hazard Ratio P Hazard Ratio P
PRECISE-DAPT score
Age 1,00 (0.99-1.01) 0,67 1,02 (1.01-1.04) 0,003 1,04 (1.03-1.05) <0,0001 Hemoglobin 0,84 (0.76-0.94) 0,002 0,65 (0.53-0.80) 0,0001 0,64 (0.57-0.72) <0,0001 White blood cell count 0,97 (0.93-1.00) 0,03 1,04 (0.98-1.11) 0,20 1,04 (1.02-1.07) 0,0007 Creatinine clearance 0,99 (0.99-1.00) 0,0001 0,99 (0.98-0.99) 0,0005 0,98 (0.98-0.99) <0,0001 Prior Bleeding 2,02 (1.15-3.55) 0,01 2,88 (0.63-13.2) 0,17 1,10 (0.59-2.07) 0,75 Complex PCI
>60 mm total stent length 1,28 (0.97-1.71) 0,08 0,93 (0.50-1.75) 0,84 0,93 (0.60-1.43) 0,75 ≥ 3 lesions treated 1,32 (0.98-1.77) 0,06 0,64 (0.26-1.56) 0,33 0,96 (0.62-1.46) 0,85 ≥ 3 stents implanted 1,22 (0.93-1.60) 0,14 1,15 (0.65-2.03) 0,63 1,11 (0.74-1.67) 0,59 3 vessel treated 1,16 (0.77-1.74) 0,47 1,58 (0.49-5.07) 0,44 0,83 (0.45-1.53) 0,54 Bifurcation with 2 stents 1,03 (0.85-1.26) 0,75 1,21 (0.75-1.95) 0,42 1,00 (0.63-1.57) 0,99 Chronic total occlusion 1,57 (1.15-2.14) 0,004 0,88 (0.37-2.07) 0,77 1,09 (0.55-2.14) 0,79
44
Table 7: Clinical events according to the PRECISE-DAPT score and the PCI complexity among patients randomized to short vs. long DAPT duration
PRECISE-DAPT <25 (non-HBR) PRECISE-DAPT ≥25 (HBR)
Short DAPT
Long DAPT
ARD P Pint Short
DAPT
Long DAPT
ARD P Pint
MI, definite ST, stroke or TVR Non-Complex PCI 4.52% 3.38% –1.14% (–2.26 to –0.02) 0.04 0.19 6.76% 8.21% +1.45% (–1.84 to +4.72) 0.39 0.97 Complex PCI 10.18% 6.32% –3.86% (–7.71 to +0.06) 0.05 10.3% 11.6% +1.30% (–6.99 to +9.57) 0.76
Death, MI, definite ST, stroke or TVR
Non-Complex PCI 5.33% 4.37% –0.96% (–2.21 to +0.30) 0.13 0.38 10.66% 11.05% +0.39% (–3.46 to +4.24) 0.84 0.75
Complex PCI 11.26% 8.33% –2.93% (–7.21 to +1.30) 0.17 15.9% 18.0% +2.14% (–8.05 to +12.48) 0.68
Definite stent thrombosis
45
Complex PCI 0.67% 0.00% -0.67% (–1.33 to +0.25) n.a. 0.00% 0.00% 0.00% (0.00 to 0.00) n.a.
Death for all causes
Non-Complex PCI 0.98% 1.28% +0.30% (–0.36 to +0.96) 0.37
0.54
6.12% 4.67% -1.45% (–4.15 to +1.24) 0.29
0.93
Complex PCI 1.36% 2.29% +0.93% (–0.99 to +2.86) 0.34 10.01% 8.89% -1.12% (–8.55 to +6.29) 0.77
TIMI major or minor
Non-Complex PCI 0.37% 0.49% +0.12% (–0.25 to +0.50) 0.53
0.73
1.03% 3.64% +2.61% (+0.89 to +4.31) 0.003
0.89
Complex PCI 0.32% 0.60% +0.28% (–0.46 to +1.26) 0.57 3.30% 6.34% +3.04% (–2.97 to +8.82) 0.30
MI, definite ST, stroke TVR or TIMI
major/minor bleeding
Non-Complex PCI 4.73% 3.82% –0.91% (–2.07 to +0.25) 0.12 0.14 7.65% 10.46% +2.81% (–0.72 to +6.33) 0.11 0.83
Complex PCI 10.58% 6.54% –4.05% (–7.96 to –0.07) 0.04 12.52% 14.20% +1.68% (–7.85 to +11.15) 0.73
Twenty-four months Kaplan Meier estimates are presented for long vs. short DAPT treatment. The absolute risk difference (ARD) and its 95% confidence interval are calculated according to Newcombe & Altman (2000).
HBR= high bleeding risk. ARD= Absolute risk difference. MI= myocardial infarction. ST= stent thrombosis. TVR= target vessel revascularization. Def/Prob= definite or probable. TIMI= thrombosis in myocardial infarction.
46
Table 8: Clinical events according to the PRECISE-DAPT score and the PCI complexity among patients randomized to short vs. long DAPT duration and presenting with acute coronary syndrome.
PRECISE-DAPT <25 (Non-HBR) PRECISE-DAPT ≥25 (HBR)
Short DAPT
Long DAPT
ARD P Pint Short
DAPT
Long DAPT
ARD P Pint
MI, definite ST, stroke or TVR Non-Complex PCI 6.15% 2.76% –3.39% (–5.37 to –1.44) <0.001 0.19 8.83% 9.70% +0.86% (–4.34 to +6.08) 0.75 0.54 Complex PCI 14.26% 6.19% –8.08% (–14.86 to –1.52) 0.017 11.3% 16.3% +4.96% (–6.86 to +17.22) 0.42
Death, MI, definite ST, stroke or TVR
Non-Complex PCI 6.85% 3.89% –2.95% (–5.15 to –0.77) 0.008 0.40 13.41% 14.57% +1.16% (–4.86 to +7.19) 0.71 0.18
Complex PCI 15.91% 9.64% –6.26% (–13.75 to +1.05) 0.09 14.9% 26.8% +11.9% (–2.04 to +26.9) 0.11
MI, definite ST, stroke
Non-Complex PCI 1.73% 1.11% –0.61% (–1.74 to +0.51) 0.29 0.16 4.87% 6.88% +2.02% (–2.20 to +6.26) 0.35 0.69
47
Death, MI, definite ST, stroke
Non-Complex PCI 2.41% 2.41% +0.00% (–1.52 to +1.53) 0.99 0.56 9.97% 11.7% +1.76% (–3.60 to +7.13) 0.52 0.79
Complex PCI 5.90% 4.34% –1.56% (–6.60 to +3.44) 0.54 13.6% 17.2% +3.57% (–8.91 to +16.4) 0.58
Stent thrombosis
Non-Complex PCI 0.52% 0.29% -0.23% (–0.78 to +0.29) 0.40 0.18 0.72% 0.87% +0.14% (–1.09 to +1.50) 0.83 n.a.
Complex PCI 1.54% 0.00% -1.54% (–3.08 to +0.55) n.a. 0.00% 0.00% 0.00% (0.00 to 0.00) n.a.
Death for all causes
Non-Complex PCI 0.89% 1.32% +0.42% (–0.64 to +1.49) 0.44
0.63
7.20% 6.57% -0.63% (–4.65 to +3.38) 0.76
0.58
Complex PCI 1.89% 3.14% +1.24% (–1.88 to +4.47) 0.44 10.6% 13.1% +2.53% (–7.79 to +13.1) 0.63
TIMI major or minor
Non-Complex PCI 0.67% 0.59% –0.08% (–0.84 to +0.67) 0.83 n.a. 1.19% 2.59% +1.41% (–0.69 to +3.54) 0.19 0.13
Complex PCI 0% 0% n.a. n.a. 2.41% 10.43% +8.02% (+0.26 to +16.75) 0.05
MI, definite ST, stroke TVR or TIMI
48
Non-Complex PCI 6.47% 3.25% –3.22% (–5.28 to –1.19) 0.002 0.17 9.71% 11.0% +1.26% (–4.13 to +6.65) 0.65 0.29
Complex PCI 14.3% 6.24% –8.07% (–14.9 to –1.49) 0.018 12.5% 21.6% +9.03% (–4.05 to +22.9) 0.19
HBR= high bleeding risk. ARD= Absolute risk difference. MI= myocardial infarction. ST= stent thrombosis. TVR= target vessel revascularization. Def/Prob= definite or probable. TIMI= thrombosis in myocardial infarction.
49
Table 9: Clinical events according to the PRECISE-DAPT score quartiles (i.e. very low, low, moderate and high bleeding risk) and the PCI complexity among patients randomized to short vs. long DAPT duration
Very low Bleeding Risk Low Bleeding Risk Moderate Bleeding Risk High Bleeding Risk
ARD (95%CI) P Pint ARD (95%CI) P Pint ARD (95%CI) P Pint ARD (95%CI) P Pint
MI, definite ST, stroke or TVR Non-Complex PCI –0.82% (–2.67 to +1.02) 0.38 0.54 –1.21% (–3.04 to +0.63) 0.19 0.92 –1.46% (–3.60 to +0.68) 0.18 0.14 +1.45% (–1.84 to +4.72) 0.39 0.97 Complex PCI –3.13% (–10.3 to +3.99) 0.39 –1.55% (–8.05 to +4.86) 0.64 –6.46% (–12.9 to –0.26) 0.04 +1.30% (–6.99 to +9.57) 0.76
Death, MI, definite ST, stroke or TVR Non-Complex PCI –0.89% (–2.82 to +1.03) 0.37 0.73 –0.96% (–2.94 to +1.03) 0.34 0.79 –1.10% (–3.72 to +1.50) 0.41 0.28 +0.39% (–3.46 to +4.24) 0.84 0.79 Complex PCI –2.20% (–9.47 to +5.01) 0.55 –0.05% (–6.71 to +6.55) 0.99 –5.72% (–13.8 to +2.11) 0.16 +2.14% (–8.05 to +12.48) 0.68
50
Definite stent thrombosis
Non-Complex PCI –0.18% (–0.50 to +0.14) 0.27 0.14 0.00% (–0.32 to +0.32) 0.99 n.a. –0.12% (–0.57 to +0.34) 0.59 n.a. +0.26% (–0.46 to +1.11) 0.51 n.a. Complex PCI –1.82% (–3.64 to +0.65) n.a. 0.00% (0.00 to 0.00) n.a. 0.00% (0.00 to 0.00) n.a. 0.00% (0.00 to 0.00) n.a.
Death for all causes
Non-Complex PCI –0.07% (–0.71 to +0.58) 0.84 0.13 +0.16% (–0.66 to +0.98) 0.70 0.09 +0.73% (–1.00 to +2.46) 0.41 0.61 -1.45% (–4.15 to +1.24) 0.29 0.93 Complex PCI +0.90% (–0.34 to +1.81) n.a. +2.81% (–0.19 to +5.62) n.a. –0.52% (–5.14 to +3.90) 0.82 -1.12% (–8.55 to +6.29) 0.77
TIMI major or minor
Non-Complex PCI –0.24% (–0.84 to +0.41) 0.46 n.a. +0.20% (–0.30 to +0.72) 0.45 0.27 +0.43% (–0.23 to +1.17) 0.22 0.22 +2.61% (+0.89 to +4.31) 0.003 0.89 Complex PCI 0.00% (0.00 to 0.00) n.a. +1.33% (–1.23 to +2.67) n.a. –0.47% (–1.70 to +0.84) 0.46 +3.04% (–2.97 to +8.82) 0.30
MI, definite ST, stroke TVR or TIMI
51 major/minor bleeding Non-Complex PCI –0.79% (–2.69 to +1.10) 0.41 0.53 –0.83% (–2.73 to +1.07) 0.39 0.84 –1.17% (–3.43 to +1.08) 0.31 0.10 +2.81% (–0.72 to +6.33) 0.11 0.83 Complex PCI –3.19% (–10.4 to +3.94) 0.38 –1.51% (–8.10 to +4.99) 0.65 –6.97% (–13.7 to –0.58) 0.04 +1.68% (–7.85 to +11.15) 0.73
HBR= high bleeding risk. ARD= Absolute risk difference. MI= myocardial infarction. ST= stent thrombosis. TVR= target vessel revascularization. Def/Prob= definite or probable. TIMI= thrombosis in myocardial infarction.
The absolute risk difference (ARD) and its 95% confidence interval are calculated according to Newcombe & Altman (2000).
52
Table 10: Clinical events according to the PRECISE-DAPT score and the complex patient criteria* among patients randomized to short vs. long DAPT duration
PRECISE-DAPT <25 (Non-HBR) PRECISE-DAPT ≥25 (HBR)
Short DAPT
Long DAPT
ARD P Pint Short
DAPT
Long DAPT
ARD P Pint
MI, definite ST, stroke or TVR Non-Complex Patient 3.38% 3.82% +0.43% (–0.87 to –1.73) 0.51 <0.001 4.29% 6.57% +2.28% (–1.33 to +5.92) 0.22 0.68 Complex Patient 7.38% 3.89% –3.50% (–5.31 to –1.70) <0.001 9.33% 10.4% +1.06% (–3.37 to +5.50) 0.64
Death, MI, definite ST, stroke or TVR
Non-Complex Patient 4.28% 4.69% +0.41% (–1.05 to +1.88) 0.58 0.008 7.56% 7.41% –0.15% (–4.73 to +4.41) 0.95 0.67
Complex Patient 8.20% 5.28% –2.92% (–4.93 to –0.93) 0.004 14.2% 15.5% +1.35% (–3.84 to +6.55) 0.61
MI, definite ST, stroke
Non-Complex Patient 0.80% 0.87% +0.07% (–0.60 to +0.73) 0.85 0.11 1.06% 3.58% +2.52% (+0.10 to +4.98) 0.04 0.73
53
Death, MI, definite ST, stroke
Non-Complex Patient 1.70% 2.02% +0.31% (–0.72 to +1.35) 0.55 0.55 5.07% 4.44% –0.63% (–4.51 to +3.22) 0.75 0.62
Complex Patient 2.76% 2.55% –0.21% (–1.55 to +1.13) 0.76 10.9% 11.8% +0.88% (–3.71 to +5.48) 0.71
Stent thrombosis
Non-Complex Patient 0.05% 0.05% 0.00% (–0.12 to +0.12) 0.99 0.14 0.00% 0.49% +0.49% (–0.18 to +0.97) n.a. 0.48
Complex Patient 0.56% 0.20% -0.36% (–0.83 to +0.10) 0.13 0.50% 0.60% +0.10% (–0.76 to +1.04) 0.83
Death for all causes
Non-Complex Patient 1.04% 1.24% +0.19% (–0.62 to +1.01) 0.64
0.55
5.05% 2.56% –2.49% (–6.14 to +1.09) 0.18
0.53
Complex Patient 1.05% 1.61% +0.57% (–0.38 to +1.51) 0.24 8.06% 7.21% –0.85% (–4.43 to +2.71) 0.64
TIMI major or minor
Non-Complex Patient 0.16% 0.42% +0.25% (–0.10 to +0.62) 0.16 0.49 0.80% 4.75% +3.95% (+1.33 to +6.66) 0.004 0.22
Complex Patient 0.57% 0.58% +0.01% (–0.60 to +0.61) 0.98 1.82% 3.60% +1.78% (–0.47 to +4.05) 0.12
MI, definite ST, stroke TVR or TIMI major/minor bleeding
54
Non-Complex Patient 3.53% 4.22% +0.70% (–0.65 to +2.05) 0.31 <0.001 5.18% 9.76% +4.58% (+0.38 to +8.86) 0.03 0.32
Complex Patient 7.73% 4.28% –3.45% (–5.31 to –1.59) <0.001 10.6% 11.9% +1.37% (–3.33 to +6.08) 0.56
* Complex Patient criteria: including both anatomical/procedural characteristics of complex PCI definition and/or a clinical presentation with acute coronary syndrome as an additional element
HBR= high bleeding risk. ARD= Absolute risk difference. MI= myocardial infarction. ST= stent thrombosis. TVR= target vessel revascularization. Def/Prob= definite or probable. TIMI= thrombosis in myocardial infarction.
55 Figure 1: BIOSCIENCE N= 2,119 DAPT duration 12 mo. COMFORTABLE N= 1,157 DAPT duration 12 mo. EXCELLENT N= 1,443 DAPT duration 6 vs. 12 mo. OPTIMIZE N= 3,119 DAPT duration 3 vs. 12 mo. PRODIGY N= 2,003 DAPT duration 6 vs. 24 mo. RESET N= 2,117 DAPT duration 3 vs. 12 mo. SECURITY N= 1,399 DAPT duration 6 vs. 12 mo. ZEUS N= 1,606 DAPT duration 1 to 12 mo.
PRECISE-DAPT pooled dataset
PRECISE-DAPT randomly allocated DAPT subgroup
DAPT duration not randomized
56 Figure 2: ≥3 Stents Implanted (11.6%) >60mm Total stent length (8.1%) CTO (2.0%) Bifurcation with 2 stents (8.0%) ≥3 Lesions Treated (4.6%) 3 Vessels treated (1.4%)
57
Figure 3:
Very low Low Moderate High
Complex PCI 727 735 811 845 ≥3 stents implanted 382 377 435 540 > 60mm total stent lenght 251 268 291 408 Bifurcation with 2 stents 303 318 324 246 ≥3 lesions treated 122 145 165 254 Chronic total occlusion 97 71 68 58 3 vessels treated 38 39 47 82 0 500 1000 1500 2000 2500 3000 3500 Complex PCI ≥3 stents
implanted > 60mm total stent lenght with 2 stents BifurcaGon ≥3 lesions treated Chronic total occlusion 3 vessels treated
High Moderate Low Very low
58 Figure 4: 0.00 0.05 0.10 0.15 0.20 Time (months) Cumulativ
e incidence of MI, def ST, stroke or TVR
Low−risk non−complex Low−risk complex High−risk non−complex High−risk complex 0 3 6 9 12 15 18 21 24 Time (months) 0.00 0.05 0.10 0.15 0.20 Time (months) Cumulativ
e incidence of MI, def ST, stroke or TVR
Low−risk non−complex Low−risk complex High−risk non−complex High−risk complex
0 3 6 9 12 15 18 21 24
Non-HBR / Non-complex PCI Non-HBR / Complex PCI HBR / Non-complex PCI HBR / Complex PCI 0.00 0.05 0.10 0.15 0.20 Time (months) Cumulativ e incidence 0 3 6 9 12 15 18 21 24
Non-HBR / Non-complex PCI 8981 8645 8446 8314 7571 4889 4593 3968 2032 Non-HBR / Complex PCI 2273 2105 2050 2000 1738 1156 1105 1017 582 HBR / Non-complex PCI 2863 2605 2495 2409 2191 1139 1066 968 381 HBR / Complex PCI 845 737 697 658 584 321 312 287 134
A
vs. vs. vs. vs. p<0.001 p<0.001 p<0.001 p<0.00159 0.00 0.05 0.10 0.15 0.20 Time (months) Cumulativ
e incidence of TIMI major or minor bleeding
Low−risk non−complex Low−risk complex High−risk non−complex High−risk complex 0 3 6 9 12 15 18 21 24 0.00 0.05 0.10 0.15 0.20 Time (months) Cumulativ
e incidence of MI, def ST, stroke or TVR
Low−risk non−complex Low−risk complex High−risk non−complex High−risk complex
0 3 6 9 12 15 18 21 24
Non-HBR / Non-complex PCI 8981 8805 8711 8653 7949 5212 4921 4290 2156
Non-HBR / Complex PCI 2273 2200 2181 2166 1926 1307 1264 1181 646
HBR / Non-complex PCI 2863 2663 2592 2528 2325 1250 1182 1089 392 HBR / Complex PCI 845 782 757 733 668 378 368 344 162
Time (months)
B
0.00 0.05 0.10 0.15 0.20 Time (months) Cumulativ e incidence Low−risk non−complex Low−risk complex High−risk non−complex High−risk complex 0 3 6 9 12 15 18 21 24Non-HBR / Non-complex PCI Non-HBR / Complex PCI HBR / Non-complex PCI HBR / Complex PCI vs. vs. vs. vs. p<0.001 p<0.001 p=0.50 p=0.11
60 Figure 5: 0.00 0.05 0.10 0.15 0.20 Time (months)
Cumulative incidence of MI, def ST, stroke or TVR
Very low BR – non-complex PCI Very low BR – complex PCI
Low BR – non-complex PCI
Low BR – complex PCI
Moderate BR – non-complex PCI Moderate BR – complex PCI High BR – non-complex PCI High BR – complex PCI
0 3 6 9 12 15 18 21 24
Very low BR/ Non-complex PCI 3013 2917 2846 2793 2556 1647 1550 1325 689 Very low BR/ Complex PCI 727 681 668 654 572 394 372 341 189 Low BR/ Non-complex PCI 3021 2918 2855 2822 2563 1705 1603 1387 715
Low BR/ Complex PCI 735 679 660 645 564 378 358 334 197
Moderate BR/ Non-complex PCI 2947 2810 2745 2699 2452 1537 1440 1256 628 Moderate BR/ Complex PCI 811 745 722 701 602 384 375 342 196 High BR/ Non-complex PCI 2863 2605 2495 2409 2191 1139 1066 968 381
High BR/ Complex PCI 845 737 697 658 584 321 312 287 134
61
B
0.00 0.05 0.10 0.15 0.20 Time (months)Cumulative incidence of TIMI major or minor bleeding
0 3 6 9 12 15 18 21 24
Very low BR – non-complex PCI Very low BR – complex PCI
Low BR – non-complex PCI
Low BR – complex PCI
Moderate BR – non-complex PCI Moderate BR – complex PCI High BR – non-complex PCI High BR – complex PCI
Very low BR/ Non-complex PCI 3013 2970 2934 2914 2688 1761 1664 1432 738 Very low BR/ Complex PCI 727 711 709 707 629 443 425 394 210 Low BR/ Non-complex PCI 3021 2968 2939 2924 2681 1808 1705 1486 753 Low BR/ Complex PCI 735 708 702 699 626 427 412 389 218 Moderate BR/ Non-complex PCI 2947 2867 2838 2815 2580 1643 1552 1372 665 Moderate BR/ Complex PCI 811 781 770 760 671 437 427 398 218 High BR/ Non-complex PCI 2863 2663 2592 2528 2325 1250 1182 1089 392 High BR/ Complex PCI 845 782 757 733 668 378 368 344 162
62
Figure 6:
Cumulativ
e incidence of MI, Def ST, stroke or TVR
Low risk of bleeding - Complex PCI
High risk of bleeding - Non-complex PCI High risk of bleeding - Complex PCI
0.00 0.05 0.10 0.15 Long DAPT Short DAPT 0 3 6 9 12 15 18 21 24 Low risk of bleeding - Non complex PCI
0.00 0.05 0.10 0.15 0 3 6 9 12 15 18 21 24 0.00 0.05 0.10 0.15 Time (months) 0 3 6 9 12 15 18 21 24 Cumulativ
e incidence of MI, Def ST, stroke or TVR
0.00 0.05 0.10 0.15 Time (months) 0 3 6 9 12 15 18 21 24 Cumulativ
e incidence of MI, Def ST, stroke or TVR
Low risk of bleeding - Complex PCI
High risk of bleeding - Non-complex PCI High risk of bleeding - Complex PCI
0.00 0.05 0.10 0.15 Long DAPT Short DAPT 0 3 6 9 12 15 18 21 24 Low risk of bleeding - Non complex PCI
0.00 0.05 0.10 0.15 0 3 6 9 12 15 18 21 24 0.00 0.05 0.10 0.15 Time (months) 0 3 6 9 12 15 18 21 24 Cumulativ
e incidence of MI, Def ST, stroke or TVR
0.00 0.05 0.10 0.15 Time (months) 0 3 6 9 12 15 18 21 24 Long DAPT 3255 3117 3082 3037 2644 1658 1521 1210 425 Short DAPT 3268 3129 3072 3017 2699 1623 1483 1185 395 Long DAPT 887 814 803 783 682 418 385 338 67 Short DAPT 881 776 767 745 655 373 339 293 58 689 628 619 603 473 232 209 175 48 661 602 594 582 464 251 234 190 52 219 183 179 169 138 66 66 58 11 221 187 183 174 149 82 77 65 9 0.00 0.05 0.10 0.15 high−risk complex Time (months) Cumulativ e incidence 0 3 6 9 12 15 18 21 24 0.00 0.05 0.10 0.15 high−risk non−complex Time (months) Cumulativ e incidence 0 3 6 9 12 15 18 21 24 0.00 0.05 0.10 0.15 low−risk complex Time (months) Cumulativ e incidence 0 3 6 9 12 15 18 21 24 0.00 0.05 0.10 0.15 low−risk non−complex Time (months) Cumulativ e incidence Long Short 0 3 6 9 12 15 18 21 24 ARD: –1.14%
95%CI –2.26 to –0.02 95%CI –7.71 to +0.06ARD: –3.86%
ARD: +1.45%
63 Figure 7: Long DAPT 3255 3187 3164 3145 2764 1767 1630 1310 442 Short DAPT 3268 3217 3183 3161 2859 1753 1612 1309 421 0.00 0.05 0.10 0.15 Time (months) 0 3 6 9 12 15 18 21 24 0.00 0.05 0.10 0.15
Low risk of bleeding - Non-complex PCI
Cumulativ
e incidence of TIMI major or minor bleeding
Long DAPT Short DAPT 0 3 6 9 12 15 18 21 24 0.00 0.05 0.10 0.15 0 3 6 9 12 15 18 21 24 0.00 0.05 0.10 0.15 Time (months) Cumulativ
e incidence of TIMI major or minor bleeding
0 3 6 9 12 15 18 21 24
Low risk of bleeding - Complex PCI
High risk of bleeding - Non-complex PCI High risk of bleeding - Complex PCI
0.00 0.05 0.10 0.15 Time (months) 0 3 6 9 12 15 18 21 24 0.00 0.05 0.10 0.15
Low risk of bleeding - Non-complex PCI
Cumulativ
e incidence of TIMI major or minor bleeding
Long DAPT Short DAPT 0 3 6 9 12 15 18 21 24 0.00 0.05 0.10 0.15 0 3 6 9 12 15 18 21 24 0.00 0.05 0.10 0.15 Time (months) Cumulativ
e incidence of TIMI major or minor bleeding
0 3 6 9 12 15 18 21 24
Low risk of bleeding - Complex PCI
High risk of bleeding - Non-complex PCI High risk of bleeding - Complex PCI
Long DAPT 887 845 833 816 720 459 427 384 70 Short DAPT 881 812 806 793 710 424 395 350 59 689 665 660 657 533 282 259 223 53 661 639 635 632 523 299 280 237 60 219 197 194 189 160 86 84 75 12 221 207 205 200 174 104 98 84 12 ARD: +0.12%
95%CI –0.25 to +0.50 95%CI –0.46 to +1.26ARD: +0.28%
ARD: +3.04% 95%CI –2.97 to +8.82 ARD: +2.61%
64 Figure 8: Bleeding * Ischemia † PRECISE-DAPT <25 PRECISE-DAPT ≥25 0 +1% +2% +3% +4% -4% -3% -2% -1%
Long DAPT better
(% Reduction of events with long DAPT)
Short DAPT better
(% Increase of events with long DAPT)
Non-complex PCI Complex PCI +3.04% p=0.30 +0.28% p=0.57 +2.61% p=0.003 +1.30% p=0.76 -3.86% p=0.05 +1.45% p=0.39 -1.14% p=0.04 +1.68% p=0.73 -4.05% p=0.04 +2.81% p=0.11 -0.91% p=0.12 NACE ‡ +0.12% p=0.53
Risk difference for long vs. short DAPT
PRECISE-DAPT <25 PRECISE-DAPT ≥25 PRECISE-DAPT <25 PRECISE-DAPT ≥25 pint 0.73 0.89 0.19 0.97 0.14 0.83
(Non-High bleeding risk)
(High bleeding risk)
(Non-High bleeding risk)
(High bleeding risk)
(Non-High bleeding risk)
(High bleeding risk)
Bleeding
*
Ischemia
†
0 +1% +2% +3% +4%
Long DAPT better
(% Reduction of events with long DAPT)
Short DAPT better
(% Increase of events with long DAPT)
Non-complex PCI Complex PCI +1.78% p=0.12 +0.01% p=0.98 +3.95% p=0.004 +1.06% p=0.64 -3.50% p<0.001 +2.28% p=0.22 +0.43% p=0.51 +1.37% p=0.56 -3.45% p<0.001 +4.58% p=0.03 +0.70% p=0.31 NACE ‡ +0.25% p=0.16
Risk difference for long vs. short DAPT
PRECISE-DAPT <25 PRECISE-DAPT ≥25 pint 0.49 0.22 <0.001 0.68 <0.001 0.32 +5% –5% –4% –3% –2% –1%
(Non-High bleeding risk)
(High bleeding risk)
PRECISE-DAPT <25 PRECISE-DAPT ≥25
(Non-High bleeding risk)
(High bleeding risk)
PRECISE-DAPT <25 PRECISE-DAPT ≥25
(Non-High bleeding risk)
(High bleeding risk)
A
B
Non-complex Patient Complex Patient
65 Figure 9: -8 -7 -6 -5 -4 -3 -2 -1 0 1 2 3 4 5 6 7 8 Short DAPT better Long DAPT better
Overall PRECISE-DAPT <25 PRECISE-DAPT ≥25 Overall PRECISE-DAPT <25 PRECISE-DAPT ≥25
TIMI major or minor bleeding MI, Def ST, stroke or TVR
Pint : 0.93
Non-Complex 1 Element of complexity ≥2 Elements of complexity
Pint : 0.21 Pint : 0.98 Pint : 0.58 Pint : 0.16 Pint : 0.27
R is k d iffe re n c e fo r lo n g v s . s h o rt D A PT