ALMA MATER STUDIORUM - UNIVERSITA’ DI BOLOGNA SCUOLA DI SCIENZE
Corso di Laurea Magistrale in Biologia Marina
Seasonality and diel variation in blue whale D calls recorded
in the Southern California Bight
Tesi di laurea in
Adattamenti degli animali all’ambiente marino
Relatore Presentata da Prof. Elena Fabbri Chiara Gambini
Correlatore Dr. Ana Širović
III sessione
TABLE OF CONTENTS
1. Introduction 1.1 Threats 1.2 Biology
1.3 Why do they migrate? 1.4 World subspecies
1.5 North Pacific blue whales and the northeastern stock 1.6 Cetacean research methods
1.7 Bioacoustics
1.8 Blue whale acoustics
1.9 The purpose of the research
2. Materials and methods 2.1 Study area
2.2 Acoustic data collection 2.3 Data processing
2.4 Manual detection vs. automated detection of calls 2.5 A generalized power-law (GPL) detector
2.6 How to run a detector 2.7 The GPL review 2.8 Effort
2.9 Statistical analysis
3. Results
3.1 Calls seasonality
3.2 Interannual abundance of D calls (2007-2012) 3.3 Diel pattern of D calls
4. Discussion
4.1 The seasonality of blue whale D calls
4.2 The interannual abundance of blue whale D calls 4.3 The diel pattern
1. INTRODUCTION
The blue whale (Balaenoptera musculus, Linnaeus, 1758) is a cosmopolitan species that inhabits all the world’s oceans. This species has been hunted nearly to extinction in some parts of the world during modern commercial whaling that started in the early 1900s. These animals were most interesting for the whalers because of their massive size and the consequent availability of oil coming from their blubber. This oil had a high commercial value. Hunting of baleen whales was almost impossible before some specific tools had been developed. Since blue whales are fast swimming, only steam catcher boats and explosive harpoons can make the goal. An extensive overexploitation led the International Whaling Commission to the protection of these mammals in the mid 20th century although illegal Soviet whaling pursued this slaughter for a while after that (e.g. Donovan, 2007). Blue whales have been protected internationally since 1965 (Leatherwood et al. 1983). As a result of the management and the conservation, blue whales are still found in all major oceans. The International Whaling Commission (IWC) has set at zero catch limits for all commercial whaling since 1986 (Baker and Palumbi, 1994). However, this moratorium does not apply to Iceland, Norway or the Russian Federation, which have disputed this provision.
Blue whale hunting started in the North Atlantic in 1868 and spread to other regions around 1900 after the northeastern Atlantic populations had been severely reduced.The Antarctic and the North Atlantic populations were probably depleted to the low hundreds by the time whaling ceased, but are increasing (Link 1).
Concerning the North Pacific, a conspicuous amount of blue whales was caught from 1905 to 1971 (Monnahan et al., 2014). In the northeastern Pacific Ocean, the hunts were great off Alaska, Baja California and Mexico. Japanese, Russian, American and Canadian whalers regularly hunted in the Gulf of Alaska (Pike,1954; Berzin and Rovnin, 1966; Nishiwaki, 1966; Mizroch et al., 1984; Brueggeman et al.,1985; Gregr et al., 2000). Blue whales in the eastern North Pacific were primarily killed by commercial whalers through 1966 in British Columbia and Alaska waters (Pike and McAskie, 1969; Rice, 1974; Gregr and
Trites, 2001) and relatively few were taken from whaling stations off California (Rice, 1974; Clapham et al., 1997).
The U.S. Marine Mammal Protection Act now considers the NE Pacific population as depleted and strategic (MMPA; Carretta et al., 2012).
With the end of blue whales commercial whaling, scientists focused their research and conservation efforts on assessing populations, separated from both the biological side and the geographic one (Donovan, 1991; Hucke-Gaete et al., 2004; NMFS, 1998; Sears, 2002) or considering the Antarctic population as a whole (Branch, 2007; Branch et al., 2004), although we are almost sure that more than one population inhabits world waters and perhaps as many as six (e.g. Donovan, 1991).
In 2008 blue whales were listed as endangered by the IUCN. Although there are uncertainties over present abundance, the total population has been depleted by at least 70%. The dominant contribution to the reduction in the global population is the massive reduction of the formerly very large Antarctic population. For that reason, the Antarctic blue whale (B.m. intermedia) subspecies is treated separately as Critically Endangered due to a reduction of over 97% (Link 1).
1.1 THREATS
The main threat to blue whales in the past was direct exploitation. Nowadays, according to the National Marine Fisheries Service (NMFS, Link 2), blue whales are subject to some ship strikes and entanglements but reported cases are few. Basically, struck whales may go misidentified or undetected, since carcasses initially sink (Cassoff et al., 2011). The documented values, so, likely provide an underestimate of actual ship strikes. It is important to note, then, that sometimes a death can go unrecognized as a ship strike because collisions do not always cause external damage and the carcasses could sink before being noticed (Laist et al., 2001). Cetacean species are known to be affected by human activities. Local populations that inhabit waters with significant levels of human activity may be threatened by disturbance from vessel traffic, including ship noise, chemical pollution and fishery interactions.
Given that the mortality of Eastern North Pacific (ENP) blue whales is most likely linked to collisions between whales and vessels (“ship strikes”; Carretta et al., 2012), speed restrictions were implemented in southern California, even if they have been unfortunately ineffective in decreasing vessel speeds (McKenna et al., 2012). The Santa Barbara Channel is the most risky area: blue whales feed over there and shipping lanes intersect those areas, making fatal collisions unavoidable. Redfern et al. (2013) reported an average per year of 1.8 blue whales strikes in 2005-2010.
The global climate change is likely to cause some life changes of these animals. During this century, for instance, a considerable reduction in the Antarctic sea ice extension is expected, and possibly a total disappearance in summer, since mean temperatures in that area are higher than the global average (Turner et al., 2006). The implications of this for blue whales are unclear but warrant monitoring.
1.2 BIOLOGY
Taxonomically, mysticetes are divided into three families: Balaenidae, Eschrichtiidae and Balaenopteridae. Blue whales are rorquals (family Balaenopteridae), a family that includes the Humpback whale (Megaptera novaeangliae), the Fin whale (Balaenoptera physalus), the Bryde’s whale (Balaenoptera edeni), the Sei whale (Balaenoptera borealis) and the Minke whale (Balaenoptera acutorostrata). Blue whales only really appear blue when seen through the water: in air their bodies are more aptly described as a gunmetal colour, with a variable mottling of lighter grey spots scattered over the back and flanks. The dorsal fin seems disproportionately small and is often sloped back with a rounded tip. The head of a blue whale, if seen from above, is much blunter in outline than that of other rorquals, with a distinctively rounded tip to the snout. When the animal dives, the flukes are often lifted clear of the water, although they are not usually hoisted vertically. Blue whales are the largest animals on earth, growing up to 33 m in length and weighing up to 172 metric tons (Yochem and Leatherwood, 1985). They are widely distributed in both hemispheres, frequenting Arctic and Antarctic waters in the respective summer seasons, and moving to the warmer subtropics and tropics during the winters. Blue whales are
selective consumers of krill (a few species of euphausiids), with a need of massive quantities per day, up to 2 metric tons (Rice, 1978). In addition to this huge stock of food, the blubber, in form of lipids, supplies energy during long-term periods of fasting. Many euphausiids undertake diel vertical migrations from several hundred meters depth during the day to near the surface at night. Many species are also known to occupy most of the vertical and horizontal extent of particular water masses, the size, kinetics and climate of which are of clear adaptive importance (Brinton, 2003). The occurence of animals is affected not only by the spatial property of the environment, such as the dimensions of the habitat, but also by temporal change, so the period of the changes taking place in it. Baleen whales expend extensive energy during lunge feedings (Goldbogen et al., 2001; Goldbogen et al., 2006), which are short dives relative to their large body size. The net energy gain, however, is larger than the energy loss during these short dives (Goldbogen et al., 2011). Body size is one of the most important determinants of metabolic rate, digestive efficiency and total caloric requirements (Peters,1983; Schimdt-Nielsen, 1984). Such physiological constraints can have a strong influence on diet, which may ultimately shape most aspects of ecology and behavior.
The Mysticeti (baleen whales) are different from Odontoceti (toothed whales) in having their own morphology and life history due to their filter features feeding. Blue whales confirm the traditional and accepted assumption about the seasonal migration, being clearly capable of long-range movements in search of prey. On feeding grounds, the prey distribution and its availability influence activities of both juvenile and adult individuals. On breeding grounds, it is more likely to believe that potential mates and potential competitors for mates are the key to influence the presence of sexually mature animals.
Mysticetes forage primarily on planktonic or micronectonic crustaceans (e.g. krill) or small pelagic fish found at relatively shallow depths. Krill has become a synonymous with euphausiid. The term “euphausiid” is commonly used for all members of the crustacean order Euphausiacea. The word Euphausia derives from greek eu for good or true, combined with –phausia for shining or light emitting. Early naturalists were impressed by the brightness of the photophores of these small animals, tipically arranged in pairs on the eyestalks and bases of
thoracic limbs 2 and 7, and as single photophores located mid-ventrally on abdominal segments 1-4.
Mysticete feeding dives are not known to exceed 500 m (Panigada et al., 1999). Mysticetes have evolved three different strategies for feeding efficiently on small prey, (a) skimming, (b) engulfment feeding (including lunging), and (c) suction feeding. These strategies are reflected in characters of the baleen, mouth, tongue and the method by which the mouth is expanded (Heyning and Mead, 1996; Werth, 2000a). (a) Some whales may skim the surface of the water while keeping their mouth open to capture prey at or near the top of the water. This is the feeding habit for Balaenids and they have unique anatomical adaptations to reach the goal. They are continuous filter feeders. (b) A method may include simply swimming through schools of krill with their mouth open while capturing their prey in the baleen bristles then pushing the water out of their mouth with their tongue before swallowing their prey whole. Rorquals feed in this way, they have several anatomical adaptations as well. They are intermittent filter feeders. (c) Suction feeding, instead, is a method of ingesting prey item in fluids by sucking the prey into the predator’s mouth thanks to the pressure difference resulting between the inside of the mouth and the outside environment. Baleens are keratinized structures. The external edge is smooth and slightly concave, the internal one is convex and fringed into bristles. The orientation of baleen is slanting compare to the longitudinal axis of the skull. In this way, bristles can overlap to the edge of the adjacent one, forming a dense network. Rorquals (Balaenopteridae) are fast, streamlined swimmers with shorter and coarser baleen that employ engulfment feeding, a method of prey capture, in which large volumes of water and prey are taken in. In Balaenopteridae, baleens run along the entire perimeter of the jaw. The number of baleens varies and is related to the feeding strategy and the diet, which are specific to each species. The mouth of all rorqual species is enormous, occupying most of the anterior half of the body. All members of this family have 70-80 external grooves in the ventral wall of the mouth and throat. During feeding the grooved mouth floor is opened and the pleats extend to increase vastly the volume that can be contained within the mouth.
In both hemispheres, extreme seasonal variations in the abundance of high-latitude prey forces large mysticetes to meet their total annual food requirements in just 4-6 months of intensive feeding, then abandon their feeding areas during
the dark, cold months of winter when prey are scarce or not available at all in the near surface layers.
All cetaceans are characterized by a complex stomach with multiple divisions that resemble those of ruminants. The four main compartments are (1) a forestomach, which is devoid of glands and lined by keratinized stratified squamous epithelium; (2) a fundic chamber or main stomach with a folded mucosa and gastric glands; (3) a connecting stomach, between the main stomach and the piloric one; and (4) a relatively smooth pyloric stomach, which may be bent on itself or show several dilations and which has some glands in its walls. The organization of cetacean stomach differs from that of ruminants. In whales, only the initial chamber is nonglandular (vs the first three chambers of the ruminant stomach) (Olsen et al., 1994).
The cetacean forestomach is homologous with the rumen, reticulum, and omasum of ruminants and is where digestion is initiated. The forestomach of baleen whales often contains stones and pebbles of various sizes, which, with the powerful contractions of the muscular walls, help to grind fish bones and crustaceans. Additionally, high concentrations of volatile fatty acids and anaerobic bacteria have been observed in the forestomach of baleen whales as well as toothed whales, indicating that microbial fermentation occurs here as it does in the rumen (Oleson et al., 1994).
The fundic chamber is equivalent to the fundic portion of the simple mammalian stomach or to the abomasum of ruminants. Its gastric glands contain parietal and chief cells, which produce a gastric juice containing pepsin, hydrochloric acid, and some lipase. The forestomach and main stomach of a blue whale can hold up to 1000 kg of krill. The connecting stomach acts as a third chamber, separated from the main and pyloric chamber by sphincters. It is lined with a glandular mucus-secreting mucosa that is thought to protect the epithelium from mechanical damage and to facilitate transport of digested food through the channel.
The pyloric chamber is equivalent to the pyloric region of the abomasum of ruminants. It is lined by columnar mucous cells. Gastric digestion continues in this chamber and much of the solid food is broken down before it passes through the connecting channel. A narrow pylorus leads into the duodenum, the first part
of which is sometimes markedly dilated and called the duodenal ampulla. This allows further digestion of food before it reaches the duodenum proper, indicating that enzymatic digestion may have a greater significance in cetaceans compare to ruminants (Oleson et al., 1994).
1.3 WHY DO THEY MIGRATE?
Corkeron and Connor (1999) wanted to investigate about one of the oldest mysteries in the baleen whales life: the reason why they undertake seasonal migrations into biologically unproductive waters as, contrariwise, it is easily understood why these animals prefer to use polar feeding grounds (Norris, 1967; Laws, 1985; Tynan, 1998). As Norris considered, there should be a relevant motivation whereby, even if migrating is physiologically demanding and energy loosing, it worths compared to the alternative of staying in the same area. Among the most popular hypotheses there is that one proposed by Brodie (1975). It holds that baleen whales optimize energy budgets by traveling to warm waters during the winter, when conditions to survive are less favorable at high latitudes, such as prey availability and temperature. Another interesting hypotesis imposes that parturition is the main force which drives the migration. From Eberhardt and Norris (1964) and Pacheco (1998) it appears likely that the hardest moment for calves includes the first couple of weeks postpartum. We should think about which benefits females receive from giving birth in warmer waters at lower latitudes, as, for instance, more grand-offspring. An explanation may be offered by the calf thermoregulation, namely saying that newbornes at lower latitudes can preserve energy, given that they do not need to warm up as those one at higher latitudes who live in cold waters. This stock of energy can be expended for growth. This assumption would have a meaningful consequence in terms of higher reproductive success because of the larger size in adulthood. Such correlations between offspring development and increased reproductive success exist in terrestrial taxa (Trivers and Willard, 1973; Clutton-Brock et al., 1982). Higher reproductive success can result from either (for larger females) enhanced ability to bear offspring that survive to recruitment, or (for larger males) increased competitive ability within the mating system. The survivorship could be a second reasonable hypothesis had been suggested previously by Payne (1995). The
migration evolved as a predator-avoidance strategy. The predator taken into account is Killer whale (Orcinus orca). Since this hypothesis remained undeveloped, Corkeron and Connor in their summary found interesting to provide a following concept. They suggested that the risk of predation on newborn calves from high-latitude killer whales is sufficiently greater than the risk from warm-water predators to favor migration to the tropics for parturition. Killer whale (Orcinus orca) has been the unique mysticetes predator mentioned because the only one which live also in polar waters, rather than the great white shark (Carcharodon carcharias), tiger shark (Galaeocerdo cuvier) and false killer whale (Pseudorca crassidens). It is true that tiger sharks and false killer whales inhabit tropical waters but Corkeron and Connor believe them predators less risky, however, than killer whales. To support the predation hypothesis advanced by Corkeron and Connor the main assumption is that the abundance of transient-type killer whales (which feed on marine mammals, Bigg, 1982) is sufficiently low in low latitudes to minimize the probability of predatory encounters in winter. I agree with Clapham’s belief (2000) that any theory of whale migration must focus on the costs and benefits to individuals and life history differences among age and sex classes.
1.4 WORLD SUBSPECIES
Currently, blue whales are divided into four subspecies based on morphologic and geographic distinctions (Rice, 1998). Some features helped to subdivide cetaceans into populations. The request to establish recovery plans has become more and more essential for endangered species (Gambell, 1979; Donovan, 1991; Reeves et al., 1998).
Scientists suspect that B.m. musculus, B.m. intermedia, B.m. brevicauda and B.m. indica are the subspecies living worldwide. Blue whales found at high latitudes during summer in the North Atlantic and North Pacific have been named B.m. musculus (Linnaeus, 1758). Although B.m. musculus were described from the North Atlantic, blue whales in the North Pacific were assumed to be similar based on limited visual observations and some comparative lenght data. B.m. intermedia is the high latitude Southern Ocean and Antarctic waters blue whale.
It is the largest form and they migrate to the Antarctic zone during the austral summer (Williams and Donovan, 2007). B.m. brevicauda, the pigmy blue whales, are distributed in Sub-Antarctic waters of the Indo-Pacific Ocean and southeastern Atlantic Ocean (Zemsky and Sazhinov, 1994; Kato et al., 2002). B.m. brevicauda was first described by Ichihara (1966) from fishery specimens taken near Kerguelen Island in the southern Indian Ocean. Pygmy blue whales probably extend also into regions of the southeast Atlantic, southwest and southeast Pacific (Branch et al., 2007; Gill, 2002; Rice, 1998). It may also be that the blue whales sighted near the Maldives, Sri Lanka and within the Arabian Sea are pigmy blue whales (Anderson, 2005; Zemsky and Sazhinov, 1982). B.m. indica, indeed, has sometimes been used in reference to blue whales from the northern Indian Ocean but the biological features that apparently distinguish these whales from the other blue whales subspecies are undocumented (Rice, 1998). Mikhalev (1966) regarded them as Pygmy blue whales and not significantly different from Pygmy blue whales in the southern Indian Ocean.
1.5 NORTH PACIFIC BLUE WHALES AND THE NORTHEASTERN STOCK Blue whales occur in waters along the entire west coast of North America from the eastern tropical Pacific north to the Gulf of Alaska (Mizroch et al., 1984; Stafford et al., 1999a; Stafford, 2003). Acoustic data point to several geographic populations of blue whales in the North Pacific (McDonald et al., 2006). Based on catch distribution along with results from tagging studies, several authors have proposed that blue whales found on summer feeding grounds off northern Japan, the Kuril Islands and Kamchatka comprised a western stock that was geographically separated from a central stock in the North Pacific (Ivashin and Rovnin, 1967; Nishiwaki, 1966; Ohsumi and Masaki, 1975; Omura and Ohsumi, 1964). The western stock was thought to migrate in winter to waters as far south as Taiwan, while the central stock was thought to winter in waters north of Hawaiian Islands (Berzin and Vladimirov, 1981; Northrop et al., 1971; Thompson and Friedl, 1982). Results from distribution, photo-identification and acoustic studies suggest the occurrence of an eastern North Pacific population of blue whales. Studies conducted off Baja California, California, Oregon and Washington (during summer and autumn) provided a seasonal population size at
between 2000 and 3000 blue whales (Calambokidis and Barlow, 2004). Areas of concentrations include the Costa Rica Dome (an upwelled oceanographic feature located approximately 300-400 km west of Central America), the Gulf of California and the Pacific waters of Baja California and California (Friedler, 2002; Reilly and Thayer, 1990; Rice, 1992). Blue whales largely conform to the migratory assumption with feeding areas extending from California to the Gulf of Alaska (Stafford et al., 2001, Stafford, 2003; Burtenshaw et al., 2004) and winter breeding grounds near Mexico (Thompson et al., 1996) and the Costa Rica Dome (Stafford et al., 2001). Mother and calf pairs inhabit the Gulf of California and the Costa Rica Dome and it is likely that both regions serve as important breeding and calving habitats (Gendron, 2002; Pitman et al., 2007). Eastern North Pacific blue whales migrate in summer from Central American and Mexican waters to feeding grounds off California (Calamboidis et al., 1990; Mate et al., 1999). During this season most of the population appears to be off Central California, in productive upwelling waters between the California Channel Islands and Monterey Bay. Despite that, photographic matches of California blue whales off Canada and Alaska show that at least some individuals migrate beyond California to feeding areas between Vancouver Island, Canada, and the Gulf of Alaska (Calambokidis et al., 1998; McDonald et al., 1995; Stafford and Fox, 1995). Blue whales have been sighted at the Costa Rica Dome year round; it is not known if some of these whales represent a non-migratory segment of the eastern north Pacific population or if they are members of a Southern Hemisphere population (Reilly and Thayer, 1990).
Although the International Whaling Commission (IWC) has formally considered only one population of blue whales in the North Pacific (Donovan, 1991), there is evidence for a more complex population structure. Blue whales in the North Pacific probably exist in two sub-populations. Scientists have been proposed: the eastern (ENP) and the western (WNP) North Pacific blue whale populations. The Eastern stock is believed to spend winters off of Mexico and central America, and feed during summer off the U.S. West Coast and, to a lesser extent, in the Gulf of Alaska and central North Pacific waters. The Western stock appears to feed in summer in the southwest of Kamchatka, south of the Aleutians, and in the Gulf of Alaska (Stafford, 2003; Watkins et al., 2000). In winter, they migrate to lower
latitudes in the western Pacific and, less frequently, in the central Pacific, including Hawaii (Stafford et al., 2001).
Stafford et al. (2001) noted that North Pacific blue whales can be divided into putative eastern and western populations based on differences in acoustic call types, but found geographic overlap in these call types, in the central North Pacific. The distinctiveness of the ENP population comes from demonstrated links among the eastern Tropical Pacific, Gulf of California, and Gulf of Alaska from satellite tags and photographic identification (Mate et al., 1999; Calambokidis et al., 2009a; Bailey et al., 2010) and genetic links between blue whales in the Gulf of California and the west coast of the United States (Costa-Urrutia et al., 2013), although no genetic analyses have been performed on blue whales in other regions. Taken together, these studies provide evidence that a single population occupies the entire eastern North Pacific.
Eastern Pacific blue whales feed almost exclusively on swarms of euphausiids, primarily Euphausia pacifica and Thysanoessa spinifera (Croll et al., 2005; Croll et al., 1998; Yochem and Leatherwood, 1985). Dense swarms of E. pacifica and T. spinifera are associated with upwelling centers like the Channel Islands, Monterey Bay and the Gulf of Farallones/Cordell Bank (Croll et al., 2005; Croll et al., 1998; Fiedler et al., 1998; Schoenherr, 1991; Smith and Adams, 1988) and, therefore, blue whales tend to congregate in these highly productive areas (Calambokidis and Barlow, 2004).
The larger and more coastal T. spinifera is tipically found at daytime depths of 50-150 m over the shelf, although it will form swarms at the surface, possibly related to reproduction (Schoenherr, 1991; Smith and Adams, 1988). E. pacifica is typically found at the shelf edge and extending off it at typical daytime depths of 200-400 m (Brinton, 1976). Both species undergo significant vertical migrations to the surface at night (Bollens et al., 1992; Brinton, 1962; 1976; 1981; Greenlaw, 1979).
1.6 CETACEAN RESEARCH METHODS
Modern research techniques do not require killing a whale to learn about its biology and behavior. All information required for the conservation and
management of whale populations can be obtained from non-lethal research methods. Some of non-lethal research techniques are detailed below.
Acoustic research methods
Research on cetacean acoustics is particularly well-suited to overcome many of the difficulties of working in harsh environments and has enormous potential to help understand the role of cetaceans in ecosystems. Many cetaceans are highly vocal and produce species-specific and sometimes population-specific sounds (i.e. calls). Underwater sound travels large distances allowing identification of the species present, potentially enabling locating and tracking individuals, identifying populations from regional dialects, and determing pattern of seasonal distribution and relative abundance.
Molecular methods
Molecular methods can provide information about important aspects of cetacean biology such as age, population size and structure, and population demographics. The collection of this information (especially age) is often used as a justification to kill whales but modern advances allow for the collection of this information from live whales. Two different non-lethal ageing methods have been researched extensively. These are: the analyses of lipids (which are naturally-occurring molecules which includes fats, waxes, sterols and fat-soluble vitamins) and of nucleic acids (DNA and RNA) in either skin or blubber sampled by biopsy darts from live whales. Development of these techniques is continuing and progress on accurately ageing whales is well-advanced.
Genetics
Genetic analyses can be used to identify and sex individuals, trace relationships among individuals, determine population boundaries and structure. Genetic analyses are also an important component of any monitoring and compliance regime in the regulation of whaling if the moratorium on commercial whaling is ever lifted. These types of analyses can also be used to trace whale meat sold from commercial, scientific or illegal whaling sources back to the individual, population or species of origin, and thus aid in the detection of illegal trade in whale products.
Observations
Visual surveys of cetaceans are undertaken from land, sea and air platform. In addition, photographs of individual whale flukes or fins, which are unique to each individual are catalogued to investigate questions such as migration patterns and population size. This information assists in determing recovery rates from past over-exploitation, identifying whale migration routes and individual fidelity to breeding and feeding sites.
Unfortunately, these techniques are limited to time periods when visual surveys are feasible, such as during daytime periods and favorable ocean conditions. This is, then, an expensive way to monitor cetaceans over vast temporal and spatial scales.
Satellite tagging
The development of satellite tags is important for the tracking of whales. These tags transmit their location to satellites orbiting the Earth that provide daily positions and have enough battery power to provide tracking information for several days. The tracking data can also help with the management of human-whale interactions and threatening processes, and particularly to the economically significant whale watching and oil and gas industries.
1.7 BIOACOUSTICS
Bioacoustics is a cross-disciplinary science that combines biology and acoustics. Usually it refers to the investigation of the sound production, dispersion and reception in animals. This involves neurophysiological and anatomical basis of sound production and detection, and relation of acoustic signals to a transmission medium (solid, liquid o gas) that can propagate energy waves, they disperse through. The findings provide clues about the evolution of acoustic mechanisms, and from that, the evolution of animals that employ them.
Two uses of acoustics have been developed for studying marine mammals population and behavior. Active acoustics uses sound generated actively by transducers and the acoustic scattering properties of animals to image individuals and populations. This method has mostly been used for the study of cetacean
prey. Passive acoustics relies on listening to the sounds produced by animals with a hydrophone to infer their distribution and behavior. Passive acoustics is limited to species that produce sounds and to the times and places where they produce them.
Many cetacean species can be identified by their specific calls. The localisation of whales from their sounds in their habitats was initiated in the 1970s. Advances in electronics, computers and numerical analysis now make the Passive Acoustic Monitoring (PAM) techniques an useful tool for mapping the presence and the distribution of whales over ocean basins and assessing their densities. PAM’s success first depends on the capacity to detect and isolate the target signals from the rest of the sounds in which they are embedded, especially for distant sources and low signal to noise ratios. The acoustic signal source level, propagation loss and local background levels determine detection ranges. Moreover, cetaceans sounds vary considerable in time-frequency, from infrasonic calls of baleen whales to ultrasonic clicks of toothed whales, and in amplitudes among species and within a species’ vocal repertoire. The ocean noise level also exhibits considerable variability in space and time, in response to fluctuating natural sources, such as wind, ice, rain, sounds produced by various organisms and anthropogenic sources such as shipping.
Passive Acoustic Monitoring (PAM) refers to the use of hydrophones to detect, monitor and localise vocalising marine mammals. A hydrophone is a microphone designed to be used underwater for recording or listening to underwater sound. Most hydrophones are based on piezoelectric transducer that generates electricity when subjected to a pressure change. Such piezoelectric materials can convert a sound signal into an electrical signal since sound is a pressure wave. Multiple hydrophones can be arranged in an array so that it will add from the desired direction while subtracting signals from other directions.
1.8 BLUE WHALE ACOUSTICS
Baleen whales are known to produce a wide variety of sounds that are probably used for communication (Reysenbach de Haan, 1996; Evans, 1967; Winn and Perkins, 1976; Thompson et al., 1979). As Payne (1995) claimed, ocean
conditions, such as scarce visibility and great extent of waters, make the communication through acoustic calls an useful method because they can reach individuals dispersed in the entire environment. Through the time, several scientists advanced hypotheses to decode the biological functions of these sounds. Payne and Webb (1971) theorized that low-frequency sounds from blue and fin whales might be used to communicate with other members for up to hundreds of kilometers. If their hypothesis is true, the communication could occur at different levels, namely the meaning could depend on the sex of the vocalizing animal. If the sound, for example, is only produced by males, it could serve a reproductive function. Clark and Ellison (2003) emphasized that the primary function can be followed by a second one, for example, the echo-ranging. That said, so, the capability to communicate for most baleen whale species involves social behavior understanding and reproductive success.
Calls of baleen whales have been classified into three groups by Clark (1990): (1) simple calls, which are usually low-frequency (<1000 Hz), frequency modulated signals; (2) complex calls which are broadband signal ranging from 500 to 5000 Hz; and (3) clicks, knocks, or grunts usually of short duration and variable frequency.
Blue whale calls can be distinguished by their relatively long duration (10-20 s) and very low frequency (20-100 Hz) calls (Cummings and Thompson, 1971; Edds, 1982; McDonald et al., 1995; Stafford et al., 1998; McDonald et al., 2006). To further support the idea whereby geographically separate blue whale populations have different acoustic displays there is the knowledge of own frequency, duration and repetition interval features observed studying spectrograms (McDonald et al., 2006).
Blue whale vocalizations recorded worldwide, from the Atlantic, to the Indian and off Southern Cile, show all different patterns from each other and the North Pacific stands out also from the northwest Pacific with its unique pattern (Cummings and Thompson, 1971; Edds, 1982; Alling et al., 1991; Clark and Fristrup, 1997). Blue whale sounds recorded in the northeastern and northwestern Atlantic are similar (Charif and Clark, 2000) suggesting a single acoustic blue whale population in the North Atlantic. In the North Pacific, they have two distinct call types (Stafford et al., 2001). Apparently, there is not the basin-wide similarity which occurs in the
Atlantic. Blue whales, then, produce a single call-type with uniform acoustic characteristics around the Antarctic (Ljungblad et al., 1998; Matsuoka et al., 2000; Clark and Fowler, 2001).
Some blue whales produce long series of sequences for many days (Tyack and Clark, 2000), referred to as a song.
Four unique sounds have been described from the eastern North Pacific population of blue whales (Thompson, 1965; Thompson et al., 1996; Thode et al., 2000; McDonald et al., 2001). Among four different types of calls made by blue whales in the northeastern Pacific, the most common are a pair of calls labeled as A and B (Thompson et al., 1996). The A call is pulsive with a fundamental frequency of about 16 Hz and a duration of 18 s. The second, named B call, usually following the first, is slightly down-swept with a duration of 17-18 s. It has a fundamental frequency at 16 Hz, although most energy is generally found at 48 Hz, contained in the third harmonic of the call. Individual animals are found to produce alternating sequence of A and B calls, pattern which McDonald et al. (2006) classified as a song. From the literature we know the same do humpback and fin whales. Oleson et al. (2007) found some significant differences concerning start and end frequencies both between singular A and song and between singular B and song. The most common call pattern recorded from blue whales in the northeastern Pacific is a series of alternating A and B calls (AB AB AB AB AB AB). At times, however, one A call can be followed by multiple B calls (ABBBBB ABBB ABBBBB). A third call, C, is a short (9 s) upswept call (11-13 Hz) that precedes the B call, described as a low-frequency precursory component. This precursor is commonly seen when the signal-to-noise ratio is high. It is relatively consistent in frequency and duration when present. The fourth call, labeled as type D, is a higher-frequency downsweep from 80 to 30 Hz, lasting 1-4 s. The character of the type D call can be quite variable, and is not produced in such a regular pattern as the type A-B calls.
Fig.1: Balaenoptera musculus. Pulsed A and tonal B call pairs occurring in a repeated song sequence (Oleson et al., 2007).
Fig.2: Balaenoptera musculus. A composite spectrogram of two separate recordings of type D calls illustrating the variability.
D calls appear to be commonly produced by different blue whale populations (Rankin et al., 2005). Oleson et al. (2007), through an interesting study, revealed that there is a relationship between call production and behavior. First, the behaviors associated with singular A and/or B calls were different from those associated with song. AB calls are only produced by males, with song produced by lone, traveling blue whales, and singular AB calls typically produced by males in pairs or grouped. There was at least one additional blue whale. Besides, D
Fre q u e n c y (Hz ) Time (s)
calls, as opposed to AB calls, were heard from both sexes during foraging, commonly from individuals within groups. An interesting detail to mention regards the specific moment D calls were heard, that is prior to the pair separating and when they joined together, suggesting there might be a social function related with these vocalization types. The sex bias evident in AB callers suggests that these calls probably play a role in reproduction, even though the calls are produced year-round. All calls are produced at shallow depth and calling whales spend more time at shallow depths than non-calling whales, suggesting that a cost may be incurred during D calling, as less time is spent feeding at deeper depths.
1.9 THE PURPOSE OF THE RESEARCH
This study is part of research being conducted by Dr. Širović at the Scripps Institution of Oceanography (University of California, San Diego). Data used in this study have been collected in the Southern California Bight (SCB). The SCB is the oceanic region south of Point Conception, north of San Diego, and northeast of the Rosa Ridge that San Nicholas Island sits on. First of all, conventionally the SCB is considered part of the US West Coast upwelling current system. However, the circulation pattern in the SCB significantly differs from that north of Point Conception. This is evident in the observed Sea-Surface Temperature (SST) distribution (Strub and James, 2000) that shows colder water near the coast north of Point Conception (indicating persistent coastal upwelling) in contrast to the warmer coastal water in the SCB (advected from the south) with the colder water offshore (advected from the north). The seasonally strong upwelling conditions in the SCB create a highly productive system, which strongly attract diverse megafauna including a large variety of cetaceans. This bight is also an important Naval area, adjacent to large population centers, creating a relatively easy area to conduct research.
The goal of this research is to enhance the knowledge of the eastern Pacific blue whales population, by studying the variation in presence of D calls over time. I investigated the seasonality pattern, the interannual abundance variability of D calls through the years (2007-2012) and the diel pattern of these calls.
2. MATERIALS AND METHODS
2.1 Study area
Fig.3: A map of the Southern California Bight. The black square shows the site H, where data object of study were recorded through several deployments sampled. This site was chosen because it represents a full seasonal coverage for each year.
The study area is the Southern California Bight (SCB), which has been chosen due to its high productivity. The seasonally strong upwelling conditions attract diverse megafauna including cetaceans. Passive acoustic data were recorded at site H and were used in this study.
Longitude La ti tud e
2.2 Acoustic data collection
Passive acoustic data have been collected using High-frequency Acoustic Recording Packages (HARPs). The HARP is an instrument capable of recording long-term, high band-width acoustic data. These packages contain a hydrophone which is connected to an instrument frame on the seafloor and can be deployed in a range of depths from 200 to 1500 m, recording continuously over all seasons. The HARP includes a data logger, a hydrophone and a seafloor package.
A. Data logger – Low-power, high-speed digitizing and high-capacity data storage are required to provide long-term acoustic call recordings. Low-power components allow for long-duration deployments, whereas high-speed digitizing is needed to record broad-band calls. Among digital data storage devices, laptop computer disks are cost effective and readily available in the electronics market so, taking into account they have all desired characteristics, they are the most used. Data storage capacity imposes monitoring duration and sample rate. The sampling can be continuous or non-continuous. Data acquisition sample rates (continuous or non-continuous) determine the rate at which power is consumed (Wiggins and Hildebrand, 2007).
B. Hydrophone – Electronics requirements need to be observed in order that the HARP acoustic sensor accomplishes its task. It calls for some skills, such as high-sensitivity (more than -120 dB re 1V/μPa), low-power (50mW) and broadband (10 Hz-100.000 Hz). Mandatory, then, two types of transducers and signal conditioning preamplifiers, pre-whitening filters and anti-alias filter electronics. Two types of transducers allow to record both low-frequency and high-frequency sounds, respectively from baleen whales and odontocetes. There are two stages of signal conditioning, one for the frequency band from 10 Hz to 2000 Hz, and the other from 1000 Hz to 100.000 Hz. These signals are then added together, before being digitized and stored on disk. The pre-whitening filter levels out the hydrophone system feedback when the ocean ambient noise would make the recording demanding to manage. When environment noise levels are lower and sound attenuation is higher than desired, this filter adds more
gain at higher frequencies to make the goal. In electronics, two different analog signals can become identical, once sampled. If so, the accuracy of the system gets altered. That is the reason the hydrophone design includes a filter to reduce the high-frequency aliasing effects. Working underwater means dealing with the seawater, which can be a problem in terms of obtaining a good acoustic. It is recommendable, so, a oil-filled polyurethane tube flowing into the transducer and signal conditioning electronics package (Wiggins and Hildebrand, 2007).
C. Seafloor Package –The seafloor HARP has an electronic board and a transducer which compose an acoustic release system that it will make possible the acoustic commands reception from the ship coupled with the seabed package. The seafloor package includes ballast weights whose release needs to be activated by the motor of the vessel. Usually there is a secondary release acoustic system to let up the likelihood of instrument recovery in case the other one breaks. Acoustic release and a battery pressure case are fitted in a high-density polyethylene plastic panels. Finally, the hydrophone sensor is tethered to the seafloor instrument through a polypropylene wire and held by floats 10 m from the seafloor (Wiggins and Hildebrand, 2007).
Fig.4: HARP Seafloor Package (Wiggins and Hildebrand, 2007)
2.3 Data processing
The process of uploading from the HARP raw disks and backing up the large amount of data is challenging and time-consuming, and standard procedures have been implemented to insure consistent and reliable data access. Raw data recorded on HARPs are parsed into smaller (1GB) processing files in format called XWAV using MATLAB (www.mathworks.com) (Wiggins and Hildebrand, 2007).
The main feature which distinguishes the XWAV file from the similar WAV one is that the XWAV includes further information in an expanded plate. The XWAV header provides timing information, such as start time and end times, longitude, latitude and depth of instrument deployment, just to cite some examples among other data types. XWAV files can be opened and played with standard audio
software, the same used to read WAV files, providing a great advantage. Because of the huge size of data collected with each instrument deployment, to get the analysis more practical, a means of file compression for data overview was developed based on a long-term spectral averages (LTSA). In addition to long-term spectral averaging, passive acoustic data have been decimated by a factor of 100 for easier calculations and analysis of the low frequency component of the data set.
2.4 Manual detection vs automated detection of calls
To identify marine mammal vocalizations, two basic approaches are possible: a manual method and an automated one. Manual method consist of an analyst manually marking all calls in a given data set. This method is time-prohibitive for long data sets. Using automated detection technique has a couple of advantages over the manual technique. First of all, the automated method has the potential to reduce operator analysis time, secondly it has the capacity to determine basic call unit parameters, such as unit duration, that are normally time-prohibitive to obtain using manual techniques.
2.5 A generalized power-law (GPL) detector
One approach for detecting signals with unknown characteristics is the power-law processor. Unlike most commonly used detectors, the generalized power-power-law (GPL) detector is based on detection threshold parameters that are good enough not to require operator adjustments while reviewing deployments spanning months to years, with highly varying ocean noise conditions. Another advantage which makes the operator work faster. An analyst verify what parameters need to be set to find calls of interest, therefore the goal of the detector will be able to pick up those sounds, with no exceptions of other ocean noises as well, provided they fall within the parameters category. The duty of the researcher, then, is to verify the performance of this tool, marking which calls seem to be those ones of interest. In order to make the automated detector a suitable instrument to pick up vocalizations, a threshold < 6% has been fixed to determine the maximum level of false alarms can be reached. This is calculated after taking into account the
level of trained human analysts especially in the worst situations, namely recordings in the noisiest environments (Helble et al., 2012). To make the algorithm able to run in the right way through the entire deployment, you need prior to set a reliable detection threshold with specific restraints. The algorithm, so, can provide information operator requested, running significantly faster than real time (Helble et al., 2012).
2.6 How to run a detector
Basic parameters of the signal and noise environments used by the algorithm make it general enough to spot all types of call units without predefining any sort of templates (Helble et al., 2012). The GPL algorithm has the potential to be modified for many types of marine mammal vocalizations. The power-law processor can be always improved to minimize the effects of this noise. Shipping noise is non-stationary and problematic for many marine mammal detection algorithms. Sounds coming from boats create a virtual wall of “white noise” that has a constant loudness. In the frequency (Fourier) analysis often used in signal processing, white noise is a uniform mixture of random energy at every frequency. White noise, thus, is defined as having the same power spectrum density from the lowest to the highest frequencies. It can block the communication attempts between cetaceans or limit them to very small areas. The goal of the detector is to be able to determinate an optimal value for the white noise. The GPL detector can attain this goal, while it keeps a fixed threshold in all noise environments. The generalized power-law detection statistic allows to create a tool that, scrolling the data set, is able to detect every kind of sounds into a fixed frequency window. Once the method have been adapted to the data set, it is time to write the detector directory on MATLAB (www.mathworks.com) and run it throughout the data set.
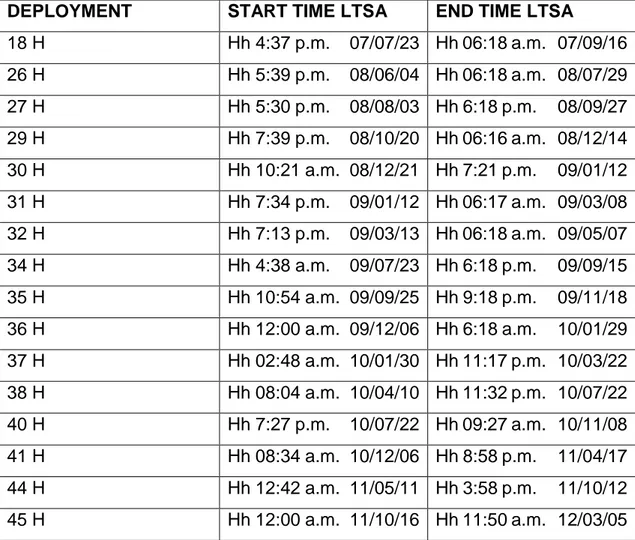
I analyzed 16 deployments of the site H. The detector calculated several parameters such as the start time, the end time, the middle frequency, the low frequency, the high frequency and the slope of each blue whale D call.
Once the detection process is completed on data, the investigator has to sort the results. In this study, we decided to sort D calls by slope, since we know the
slope, strongly downsweep, is one of the best feature which make them recognisable.
DEPLOYMENT START TIME LTSA END TIME LTSA
18 H Hh 4:37 p.m. 07/07/23 Hh 06:18 a.m. 07/09/16 26 H Hh 5:39 p.m. 08/06/04 Hh 06:18 a.m. 08/07/29 27 H Hh 5:30 p.m. 08/08/03 Hh 6:18 p.m. 08/09/27 29 H Hh 7:39 p.m. 08/10/20 Hh 06:16 a.m. 08/12/14 30 H Hh 10:21 a.m. 08/12/21 Hh 7:21 p.m. 09/01/12 31 H Hh 7:34 p.m. 09/01/12 Hh 06:17 a.m. 09/03/08 32 H Hh 7:13 p.m. 09/03/13 Hh 06:18 a.m. 09/05/07 34 H Hh 4:38 a.m. 09/07/23 Hh 6:18 p.m. 09/09/15 35 H Hh 10:54 a.m. 09/09/25 Hh 9:18 p.m. 09/11/18 36 H Hh 12:00 a.m. 09/12/06 Hh 6:18 a.m. 10/01/29 37 H Hh 02:48 a.m. 10/01/30 Hh 11:17 p.m. 10/03/22 38 H Hh 08:04 a.m. 10/04/10 Hh 11:32 p.m. 10/07/22 40 H Hh 7:27 p.m. 10/07/22 Hh 09:27 a.m. 10/11/08 41 H Hh 08:34 a.m. 10/12/06 Hh 8:58 p.m. 11/04/17 44 H Hh 12:42 a.m. 11/05/11 Hh 3:58 p.m. 11/10/12 45 H Hh 12:00 a.m. 11/10/16 Hh 11:50 a.m. 12/03/05
Table 1: The 16 deployments analyzed with date (yy/mm/dd) and timing data, respectively start time and end time of the LTSA files (a.m./p.m).
2.7 The GPL review
To aid operator review of the detections in a efficient manner, a graphical user interface (GUI) was designed. The GUI provides a tool for the operator to review time-condensed spectrograms containing the detections, to listen to the detections with adjustable band-passed audio and to accept or reject each detection.
I visually recognized and marked D calls using GUI interface. Only calls marked in this way were used for subsequent analysis.
Fig.5: An example of GUI window. Above the spectrogram, on the left, you input appropriate values of the main parameters which allow for the detection of calls.
2.8 Effort
A required step to compare our data across time is to compute the effort. The effort is the number of hours with recordings. Despite data were generally being recorded continuously, there were gaps between deployments or occasionally, gaps in the data. This calculation accounted for that variability.
Calling patterns
A. Seasonality of D calls
To quantify the seasonal blue whale call abundance across 16 deployments sampled throughout the Southern California Bight, I extracted data coming from detection files and summarized data showing counted calls by month and year.
Timing data produced by the detection output allowed me to compute the effort. The seasonal trend has arised computing the monthly average of detected calls previously standardized by the effort. Data were plotted on Excel for a period spanning from July 2007 to March 2012.
B. Interannual abundance of D calls
To look at the interannual abundance pattern of blue whale D calls across 16 deployments throughout the Southern California Bight, I summarized detected calls by years and I standardized their yearly amount by the relative effort, since the effort varied over years. The interannual abundance of D calls has been carried out calculating how the average of each year differs from the average of the whole deployment period.
C. Daily variation
The third and last goal was to investigate the diel variation in blue whale D calls. Number of calls at each hour of the day was calculated and I made the plot for a preview of calling distribution through the day. The daily timing of the predicted calling distribution was compared using the Kruskal-Wallis test for differences in hours, accounting for hours during which there were no calls with zeros. Non calling days were negligible to achieve the goal.
2.9 Statistical analysis
Since data were not normally distributed, I used the non-parametric Kruskal-Wallis test to see if there was a significant difference in abundance of calls among the hours of the day. The test was conducted in Matlab.
The most common use of Kruskal-Wallis test is when you have one nominable variable (which in this case is represented by hours) and one measurement variable (which in this case is represented by the number of counted calls per hour). Kruskal-Wallis test is adapted at an experiment whereby you would usually use one-way ANOVA, but the measurement does not meet the normality
assumption of a one-way ANOVA. ANOVA investigates the likelihood that the difference among the means could have been caused by chance. Kruskal-Wallis compares three or more unmatched groups. If the Kruskal-Wallis test shows a significant difference between the groups, then pairwise comparisons can be used by employing different tests. It is important to reduce experiment-wise Type I Error by using a Bonferroni or other tests developed. The Bonferroni is probably the most commonly used post hoc test because it is highly flexible, very simple to compute and can be used with any type of statistical test (e.g. correlations), not just post hoc tests with ANOVA. The traditional Bonferroni, however, for several reasons tends to lack power. Given that, several alternatives have been developed, including the Dunn/Sidak test. It suggests a relatively simple modification of the Bonferroni formula that would have less of an impact on statistical power but retain much of the flexibility of the Bonferroni method. The Sidak correction, then, assumes the individual tests are statistically independent, which the Bonferroni does not. That is the reason I chose the Dunn/Sidak test over the Bonferroni.
Written the right directory on MatLab, I ran the test. It gave me ANOVA table and plots which I am going to show later in the chapter of results.
3. RESULTS
A total of 39337 blue whale D calls were detected at site H from 2007 to 2012. A spectrogram of typical D call detections, as seen in detection verification software, is shown in fig.6. Their frequency downsweeps from 64 Hz to 43 Hz (σ= 5.6 and σ= 5.2).
Fig.6: A repetitive sequence of blue whale D call detections from 13 September 2008 marked on verification GUI (Graphical User Interface).
3.1 CALLS SEASONALITY
These data reveal pattern of seasonality for calling Pacific blue whales in the Southern California Bight, with blue whale D calls detected in the Southern California Bight during all months, although the relative occurrence of their presence varied among months (fig.7). D calls were rarely detected from December through February.
Highest detections of D calling blue whales occur from June to September, with sharply decreasing numbers into the fall.
Fig.7: Blue whale D calls occurrence in the Southern California Bight from May to November with a peak in July. Error bars stand for the mean error at 5%.
3.2 INTERANNUAL ABUNDANCE OF D CALLS (2007-2012)
There was large variability in interannual abundance of D call detections in the Southern California Bight (fig.8).
2007 and 2010 show a considerable D calling increase, whereas each one of other years shows a decrease, which is notable for 2009. In 2009, in fact, there is the sharpest decrease of blue whale D calls.
0 500 1000 1500 2000 2500 3000 A v er age o f ca lls /eff o rt Months
Fig.8: Blue whale D calls interannual variability throughout the Southern California Bight from 2007 to 2012. The deployment period average has set at zero. Columns above the average axis stand for an increase of D calling blue whales, whilst columns below the average axis represent a decrease of D calling blue whales. The calls/effort weighted average labeled on the y axis means the number of detected calls standardized by the effort and normalized through the monthly average. Error bars stand for the mean error at 5%.
3.3 DIEL PATTERN OF D CALLS
Acoustic recordings do not reveal a consistent diel calling pattern. D calls were not produced uniformly during the day (X²=116.64 and P=0.00). D calling seems to be more a daytime activity rather than a nocturnal one with a peak at 12:00 and 13:00 (fig.9) during hours with the highest solar incidence and lower detections during the early morning (i.e. at 6:00 and 8:00).
-200 -100 0 100 200 300 400 2007 2008 2009 2010 2011 2012 A v . of cal ls/ eff ort w ei gh ted av erage Years
Fig.9: Diel pattern of blue whale D calls recorded throughout the Southern California Bight from 2007 to 2012. More blue whales D calls were detected during the day than during the night, especially from the morning (9:00) to the early afternoon (14:00). Error bars stand for the mean error at 5%.
0 500 1000 1500 2000 2500 24:00 01:00 02:00 03:00 04:00 05:00 06:00 07:00 08:00 09:00 10:00 11:00 12:00 13:00 14:00 15:00 16:00 17:00 18:00 19:00 20:00 21:00 22:00 23.00 D etect ed cal ls Hours
Fig.10: Each figure shows which groups (red marked) are significantly different from the blue whale D calls abundance at hour at issue (blue marked).
4. DISCUSSION
4.1 The seasonality of blue whale D calls
I observed a seasonal variability in the occurrence of blue whale D calls in the Southern California Bight (SCB). The trend shows (fig.7) these marine mammals are present in this area from May through November with a peak in July, even though few detections were from December to April as well. The results of an acoustic monitoring effort carried out by Oleson et al. (2007) in the SCB highlight the value of acoustic methods over visual surveys, since they indicate that blue whales inhabit these waters for a longer period than is suggested by visual techniques in this region. Those ones, in fact, cannot be conducted often enough to represent an exhaustive evidence. Visual surveys, conversely to acoustic ones, lose out specific constraints, in terms of weather and season (Clark and Ellison, 1988; 1989). Despite that, visual surveys report the same lower abundance from November to April compared to the other year period (Forney and Barlow, 1998; Carretta et al., 2000). All previous studies support my results on seasonal presence of blue whales in the SCB, based on the detection of D calls. Unpublished data from J.Carretta reveal the first sighting of blue whale occurred in May and the last in November, following Oleson et al. (2007) who similarly documented these marine mammals from June to November. Nevertheless, Oleson et al. (2007) concluded by stating the need to monitor not only D calls but also B calls to assess a complete evidence of blue whale occurrence in the SCB. Monitoring D calls alone would indicate blue whales leave this area in November, while the detection of B calls indicate these animals leave the Southern California waters two months later.
Detecting vocal cetaceans using acoustics has been often proven to be effective (Mellinger and Barlow, 2003). Nonetheless, acoustic methods have some shortcomings. The only use of acoustic devices cannot provide information regarding the number and the distributions of non-calling whales and deeper studies about the behavior of calling whales are not possible without visual observations.
From the literature we know that blue whales spend only a time frame period in the SCB before migrating to breeding grounds at lower latitude (Calambokidis et
al., 1990; Mate et al., 1999). A key predictor for blue whale distribution and movement in the California Current region has been identified with zooplankton aggregations, paying a particular attention to those euphausiid species, such as Euphausia pacifica and Thysanoessa spinifera, which are blue whale favorite krill (Schoenherr, 1991; Croll et al., 1998; Fiedler et al., 1998). The growth of euphausiid offspring living the Southern California waters coincides then with the upwelling season, another favorable condition whereby we believe blue whales consider Southern California as a feeding ground. Although active upwelling seems to affect just a restricted coastal band (about 10-25 km wide), the area which experiences this phenomenon is actually wider (Huyer, 1983). The most favorable upwelling month is July, with almost the entire coast prevailed with the mean upwelling winds. Therefore, timing coincides with the peak of D calls in July. The California Current (CC) creates a flow of nutrient-rich water coming from the north and spanning through the entire coast. The euphotic zone becomes rich in nitrogen carried by upwelling waters. A mixing and nutrient recycling created by the sea bottom topography and coastal winds makes this coast particularly productive, thus great for marine life survivorship. In the SCB, the irregular bottom topography, the Channel Islands morphology and seamounts alongside create turbulence (Smith et al., 1986), which increases and makes nutrients coming up to the surface, resulting in a significant amount of productivity and prey availability. The summer and early fall have been marked as periods with the highest biomass of E. pacifica off Southern California (Brinton, 1976), which again supports the highest presence of blue whales in the area at that time.
4.2 The interannual abundance of blue whale D calls
This study has shown a large variability in abundance of blue whale D call detections within the Southern California Bight from 2007 to 2012 (fig.8). Compared to the average abundance through years, I observed a great increase of vocalizations in 2007 (even though the research effort was limited to only summer and fall months which likely contributes to this peak presence) and in 2010. On the contrary, each one of the other years shows a decrease, which is well marked in 2009.
Blue whales may exploit the Southern California Bight as a feeding ground, thus oceanic and environmental conditions should be correlated to ensure a right prey availability. In spite of the knowledge of the almost stable blue whale D calls seasonality with upwelling events as indicators of blue whales occurrence periods, the interannual abundance trend of these vocalizations is not so steady. It is my belief that physical environmental events drive, year by year, the abundance of these marine mammals into californian waters.
In marine systems, top predators, such as seabirds, pinnipeds, sharks and cetaceans, alter their location, abundance and foraging success following large-scale oceanographic patterns and thus implications on different prey distribution and availability (Ainley, Sydeman and Norton, 1995; Ainley, Veit, Allen, Spear and Pyle, 1995; Forney, 2000; Kenney, Winn and Macaulay, 1995; Pyle, Klimley, Anderson and Henderson, 1996; Smith, Dustan, Au, Baker and Dunlap, 1986; Sydeman and Allen, 1999; Tynan, 1997). Variability in the physical characteristics occurs at different time levels: seasonal (Barber and Smith, 1981; Hutchings, Pitcher, Probyn and Bailey, 1995; Reid, Roden and Wyllie, 1958), interannual (e.g. El Nino; Barber and Chavez, 1983), and decadal (McGowan, Cayan and Dorman, 1998). Immediately, changes occur at several levels of the oceans, such as in nutrient upwelling, primary productivity and zooplankton biomass (Chavez, 1996; Lenarz, Schwing, Ventresca, Chavez and Graham, 1995; McGowan et al., 1998). Accordingly, marine vertebrates have to fit to these perturbations and the response can be profiting by various ways, including fecundity, survival (Ainley, Sydeman et al., 1995; Fiedler, Methot and Hewitt, 1986; Yoklavich, Loeb, Nishimoto and Daly, 1996) and shifts in distribution (Forney, 2000; Forney and Barlow, 1998; Tynan, 1999).
Benson et al. (2002) point out how cetaceans, both baleen whales and toothed whales, can vary their abundance and distribution with, as a driver, physical and biological responses during El Nino 1997-98 and La Nina 1999 within the upwelling ecosystem Monterey Bay. Burtenshaw et al. (2004) documented as well, how the El Nino Southern Oscillation (ENSO) event in the Eastern Pacific during 1997-98 strongly modified and affected organisms, starting from phytoplankton to end up with marine mammals. Euphausia pacifica and Thysanoessa spinifera, preferred blue whale prey, in the past few decades changed density as a result of altered oceanographic conditions, such as those