ALMA MATER STUDIORUM - UNIVERSITÀ DI BOLOGNA
SCUOLA DI INGEGNERIA E ARCHITETTURA
Sede di Forlì
CORSO DI LAUREA IN INGEGNERIA AEROSPAZIALE
CLASSE L-9
ELABORATO FINALE DI LAUREA
In
TERMOFLUIDODINAMICA AVANZATA E CONTROLLI TERMICI LM
Design and fluid dynamic analysis of a custom
drip chamber in a medical disposable device
CANDIDATO
RELATORE
Gabriele Guerra
Prof. Marco Lorenzini
CORRELATORI
Prof. Marco Troncossi
Ing. Jose Vicente Farina
Anno Accademico 2014/15
Sessione II
aPer quanto il vento ululi forte,
una montagna non può inchinarsi ad esso.
Sommario
Negli ultimi anni, parallelamente allo sviluppo di calcolatori elettronici sempre pi`u performanti, la fluidodinamica computazionale `e diventa-ta uno strumento di notevole utilit`a nell’analisi dei flussi. Si `e inoltre dimostrata di importante ausilio nello sviluppo di dispositivi medici. Quando impiegate nello studio di flussi di fluidi fisiologici, come quello del sangue, il vantaggio principale delle analisi CFD `e che permettono di caratterizzare il comportamento fluidodinamico senza dover eseguire test in-vivo/in-vitro, consentendo quindi notevoli vantaggi in termini di tempo, denaro e rischio derivante da applicazioni mediche. Inoltre, simulazioni CFD offrono una precisa e dettagliata descrizione di ogni parametro di interesse permettendo, gi`a in fase di progettazione, di prevedere quali modifiche al layout garantiranno maggiori vantaggi in termini di funzionalit`a. Il presente lavoro di tesi si `e posto l’obiettivo di valutare, tramite simulazioni CFD, le performances fluidodinamiche del comparto sangue “camera venosa” di un dispositivo medico monou-so Bellco impiegato nella realizzazione di trattamenti di emodialisi. Al fine di offrire al lettore una panoramica del contesto, il primo capitolo dell’elaborato presenta una breve descrizione della disfunzione renale e dei trattamenti sostitutivi. Notevole impegno `e stato in seguito ri-volto allo studio della letteratura scientifica in modo da definire un modello reologico per il fluido non-Newtoniano preso in considerazione e determinarne i parametri caratteristici. Il terzo capitolo presenta lo stato dell’arte delle apparecchiature Bellco, rivolgendosi con particolare attenzione al componente “cassette” del dispositivo monouso. L’ana-lisi fluidodinamica del compartimento “camera venosa” della cassette, che sar`a presa in considerazione nei capitoli quinto e sesto, si inserisce nell’ambito della riprogettazione del dispositivo attualmente in com-mercio: il quarto capitolo si incentra sul suo nuovo design, ponendo specifico interesse sul layout della camera venosa di nuova generazione. Per lo studio dei flussi che si sviluppano internamente ad essa ci si `e av-valsi del modulo CFD del software COMSOL multiphysics (versioneR
5.0); la definizione del modello implementato e della tipologia di studio effettuato sono presi in considerazione nel quinto capitolo. Le
proble-vi
matiche di maggior impatto nella realizzazione di un trattamento di emodialisi sono l’emolisi e la coagulazione del sangue. Nell’evenienza che si verifichino massivamente occorre infatti interrompere il tratta-mento con notevoli disagi per il paziente, per questo devono essere evitate. Nel sesto capitolo i risultati ottenuti sono stati esaminati ri-volgendo particolare attenzione alla verifica dell’assenza di fenomeni che possano portare alle problematiche suddette.
Abstract
In recent years, together with the development of more efficient com-puter, Computational Fluid Dynamics (CFD) has become a consider-ably useful tool in the analysis of flows. It has also proved to be of much help in the development of medical devices. When used in the study of physiological fluids flows, such as blood, the main advantage of CFD analysis is that they allow the characterization of the fluid-dynamic behavior without the need of in-vivo/in-vitro measurements, leading to considerable benefits in terms of time, money and risk arising from medical applications. In addition, CFD simulations offer an accurate and detailed description of each parameter of interest. Starting from the design phase, it is possible to predict what layout changes will lead to greater advantages in terms of functionality. The present work has the purpose of assessing, by means of CFD simulations, the fluid- dy-namic performances of the blood compartment “venous chamber” of a Bellco’s medical disposable device used in carrying out hemodialysis treatments. In The first chapter, a brief description of kidney fail-ure and its replacement therapy provides the reader an overview of the context in which this thesis work has been developed. Consider-able effort was then addressed to the study of the scientific literature, so as to define a rheological model for the non-Newtonian fluid taken into consideration and to determine its characteristic parameters. The third chapter deals with the Bellco’s equipment state of the art, focus-ing on the disposable device component ”cassette”. The fluid dynamic analysis of the venous chamber of the cassette is part of the redesign of the currently used device: the fourth chapter focuses on its new layout, particularly that of the new venous chamber. The investigations on the flows that develop inside the venous chamber were done using the CFD module of the software COMSOL Multiphysics (version 5.0); the def-R
inition of the implemented model and the type of study are taken into account in the fifth chapter. The major problems during an extracor-poreal dialysis treatment are blood hemolysis and coagulation. If they occur massively, it is necessary to suspend the treatment, with con-siderable troubles for the patient; therefore, they must be avoided. In
viii
the sixth chapter, the obtained results are examined focusing on check-ing the absence of phenomena that can lead to the above-mentioned problems.
Contents
Preface 1
1 Kidney Failure and Dialysis 3
1.1 Kidney Failure . . . 3
1.1.1 Acute Kidney Injury . . . 5
1.1.2 Chronic Kidney Disease . . . 5
1.2 Treatment for End-Stage Renal Disease . . . 6
1.2.1 Peritoneal Dialysis . . . 7 1.2.2 Hemodialysis (HD) . . . 7 1.2.3 Hemofiltration (HF) . . . 8 1.2.4 Hemodiafiltration (HDF) . . . 10 2 Blood Rheology 13 2.1 Blood composition . . . 14
2.2 Physiological fluid dynamics and Hemorheology . . . . 16
2.2.1 Newtonian and non-Newtonian fluids . . . 17
2.2.2 Modeling blood . . . 18
2.3 Haemolisys . . . 23
2.4 Coagulation . . . 24
3 Bellco’s Monitor and Bloodlines state of the art 27 3.1 Hemodialysis machine . . . 27
3.2 Bloodlines currently in use . . . 30
3.2.1 Dialyzer . . . 30
3.2.2 Cassette . . . 32
3.2.3 New Cassette’s Design Input Requirements . . . 44
4 Cassette New Design 47 4.1 Geometry . . . 47
4.2 Materials . . . 49
x CONTENTS
5 Numerical Simulations 59
5.1 Hemodynamics . . . 59
5.1.1 The Reynolds Number . . . 60
5.1.2 Velocity Profile . . . 62
5.1.3 The Governing Equations . . . 64
5.1.4 Boundary conditions . . . 64
5.1.5 Limitations of the analytical method . . . 65
5.2 The Finite Element Method . . . 65
5.3 CFD in COMSOL . . . 66
5.3.1 Geometry . . . 67
5.3.2 Blood Parameters . . . 67
5.3.3 Physics and Boundary conditions . . . 70
5.3.4 Meshing . . . 72
5.3.5 Studies and post-processing . . . 72
6 Results and Conclusions 75 6.1 Velocity Field . . . 75
6.2 Viscous Stress . . . 79
6.3 Pressure . . . 82
6.4 Shear Rate . . . 87
List of abbreviations
AKI Acute kidney injury ARF Acute renal failure
µapp Apparent Viscosity
BHD Bicarbonate Hemodialysis Kc Casson viscosity coefficient
CKD Chronic kidney disease
CFD Computational Fluid Dynamics µ Dynamic Viscosity
ESRD End-stage renal disease
le,lam Entrance length for Laminar flow
FEM Finite Element Method ρ Fluid Density
GFR Glomerular filtration rate H Hematocrit HD Hemodialysis HF Hemofiltration HDF Hemodiafiltration µ∞ Infinite-shear-rate viscosity ν Kinematic Viscosity ˙
m Mass Flow Rate
xii CONTENTS
RBC Red blood cell Re Reynolds Number
˙γ Shear Strain τ Shear Stress
τt Threshold Shear Stress for Erythrocytes damage
τ0 Yield Stress
WBC White blood cell µ0 Zero-shear-rate viscosity
List of Figures
1.1 Representative image of a Kidney . . . 4
1.2 The Nephron and its components . . . 4
1.3 Schematic of a peritoneal dialysis treatment . . . 9
1.4 Schematic of a hemodialysis treatment . . . 9
1.5 Difference between hemodialysis and hemofiltration . . 11
1.6 Working principle of hemodiafiltration . . . 11
2.1 Simplified illustration of the main blood composition. The number and size of cells shown in the figure are for demonstration purposes and not supposed to respect their proportion or relative size in the blood. . . 15
2.2 Rheological classification of materials . . . 16
2.3 Shear stress / Shear Strain relationship for Newtonian and non-Newtonian fluids . . . 18
2.4 Viscosity - Shear Rate relation for (a)Newtonian fluid; (b) Shear thinning fluid; (c) Shear thickening fluid; . . 19
2.5 Viscosity dependency from hematocrit and shear rate . 20 2.6 Effect of tube diameter on apparent viscosity of blood for H = 40% and T = 38◦C . . . 20
2.7 Shear stress plotted vs. shear strain rate for typical nor-mal blood (H = 40%; T = 37◦C) . . . 21
2.8 Square root of shear stress plotted versus square root of shear rate (H = 40%; T=37◦C) . . . 22
3.1 Distinction between the different type of monitors . . . 28
3.2 Front view of Bellco’s monitor Flexya R . . . . 29
3.3 Flexya R’s frontal hematic panel . . . . 31
3.4 Typical Bellco’s dialyzer; indicated blood inlet and out-let, dialysate inlet and outlet . . . 32
3.5 Example of uncapped dialyzer; clearly visible set of fi-bres inside the cylindrical plastic casing . . . 32
3.6 Plastic case of dialyzer . . . 33
xiv LIST OF FIGURES
3.8 General schematic of the ‘Cassette’ . . . 34
3.9 CAD model for the cassette . . . 36
3.10 Schematic of a membrane . . . 37
3.11 View of a sectioned chamber used for positive pressure measurements . . . 38
3.12 Layout of the pressure transducion sequence . . . 38
3.13 View of the correct placement of membranes inside cassette 39 3.14 Membranes positioning in chambers . . . 39
3.15 Views of currently used cassette . . . 41
3.15 Views of currently used cassette. . . 42
3.16 PVC cassette’s body . . . 43
3.17 EPDM membranes . . . 44
4.1 Currently used cassette; constraints indicated with letters 48 4.2 Currently used cassette; ports indicated by numbers . . 49
4.3 Views of the new cassette . . . 50
4.3 Views of the new cassette. . . 51
4.4 Photos of the PETG cassette . . . 52
4.5 ACTEGA membrane . . . 53
4.6 Differences between colours uniformity in the currently used cassette and in the new ones . . . 55
4.7 Comparison between the venous chambers . . . 57
5.1 (a)Reynolds’ experiment using water in a pipe to study transition to turbulence; (b)Typical dye streake . . . . 60
5.2 Velocity profile within a circular pipe. Average velocity Uav is defined as the average speed through a cross section. 63 5.3 Example of 1D finite element approximation . . . 67
5.4 Entire geometry of the Venous Chamber . . . 68
5.5 Viscosity as a function of shear rate for the chosen pa-rameters . . . 69
5.6 Model of the Venous Chamber, highlighted in blue the inlet duct . . . 71
5.7 Zoom on the inlet duct, indicated sections ‘1’and ‘in’ . 71 5.8 Schematic of only the inlet duct . . . 72
5.9 2D model used for the mesh refinement study . . . 73
6.1 Velocity field profile on x-y planes . . . 76
6.2 Velocity vectors profile on different x-z planes . . . 77
6.3 Streamlines plot . . . 77
6.4 Focus on the recirculation area near the inlet surface . 78 6.5 Focus on the velocity plot in the lower region of the cassette . . . 78
LIST OF FIGURES xv
6.6 Contour plot of the wall shear stress . . . 79 6.6 Contour plot of the wall shear stress. . . 80 6.6 Contour plot of the wall shear stress. . . 81 6.7 Contour plot of the wall shear stress in the outlet region 81 6.8 Wall shear stress magnitude as a function of arc length 82 6.9 Pressure field in x-y planes . . . 83 6.10 Pressure magnitude and gradient as a function of arc
length in the inlet region . . . 84 6.11 Pressure magnitude and gradient as a function of
y-coordinate in the outlet region . . . 85 6.12 Pressure drop magnitude in the inlet and outlet regions 86 6.13 Shear rate magnitude plotted on a surface passing through
the centerline of the inlet duct . . . 87 6.14 Shear rate magnitude plotted on a surface passing through
the centerline of the outlet duct . . . 88 6.15 Streamlines and shear rate magnitude zoomed on a
List of Tables
1.1 GFR level for different CKD stage . . . 6
2.1 Threshold level of τt > in laminar flow for RBCs dam-age and corresponding estimated exposure time from se-lected literature . . . 24
3.1 List of Flexya R’s Components . . . . 30
3.2 Currently used materials . . . 40
5.1 Flow characterization within a pipe by the Reynolds number . . . 62
5.2 Values for hematocrit and plasma viscosity for uraemic patients, T = 37◦C . . . 68
5.3 Parameters for the Carreau-Yasuda model . . . 69
5.4 Parameters value in section ‘in’ . . . 72
Preface
This thesis work was done in collaboration with the R&D Disposable Department at the company Bellco, Mirandola. Bellco is an Italian company with more than 40 years experience which has been a pioneer in the history of dialysis. Nowadays, Bellco operates worldwide as a leader in the field of advanced therapies, playing a key role in supplying hemodialysis and intensive care products. My collaboration with the Bellco R&D Department has started and developed thanks to Eng. Jose Vicente Farina, to whom i express my gratitude. I would like to thank him for his friendship, for his support and for the time he dedicated to me, answering patiently to all the questions I posed. I am also very grateful to Professors Marco Lorenzini and Marco Troncossi for being my supervisors, for giving me the opportunity to develop this thesis and for all the help they gave me.
Chapter 1
Kidney Failure and Dialysis
This chapter introduces reader to renal failure and its replacement therapy: dialysis.
Kidneys are two organs with the average size of a fist located in the abdominal cavity (see Fig.1.1). Blood is transported to the kidneys through the renal (arcuate) artery an returns to the heart through the renal (arcuate) vein and the lower vena cava. Their main function is to remove excess water and waste products of metabolism, such creatinine and urea, from blood. Besides, they also maintain the homoeostasis of electrolytes removing several salts and regulate the acid-base balance. In addition, human kidneys perform a few endocrine and metabolic functions, such as production of the hormone known as erythropoi-etin and conversion of vitamin D to its active form [33]. Each kidney contains about 1 million nephrons (see Fig.1.2), each nephron be-ing capable of formbe-ing urine by itself. The nephron is composed of a glomerulus (a capillary bed) through which fluid is filtered out of the blood and a long tubule in which the filtered fluid is converted into urine on its way to the pelvis of the kidney; from here two small tubes called ureters carry the waste matter to the bladder, which expels the urine through the urethra. [55].
1.1
Kidney Failure
Kidney failure is a medical condition in which the kidneys fail to per-form their task adequately. This is mainly determined by a decrease
4 Kidney Failure and Dialysis
Figure 1.1: Representative image of a Kidney [8].
1.1 Kidney Failure 5
in glomerular filtration rate (GFR) that is the rate at which blood is filtered in the glomeruli of the kidneys; symptoms are a decrease in or absence of urine production and determination of waste products (creatinine or urea) in the blood. There may be also problem with in-creased fluid in the body leading to swelling, raised levels of potassium, decreased levels of calcium and in later stages anaemia. Long-term kid-ney problems are also associated with increased risk of cardiovascular disease [31].
Renal failure can be divided into two categories: acute kidney in-jury, which is often reversible with adequate treatment, and chronic kidney disease, which is often not reversible.
1.1.1 Acute Kidney Injury
Acute kidney injury (AKI) or acute renal failure (ARF) [6] is a rapidly progressive loss of renal function generally characterized by a decrease in urine production and fluid electrolyte imbalance [44]. AKI usu-ally occurs when the blood supply to the kidneys is suddenly inter-rupted (for example accidents, injuries or complications from surgeries in which the kidneys are deprived of normal blood flow for extended periods of time) or when the kidneys become overloaded with toxins (drug overdose, chemotherapy). People suffering from acute kidney in-jury require supportive treatment until their kidneys recover function, and they often remain at increased risk of developing future kidney failure [57].
1.1.2 Chronic Kidney Disease
Chronic kidney disease (CKD) is a progressive loss in renal function over a period of months or years. The most common causes of CKD are diabetes and long-term, uncontrolled hypertension [4]; overuse of com-mon drugs such as ibuprofen and paracetamol can also cause chronic kidney disease [34]. Some infectious disease, such as Hantavirus and HIV, can attack the kidneys, causing renal failure. Chronic kidney dis-ease is identified by a blood test for creatinine, which is a breakdown product of muscle metabolism. Higher levels of creatinine indicate a
6 Kidney Failure and Dialysis
lower GFR and as a result a decreased capability of the kidneys to ex-crete waste products. As summed-up in Tab.1.1, the severity of CKD is measured in five stages, which are calculated using patient’s GFR [16].
Stage 1 CKD is mildly diminished renal function with few symp-toms; Stages 2 and 3 need increasing levels of supportive care from their medical providers to slow and treat their renal dysfunction. Patients in stages 4 and 5 usually require preparation of the patient towards active treatment in order to survive. Stage 5 CKD, often-called end-stage renal disease (ESRD), is considered a severe illness with poor life expectancy if untreated and requires some form of renal replacement therapy (dialysis) or kidney transplant whenever feasible.
Chronic kidney disease resulted in 956’000 deaths in 2013 up from 409’000 deaths in 1990 [17]. In 2012, patients reported under ESRD were approximately 42’000 in Italy [63]; in Canada 1.9 to 2.3 million people have CKD [2]. The U.S. Centers for Disease Control and pre-vention found that CKD affected an estimated 16.87% of U.S. adults aged 20 years and older, during 1999 to 2004 [18].
1.2
Treatment for End-Stage Renal Disease
There are several treatments for end-stage renal disease which allow extending the life of the patients for some years, kidney transplantation being the best alternative [52]. However, this option is limited by the number of kidneys available and by the compatibility with the donor. This way, dialysis treatments have to be done, where the function of kidneys is mimicked artificially.
Table 1.1: GFR level for different CKD stage
CKD Stage GFR level (mL/min/1.73 m2) Stage 1 ≥90
Stage 2 60 – 89 Stage 3 30 – 59 Stage 4 15 – 29 Stage 5 <15
1.2 Treatment for End-Stage Renal Disease 7
Dialysis is a process for removing waste and excess fluid from the blood and is used primarily as an artificial replacement for lost kid-ney function in people with kidkid-ney failure. The underlying principles of dialysis is the diffusion of solutes and ultra-filtration of fluid across a semi-permeable membrane. Diffusion is a property of substance in water: they tend to move from an area of high concentration to an area of low concentration. Blood flows by one side of a semi-permeable membrane, and dialysate1, or special dialysis fluid, flows by the
op-posite side. A semi-permeable membrane is a thin layer of material that contains holes of various sizes, or pores. Smaller solutes and fluid pass through the membrane, but the membrane blocks the passage of larger substances (for example, red blood cells, large proteins). This replicates the filtering process that takes place in the kidneys, when the blood enters the kidneys and the larger substances are separated from the smaller ones in the glomerulus [41].
There exist different kinds of dialysis: peritoneal dialysis, hemodial-ysis, hemofiltration and hemodiafiltration.
1.2.1 Peritoneal Dialysis
In peritoneal dialysis, the dialysate runs through a tube into the peri-toneal cavity2where the peritoneum acts as a partially permeable
mem-brane. Diffusion and osmosis drive waste products and excess fluid through the peritoneum into the dialysate until it approaches equilib-rium with the body’s fluids. Then the dialysate is drained, discarded, and replaced with fresh dialysate [32]. A schematic view of a peritoneal dialysis treatment is summed in Fig. 1.3.
1.2.2 Hemodialysis (HD)
In hemodialysis blood is pumped out of the body to an external filter, called dialyzer, where it flows in the lumen of thousands of tiny
hol-1
Dialysate: a chemical bath used in dialysis to draw fluids and toxins out of the bloodstream and supply electrolytes and other chemicals to the bloodstream [25].
2
Peritoneal cavity : a potential space between the parietal peritoneum and visceral peritoneum [54], that is, the two layer of tissue containing blood vessels that lines and surrounds the abdominal cavity and the relatives internal organs (stomach, spleen, liver, intestine) [7].
8 Kidney Failure and Dialysis
low fibres membranes (0.4 – 2.6 m2 surface area) while the dialysate
counter-flows in the dialyzer’s shell. The hollow fibre membrane acts as a barrier that retains blood proteins and cells, while removing low molecular weight waste metabolites from the blood to the dialysate [1]. The counter-current flow of the blood and the dialysate maximizes the concentration gradient of solutes between the blood and dialysate, which help remove more toxins from the blood. The concentrations of solutes are high in the blood, but low or absent in the dialysis solution and constant replacement of the dialysate ensure that the concentra-tion of undesired solutes is kept low on this side of the membrane. In order to prevent the depletion of the blood electrolytes, the dialysate should contain a similar concentration of minerals like potassium and calcium. This treatment is very effective removing small uremic toxins, but for larger toxins the removal is low, due to the sieving properties of the membrane. For the filtration of excess water, a transmembrane pressure difference can be applied, controlling easily the amount of wa-ter removed [13]. Afwa-ter filtration, the cleansed blood is returned via the circuit back to the patient’s body (see Fig.1.4).
Hemodialysis is the most common treatment for end stage renal disease, with nearly 1,4 million uretic patients treated worldwide in 2004 [13].
1.2.3 Hemofiltration (HF)
Hemofiltration is a similar treatment to hemodialysis, but it works according to a different principle. The blood is pumped through a dialyzer as in hemodialysis but no dialysate is used. A pressure gradient -called transmembrane pressure - is applied and, as a result, water and solute move across the ultrafiltration membrane by a convective mech-anism (see Fig.1.5). Hemofiltration membranes are usually 10 times more permeable to plasma water than the membrane for hemodialysis; however, they should be capable of retaining the blood proteins and cells [13] as well.
Since the main mechanism of removal is convection, dissolved sub-stances with large molecular weight, which are not cleared as well in hemodialysis, are filtered. On the other hand, small molecules are just
1.2 Treatment for End-Stage Renal Disease 9
Figure 1.3: Schematic of a peritoneal dialysis treatment [64].
10 Kidney Failure and Dialysis
dragged from the water flux, the concentration in the filtrate being similar to tat of the plasma. This implies that the removal of small molecules is not as efficient as in the hemodialysis [13].
Due to higher plasma water loss, the ultrafiltrate produced has to be completely or partially replaced by a replacement fluid containing electrolytes. The replacement fluid can be introduced in the blood upstream (pre-dilution), downstream (post-dilution) or in both at the same time [13] [28].
1.2.4 Hemodiafiltration (HDF)
Hemodiafiltration is a combination of the treatments hemodialysis and hemofiltration [23]. To improve the poor removal of low molecular weight solutes in hemofiltration, a dialysate fluid is circulated in the counter-flow shell of a hemofilter originating a concentration gradient that causes the diffusion of small molecular weight solutes out of the blood [33]. On the other hand, the convective flow imposed in this method results in a better deduction of the excess water and the higher molecular weight toxins [23].
As in hemofiltration, a replacement fluid may be needed. This sub-stitution fluid can also be administered either before, after or both before and after the dialyzer. Both pre-dilution and post-dilution have advantages and disadvantages: pre-dilution has the advantage of decreasing blood viscosity and hemoconcentration preventing clot formation in the membrane but has the disadvantage of diluting the blood toxins, reducing their clearances [19]. On the other hand, dur-ing post-dilution the higher hemoconcentration and viscosity enhance diffusive flux (there is a higher concentration gradient between blood and dialysate) but limit the convective flux achieving larger clearances for low molecular weight and lowest clearances for medium molecular weight toxins [21] [48].
1.2 Treatment for End-Stage Renal Disease 11
Figure 1.5: Difference between hemodialysis and hemofiltration [59]
Chapter 2
Blood Rheology
In the previous chapter, kidney disease and its replacement therapy were examined. It has been pointed out that in healthy people renal function carries out toxins removal from blood circulating inside kid-neys while in those with renal dysfunction, blood is cleaned through a hemofilter. It is therefore necessary to detail the physical properties of blood that define its fluid dynamics performance characteristics. The aim of this chapter is to introduce the vast field of blood rheology1,
and define the model and the relative parameters that shall be used in the simulation. Moreover, the final sections deal with the relations between fluid-dynamic characteristics and problems associated with blood extra-corporeal circulation, such as hemolysis and coagulation. To this aim, this chapter deals with:
• Blood compostion: whole blood consists of a suspension of 40-50% by volume of small deformable bodies, mainly red cells in the transparent plasma [55]. The rheological characteristics of blood are determined by the properties of this components and their interaction with each other as well as with the surrounding structures [51];
• Physiological fluid dynamics and Hemorheology: while plasma is
1
Rheology is the study of the flow of matter, primarily in a liquid state, but also as ‘soft solids’ or solids under conditions in which they respond with plastic flow rather than deforming elastically in response to an applied force [49]. In particular Hemorheology deals with the flow and deformation behaviour of blood and its formed elements (RBCs, WBCs, platelets).
14 Blood Rheology
generally treated as a Newtonian fluid, the behaviour of whole blood is non-Newtonian hence is needed to define its non-Newtonian rheological characteristics;
• Hemolisys: hemolysis refers to the breakdown of red blood cells and the consequent release of hemoglobin in plasma. Conditions that can cause hemolysis include immune reactions, toxins and mechanical stresses (such as those deriving from hemodialysis); • Coagulation: coagulation relates to the process by which a blood
clot is formed. It results from a complex cascade reaction, that involves many ’clotting factors’, some always present in the blood and some released from damaged tissue and platelets.
2.1
Blood composition
In order to acquire better understanding of the non-Newtonian behav-ior of blood it is necessary to specify its components. Blood is about 7% of the human body weight. The normal adult has a blood volume of about 5 litres [37]. Blood is a circulating heterogeneous multi-phase mixture of formed elements (corpuscles or cells) suspended in a fluid medium known as plasma (about 55% by volume; 2.7 - 3.0 litres in a normal human). The formed elements (cells) consist of red blood cells ‘RBCs’ (erythrocytes), white blood cells ‘WBCs’ (leukocytes) and platelets (thrombocytes).The formed elements in blood consist of 95% red blood cells, 0.13% white blood cells and about 4.9% platelets.
Plasma is a transparent, slightly yellowish, dilute electrolyte solu-tion (almost 92% water) containing organic molecules, minerals and the three major types of blood proteins: fibrinogen, globulin and albumin [51] [55].
RBCs are produced in the bone marrow and consist of a concen-trated solution of haemoglobin, an oxygen carrying protein, surrounded by a flexible membrane. Their typical dimensions in humans are 7.8µm in diameter and 2µm in thickness [55]. Their shape is that of bicon-cave discoid, flexible enough to vary depending on the diameter of the vessel through which blood is flowing. RBCs are the dominant
partic-2.1 Blood composition 15
ulate matter in blood, numbering approximately 5 · 106 per mm3. The
percentage of blood volume made up by red cells is referred to as the hematocrit. Hematocrit ranges from 42 to 45% in normal blood, and plays a major role in determining the rheological properties of blood [37].
WBCs are cells of the immune system which defend body against both infectious disease and foreign materials. Several different type of leukocytes exist and they are all produced in the bone marrow. Their size vary from 6 to 22 µm. There are normally 104 white blood cells
per mm3 of blood, so that their volume concentration in the blood is one white cell to every 1000 red cells, which is totally insignificant from the rheological point of view [37] [55].
Platelets are cells fragments circulating in blood that are involved in the cellular mechanism of haemostasis leading to the formation of clots. Low levels of platelets predisposes to bleeding, while high levels increase the risk of thrombosis (that is the coagulation of blood in the heart or blood vessel). They are much smaller than red or white cells, whit a diameter of 2-3 µm. Their number is one-tenth of the red cells [37].
16 Blood Rheology
2.2
Physiological fluid dynamics and
Hemorheol-ogy
Physiological fluid dynamics deals with flow of biological fluids, for example, blood in a tube such as blood vessel. The involved phys-ical quantities like velocity profiles, flow rates and pressures depend on the nature of fluid and the existing internal forces; it is therefore essential to understand the rheological properties of the fluid in the presence of forces. The basic difference between the solid and the fluid state is that the former may exert a restraining force on the displaced plane inside the medium, while the latter is unable to sustain internal forces. The concept of solidity and fluidity are idealizations that de-scribe the behaviour of real materials in certain limiting cases. Figure 2.2 summarizes the types of rheological materials. In general, the
be-Figure 2.2: Rheological classification of materials [55].
haviour of real materials encompasses many intermediate properties of those shown in the figure. A rigid solid does not deform under shear or tangential force. An elastic medium deforms under stress but returns to its original state when the stress is removed. An inviscid fluid has zero viscosity which represent another extreme of a material. Bingham plastic remains rigid when the shear stress is of smaller magnitude then the yield value τ0 but flows like a Newtonian fluid when the shear stress
exceeds τ0 [55].
Blood’s rheological properties do not allow a clear classification ac-cording to the scheme in figure 2.2: in fact many different methods exist to describe its behaviour. In the next sections differences between
New-2.2 Physiological fluid dynamics and Hemorheology 17
tonian and non-Newtonian fluids are elucidated, then non-Newtonian characteristics of blood are investigated and a constitutive equation is chosen in order to describe blood flow behaviour.
2.2.1 Newtonian and non-Newtonian fluids
According with the categorization illustrated in figure 2.2, an inviscid fluid is one that has no viscosity. With zero viscosity, the fluid offers no resistance to shearing forces. Hence, all shear forces are zero during flow and deformation of the fluid. However, all real fluids have finite viscosity, and it is necessary to take into account the viscosity and the related shear forces associated with its deformation. Real fluids are also called viscous fluids. Considering only laminar flow conditions, a shear stress - shear rate relationship is used to define the fluidity of liquids. This relation reflects the internal resistance between fluid layers (laminas) and thus reflects the viscosity of the fluid; the viscosity of a liquid can be calculated by dividing the shear stress by the shear rate.
From a rheological point of view, real fluids are classified into two main categories. Newtonian fluids are characterized by the shear stress τ , which is proportional to the shear strain ˙γ (also called shear rate). The slope of the characteristic represents the viscosity coefficient µ which is constant at a given temperature and pressure. τ refers to the shear forces per unit area, while the rate of shear strain ˙γ signifies the velocity decrease in the distance perpendicular to the direction of flow. The shear stress - shear rate relationship can be described by the equation
τ = −µ ˙γ (2.1) This is known as Newton’s law of viscosity, and fluids that behave in this fashion are termed Newtonian fluids. There are, however, many fluids whose rheological behaviour does not obey equation (2.1) and the are referred to as non-Newtonian fluids. As stated in the introduction of this chapter, while plasma acts like a Newtonian fluid, whole blood is treated as non-Newtonian. Non-Newtonian fluids are those in which the viscosity is not a constant but rather depends on the magnitude of
18 Blood Rheology
either τ or ˙γ. The slope of the shear stress - shear rate characteristic calculated at any given point on the curve is called apparent viscosity, µapp at that point, which reads
µapp = τ / ˙γ
The apparent viscosity of a non-Newtonian fluid may decrease (shear thinning behaviour) or increase (shear thickening behaviour) as the shear rate is increased. Non-Newtonian fluids may also have a yield stress below which there is a finite stress but the shear rate is zero (no flow), resulting in an infinite value for apparent viscosity. Note that for both classes of fluids, the viscosity depends on temperature and for most fluids viscosity decrease with increasing temperature. All these information are displayed in figure 2.3 and 2.4.
Figure 2.3: Shear stress / Shear Strain relationship for Newtonian and non-Newtonian fluids [55].
2.2.2 Modeling blood
The apparent viscosity of blood depends on the viscosity of the plasma, the hematocrit (Fig. 2.5), the shear rate (Fig.2.5), the narrowness of the vessel in which it is flowing (the so called Fahraeus-Lindqvist effect, Fig.2.6) and on the temperature. The dependence on the prevailing shear rate and the Fahraeus-Lindqvist effect classify blood as a non-Newtonian fluid. As mentioned in Section 2.1, most non-non-Newtonian
2.2 Physiological fluid dynamics and Hemorheology 19
Figure 2.4: Viscosity - Shear Rate relation for (a)Newtonian fluid; (b) Shear thinning fluid; (c) Shear thickening fluid; [60].
effects originate from the RBCs due to their high concentration and distinguished mechanical properties such as elasticity and ability to ag-gregate forming three-dimensional structures at low deformation rates, while the presence of white blood cells and platelets do not significantly affect the viscosity of blood since they are present in such small pro-portions. However, platelets play an important role in the formation of blood clots which may severely interfere with the flow [37].
Human blood is a shear thinning fluid. At low shear rates the parent viscosity is high, whereas under high shear forces viscosity ap-proaches an asymptotic value that correspond to blood viscosity when considered as Newtonian fluid. This shear thinning rheology arises from disaggregation of the red blood cells with increasing shear rate, indeed the aggregation is mostly demonstrated at low shear rates and hence non-Newtonian behaviour is more pronounced at these regimes of low deformation. The relationship between shear stress - shear rates for a sample of human blood is shown in figure 2.7. As can be noticed, the non-Newtonian region is below 100sec−1 of shear strain rate; at higher ˙γ the viscosity of blood is relatively insensitive to further increase of shear. For that reason there seems to be a general consensus that for ˙γ > 100 s−1 blood can be considered as Newtonian [5], [24], [39], [40],
20 Blood Rheology
Figure 2.5: (a)Effect of hematocrit on blood viscosity; (b)Human blood viscosity as a function of shear rate for a range of hematocrit concentrations; [5],[51]
Figure 2.6: Effect of tube diameter on apparent viscosity of blood for H = 40% T = 38◦C [55]. (1cp = 10−3P a · s)
2.2 Physiological fluid dynamics and Hemorheology 21
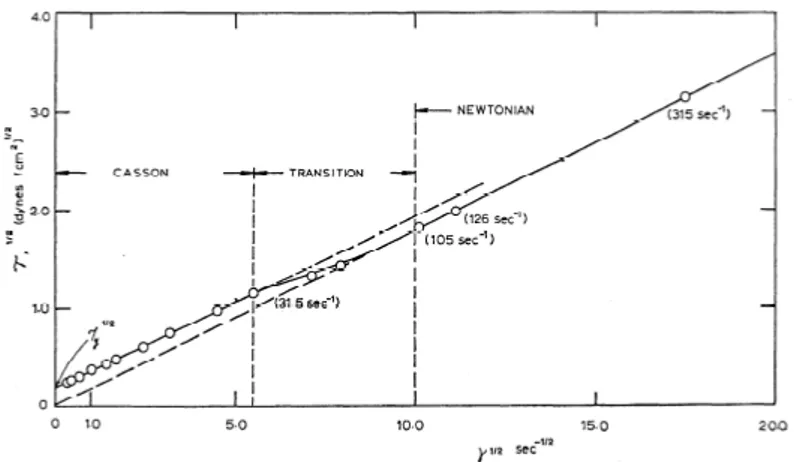
[46], [51]. Many empirical equations and models have been proposed in the last few decades to express this relation between τ and ˙γ, however there is none universally accepted. The most commonly used are the Casson model [3], [37], [51], and the Carreau-Yasuda model [3], [24], [27], [45], [51], which are briefly explained in the following paragraphs.
Figure 2.7: τ plotted vs. ˙γ for H = 40%, T = 37◦C. Note confusion of points near origin [40]. (1dynes/cm2= 0.1P a · s)
Casson rheology model is a modified Bingham plastic model in which blood is considered rigid when the shear stress is of smaller magnitude than a yield stress τ0 but flows like a Newtonian fluid when
τ > τ0. It is normally used when the non-Newtonian feature to
high-light is the presence of the yield stress. The general expression is √
τ = Kc
p
˙γ +√τ0 (2.2)
where
Kc is the Casson viscosity coefficient (a non-dimensional quantity);
τ0 is the yield stress, function of the hematocrit.
According to the definition of Bingham plastic, ˙γ is zero if τ < τ0.
Figure 2.8 represent the so called ‘Casson plot’, a double square root plot of shear stress vs. shear rate.
thin-22 Blood Rheology
Figure 2.8: Square root of shear stress plotted versus square root of shear rate (H = 40%; T = 37◦C). Note the determination of square root of yield stress τ0 by linear extrapolation [40].(1dynes/cm2 = 0.1P a · s)
ning feature of blood flow. It suggests the following equation which incorporates two limiting viscosity:
µ( ˙γ) = µ∞+ (µ0 − µ∞)[1 + (λ ˙γ)a](
n−1
a ) (2.3)
where
µ0 is the zero-shear-rate viscosity;
µ∞ is the infinite-shear-rate viscosity;
λ, a and n < 1 (shear thinning index) are curve fitting parameters that define the transition region. The parameters a and n are non-dimensional, the parameter λ has dimensions of time.
The main advantage of the Carreau-Yasuda model over other non-Newtonian blood models is that it is continuous for all ˙γ ≥ 0. We note that
lim
˙
γ→0µ( ˙γ) = µ0 γ→∞˙lim µ( ˙γ) = µ∞ (2.4)
indicating that at high shear rates the fluid acts as Newtonian with vis-cosity µ∞, whereas at low shear rates, the fluid acts as non-Newtonian
with viscosity µ0. This model is normally used in numerical modelling
schemes thanks to its easier implementation due to its continuity [9]. In this work, it is needed to emphasize the shear thinning property of blood, so the Carreau-Yasuda model is chosen. The chosen values for
2.3 Haemolisys 23
the parameters that define Equation 2.3 will be presented in chapter 5.
2.3
Haemolisys
Hemolysis refers to the loss, that is, damage of red blood cells [55]. Hemolysis has been thought to be of many origins, including the ef-fect of solid surface interaction, shear stress and high negative pressure gradients [38]. In normal human circulation system, the motion and resulting forces acting on blood components do not destroy them (typ-ical values of the wall shear stress in the normal circulation are found in the range 1-3 Pa), but may even facilitate their function. However, in some diseased state or when circulating in a foreign body (like a hemodialysis circuit), the destruction of blood components occurs and their orderly recycling process is altered. The occurrence of hemoly-sis is evidenced by elevated serum hemoglobin and the appearance of fragmented cells in the circulating blood called ‘ghost cells’.
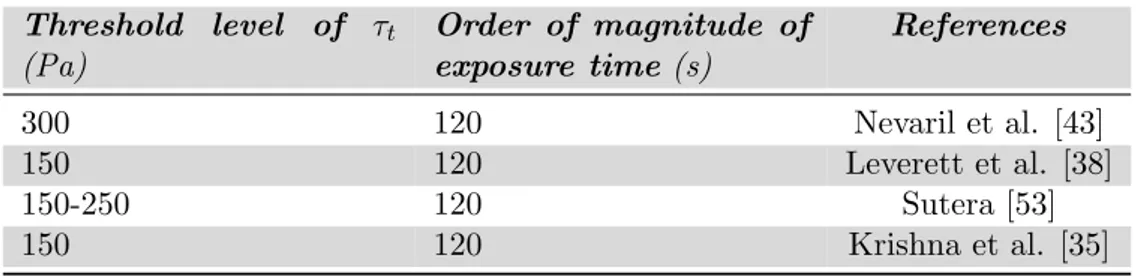
Many studies have been made on hemolysis, hypotheses have been proposed to explain the mechanism and threshold values for both the shear stress (τt) and negative pressure gradient (∆P ) for extensive
erythrocytes damage have been identified. Referring to the shear stress, three classes of hemolysis have been identified:
• Wall-red blood cells interaction(τt <150 Pa): cells that are in
physical contact with surfaces are mechanically torn or collapse upon themselves so that modification on their morphology are produced. In this regime of relatively low stresses there is little damage, dependent on the surface condition and contact duration. • Prolonged intermediate shear stress (τt >150 Pa): cells become
distorted in such a way that their membrane collapse upon them-selves. Shear stress > 150 Pa represents the threshold value above which occurs extensive cell damage and high rates of hemolysis are find.
• Short duration high shear stress (in excess of 4000 Pa): this hemol-ysis is caused by the yield stress of the cell membrane being ex-ceeded. In this regime of stress extensive hemolysis occurs.
24 Blood Rheology
Considering pressure gradient, Nevaril et al. [43] established that pressure drop of the rate of ∆P < 22 · 106 Pa/sec produce little or no red cell trauma.
Table 2.1: Threshold level of τt > in laminar flow for RBCs damage and
corresponding estimated exposure time from selected literature
Threshold level of τt (Pa) Order of magnitude of exposure time (s) References 300 120 Nevaril et al. [43] 150 120 Leverett et al. [38] 150-250 120 Sutera [53] 150 120 Krishna et al. [35]
2.4
Coagulation
Coagulation, or thrombosis, refers to the formation of clots in any part of the system in which blood is circulating. The thrombus lump or clot is an aggregate of blood elements that originates a 3D structure. Thromboembolic conditions are linked to the fluid mechanical proper-ties of blood flow and to the properproper-ties of the material of the circuit in which blood flows. Causes can be summed as:
• Shear stress: since stress is a natural activator of platelets, dur-ing relatively high shear stress, problems like platelets deposition and thrombosis onto biomaterials are of remarkable importance. Platelet activation, and as a consequence stable aggregation, oc-curs above 8 Pa [26] [42].
• Shear rate: the effect of shear rate on coagulation is still un-der investigation but many studies indicate that low shear rates could promote the initiation of thrombosis by reducing the re-moval of activated coagulation factors from surfaces. Low shear rates have also been found to increase fibrin deposition, which is a protein involved in blood clotting. Clinically, these hypothe-ses seem confirmed by the fact that stasis and low blood flow are considered risk factor for vein thrombosis. Moreover, at very
2.4 Coagulation 25
low shear rate conditions, such as those associated with stagna-tions zones, the fluid shearing forces of blood are not sufficient to overwhelm the forces associated with cell-cell interaction, so that, stable interaction between blood cells can be observed in these low shear environments. Investigations on the existence of a shear rate threshold value for the presence of coagulation have led Hirsch et al. [30], in 1968, to suggest ˙γ ' 46sec−1 as a lower limit for the absence of coagulation. Recent studies carried out by Shen et al. [50] propose a threshold of ˙γ ' 20sec−1.
• Surface contact : all surfaces other than the undamaged vascular wall endothelium induce a sequence of processes that results in thrombus formation. When blood comes in contact with a for-eign material, such as biomaterials, the first clinically manifest process that occurs is the activation of haemostasis. The study of this contribute lie outside the scope of this thesis and, as a consequence, in the next studies it won’t be considered.
Chapter 3
Bellco’s Monitor and
Bloodlines state of the art
This chapter traces an introduction regarding Bellco’s hemodialysis machine and bloodlines that are currently produced and commercial-ized. In the final section, considerations that led to re-design of the disposable ‘Cassette’ are described.
3.1
Hemodialysis machine
A ‘hemodialysis machine’ or ‘monitor’ is a device that allows a dialysis treatment to be carried out once the functional parameters are defined. Generally, the tasks of a hemodialysis machine are:
• to convey blood to the filter and returns it to the patient; • to provide for the supply of dialysate;
• to adjust the fluid exchange between blood and dialysate;
• to verify the proper running of a treatment by monitoring given variables (i.e. blood and dialysate pressures inside lines);
• to monitor the effectiveness of treatments;
Dialysis treatments in extra-corporeal circuit can be performed with different kinds of monitors. It is possible to operate a distinction as schematically shown in Figure 3.1.
28 Bellco’s Monitor and Bloodlines state of the art
Figure 3.1: Distinction between the different type of monitors
Both on-line monitors and off-line monitors exist; this division is based on the production method of the dialysate. In short, an on-line monitor is directly connected to the feedwater wastewater pipes of the host building in which is located and is provided with internal circuits and ultrafilters able to generate the dialysate. An off-line monitor uses pre-filled bags of fresh dialysate and empty bags to drain the spent dialysate. The second differentiation is between Captive and Stan-dard monitors. A Captive hemodialysis machine is able to carry out a treatment only via a custom disposable device specific for that model: dialysis is carried out only if the monitor recognizes the form of the de-vice. A Standard monitor performs dialysis treatment using disposable device with a standard layout marketed by any manufacturer (device’s structure must be compatible with the pressure reading tools of the monitor).
Bellco’s hemodialysis machines differ according to the type of pa-tient to treat:
• Acute Patients:
- Amplya R (Offline, Captive): it is a multitherapeutic system
for critical care capable of performing a vast number of ex-tracorporeal blood treatments with one single circuit. For each specific disease, Amplya R offers an integrated and
per-sonalized therapeutic approach that can aid patient survival and improve their quality of life.
• Neonatal Patients:
- Carpediem R (Offline, Captive): smaller patients have until
3.1 Hemodialysis machine 29
especially with regard to fluid balance. Carpediem R is the
only device on the market that offers specific neonatal treat-ments: miniature and portable, it responds to the safety and efficacy requirements for renal replacement therapies in such patients.
• Chronic Patients:
- Formula R (Offline, Standard): it was mainly used until the
introduction of the monitor Flexya R in 2012.
- Flexya R (Online, Captive): it is a monitor that allows
ad-ministering the largest possible number of dialysis treatments, so as to offer to each patient the best possible therapy. Monitors ‘Amplya R’ and ‘Flexya R’ interface with the Captive
dis-posable device examined in this thesis work. For that reason, Figure 3.2 shows, as example, the monitor ‘Flexya R
’ and its main components. Numbered components are listed in Table 3.1.
30 Bellco’s Monitor and Bloodlines state of the art
Table 3.1: List of Flexya R’s Components
Number Corresponding Component
1 Display
2 Dialysate connectors 3 Gripper for dialyzer positioning 4 Bicarbonate connector 5 Acid solution connector 6 Connector for dialysate infusion 7 Infusion line clamp 8 Level detector 9 Potentiometer
10 Connector for venous bloodline 11 Connector for arterial bloodline 12 Venous line clamp 13 Arterial line clamp 14 Heparin pump 15 Heparin pump
The frontal hematic panel is made up of (zoomed in Fig.3.3): • Peristaltic pump: designated for the generation of fluxes, they are
distinguished in arterial pump, venous pump and infusion pump; • Actuator-Sensor ‘Cassette Group’ : pressure sensors, cassette’s latching and locking mechanism, disposable identification cam-era.
3.2
Bloodlines currently in use
Once the main component and function of a hemodialysis machine have been described, it is worth noting that, in order to perform a dialysis treatment, they have to be connected to the bloodlines (hemodialyzer and disposable device). The next paragraphs describes with Bellco’s bloodlines main components and functions.
3.2.1 Dialyzer
The dialyzer is the central component of the hemodialysis system: blood purification, that is the goal of a dialysis treatment, occurs
in-3.2 Bloodlines currently in use 31
Figure 3.3: Flexya R’s frontal hematic panel.
side it. The blood compartment of the dialyzer is no longer monolithic nowadays, rather it is composed of thousands of semi-permeable cap-illaries (diameter of about 200µm) called ‘fibres’. Blood and dialysate flow on the two sides of the semi-permeable fibers in a countercurrent manner. It is the dialyzer membrane (formed by the fibres) that ba-sically decides which molecules are retained in the blood stream and which diffuse to the dialysate side: several kind of filters exist which are based on this membrane filtering characteristic. Dialyzers differ in their dimensions and number of fibres. In turn, fibres differentiate depending on the material with which they are manufactured (polyethersulfone, poly-amide, polymethylmethacrylate and other) and on the size of their pores. A complete dialyzer is made up of the fibres bundle inserted into a cylindrical plastic case (see Fig.3.4).
Bellco’s dialyzers contain from ∼ 5000 to ∼ 12000 fibres made of polyethersulfone and, based on the size of the membranes’ pores, are distinguished in High-Flux and Low-Flux. The cylindrical plastic case is made of polycarbonate (a polypropylene alternative is under devel-opment, see Fig.3.6).
In order to ensure and adequate purification of blood, typical blood fluxes are of the order of 300mL·min−1, dialysate flux of 500mL·min−1.
32 Bellco’s Monitor and Bloodlines state of the art
Figure 3.4: Typical Bellco’s dialyzer; indicated blood inlet and outlet, dialysate inlet and outlet.
Figure 3.5: Example of uncapped dialyzer.
3.2.2 Cassette
Prior to the release of the monitor Flexya R in 2012, the bloodline was
very simple and composed of separated arterial and venous lines, each provided in a separate blister. Furthermore, the monitor-bloodline cou-pling only allowed the implementation of standard treatments. Until 2012, Bellco’s hemodialysis machine for chronic patients was the mon-itor ‘Formula R’ (of which many variations exist) and an example of
its bloodline for a standard bicarbonate dialysis (BHD) is shown in fig.3.7. This kind of monitor-bloodline coupling presents the following limitations:
- impossibility to perform customized treatments, specific to the needs of the patient;
3.2 Bloodlines currently in use 33
(a) Polycarbonate case.
(b) Polypropylene case.
Figure 3.6: Plastic case of dialyzer
- bloodlines assembly requires time and manual dexterity of the operator.
In order to remove these disadvantages and because of the need to develop new products to penetrate the market, in 2012 the monitor Flexya R was introduced. For the purpose of executing a dialysis
treat-ment, Flexya R makes use of a bloodline characterized by the presence
of the cassette. Thanks to this new monitor-cassette coupling, the following requirements of the marketing division have been satisfied:
- execution of 14 different kinds of treatment, customized to pa-tient’s needs;
- quick and automatic bloodline installation on the monitor (im-proved ergonomics).
The Flexya R
hemodialysis machine has already been analyzed in sec.3.1. Here the disposable is considered, which consists of:
• Cassette: the component that interfaces with the hematic frontal panel of the hemodialysis machine;
34 Bellco’s Monitor and Bloodlines state of the art
Figure 3.7: Example of BHD standard Formula R bloodline.
• connectors;
• tubes (arteriosus line, venous line, infusion line).
The component of interest in the following is the cassette. The cassette is a 5 cavities device, made of rigid thermoplastic material, that can be schematized as in Fig.3.8.
Figure 3.8: General schematic of the ‘Cassette’. ‘Arterial’ means ‘before dialyzer’, ‘venous’ stays for ‘after the dialyzer’.
3.2 Bloodlines currently in use 35
The operating principle of the cassette can be understood referring to the arrows of Fig.3.8 that indicates the direction of the fluxes circu-lating inside the device: blood is drawn from the arterial access of the patient, enters the arteriosus compartment of the cassette and thanks to the movement of the arterial peristaltic pump is directed to the di-alyzer. Contemporary, dialysate is also drawn by the infusion pump and directed to the hemofilter for the pre-dilution. Once filtration has been carried out, the cleansed blood enters the venous chamber to-gether with the dialysate flux generated by the venous pump for the post-dilution and from here returns to the patient.
More exhaustively, the functions of the cassette are: • blood and dialysate directioning;
• monitoring of blood and dialysate pressures during dialysis treat-ment;
• deaeration of blood.
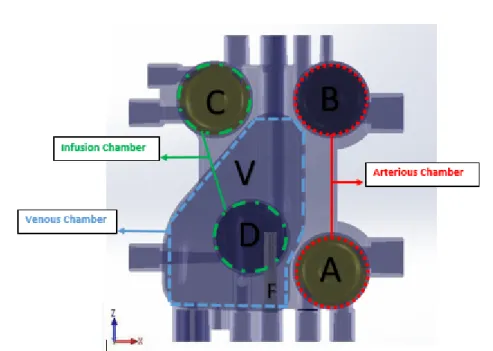
Cassette’s functions are carried out through the five cavities high-lighted with letters in Figure 3.9:
Chamber A is the Arterial pre-pump blood chamber: fistula1
pressure measurement in order to monitor the effectiveness of pumping, within the following range:
• Range: (-400; +200) mmHg;
• Maximum rating: (-400; +400) mmHg;
Chamber B is the Arterial post-pump blood chamber: pre-dialyzer pressure measurement in order to monitor the absence of clogging in the dialyzer, within the following range:
• Range: (-200; +800) mmHg;
• Maximum rating: (-400; +800) mmHg;
1
Fistula: a type of vascular access for hemodialysis that consists in an artificial com-munication, obtained via surgery, between an artery and a vein, in order to divert high pressure arterial blood in the venous system so as to obtain adequate blood flow to carry out dialysis treatment [11].
36 Bellco’s Monitor and Bloodlines state of the art
Figure 3.9: CAD model for the cassette; letters indicate the various cham-bers
Chamber C is the Infusion chamber: infusion negative pressure measurement in hemodiafiltrative treatments, within the follow-ing range:
• Range: (-400; +200) mmHg;
• Maximum rating: (-400; +800) mmHg;
Chamber D is the Infusion chamber: infusion positive pressure measurement in hemodiafiltrative treatments, within the follow-ing range:
• Range: (-200; +800) mmHg;
• Maximum rating: (-400; +800) mmHg;
Chamber V is the Venous chamber: allows blood deaeration and enable venous infusion pressure measurements in order to monitor to absence of clots, within the following range:
• Range: (-200; +500) mmHg;
3.2 Bloodlines currently in use 37
Note that letter F in the Venous chamber indicates a small filter that prevents the infusion to the patient of any impurities or clots.
Chambers A,B,C,D are used to monitor pressure during treatments. Monitoring is paramount in order to achieve the maximum effectiveness of dialysis: during a dialysis session, pressures must oscillate within specific ranges. Pressure transduction is committed to concave, disc-shaped, impervious membranes (see Fig.3.10) that divide the respective chambers in two hermetically separate compartments: one contains liq-uid (blood/dialysate) while in the other there is trapped air that serves as control volume for the transducer (see Fig.3.11). Depending on the pressure variations of the liquid in the respective compartment, the membrane is stimulated to deform and transmit the pressure oscilla-tions to the air control volume. This sequence liquid-membrane-control volume represents the pressure transduction pathway (see Fig.3.12).
(a) Top view of membrane. (b) Bottom view of membrane.
Figure 3.10: Schematic of a membrane [22].
Depending on the type of measure (higher of lower that the preload-pressure, that is equal to the atmospheric pressure), the membrane must be placed with the concavity towards liquid compartment (nega-tive pressure measurements) ot toward the air compartment (posi(nega-tive pressure measurements), as summed in Fig.3.13 and Fig.3.14.
As mentioned before, the venous chamber ‘V’ is the only whose main purpose is not just pressure monitoring. In fact, it makes deaer-ation of blood possible. This function is paramount for patient safety. During dialysis treatments, microemboli develop in the blood circuit: if they are not trapped in the venous chamber, they can be returned to patient’s vascular access (in the worst case, embolism can result in patient death in the event that it affects an artery). Downstream the
38 Bellco’s Monitor and Bloodlines state of the art
Figure 3.11: View of a sectioned chamber used for positive pressure mea-surements.
3.2 Bloodlines currently in use 39
Figure 3.13: View of the correct placement of membranes inside cassette
40 Bellco’s Monitor and Bloodlines state of the art
venous chamber a supplementary air detector and a clamp are provided as an additional safety measure.
Once cassette’s components and relative functions have been defined , the currently used cassette is shown (Fig.3.15).
The materials of which i is made of are summarizeed in tab.3.2;while Fig.3.16 and Fig.3.17 show its body and membranes respectively.
Table 3.2: Currently used materials
Component Material Cassette’s body PVC
Membranes EPDM
PVC (polyvinyl chloride) is a biocompatible2 plastic material
com-monly used for the fabrication of medical disposable. Its main advan-tages are:
• low cost;
• moulding and bonding ease;
• possibility to modulate its mechanical properties by adding ad-ditives during the extrusion process (in the past, the most com-monly used additives - plasticizers - were phthalates, ever since banned for their toxicity, nowadays the more stable and non-toxic terephthalates are used).
PVC does not possess good mechanical properties, thus, larger thick-nesses are required in order to manufacture rigid components. Larger thickness may cause problems in moulding and cooling of the parts. Another unfavourable feature of PVC is its yellowing caused by ster-ilization or ageing. For obvious reasons, yellow is not a likeable color for a medical disposable: for that reason the currently used cassette is doped with brighteners (antagonists to the yellow degradation prod-ucts).
2
Blood Compatibilty: when in contact with a living system, the material must not cause adverse reactions that can compromise the ability to use it for as long as expected. Espe-cially, an essential requirement for a haemocompatible material is its non-thrombogenicity (must not encourage the formation of clots when in contact with blood) [66].
3.2 Bloodlines currently in use 41
(a) Front view.
(b) Rear view.
42 Bellco’s Monitor and Bloodlines state of the art
(c) Isometric view.
(d) Venous Chamber detail.
3.2 Bloodlines currently in use 43
(a) Front view of the PVC cassette’s body.
(b) Rear view of the PVC cassette’s body.
44 Bellco’s Monitor and Bloodlines state of the art
EPDM is a thermosetting elastomer made of ethylene, propylene and a diene monomer. It is a haemocompatible material, suitable for blood contact, characterized by good mechanical properties and gas impermeability. An unfavourable characteristic is its black colour.
(a) Top view of EPDM membrane. (b) Bottom view of EPDM membrane.
Figure 3.17: EPDM membranes.
3.2.3 New Cassette’s Design Input Requirements
In the previous section, components and respective functions of the cur-rently used cassette and the materials with which it is manufactured have been described. Moreover, the main advantages and disadvan-tages of both the PVC cassette’s body and the EPDM membranes were highlighted. In the following section, the motivations that led to the design of a new disposable, which are mainly linked to the choice of new materials, are listed. They can be summarized as follows:
• reduction of manufacturing costs and time: the productive process of the currently used cassette consists in molding for the PVC cassette’s body and molding followed by vulcanization for the EPDM membranes. These processing techniques, together with part assembly, do not ensure process repeatability and ro-bustness and, furthermore, are characterized by high production costs and times. As will be seen in the next chapter, in order to fulfil this input, new materials that allow co-moulding have been chosen: this guarantees lesser production costs and times and major robustness of the production process;
3.2 Bloodlines currently in use 45
• specific requirements for the new materials: chosen poly-mers selected for the replacement of PVC and EPDM should have similar mechanical properties, must be haemocompatible and they must be transparent. All these properties must be ful-filled even after sterilization (with beta or gamma ray) and ageing; • disposable’s rigidity improvement;
• design manufacturing improvement;
• better removal of entrapped air: deaeration of circulating blood is paramount both for patient safety and for a proper exe-cution of the treatment;
Chapter 4
Cassette New Design
In sec.3.2.2, components and main functions of the disposable were examined. The one currently used was also shown and described. In this chapter the new design of the cassette is presented and choices that were made in order to satisfy the project inputs are clarified.
4.1
Geometry
First of all, it must be made clear that changes to the geometric layout of the new cassette are limited by constraints imposed by the inter-face between cassette and monitors. These constraints, illustrated in Fig.4.1, are represented by:
• Constraints A: mutual positioning between the slots of the pump-ing segment;
• Constraints B : mutual positioning between the slots of the pres-sure transducer of the monitor.
Moreover, the new cassette must have the same number of ports (16, as shown in Fig.4.2), in order to allow the implementation of all feasible the treatments with the cassette currently used.
48 Cassette New Design
(a) Constraints A.
(b) Constraints B.
4.2 Materials 49
Figure 4.2: Currently used cassette; ports indicated by numbers.
4.2
Materials
The project inputs for the design of the new cassette mainly concern the choice of the materials of which the cassette and the membranes are manufactured. The fulfilment of the requirements explained in sec.3.2.3 led to the following choices.
• Cassette’s body: to replace PVC, the polymer PETG SKY-GREEN S2008 was chosen (see Fig.4.4). PETG is obtained from PET (polyethylene terephthalate) by addition of a glycol. This results in improved workability, allowing the moulding of signifi-cantly complex parts too. Furthermore, compared with the PET, PETG melts more easily and shows less crystallization, resulting in lower fragility, lower shrinkages but also in reduced resistance.
The strengths of PETG to PVC are: - possibility of being co-moulded;
50 Cassette New Design
(a) Front view.
(b) Rear view.
4.2 Materials 51
(c) Isometric view.
(d) Venous Chamber detail.
52 Cassette New Design
(a) Front view.
(b) Rear view.
4.2 Materials 53
- high softening temperature allowing fast moulding (PETG does not require long cooling times);
- excellent clarity and haze;
- PETG does not need the use of brighteners since it does not turn yellow as a result of sterilization or ageing.
On the other hand, disadvantages of PETG in comparison to PVC are:
- higher cost of raw material (abated by the possibility of co-moulding);
- bonding problems with tubing due to its resistance to cyclo-hexanone.
• Membranes: concerning the replacement of EPDM, a PE elas-tomer manufactured by the German company ‘ACTEGA’was cho-sen (see Fig.4.5). This elastomer has slightly worse mechanical properties than the EPDM, but can be manufactured with co-moulding and it is transparent (even after sterilization and age-ing). In addition, experimental tests conducted in the company laboratories have proved its satisfactory reliability and accuracy as a pressure transducer.
(a) Top view of the ACTEGA mem-brane.
(b) Bottom view of the ACTEGA mem-brane.
Figure 4.5: ACTEGA membrane.
In summary, according to the project inputs requirements, the new cassette shall be co-moulded and shall be produced faster that the
54 Cassette New Design
one currently in use. It shall also be lighter and at the same time less deformable, it shall be transparent and will not turn yellow. It is also worth noting that the new disposable is characterized by colour uniformity (see Fig.4.6), guaranteed by the transparency of both the PETG-SKYGREEN and the elastomer-ACTEGA, unlike the currently used ones (light blue PVC - black EPDM).
4.3
The Venous Chamber
The venous chamber is the cassette’s component that has been changed most, owing to the fact that it should not directly satisfy the constraints A and B (see fig.4.1); its only specifications concerns with the internal volume, which shall not be increased. Changes that have been made, together with reasons that led to their implementation, are summarized below:
a) external profile modification: ensures greater rigidity, facili-tates molding and ultrasonic welding of the cover;
b) reduction of the internal volume: in order to satisfy a re-quest made by the marketing department (the internal volume was decreased from 33,9mm3 to 27,5mm3, δV = −23%);
c) relocation of the venous infusion port: in-vitro tests high-lighted that the proximity between the chamber walls and the filer may enhance coagulation; for that reason the venous infu-sion port, and so the filter, has been relocated in the center of the chamber, where the distance between walls and filter is maximum; d) addition of the inlet duct: its insertion improves fluxes
direc-tion and increases recirculadirec-tion;
e) bulkhead removal: its presence caused the occurrence of re-circulation zones; it has been removed since now this function is carried out by the inlet duct and in order to decrease the surface that is in contact with blood;
f) relocation of the heparin infusion port: molding require-ment;
4.3 The Venous Chamber 55
(a) Currently used cassette
(b) New cassette.
Figure 4.6: Differences between colours uniformity in the currently used disposable and in the new ones.
![Figure 1.2: The Nephron and its components [62].](https://thumb-eu.123doks.com/thumbv2/123dokorg/7446770.100723/22.892.290.566.663.1014/figure-the-nephron-and-its-components.webp)
![Figure 1.3: Schematic of a peritoneal dialysis treatment [64].](https://thumb-eu.123doks.com/thumbv2/123dokorg/7446770.100723/27.892.254.664.259.483/figure-schematic-peritoneal-dialysis-treatment.webp)
![Figure 1.5: Difference between hemodialysis and hemofiltration [59]](https://thumb-eu.123doks.com/thumbv2/123dokorg/7446770.100723/29.892.225.700.255.513/figure-difference-between-hemodialysis-and-hemofiltration.webp)
![Figure 2.3: Shear stress / Shear Strain relationship for Newtonian and non- non-Newtonian fluids [55].](https://thumb-eu.123doks.com/thumbv2/123dokorg/7446770.100723/36.892.231.637.551.776/figure-shear-stress-shear-strain-relationship-newtonian-newtonian.webp)
![Figure 2.6: Effect of tube diameter on apparent viscosity of blood for H = 40% T = 38 ◦ C [55]](https://thumb-eu.123doks.com/thumbv2/123dokorg/7446770.100723/38.892.197.652.702.1012/figure-effect-tube-diameter-apparent-viscosity-blood-h.webp)
![Figure 2.7: τ plotted vs. ˙γ for H = 40%, T = 37 ◦ C. Note confusion of points near origin [40]](https://thumb-eu.123doks.com/thumbv2/123dokorg/7446770.100723/39.892.290.642.362.623/figure-τ-plotted-note-confusion-points-near-origin.webp)