ALMA MATER STUDIORUM UNIVERSITÀ DI BOLOGNA
FACOLTA’ DI CHIMICA INDUSTRIALE
Dipartimento di Chimica Organica “A. Mangini”
Corso di Laurea Magistrale in Chimica Industriale
Classe LM-71-Scienze e Tecnologie della Chimica Industriale
Synthesis, characterization and conformational
studies of arylbenzylmaleimides
TESI
DI
LAUREA
SPERIMENTALE
Presentata da
Martina Ambrogi
Relatore
Prof. Andrea Mazzanti
Co-Relatore
Dott. Michele Mancinelli
Sessione II
Ai miei nonni
SOMMARIO
A partire dalle scoperte di Pasteur la stereochimica ha ricoperto un ruolo sempre più importante nelle scienze chimiche; in particolare lo studio conformazionale di molecole con chiralità assiale sta riscuotendo un rilevante interesse. Attraverso analisi NMR dinamico e simulazione degli spettri è infatti possibile ricavare i valori energetici delle barriere di rotazione di diversi conformeri. Quando tale barriera è sufficientemente elevata si possono ottenere composti atropisomerici stabili e separabili come forme enantiomeriche, che trovano applicazione in stereo-sintesi e in processi di impaccamento. L’impiego di 3,4-bis-arilmaleimmidi sostituite, in cui i gruppi aromatici risultano sufficientemente ingombranti, genera configurazioni atropisomeriche stabili e separabili a temperatura ambiente. L’assegnazione delle configurazioni assolute viene eseguita attraverso analisi ECD e comparazione con calcoli computazionali. Le caratteristiche di attività biologiche dei derivati maleimmidici allargano inoltre il campo di applicazione degli atropisomeri anche a sistemi biologici.
ABSTRACT
From the discoveries of Pasteur, stereochemistry has played an increasingly important role in the chemical sciences. In particular conformational study of molecules with axial chirality is object of intense research. Through Dynamic-NMR analysis and simulation of the spectra, the energy rotational barriers value of conformers are obtained. When this barrier is high sufficiently, atropisomeric stable compounds can be reached. They can be separated and used in stereo-synthesis and in packing processes.
3,4-bis-aryl maleimides, in which the aromatic groups are sufficiently bulky, generate atropisomeric stable configurations, that can be isolated at room temperature. The assignment of absolute configurations is performed through ECD analysis and comparison with computational calculations. The biological activities of maleimide derivatives widen the field of atropisomers application also in biological systems.
INDEX
1.
I
NTRODUCTION………....………...… 1.1 AXIAL CHIRALITY AND ATROPISOMERISM………... 1.2 MALEIMIDES………... 1.3 INVESTIGATION TECHNIQUES FOR CALCULATION OF ROTATIONALENERGY BARRIER……….…………....…
1.3.1 DYNAMIC NUCLEAR MAGNETIC RESONANCE.…………...… 1.3.1.1 COALESCENCE METHOD.…………...………... 1.3.1.2 LINE SHAPE SIMULATION.…………...………....… 1.3.2 DENSITY FUNCTIONAL THEORY (DFT).………….……....….…
1.3.2.1 GROUND STATES.………….………..…
1.3.2.2 TRANSITION STATES.………….…………..………..… 1.3.3 ELECTRONIC CIRCULAR DICHROISM (ECD)...………...… 1.3.4 X-RAY DIFFRACTION...………..……...
2. R
ESEARCHO
BJECTIVES...………....…3. R
ESULTSA
NDD
ISCUSSION...………...………...4. C
ONCLUSIONS...………...………...…5. E
XPERIMENTALS
ECTION……...………...… 5.1 SYNTHESIS OF REAGENT 1..………...……. 5.2 SYNTHESIS OF BORONIC ACID 2f..………...… 5.3 BIS- ARYLBENZYLMALEIMIDE COMPOUNDS (4)..………..….. 5.4 MONO- ARYLBENZYLMALEIMIDE COMPOUNDS (3)..………..………….6.
R
EFERENCE..………...….……… pg.1
pg.2
pg.4
pg.7
pg.7
pg.10
pg.11
pg.13
pg.14
pg.15
pg.16
pg.19
pg.21
pg.22
pg.48
pg.49
pg.50
pg.50
pg.51
pg.55
pg.62
1. INTRODUCTION
1In 1848, Louis Pasteur recognized the omnipresence and significance of chirality, which prompted his famous statement about the chirality of the universe (l’univers est
dissymmétrique).2 Nowadays, we well recognize that chirality can indeed be encountered at all levels in nature. Pasteur realized that chiral objects exist as a pair of mirror images that are not superimposable, wiz related to each other like a right-handed and left-handed glove. At the molecular level, chirality gives rise to enantiomeric pairs that can exhibit strikingly different chemical and biological properties in a chiral environment.
A renowned example of a chiral drug that undergoes fast enantioconversion under physiological conditions is thalidomide of the 1960s. Since the thalidomide tragedy the significance of the stereochemical integrity of biologically active compounds has received increasing attention and the investigation of the stereodynamic properties of chiral molecules has become an integral part of modern drug development.
The unique stereodynamics of chiral compounds have paved the way to artificial machines and other molecular devices that lie at the interface of chemistry, engineering, physics and molecular biology. Both chirality and conformational flexibility are essential for unidirectional motion of the rotor around the stator.
Since the discovery of the ubiquity of chirality by Pasteur, stereochemistry has undoubtedly emerged as one of the most important and fascinating areas within the chemical sciences. Stereochemistry embraces a broad variety of closely intertwined static and dynamic aspects that are all related to the three-dimensional structure of molecules. While static stereochemistry deals with the spatial arrangement of atoms in molecules and the corresponding chemical and physical properties, dynamic stereochemistry emphasizes structural change and comprises asymmetric reactions as well as interconversion of configurational and conformational isomers. The dynamic stereochemistry plays a fundamental role in modern chemistry, spanning multiple disciplines from asymmetric synthesis and drug discovery to material sciences.
1.1 AXIAL CHIRALITY AND ATROPISOMERISM
Axial chirality is a peculiar source of chirality, in that the molecule does not possess a stereogenic centre but an axis about which a set of substitutents is held in a spatial arrangement that is not superimposable on its mirror image. The chirality of these molecules are often related to the dihedral angle generated by the chirality axis.
In a chain of atoms a-b-c-d (Figure 1), torsion angle is the dihedral angle between the plane containing the atoms a, b, c and that containing b, c, d. This system has two extreme conformations called anti and eclipsed. The torsion angle between groups a and
d is then considered to be positive (absolute configuration is P or ∆) if the bond a-b is
rotated in a clockwise direction through less than 180° in order that it may eclipse the bond c-d. A negative torsion angle require rotation in the opposite sense (absolute configuration is M or Λ).3 By applying the Cahn-Ingold-Prelog rules to the substituents
bonded to b and c, a and d can be identified and the sign of the dihedral angle can be assigned.
A subclass of conformers which can be isolated as separate chemical species (enantiomers or diastereoisomers) and which arise from restricted rotation about a single bond is called atropisomer.
The term “atropisomerism” (from the Greek, a = not and tropos = turn) was introduced by Kuhn4 in 1933 and Oki was the first to discuss the borderline between rotating bond and atropisomers in 1983. He defined atropisomers as conformers that interconvert with an half-life of more than 1000 seconds at room temperature (+25 °C).5 Within this
framework, atropisomers differ from other chiral compounds since thermal racemisation is possible.
Atroposelective synthesis may be carried out by use of chiral auxiliaries or by isomerisation reactions that favours one atropisomer over the other (thermodynamic
The concept of axial chirality as a stereogenic source in a rotationally hindered compound was for many years relegated to the academic field. This situation changed, however, with the discovery of many bioactive natural compounds containing stereogenic chiral axes and with the discovery of many catalysts useful for asymmetric synthesis. In particular, axially chiral biaryl systems have proved to be very efficient in the transfer of chirality.6 It is important to note that the slow axial rotation along the
chirality axis can be due to by steric hindrance and/or electronic factors, and that conformational stability of the stereogenic axis under the reaction conditions is the crucial requirement to obtain enantio-enriched products. This implies that the rotational barrier must be greater than 25–26 kcal/mol or, more conveniently, greater than 30 kcal/mol.
This class of molecules has very important application fields like medium to promote biological reactions or in organocatalysis as auxiliaries and catalysts. The most popular systems used for asymmetric synthesis contain the binaphthyl scaffold.
A famouse example is the diphosphine BINAP7 (Figure 2) which is the ligand of choice in Ru-catalyzed asymmetric hydrogenations of C=C and C=O bonds. For the studies in chirally catalysed hydrogenations Noyori was awarded the Nobel Prize in Chemistry in 2001.
Figure 2 The two enantiomers of BINAP
The search for new atropoisomeric systems and the related conformational analysis can be considered nowadays an open research field.
1.2 MALEIMIDES
Maleimide is a class of compounds consisting of a 1H-pyrrol-2,5-dione functionalized core (Figure 3).
Figure 3 Maleimide chemical structure
The name is an abbreviation of “maleic acid” and “imide” suggests its chemical synthesis from maleic anhydride (Figure 4).8
Figure 4 Cava et al. synthesis of N-Phenylmaleimide (1973)
The maleimide scaffold is recognized in a variety of natural products including the arcyriaflavin, arcyriarubin, himanimide, plycitrin, and rebeccamycin families. Showdomycin (Figure 5), a nucleoside antibiotic isolated from Streptomyces
showndoensis, and active against several Gram-positive bacteria, is an example.9
Figure 5 2-(β-D-ribofuranosyl)-maleimide (showdomycin)
Another important biological molecule which contains maleimide unit is the antitumor indolocarbazole rebeccamycin, a topoisomerase-I inhibitor. Chemically related to rebeccamycin is the staurosporine, that represents another indolocarbazole with broad and potent activity against several kinases at the ATP site (Figure 6).
(a) (b)
Figure 6 Rebeccamycin (a) and Staurosporine (b) chemical structures
Inspired from the staurosporine structure, 2,3-diarylmaleimides have been designed and described as protein kinase inhibitors.10 An example is their potent inhibitor effect towards glycogen synthase kinase-3 (GSK-3). GSK-3 expression and activity are associated with various disease processes, and GSK-3 inhibitors have arisen as promising drugs for the treatment of diabetes, neurodegenerative conditions such as bipolar disorder, stroke, inflammation and cancer.11 On the other hand the study of atropisomeric maleimides derivates has been overlooked for several years, but recently they raised interest from the chemical and biological research mainly owing to their biological properties.
Bis-arylmaleimide protein kinase inhibitors have attracted great interest from synthetic
and medicinal chemistry. The product may serve as a new probe for the biomedical imaging technique monitoring of the enzyme GSK-3 in diseases. MKC-112 and SB-21676313 are two examples of new potent molecules synthesised by Wang et al. (Figure
7).
(a) (b)
Figure 7 MKC-1 (a) and SB- 216763 (b) chemical structures
The stability of bis-indolylmaleimide was investigated by Barrett and co-workers some years ago.14 They discovered that, with a tether in place of bis-indolylmaleimides, the
in configurational stability. The rate of interconversion of the syn and anti conformers may be varied by over twenty orders of magnitude through substitution of a bis-indolylmaleimide ring system, which is constrained within a macrocyclic ring. Indeed, the macrocycles 18Ph (R= phenyl) and 18Bn (R= benzyl) (Figure 8) are the first examples of configurationally stable atropisomeric bis-indolylmaleimides.
1.3 INVESTIGATION TECHNIQUES FOR CALCULATION OF
ROTATIONAL ENERGY BARRIER
Compounds that exist as a mixture of fast interconverting stereoisomers are often conveniently, although inaccurately, viewed as one average structure. A closer look reveals that the vast majority of organic compounds are conformationally free, and that more than one conformation is populated.
In recent years, the experimental study of atropisomers (i.e. conformationally constricted isomers) could be compared with the computational data. New software can be easily used by any chemist to calculate the structures and properties of molecules; it is possible to find the 3D-structure of the ground and transition states and calculate the free Gibbs activation energy ∆G#. It is also possible to calculate NMR and ECD data, which are important to establish the absolute configurations.
1.3.1
DYNAMIC NUCLEAR MAGNETIC RESONANCE
Variable-temperature NMR spectroscopy, often referred to as dynamic NMR (DNMR), is a powerful tool for investigating stereodynamic processes. Consider the molecule in Figure 9: dimethylformamide (DMF).
Figure 9 DMF is a two-site exchange example15
Figure 10 Variable-temperature NMR spectra of an uncoupled dynamic two-site system
If the rotation about the C-N bond is frozen the two methyl groups are different (A and B), and they should have distinct NMR signals. The blue line in Figure 10, taken at relatively low temperature, shows this. However, the two methyl groups can exchange themselves by rotation about the bond between the nitrogen and the aldehyde group. As the temperature of the sample is raised, the methyl signals broaden, (the exchange rate become fast relative to the NMR timescale) move together, coalesce (yellow line in
Figure 10), and will eventually merge to yield a single averaged sharp line when the
rotation is very fast (red line in Figure 10).
The resonance frequency of a nucleus is given by its specific magnetic environment. If nuclei change magnetic environments quickly (on this timescale), only an averaged NMR spectrum is visible. If nuclei exchange slowly (or not at all), individual environments can be seen. Between these extremes, there is a rich variety of conformationally averaged lineshapes.
The energy barrier to interconversion is often difficult to distinguish between the individual isomers of stereolabile compounds, but the interconversion of stereoisomers exhibiting anisochronous nuclei can be monitored by variable-temperature NMR spectroscopy when the process is slow on the NMR timescale.
This is the case when:
1 ≪ ∆ν √2
k = the interconversion rate constant (s-1)
t = interconversion time (s)
∆ν = NMR shift separation of the signal (Hz) at low temperature at which exchange does
not occur.
This equation indicates that different positions of the same nucleus can show distinct signals when the chemical shift difference (∆ν) corresponds to a time spent by the nuclei in different positions longer than the interconversion time t.
As the difference of the signals, in Hz, is proportional to the strength of the applied magnetic field, a higher magnetic field NMR spectrometer can distinguish two conformations that are not distinguishable by a low field NMR spectrometer at the same temperature. This is important when the shift separations are very small or when it is necessary to perform spectra at very low temperatures, where the solvent viscosity broadens the signals or the products are not very soluble.
Variable-temperature NMR spectroscopy has been applied extensively in the conformational analyses and kinetic studies of stereodynamic processes with energy barriers between 4.5 and 31 kcal/mol. The energy range covered by DNMR is limited by the NMR timescale, spectral resolution and the practical NMR temperature range (from -180 °C to +160 °C) which ultimately depends on the melting and boiling points of suitable solvents.
For the high-temperature range, DMSO-d6 (b.p. +210 °C) or C2D2Cl4 (b.p. +146 °C) are
usually employed. Solvents without any hydrogen atoms, such as tetrachloroethylene (b.p. +121 °C), hexachloroacetone (b.p. +70 °C/6 mm Hg) or hexachlorobutadiene (b.p. +210 °C) can also be used.
Variable-temperature experiments down to –100 °C are usually recorded in CD2Cl2 (m.p.
–97 °C), THF-d8 (m.p. –118 °C) or CD3OD (m.p. –95 °C). Quite a wide temperature
range is accessible with toluene-d8 (from –95 °C to +110 °C).16
If the temperature has to be decreased well below –100 °C, the samples have to be prepared in a more sophisticated way, with use of liquefied gases such as Me2O,17 vinyl
The use of solvents which contain hydrogen is often impractical because of their very strong signals, which can overlap with the signals of the diluted solute. Freons®, in contrast, either do not show any signal in the proton spectra (CBrF3, CF2Cl2), or only
give a signal in the aromatic region of the spectrum (CHFCl2, CHF2Cl, CHF3) and are
also quite good solvents even at very low temperatures. 1.3.1.1 COALESCENCE METHOD
In the absence of any coupling, at the coalescence temperature, the first-order interconversion rate constant can be calculated as:
∆ν √2
kTC = rate constant (s-1);
TC = coalescence temperature (K);
∆ν = difference in the chemical shifts (Hz) of the two signals without exchange.
Further increasing to the temperature, the exchange rate is too fast and only a single averaged signal is observed (red line in Figure 10). By weighted average the chemical shift can be calculated:
,
νA,B = chemical shift (Hz) of the signal with exchange;
νA = chemical shift (Hz) of the signal at low field without exchange;
νB = chemical shift (Hz) of the signal at high field without exchange;
χA = molecular fraction of the signal at low field without exchange;
χB = molecular fraction of the signal at high field without exchange.
From the k values, free energy of activation (∆G# in kcal/mol) can be extracted by application of the Eyring equation,21 where T is the absolute temperature and k is the rate constant in s-1:
∙ ∆
#
h = Planck’s constant (1.584·10-34 cal·s) kB = Boltzmann constant (3.2998·10-24 cal/K)
Solving for ∆G# (in kcal/mol):
∆ # 4.574 ∙ 10 ∙ ∙ 10.318
The determination of the exact temperature inside the sample is crucial for the determination of the thermodynamic parameters. An error of ±2 °C in the temperature causes an error in ∆G# of 0.15 to 0.2 kcal/mol,22 and this is usually the main source of
errors in the DNMR technique.
A spectrometer always shows a “dial temperature” determined by a thermocouple underneath the NMR tube. The temperature of the sample giving rise to the observed NMR signals (i.e., in the region of the RF coils) is usually different, and can be correlated to the “dial temperature” by a calibration curve.
The most common samples used for temperature calibration are isopentane or methanol (for low temperature range) and DMSO-d6 or ethylene glycol (for high temperature
range). The real temperature inside the sample in the coil region is determined by a tiny Cu-Ni thermocouple connected to an high precision digital thermometer. From the experimentally measured temperatures and dial temperatures, a calibration curve can be derived. The uncertainty in temperature measurements with such a calibration curve can be estimated as ±1°C. 23
The simplicity of the coalescence method, for the simple two-site case, has certainly contributed to its widespread use. However, this method is not applicable neither to interconversion of species with different thermodynamic stability, nor to compounds that show complicate NMR spectra with multiple coupling patterns. In these cases, the rate constants, at the different temperatures, are better obtained by NMR line shape analysis with customized programs.
1.3.1.2 LINE SHAPE SIMULATION
The rate constants involved in conformation processes detectable by dynamic NMR cover approximately the range from 102 to 106 s–1.
When two nuclei A and B are exchanged in a dynamic process with a kinetic constant k, the corresponding lines broaden, reach the coalescence point and eventually yield an average signal when the exchange rate constant becomes large. The presence of more than two signals and more than a single rate constant can complicate this situation;
nevertheless the whole system can be mathematically simulated. With the use of increasing calculation power it is possible to handle mathematical models that can simulate second-order spectra and quite complex spin systems (up to 11 nuclei).24 Once a good spectral simulation is obtained at the temperature where all the dynamic processes are frozen (i.e., when k = 0), the line shape at higher temperatures can be simulated by changing the values of the rate constants. Corrections are needed if chemical shifts, J couplings and conformer ratios are also temperature-dependent. Through the matching of simulated and experimentally measured spectra, the kinetic constant (k value) is obtained at each given temperature and the free energy of activation (ΔG#) can then be derived by means of Eyring equation.
An example of how quite a complex spectral pattern can be reproduced is displayed in
Figure 11. This is the method used in this experimental work.
1.3.2 DENSITY FUNCTIONAL THEORY (DFT)
Up to the end of the 1990s, conformational calculations of organic molecules were mainly performed by molecular mechanics (e.g., MM3,25 MMX,26 MMFF,27 Amber28 etc.) and semiempirical methods (AM1,29 PM3,30 MINDO31 being the most popular). The results obtained were often quite accurate, at least for the calculation of the ground-state conformations. For the calculation of transition ground-states, in contrast, these methods have intrinsic limitations. Usually the interconversion barriers were calculated by moving the relative parts of the molecule in fixed steps and optimizing the remaining parts. Otherwise, a “handmade” transition state was assumed, and the geometry was optimised within certain constraints. As a result of these approximations, the computed barriers were prone to relatively large errors, and there was no guarantee that a real transition state had been located. 32
When the application of ab initio methods (HF) became available for medium-sized molecules the situation was greatly improved, although the neglecting of electron correlation was a serious limitation, partially solvable only through the employment of higher methods such as MP2.33 Unfortunately, this approach was not manageable without a very large computational facility.
On the contrary, Density Functional Theory (DFT) has the great advantage of taking account of electronic correlation at a reasonable computational cost.34 The basic idea of DFT is that for a collection of electrons and nuclei the ground state molecular energy, the wavefunction and all other molecular electronic properties are uniquely determined by the electron probability density ρ(x,y,z), a function of three variables. The ground state energy, E0, is a functional of ρ: E0 = F [ρ].35
In recent years, the availability of inexpensive high-performance servers and manageable software (Gaussian 09,36 and Spartan37 being the most famous) has allowed high-level calculations to be performed in a reasonable amount of time for molecules containing up to 50–60 atoms.
DFT calculations are very interesting for dynamic NMR because they can be applied both to obtain the conformations of ground states and also to find the correct geometries and energies of ground and transition states. Thanks to vibrational analysis, there is always confirmation that the correct transition state has been unambiguously identified.
The premise behind DFT is that the energy of a molecule can be determined from the electron density instead of a wave function. The original theorem, by Hohenberg and Kohn,38 was applied only to find the ground state electronic energy of a molecule. A practical application of this theory was developed by Kohn and Sham;39 they expressed the electron density as a linear combination of basis functions and then a determinant is formed from these functions, called Kohn-Sham orbitals.
1.3.2.1 GROUND STATES
Some uncertainty is involved in determining the relative energies of possible ground states. In recent years many papers addressing the performance of various DFT functionals in determining relative energies in reactions have appeared,40 but for conformational analysis there have been very few.
For accuracy consideration the smallest basis set used is generally 6-31G* or the equivalent. Interestingly, there is only a small increase in accuracy obtained by using very large basis sets. This is probably due to the fact that the density functional has limited accuracy compared to that of the basis set. The accuracy of results from DFT calculations can be poor to fairly good, depending on the choice of basis set and density functional.
The geometries obtained by calculations can be in many cases checked by X-ray diffraction data and the relative energies of conformations can be compared with the results of variable-temperature NMR spectroscopy. Although such a calculation usually refers to an isolated molecule, whereas X-ray studies reflect the solid state and NMR results are for solutions, DFT structures compare very well with experimental observations in almost all cases, and the relative energies of possible conformations are correctly calculated.
1.3.2.2 TRANSITION STATES
The determination of transition state structures and energies is a crucial point for dynamic analysis, because correct simulation of energy barriers could greatly help the understanding of dynamic processes detected by dynamic NMR spectroscopy. As addressed by D. Young,41 a transition state (or saddle point) structure is mathematically defined as “the geometry that has zero derivative of energy with respect to moving every
one of the nuclei, and has positive second derivative energy for all but one geometric movement”. In other words, a transition state linking two energy minima represents a
maximum of energy in the direction of the reaction path, but it is a minimum in all the other directions.
Once a stationary point is found, the primary way to verify whether it corresponds to a transition state is to compute the vibrational frequencies. A transition state must have only one negative (i.e., imaginary) frequency, and the vibrational motion associated with this frequency corresponds to the motion going towards reagents in one direction, and towards the products in the other.
Unfortunately, in contrast with the transition states for high-energy processes (such as those involved in a chemical reaction), in which the imaginary frequency usually has a large value, transition states involved in internal dynamic processes usually display small negative vibrational frequencies and can therefore be difficult to locate, especially in the presence of other possible internal motions. On the other hand, the geometry of a transition state is much simpler to idealise, because many geometrical parameters are fixed by the molecular scaffold. The total energy computed by a geometry optimisation corresponds to the minimum on the potential energy curve.
1.3.3 ELECTRONIC CIRCULAR DICHROISM (ECD)
The knowledge of absolute configuration is mandatory in many industrial applications. For pharmaceutical applications, it is required by law that the absolute configuration of chiral drugs is known and that the biological activity of the compounds is tested for both enantiomers. Production of new drugs also requires a verification of the enantiomeric purity of the compounds. This leads to the need for characterizing their chiral purity and absolute conformation. One method widely used to detect and analyse chirality is the determination of the optical activity by circular dichroism (CD).42 In biology, for
example, electronic circular dichroism (ECD) spectra are frequently used to characterize the secondary structure of proteins. 43
The CD of oriented molecules, that is the CD of anisotropic samples (ACD) without superstructural chirality, can provide new information to check and improve sector and helicity rules for the determination of the absolute configuration, and give further information about structural elements, especially those far from a chromophore.
Whenever a circularly polarized radiation flows through a medium with chiral properties, acquires elliptical polarization, whose plane undergoes a rotation. The elliptical polarization occurs because the dextrorotatory (ER) and levorotatory (EL) components of
the electric field vector, constituting the electromagnetic wave, are differently absorbed by an optically active substance: therefore it is necessary to introduce two absorptivity, εR and εL, one for each of the two vector components.
The second effect (optical rotation, OR) is due to the different refractive indices, nR and
nL, generated from the interaction between the component ER and EL respectively, and
the chiral substance. The result is that the vector components don’t propagate with the same speed but one is more accelerated with respect to the other.
CD is the difference between the absorption of left and right circularly polarized lights
∆
Such different absorption is strictly allied to chirality because it is a manifestation of diastereomer discrimination, the two mirror image objects being the two light beams. CD may be regarded as one of the most powerful techniques for stereochemical analyses: it is sensitive to the absolute configuration as well as to conformational features, which are often completely obscured in the ordinary absorption spectrum.44
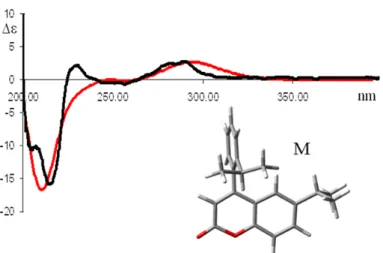
The CD of pure enantiomers differs in sign, but not in magnitude. There is no simple relation between the absolute configuration of an enantiomer and the sign of its ECD spectrum: CD depends on details of the electronic and geometric molecular structure.45 The experimental CD of the molecule under investigation is commonly displayed together with either another experimental spectrum, or with the result of a more or less sophisticated calculated theoretical curve; in both cases it is very important to correctly choose the reference data. An example of experimental and calculated comparison is reported in Figure 12.
Figure 12 Calculated (red line) and experimental (black line) ECD spectrum of the M configuration of
6-isopropyl-4-(2-isopropylphenyl)-2H-chromen-2-one46
The spectra of two enantiomers of a chiral molecule are conditioned by the chromophores in their environment. Every conformational difference, every major alteration in the nature of the chromophore or of the perturbing groups between the test and reference makes the comparison and determination of absolute configuration unreliable. The appearance of the CD spectrum, namely position, intensity and sign of the bands, reflects the environment of each chromophore.
ECD and optical rotation depend sensitively on the presence and nature of solvent interaction.47 The change in chiroptical response due to solute–solvent interactions is sometimes drastic and non-intuitive. A well-known example is the sign inversion in the optical rotation of methyloxirane upon changing the solvent from water to benzene.48 Classical force-field MD simulations constitute a possible route to explicitly account for interactions between molecule and solvent.49 Apart from the high computational cost it might appear most desirable to treat the solute embedded in a large number of solvent
molecules within a first-principles quantum mechanical MD approach. This might only be possible with very efficient electronic structure methods such as DFT which, on the other hand, have deficiencies for non-covalent long-range interactions.50 Time-dependent density functional theory (TD-DFT) is presently the most widely used electronic structure method for ECD calculations. It extends the basic ideas of ground-state density-functional theory (DFT) to the treatment of excitations or more general time-dependent phenomena.
It turns out that, even with the simplest approximation to the Kohn-Sham potential, spectra calculated within this framework are in very good agreement with experimental results.51
1.3.4 X- RAY DIFFRACTION
52X-rays were discovered in 1895 by Röntgen and were so named because their nature was unknown at the time. In 1912, during the study of Laue experiment, the 22 years old W. L. Bragg realised that X-rays could be used to detect the arrangement of individual atoms inside solid crystals. This discovery simultaneously proved the wave nature of X-ray and provided a new method for investigating the fine structure of matter, X-ray crystallography. For his insight, W. L. Bragg became the youngest ever Nobel laureate in 1915. In 1953, more than forty years after his discovery, he saw X-ray crystallography used to reveal the double-helical structure of DNA (by J. D. Watson and F. Crick through the study of R. Franklin X-rays data).
X-rays are radiations lying approximately in the range of 0.5-2.5 Å. Since their wavelength are comparable to the diameter of the atoms, X-rays directly interact with the electrons of the atoms, revealing details of internal structure of the order of 10-10 m in size. This feature could be used to confirm the relative orientations of the molecules in a stable crystal structure.
A crystal structure is characterized by its unit cell, a small imaginary box containing some atoms in a specific spatial arrangement. The unit cells are stacked in three-dimensional space to form the crystal. There are seven crystal systems into which all crystals can be classified (cubic, tetragonal, orthorhombic, rhombohedral, hexagonal, monoclinic, triclinic) and these systems can generate up to 230 possible crystal symmetries, called “crystallographic space groups”.
When two or more unlike atoms unite to form a chemical compound the kind of structure formed is dependent in part on the relative size of atoms involved, which is given by the distance of closest approach of atom centres in a crystal elements; this distance can be calculated from the lattice parameters. The size of an atom in a crystal depends slightly on its coordination number, on its binding (ionic, covalent, metallic or Van der Waals) and on its state of ionization. The shape of crystals depends on, and is a consequence, of the interior arrangement of atoms.
When an X-ray beam hits a crystal, according to Bragg’s law, diffraction occurs and a pattern of radiations is generated. This pattern could be collected and analysed to determine the crystal system structure: indeed it determines the diffraction pattern of the substance. More specifically the shape and size of the unit cell determines the angular
position of the diffraction lines, and the arrangement of the atoms within the unit cell determines the relative intensities of the lines.
In a diffractometer a single-crystal specimen is supported on a goniometer allowing independent sample rotations about three orthogonal axes through the centre of the volume irradiated by the X-ray beam. The intensity of a diffracted beam is measured directly by an electronic X-ray detector. There are many types of X-ray detectors, but they all convert incoming X-rays into surges or pulse per unit of time, and this number is directly proportional to the intensity of the X-ray beam incoming in the detector. Special single-crystal diffractometers are available, designed solely for the determination of complex crystal structures.
Since 1913, when W. L. Bragg solved the structure of NaCl, the structure of many thousands of crystals, organic and inorganic, have been determined. Hexamehylenetetramine was the first organic compound solved by X-ray diffraction.53
The work of structure determination goes on continuously since there is no dearth of unsolved structures. New substances are constantly being synthesised and the structures of many old ones remain unknown.
Limited resources inevitably constrain the number of diffractometers available in one laboratory, and such modern instruments greatly improve the quality of data which is practical to obtain. The quality of this instrument is reflected in the much higher cost, a cost due not only to the precision machining necessary in its mechanical parts but also to the circuits needed to measure the intensity of diffracted beams and to the data acquisition and analysis software.
2. RESEARCH OBJECTIVES
The final aim of this experimental thesis is to obtain stable atropisomers and to separate the enantiomeric forms, which could be used in stereoselective-synthesis. To achieve this goal a system in which the rotation about a bond is slowed due to the presence of hindered aryl ring has been studied.
The chosen system has some particular features: 1. it has an axial chirality;
2. the presence of a peculiar moiety which can be used as a probe during the conformational analyses (it allows to detect the molecular asymmetry);
3. the system could have interesting uses (like in asymmetric synthesis or in biology) .
For this purpose 3,4-dibromo-benzylmaleimides (1, as in Figure 18) has been chosen as the core of the system and the CH2 of the benzylic group was used as a diastereotopicity
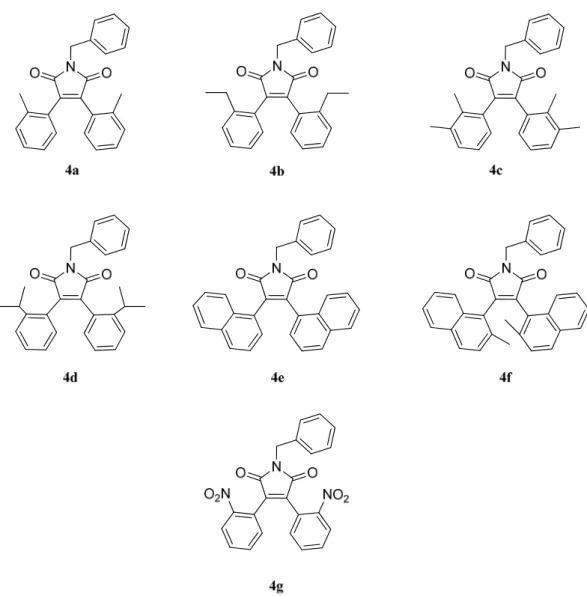
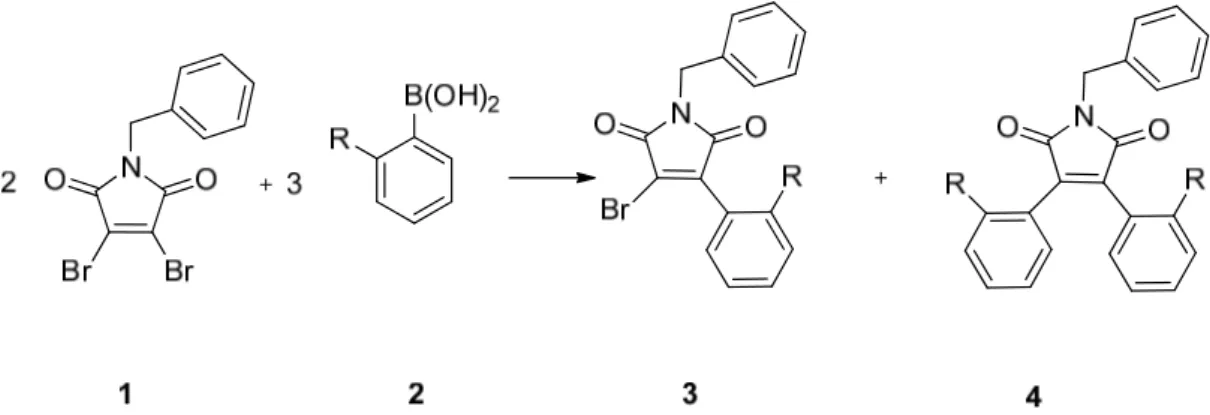
probe to detect the molecular symmetry. Suzuki reaction between 3,4-dibromo-benzylmaleimide and an appropriate boronic acid has been performed to obtain a number of different products (3a-g and 4a-g, as in Figure 18). The steric hindrance was modified by increasing the bulkiness of the aryl groups, from 2-methylphenyl- (entry a) to 2-methyl-naphthyl (entry f). Boronic acid functionalized with heteroatom group, such as nitro (entry g), was also used to prepare a final compound containing polar groups.
The rotational energy barrier of the aryl rings, ∆G#,was investigated using Dynamic Nuclear Magnetic Resonance Spectroscopy (DNMR) and kinetic experiments. X-Ray Diffraction and Electronic Circular Dichroism Spectroscopy (ECD) have been used respectively to establish the preferred conformation and to assign the absolute configuration when stable atropisomers are obtained. The experimental analyses were supported by DFT calculations.
3. RESULTS AND DISCUSSION
The conformational properties of atropisomeric molecules have attracted interest in recent years due to their many applications, such as in stereo-controlled reactions and in crystal packing.54 These molecular scaffolds usually present a planar framework bonded
to one or more substituents in particular sites of the molecule. These substituents, which are often variously decorated aromatic groups, adopt tilted conformations that generate conformational chirality. Depending on the hindrance of the substituents and on the planar framework, the resulting conformational enantiomers can be either stereolabile or configurationally stable (atropisomers). The corresponding barriers of interconversion can be usually determined by means of variable-temperature NMR spectroscopy, or NMR kinetic methods (EXSY and standard kinetic measurements).
Based on previous experiences,55 in the present work the ability of the maleimide scaffold to generate stable atropisomers when two ortho-substituted aryl rings are bonded to the 3,4-position (Figure 13), are exploited.
Figure 13 General structure of bis-arylmaleimide
Maleimide is a planar molecule and when two aryl substituents are bonded in the 3,4-positions various stable conformations could be generated by the hindered rotation of the two aryl groups. Preliminary computational studies support the existence of different syn and anti conformers due to the perpendicular disposition of the two aryl rings.
In Figure 14 the stable conformations are reported. When the R substituents of the aryl rings are both on the same side of the maleimide scaffold the conformation has CS
symmetry and a meso form (syn configuration in Figure 14) is generated.
On the contrary, if the R substituents of aryl-groups are arranged on the opposite sides of the scaffold plane (anti configuration), the C2 symmetry of the conformation implies a
Figure 14 Possible conformations of stable compounds
The ability to observe these conformations depends on the hindrance caused by the R substituent on the aryl groups, which generates an energy barrier of interconversion (∆G#) going from one ground state to another.
If the interconversion barrier is frozen, two conformational diastereoisomers could be observed by NMR. However, the assignment of the two observed isomers to the meso and racemic form cannot be extracted by a simple NMR spectrum. To ascertain the symmetry of the two diastereoisomers has been envisaged that the introduction of a chirality probe was necessary. To avoid any steric interference with the two aryl groups, a benzyl group was bonded to the nitrogen of maleimide. This group was chosen for the presence of an uncoupled CH2 group that acts as the chirality probe, thus displaying
different multiplicity depending on the molecular symmetry.
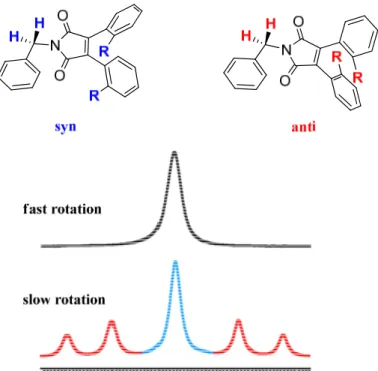
In Figure 15 a representation of the effect of the molecular symmetry on the CH2 1H-NMR signal is reported. When the rotation of the two aryl groups is fast, only a single
averaged signal is visible (spectrum on the top in Figure 15). When the rotation of the two aryl groups is slow in the NMR timescale (spectrum on the bottom in Figure 15) the signal of the syn conformation (meso) remains a singlet (blue section of the spectra in the bottom of Figure 15), while the racemic form (anti) displays a double doublet (AB system), due to the different magnetic environment of the two diastereotopic hydrogen atoms (red sections of the bottom spectrum in Figure 15).
Figure 15 Representation of the NMR spectrum of the syn and anti conformations at fast and slow
rotation. Blue section corresponds to syn and red sections to anti
Therefore, in order to determine the steric requirements necessary to obtain stable atropisomers of bis-arylmaleimides, the trend in the design of the synthetic target of this work has been the increase of the steric hindrance of the R substituents of the aryl-groups.
In Figure 16 the target compounds, each correlated of its acronym, are reported.
Figure 16 Synthesised compounds, each with its abbreviation.
To theoretically analyze the stereodynamic pathways, DFT optimization were done using Gaussian 09 and the B3LYP/6-31G(d) level. Both ground and transition states were obtained (see Introduction Section for more theoretical details).
A simulation approach is useful to confirm the relative energies of the ground states and to predict if the transition states have sufficiently high energy to allow an experimental observation. In addition, the determination of relative energies among the available transition states gives conformational information about the most favourable stereodynamic pathway. The lower value of transition state energy, in fact, represents the effective mechanism of interconversion between two ground states. It is important to stress that only the ground states, and not the transition states, can be experimentally observed, so the effective transition state is deduced only via the theoretical simulation.
Two ground conformations (GS1 syn and GS2 anti which are the same of Figure 14) and two transition states (TS1 and TS2, represented in Figure 17) have been taken into consideration.
Figure 17 Schematic representation of transition states (TS1 and TS2)
TS1 represents the transition of one aryl-substituent on the side of carbonyl group (externally to the plane), while TS2 the internal passage of that one on the side of the other aryl (internally to the plane).
The synthesis of the target compounds occured with Suzuki coupling by N-benzyl-3,4-dibromomaleimide (1) and a suitable boronic acid (2), but the synthesis was thwarted by the presence of the imidic system that was reactive in the standard Suzuki coupling conditions.56 Contrary to the traditional Suzuki reaction, which proceeds in the presence of aqueous bases, in this case anhydrous conditions are required, so freshly distilled dry solvent (tetrahydrofuran, THF) has been used and inert atmosphere (N2 flow) was
applied.
The reactions have been achieved in presence of a Pd-based catalyst. Two types of catalysts were used in this experimental work: Pd(PPh3)4 and Pd(OAc)2. After some tests
anhydrous Cs2CO3 was found to be the most effective base to activate the catalyst.
The overall reaction is illustrated in Figure 18. When using two equivalents of dibromo-maleimide 1 and three equivalents of boronic acid 2 a mixture of the mono-substituted bromomaleimide 3 and the target compound 4 was obtained.
Figure 18 Schematic Suzuki reaction between halide 1 and boronic acid 2 to obtain compounds 3 and
target molecules 4
The products were obtained following two general synthetic procedures (summarizes in
Table 1):
Method A: 1-benzyl-3,4-dibromo-1H-pyrrole-2,5-dione 1 was dissolved in dry THF, then appropriate boronic acid, cesium carbonate and Pd(OAc)2 were added.
The stirred solution was kept at reflux for 2 hours. Workup of the reaction mixture yielded the target compounds 4a, 4c, 4e and 4f.
Method B: 1-benzyl-3,4-dibromo-1H-pyrrole-2,5-dione 1 was dissolved in dry THF, then appropriate boronic acid, cesium carbonate and Pd(OAc)2 were added.
The stirred solution was kept overnight at +40 °C. Workup of the reaction mixture yielded the target compounds 4b, 4d and 4g.
In all the cases, in order to purify the products, Et2O and H2O were added and the
extracted organic layer was dried (Na2SO4), filtered and then evaporated. The crude
products were purified by semi-preparative HPLC on a C18 column, in order to obtain analytically pure compounds for the following NMR analyses.
Table 1 : Description of bis- arylbenzylmaleimide (4) procedure syntheses.
Entry Procedure synthesis
4a A: Pd(PPh3)4 instead of Pd(OAc)2 4b B 4c A 4d B: Pd(PPh3)4 instead of Pd(OAc)2 4e A 4f A 4g B
In Figure 19 Suzuki coupling mechanism of a mono-arylsubstituted maleimide is reported. The four passages are specified and the bis-arylsubstituted maleimide product is highlighted in red. Starting from Pd(0) oxidative addition is improved by mono-arylmaleimide, then metathetic exchange of bromide is provided by the nucleophilic base. The reaction between the base and the boronic acid generates an intermediate “ate complex”, which favours the transmetalation step. Spontaneous reductive elimination finally gives the target product and regenerates the catalyst.57
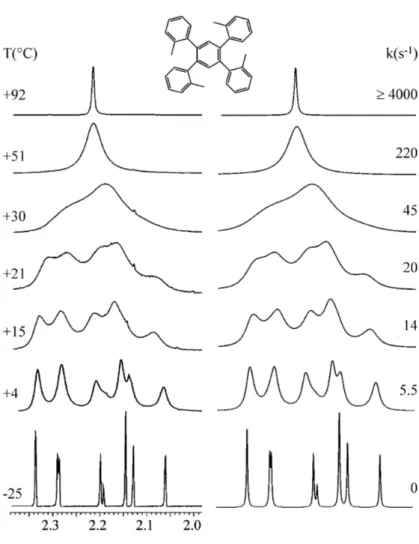
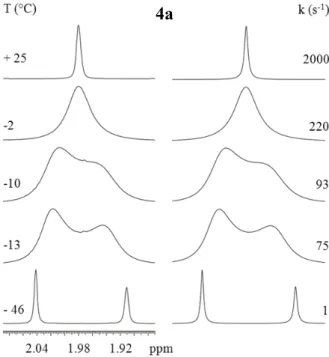
In compound 4a, which bears two o-tolyl aryl rings, the 1H single signal of the methyl group broadens on cooling and eventually splits into a pair of lines below -10 °C, eventually showing two sharp lines at -46 °C in a syn:anti 55:45 ratio. These signals correspond to the two conformational diastereoisomers, albeit the methyl signal cannot determine which signal corresponds to which diastereoisomer.
Figure 20 Left: temperature dependence of the 1H methyl signal of 4a (600 MHz in CD
2Cl2). Right: line
shape simulation obtained with the rate constants reported.
The line shape simulation yielded the rate constants reported in Figure 20 (in the right) and from these values a free energy of activation of 12.9 kcal/mol was derived by Eyring equation (Table 3). The free energies determined are almost invariant with the temperature, thus implying that the activation entropy is very small or negligible. This situation is usual in conformational processes where only an internal rearrangement takes place.58 DFT calculations predicted that the lower energy transition state is TS1 with an energy of 11.55 kcal/mol and this value match satisfactorily the experiment, the difference being only 1.4 kcal/mol.
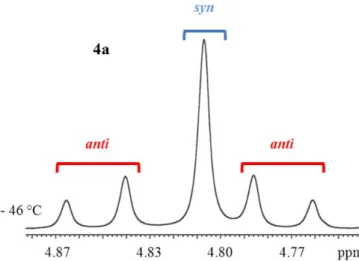
To assign the symmetry of the two diastereoisomers, the signal of the benzylic CH2 was
checked at - 46 °C. Figure 21 shows that the major isomer correspond to the single signal thus the major isomer has CS symmetry (syn form).
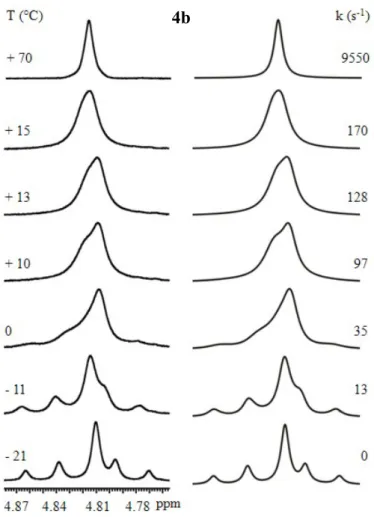
The 1H signal of the benzylic CH2 of compound 4b shows a single broad signal at room
temperature and around +13 °C the signal reached the coalescence temperature. At -21 °C the interconversion is frozen and the syn (54%, central single signal) and anti (46%, AB system) conformations are clearly visible. To simulate the whole spectrum, the simulation must take into account the J constant in the doublets and the exchange of both doublets with the singlet. Although the simulation is more difficult to be performed, a correct simulation of a complicated spectrum allows one to have better accuracy on the value of the rate constants. The experimental energy barrier is 13.9 kcal/mol and the corresponding line shape simulation is reported in Figure 22.
Figure 22 Left: temperature dependence of the 1H benzylic CH
2 signal of 4b (600 MHz in C2D2Cl4). Right:
line shape simulation obtained with the rate constants reported.
DFT computation predict that in the ground state the aryl group are in anti conformation, then the more stable transition state is the TS1 with an energy of 12.85 kcal/mol (see
Table 3). Also in this case computational and experimental results are very similar.
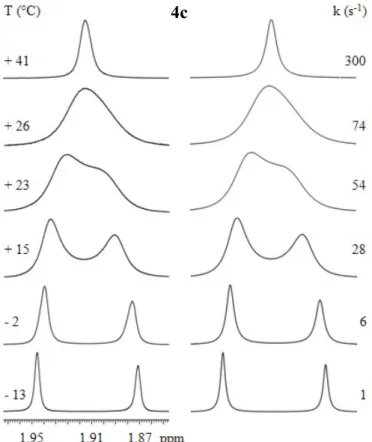
In the case of compound 4c the 1H signal of o-methyl aryl group have been used for the conformational study. This proton signal assignment has been performed by 2D-NMR spectroscopy, particularly with HSQC and HMBC experiments. As it can be seen in
Figure 23, at about +23 °C the coalescence is detectable and from line shape simulation
an energy barrier of 14.9 kcal/mol has been found. This interconversion barrier results to be quite higher than that of compound 4a, in which the aryl ring bears only o-methyl group. The difference of 2.4 kcal/mol can be attributed at the buttressing effect of m-methyl on the o-m-methyl group in the transition state.59
In other words, the o-methyl bending is not allowed in the transition state because of the
m-methyl steric hindrance. This effect is clearly detectable in the TS1, which describes
the crossing of the o-methyl on the carbonyl side. At -13 °C the syn/anti ratio is 55/45.
Figure 23 Left: temperature dependence of the 1H o-methyl signal of 4c (600 MHz in CDCl
3). Right: line
shape simulation obtained with the rate constants reported. 4c
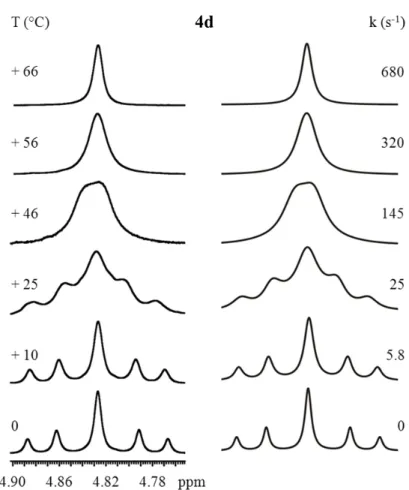
Compound 4d carries an iso-propyl group in the o-position of the aryl ring. The room temperature spectrum (reported in the left section of Figure 24) shows that the interconversion is slow and the coalescence is reached at +46 °C, whereas at 0 °C the two conformers can be identified. Syn/anti ratio was found to be 49/51, thus the anti form is the major conformer, maybe due to the hindrance of iso-propyl group which destabilizes the syn ground state. The energy barrier obtained by line shape simulation (section in the right of Figure 24) is 15.5 kcal/mol. This value is very similar to the energy barrier of compound 4c.
Figure 24 Left: temperature dependence of the 1H benzylic CH
2 signal of 4d (600 MHz in C2D2Cl4).
Right: line shape simulation obtained with the rate constants reported. 4d
Interesting results have been obtained with compound 4e. The presence of a naphthyl group could mislead one to think that its energy barrier should be higher than that of the other compounds. Instead, the 1H benzylic CH2 signal actually reaches the coalescence
approximately at +10 °C, and the line shape simulation provides an energy barrier of 14.0 kcal/mol, a value lower than that of compound 4d (experimental DNMR and line shape simulation are reported in Figure 25). This energy barrier value is comparable with the 4b experimental energy barrier, in which o-ethylphenyl groups are supported as substituents. DFT optimization validates this experimental result; in fact in the lower transition state of 4e (TS1), that has the planar naphthyl substituent in co-planar arrangement with the maleimide, the calculated energy barrier is 12.88 kcal/mol, quite similar to the computed energy for compound 4b and lower than that calculated for 4b. At -24 °C the two conformers are in 45/55 syn/anti ratio.
Figure 25 Left: temperature dependence of the 1H benzylic CH
2 signal of 4e (600 MHz in C2D2Cl4). Right:
line shape simulation obtained with the rate constants reported. 4e
DFT calculations suggest for 4f a free energy of interconversion of 23.52 kcal/mol; this value implies the presence of atropisomeric stable forms. In Figure 26 the computed ground and transition states, with the free energies (in kcal/mol) are illustrated.
Figure 26 DFT computed ground and transition states of compound 4f. The free energies are in kcal/mol.
The computed indications have been validated by experimental results. Firstly 1H-NMR spectrum of the crude product at room temperature showed all two sets signals, supporting the existence of diastereoisomeric forms, at least in the NMR timescale. When subjected to HPLC analysis, the presence of the two diastereoisomers was confirmed, but the separation on a C18 HPLC column (Luna C18) was not successful, due to the similar retention times of the diastereoisomers. After some tests, a cellulose-based enantioselective HPLC column has been chosen. The chromatogram is reported in
Figure 27a. Red and green sections represent the anti enantiomers while blue section
identifies the syn (meso) form. A semi-preparative column (10 mm diameter) has been used and the eluted solutions were collected in a cold environment (under -10 °C) to freeze the syn-anti interconversion. After the separation, the benzylic CH2 1H-NMR
spectra (in CDCl3 at -10 °C) of the two diastereoisomers appear different, as reported in Figure 27b. The meso form (syn) shows a single signal, while the two enantiomers (anti)
are characterized by an AB system. 1H-NMR technique can neither distinguish the two enantiomers, nor determine their absolute configuration. In order to determinate absolute configuration, ECD spectra have been performed. In Figure 27c the experimental spectra
Figure 27 Experimental analyses of compound 4f a) Chromatogram, with retention times, in
cellulose-based enantioselective HPLC column. A mixture of hexane: iso-propanol 90:10 was used as eluent. b) 1
H-NMR spectra of benzylic CH2, syn and anti forms (600 MHz in CDCl3, -10 °C). c) Experimental ECD
spectrum of EN1 (red line) and EN2 (green line). Acetonitrile has been used as solvent.
The “reference” method to assign the absolute configuration relies on the X-ray anomalous scattering (the “Bijovet method”).60 However, this approach requires the preparation of enantiopure single crystals, and the presence of an heavy atom in the molecule (usually Z>Si). In this case the molecule does not contain any heavy atom, and the assignment by X-ray crystallography is unfeasible.
Recently, the determination of the absolute configurations of chiral molecules use chirooptical techniques like optical rotation (OR), electronic circular dichroism (ECD), and vibrational circular dichroism (VCD) gained feasibility and reliability because of the development of methods for the prediction of these properties based on the time-dependent density functional theory approach (TD-DFT).32,44 In the present case the theoretical calculation of ECD spectra was selected for the absolute configuration
In order to correctly simulate the experimental spectrum, all the possible conformations of the anti diastereoisomer should be considered, being the experimental spectrum the weighted sum of the populated conformations.
The conformational search performed on the P,P atropisomer suggested that two conformations are available for the two naphthyl rings (see Figure 28). In one of these methyl groups point toward the five-membered ring (“internal”) and in the other one they are directed toward the two carbonyl oxygens (“external”).
The theoretical ECD spectrum of both conformations was obtained with the TD-DFT method at CAM-B3LYP /6-311+G(d,p) level. As shown in Figure 30 (see below) the simulations show that the two conformations have opposite spectrum.
For this reason the correct ratio of the two conformations present in the experimental product is required to obtain a correct ECD spectrum simulation. NOE spectrum (in CD3CN) of EN2 (reported in Figure 29) was used to experimentally determine this ratio.
In both conformations, the methyl group of each naphthyl ring is spatially close to the hydrogen in position 3 of the same ring, and to the H8 of the other naphthyl ring. The
distances from the 2-methyl to H3 and H8 are different, depending on the conformation
considered. In the “internal” conformation this ratio is calculated as 0.89, while in the “external” conformation this ratio is 1.03 (Figure 28).
Figure 28 Computed representation of the two anti conformations of
bis-(2-methylnaphthyl)-benzylmaleimide a) Internally disposition of the methyls b) Externally disposition of the methyls. In the figures the Me-H3 and Me-H8 distances (in Å) are reported.
The experimental ratio (reported in Figure 29) is in between the two limiting values (0.935), thus both the conformations are populated in solution in a EN2 ratio of 2:1 ± 0.5
Figure 29 1H-NMR NOE spectrum of 4f anti conformation (600 MHz in CD
3CN, +25 °C).
This result is also in agreement with the computed free energies of the two conformations (0.00 kcal/mol and 0.21 kcal/mol, respectively). The simulated ECD spectra has been calculated taking in account this ratio, (purple line in Figure 30b) and the match with the experimental ECD spectra of EN2 is quite good.
Figure 30 a) Simulated spectra of external (blue line) and internal (red line) methyl P,P conformations.
b) 12 nm shifted finally computed spectrum considering a ratio of 1:2 in external conformation (purple
It is therefore concluded that EN1 (the first eluted, see Figure 27a) corresponds to the M,M atropisomers and the EN2 to the P,P atropisomer.
The kinetic of the interconversion process from syn to anti form has then been studied, considering a first order kinetic process. The experiment has been performed via 1 H-NMR 600 MHz. A sample of the syn diastereoisomer in CDCl3 was kept at +46 °C and a
set of 1H-NMR spectra were recorded at fixed intervals (180s), until the equilibrium composition was reached. At the equilibrium, a syn/anti ratio of 51/49 was observed. The equilibrium ratio was confirmed by a second 1H-NMR spectrum of a solution of the syn conformer that was kept at +75 °C for 72 hours. The kinetic process has been analysed at three temperatures (+46 °C, +51 °C and +61 °C). The data obtained are thus handled in order to obtain a graphic of ln(Xe-Xi) vs time (Figure 31).
Figure 31 Kinetic study at different temperatures of compound 4f: +46 °C (a), +51 °C (b) and +61 °C (c).
From the equilibrium ratio (syn/anti) and the slope of the regression line, three k1 values
were derived and then, by Eyring equation, the free energies of the process were obtained (Table 2).
Table 2 Free energy of interconversion ∆G# obtained at each temperatures during the kinetic study.
Temperature (°C) ∆G# (kcal/mol)
+46 24.47 +51 24.53 +61 24.46
Taking into account the errors in the determination of the sample temperature (±1 °C), the free energies can be considered invariant with the temperature, thus implying a negligible activation entropy. Through arithmetic average, a ∆G# of 24.5 kcal/mol has been found. This result agrees with the computed value (TS1), the difference being only 1.0 kcal/mol.
From DFT optimization of compound 4g a difference of 4.2 kcal/mol between the ground state 1 (syn) and the lower ground state 2 (anti) has been found (Figure 32).
Figure 32 DFT computed structures and free energies (in kcal/mol) of ground and transition states of compound 4g.
This result suggests the presence of only one thermodynamic stable diastereoisomer. This theorethical prediction was confirmed by Variable Temperature-NMR analysis, which shows only the presence of the AB system (Figure 33), and no trace of the signal corresponding to the syn conformation. In order to check a solvent effect, analyses with other solvents (CD2Cl2 and CD3OD) were done, and the same result has been achieved.
Figure 33 Left: temperature dependence of the 1H benzylic CH
2 signal of 4g (600 MHz in CDCl3). Right:
line shape simulation obtained with the rate constants reported.
Single crystals of the target have been obtained by evaporation of CHCl3 solution, thus
X-ray diffraction analysis has been performed (Figure 34). Crystals contain only the
anti-conformation.
Figure 34 Comparison between X-ray diffraction structure (a) and computed GS2 structure (b) of
compound 4g.
This particular feature could be explained by invoking an electrostatic interaction between the electron rich oxygen and the electron-poor nitrogen, that can stabilize the
In Table 3 the computed results are compared with experimental energies and syn/anti ratio is reported. DFT calculations are performed at B3LYP/6-31G(d) level and the energy values reported taking as reference the lowest ground state.
As can be seen the general trend shows an increasing of TS1 and TS2 values with the bulkiness of the aryl-substituents, and TS1 is always the lower energy transition state, so it represents the effective transition state of the syn/anti interconversion molecule. GS2 (anti conformation) is the lowest energy state for every compounds, except for compound 4f, where GS2 (syn conformation) represents the lower ground state.
Table 3 DFT computed energies of bis-arylbenzylmaleimides compounds. In the last two columns
experimental energy barriers (∆G# in kcal/mol) and experimental syn/anti ratio are reported.
Entry GS1 (syn) GS2 (anti) TS1 (ext) TS2 (int) ∆G# syn/anti
4a 0.28 0.00 11.55 12.43 12.9 55/45 4b 0.47 0.00 12.86 13.44 13.9 54/46 4c 0.16 0.00 13.93 14.56 14.9 55/45 4d 1.33 0.00 14.43 15.93 15.5 49/51 4e 0.00 0.00 12.88 12.98 14.0 45/55 4f 0.00 0.21 23.52 25.12 24.5 51/49 4g 4.19 0.00 15.83 14.27 14.2 < 1/99
Mono-substitutes compounds (3a-3g) have been also analysed during the experimental
work.
In this case the benzylic group is necessary to detect the enantiomerization process and then to derive, by line shape simulation, the free energy of activation. Benzylic CH2
generates an AB system in which the two protons have different spatial environment and provide a double doublet at low temperatures.
An example of Variable Temperature NMR analysis is reported in Figure 35 for compound 3d.
Figure 35 Left: temperature dependence of the 1H methyl signal of iso-propyl group of 3d (600 MHz in
C2D2Cl4). Right: line shape simulation obtained with the rate constants reported.
In the Experimental Section the analyses for the other mono-substituted compounds are reported.
In the DFT optimization of every compound 3 only one ground state conformation could be described and its energy has been considered equal to 0.00 kcal/mol, and two transition states are possible (Figure 36). One transition state describes the passage of the R-substituent in the side of carbonyl group (TS1 in Table 4) while in the other one the R-substituent of the aryl group is close to the bromine (TS2 in Table 4).
Figure 36 Ground state and transition states of stable mono-substituted compounds.
In Figure 37 ground and transition states computed structure of compound 3d are reported.
Figure 37 DFT computed ground and transition states of compound 3d. The free energies are in kcal/mol.
Table 4 shows that TS1 is the preferred interconversion passage (like for bis-aryl
substituted maleimides) and that the experimental free energies of activation match quite
R R TS1 (ext) GS R TS2 (int)
Table 4 DFT computed barrier energies of all mono-arylbenzylmaleimide compounds. In the fourth column experimental energy barriers (∆G# in kcal/mol) are reported. In the last column difference in mono- and
bis- arylbenzylmaleimide barrier energies (∆∆G# in kcal/mol) are showed.
Entry TS1 (ext) TS2 (int) ∆G# ∆∆G#
3a 11.23 12.65 14.3 1.4 3b 13.63 14.55 15.3 1.4 3c 14.21 15.24 16.6 1.7 3d 15.01 15.58 17.3 1.8 3e 13.16 14.83 15.7 1.7 3f 25.88 28.19 28.6 4.1 3g 13.60 13.63 13.1 -1.1
In the case of compound 3f, the atropisomers separation was obtained by AD-H enantioselective HPLC column, with hexane:iso-propanol 90:10 as eluent (Figure 38a). Using the same approach of compound 4f the absolute conformations of the enantiomers have been obtained by ECD spectra (Figure 38b). Through comparison with TD-DFT spectrum, EN1 has been matched with M conformer.
A solution of compound 3f in a mixture of hexane:iso-propanol 90:10 has been used to perform the kinetic study at +70 °C via HPLC analyses at regular times. By means of the Eyring equation a free energy of activation of 28.6 kcal/mol has then been achieved. This value is sufficiently high to allow the use of this compound in asymmetric synthesis. A comparison between bis-substituted and mono-substituted compounds clearly shows the increasing in the energy barriers of the interconversion processes when a bromine is linked at the maleimide instead of an aryl group (∆∆G# in Table 4). This results is easily explainable and is related to the higher steric hindrance caused by the spherical bromine in the transition state (as shown in Figure 39) while it is negligible in the ground state.61
Figure 39 Comparison between mono- (a) and bis- (b) arylbenzylmaleimides ‘external’ transition state
(TS1).
It is worth noting that the difference in experimental free energies of activation (∆∆G# in
Table 4) between mono- and bis-substituted compounds remains similar for each entry,
except for compounds 3f and 4f, where it is about 4 kcal/mol.
Furthermore compound 3g has a lower energy barrier of interconversion than compound 4g. This experimental evidence can be related to the influence of electrostatic forces. Further studies to understand the real mechanism are still in progress.