Autore:
Martina Adorni ______________________
METHODOLOGY FOR THE ANALYSIS
OF FUEL BEHAVIOR DURING
LOCA AND RIA
Anno 2011
Scuola di Dottorato in Ingegneria “Leonardo da Vinci”
Corso di Dottorato di Ricerca in
INGEGNERIA NUCLEARE
Tesi di Dottorato di Ricerca
Relatori:
Prof. Francesco D’Auria ____________________ Prof. Francesco Oriolo ____________________ Dr. Carlo Vitanza ____________________ Dr. Alessandro Del Nevo ____________________
Alla mia famiglia, animali compresi, e ad Alessio
AKNOWLEDGMENTS
At first, I express my gratitude to Prof. Francesco D’Auria (UNIPI-GRNSPG), for the invaluable possibility he gave me to learn.
Special thanks are for Dr. Carlo Vitanza (HRP) for his invaluable contribution in the advancement in experiments and modeling in the field of nuclear fuel and his expert supervision.
I express also special thanks to my supervisors Prof. Francesco Oriolo (UNIP) and Alessandro Del Nevo (ENEA) for the support in carrying out this work.
I wish to express thanks to Enrico Sartori (OECD), for his effort in creating, maintaining and making available the OECD/NEA/NSC International Fuel Performance Experiments database and to John Kjillen (IAEA) for the FUMEX-III Coordinate Research Project containing a challenging selection of experiments to test the codes.
I wish to express gratitude also to Wolfgang Wiesenak (HRP), for the much valuable information for the design of the fuel experiment.
I gratefully acknowledge the support of the fuel modeling team at ITU and the possibility they gave to the me to be part of the TRANSURANUS User Group: Paul Van Uffeln, Arndt Shcubert, Juacques Van Der Laar and Csaba Gyory (ITU) and to Prof. Lelio Luzzi (POLIMI), for the initial help in entering in the fuel field.
I‟d like to acknowledge as well Oscar Mazzantini (NA-SA), for the invaluable possibility of learning from a real nuclear power plant under construction, and for the fantastic period that I spent in Argentina working at the power plant.
Patricia Pla Freixa (EC) and Anis Bousbia-Salah (BelV) should be acknowledged as well, for the always helpful discussions and much valuable availability and updating.
I‟d like to thank also all the person that at various title contributed to my scientific and professional advancement, among with, but not limited at (alphabetic order): Dino Araneo (UNIPI-GRNSPG), Claudio Carbone (ENEL), Juan Calos Ferreri (ARN), Giorgio Galassi (Reg. Toscana), Massimo Sepielli (ENEA).
SOMMARIO
Gli incidenti di perdita di refrigerante (LOCA) riguardano la perdita di liquido di raffreddamento del reattore ad un tasso superiore alla capacità del sistema di reintegro, dovuti ad una rottura nel confine in pressione del liquido stesso, fino ad includere una rottura equivalente per dimensioni alla rottura della più grande tubazione del sistema di refrigerazione del reattore con area equivalente pari a due volte quella della tubazione.
Una particolarità del progetto dell‟impianto Atucha-II è il coefficiente di reattività per i vuoti positivo. Questa è una caratteristica in comune con altri reattori moderati ad acqua pesante che utilizzano uranio naturale come combustibile. Ciò implica che a seguito di un evento di perdita di refrigerante, il picco di potenza di fissione all'inizio del transitorio è controllato dalla formazione vuoto nei canali del nocciolo, e quindi è determinato dalla propagazione delle onde di pressione dalla rottura. Infatti, il moderatore è ancora liquido ed evapora in ritardo rispetto al liquido refrigerante, così l'evento di perdita di refrigerante (LOCA) è anche un evento di inserzione di reattività (RIA).
A seconda dello specifico scenario e dello scopo delle analisi, potrebbe essere richiesta la disponibilità di metodi di calcolo che non sono implementati nei codici standard di analisi di sistema termoidraulica, come per esempio la temperatura di rottura, la deformazione alla rottura e il possibile bloccaggio della refrigerazione canale. Ciò può richiedere l'uso di un apposito codice per il calcolo del comportamento e delle performance del combustibile nucleare quale il TRANSURANUS.
Questa tesi riporta la descrizione dello sviluppo della metodologia utilizzata per l'analisi dello scenario 2A LB-LOCA per l‟impianto nucleare Atucha-2, concentrandosi sulla procedura adottata per l'utilizzo del codice di analisi del combustibile e la sua applicazione per l'analisi della sicurezza dell‟impianto stesso (Capitolo 15 FSAR). La procedura comporta l'applicazione della metodologia “best estimate” per la termoidraulica, la neutronica e le analisi del combustibile, con l'obiettivo di verificare la conformità con i criteri di accettazione specifici. Il codice utilizzato per valutare le prestazioni ed il comportamento del combustibile, viene applicato con l'obiettivo primario di valutare l'entità delle rotture della camicia del combustibile durante il transitorio.
La procedura consiste in un calcolo deterministico, tramite il codice di analisi del combustibile, effettuato per ogni singola barretta, della vita della barretta stessa e il calcolo seguente relativo all‟incidente di perdita di refrigerante. Le condizioni al bordo ed iniziali (BIC) (ad esempio la potenza lineare) sono forniti dalla fisica del nocciolo e dalla cinetica neutronica tri-dimensionale accoppiata alla termoidraulica di sistema. La procedura si completa con i calcoli sensibilità e l'applicazione del metodo probabilistico.
ABSTRACT
Loss of coolant accidents (LOCA) mean those postulated accidents that result from the loss of reactor coolant at a rate in excess of the capability of the reactor coolant makeup system from breaks in the reactor coolant pressure boundary, up to and including a break equivalent in size to the double-ended rupture of the largest pipe of the reactor coolant system (DEGB LB-LOCA).
A peculiarity of the Atucha-2 design is the positive void reactivity coefficient. This is a characteristic in common to other heavy water moderated reactors that utilize natural uranium as fuel. This implies that after a LB-LOCA event, the fission power peak at the very beginning of the transient is controlled by the void formation in the core channels, and then it is determined by the pressure wave propagation from the break. Indeed, the moderator is still liquid and flashes delayed with respect to the coolant, thus the LOCA event is also a RIA (reactivity insertion accident) event. Licensing requirements vary by country in terms of their scope, range of applicability and numerical values and in general imply the use of complex system thermal hydraulic computer.
Depending on the specific event scenario and on the purpose of the analysis, it might be required the availability of calculation methods that are not implemented in the standard system thermal hydraulic codes, as for burst temperature, burst strain and flow blockage calculations. This may imply the use of a dedicated fuel rod thermo-mechanical computer code such as TRANSURANUS, which can be coupled with thermal-hydraulic system codes to be used for the safety analysis. This thesis consists in the development and application of a methodology for the analysis of the 2A LB-LOCA scenario in Atucha-2 nuclear power plant (NPP), focusing on the procedure adopted for the use of the fuel rod thermo-mechanical code and its application for the safety analysis of Atucha-II NPP (Chapter 15 FSAR). The methodology implies the application of best estimate thermal-hydraulic, neutron physics and fuel pin performance computer codes, with the objective to verify the compliance with the specific acceptance criteria. The fuel pin performance code is applied with the main objective to evaluate the extent of cladding failures during the transient.
The procedure consists of a deterministic calculation by the fuel performance code of each individual fuel rod during its lifetime and in the subsequent LB-LOCA transient calculations. The boundary and initial conditions (BIC) (e.g. pin power axial profiles) are provided by core physics and three dimensional neutron kinetic coupled thermal-hydraulic system codes calculations. The procedure is completed by the sensitivity calculations and the application of the probabilistic method. Validation activities are performed to enhance the TRANSURANUS code capabilities and to improve the reliability of the code results. They relies on the two main sources of data, namely, specific data on Atucha-1 and/or 2, experiments or independent calculations and other data which are representative of the Atucha-2
fuel, in particular for the analysis of the normal operation and power ramp during normal operation and severe transients like LOCA and RIA.
INDEX
AKNOWLEDGMENTS ___________________________________________________ 3 SOMMARIO ____________________________________________________________ 5 ABSTRACT ____________________________________________________________ 7 ABBREVIATIONS ______________________________________________________ 11 LIST OF FIGURES _____________________________________________________ 15 LIST OF TABLES ______________________________________________________ 21 1. INTRODUCTION __________________________________________________ 231.1 OBJECTIVES OF THE RESEARCH ______________________________________ 23 1.2 DESCRIPTION OF THE PREFORMED ACTIVITY ____________________________ 24 1.3 STRUCTURE OF THE DOCUMENT______________________________________ 25 1.4 INNOVATIONS ___________________________________________________ 26
2. ATUCHA-II NPP ___________________________________________________ 29
2.1 LAYOUT ________________________________________________________ 29 2.2 PRIMARY SYSTEM ________________________________________________ 29 2.3 FUEL MANAGEMENT ______________________________________________ 44 2.4 DESCRIPTION OF THE FUEL _________________________________________ 47
3. DESCRIPTION OF LB-LOCA IN ATUCHA-II NPP _____________________ 51
3.1 DESCRIPTIONOFTHETRANSIENT _______________________________ 51 3.2 LICENSINGFRAMEWORK _______________________________________ 53 3.3 THE BEPUAPPROACH ____________________________________________ 55 3.4 FUEL SAFETY CRITERIA____________________________________________ 59
4. CODES AND MODELING ___________________________________________ 67
4.1 DESCRIPTION OF THE CODES ________________________________________ 67 4.2 DESCRIPTION OF THE NODALIZATIONS_________________________________ 75
5. INDEPENDENT VALIDATION ACTIVITY ____________________________ 87
5.1 CNA-2 SPECIFIC DATA ____________________________________________ 90 5.2 NORMAL OPERATION:ASSESSMENT OF FGR AGAINST BWR-IR AND PWR-SR
PROJECTS _____________________________________________________________ 94 5.3 SEVERE TRANSIENTS:LOCA&RIA _________________________________ 102 5.4 NON STANDARD APPLICATION OF TU CODE:FK-1,FK-2 AND FK-3 TESTS ____ 106
6. DEVELOPMENT OF A METHODOLOGY FOR ATUCHA-II NPP _______ 113
6.1 HYPOTHESIS OF THE TH ANALYSIS __________________________________ 113 6.2 PURPOSES FOR THE ANALYSIS ______________________________________ 113 6.3 ACCEPTANCE CRITERIA ___________________________________________ 114 6.4 PROCEDURE FOR SAFETY ANALYSIS__________________________________ 115 6.5 ASSUMED INITIAL AND BOUNDARY CONDITIONS _______________________ 116 6.6 DESCRIPTION OF THE PROCEDURE ___________________________________ 131
6.7 ENGINEERING HANDBOOK _________________________________________ 136
7. APPLICATION OF THE METHODOLOGY TO ATUCHA-II NPP________ 141
7.1 CALCULATED RESULTS ___________________________________________ 141 7.2 RADIOLOGICAL CONSEQUENCES:FAILURE OF FUEL RODS AND RELEASE OF FISSION PRODUCTS INTO THE PRIMARY SYSTEM COOLANT _____________________________ 146 7.3 CONCLUSIVE REMARKS ___________________________________________ 147
8. CONCLUSIONS ___________________________________________________ 149
8.1 INNOVATIONS __________________________________________________ 149 8.2 FUTURE DEVELOPMENT ___________________________________________ 150
REFERENCES ________________________________________________________ 151 APPENDIX A. DESIGN OF LOCA EXPERIMENT ______________________ 163 APPENDIX B. NORMAL OPERATION OF CNA-2 NPP __________________ 185 APPENDIX C. INVESTIGATION OF FGR DURING POWER RAMPS: BWR INTER-RAMP AND PWR SUPER-RAMP _________________________________ 203 APPENDIX D. MODELING OF LB-LOCA: MT-4 MT-6A TESTS __________ 219 APPENDIX E. NON STANDARD APPLICATION OF TU CODE: FK-1 CASE
237
ABBREVIATIONS
ACC Accumulator
AM Accident Management
ARN Autoridad Regulatoria Nuclear BDBA Beyond Design Basis Accident BEPU Best Estimate Plus Uncertainty
BEQ Burnup Equilibrium
BIC Boundary and Initial Conditions
BOT Break Opening Time
BWR Boiling Water Reactor
CAL Calculation
CFD Computational Fluid Dynamics CFR Code of Federal Regulation (US) CHF Critical Heat Flux
CIAU Code with capability of Internal Assessment of Uncertainty
CL Cold Leg
CNA Central Nuclear Atucha (CNA-2 or CNA-II is Atucha-2 or Atucha-II)
CR Control Rod
CSAU Code, Scaling Applicability and Uncertainty CSNI Committee on the Safety of Nuclear Installations DBA Design Basis Accident
DC Down-comer
DEGB Double Ended Guillotine Break
DIMNP Dipartimento di Ingegneria Meccanica Nucleare e della Produzione DOE Department of Energy (US)
EC European Commission
ECC Emergency Core Cooling ECR Equivalent Cladding Reacted
ENACE Empresa Nuclear Argentina de Centrales Electricas
EPM Emergency Power Mode
EXP Experiment
FDM Finite Difference Method
FC Fuel Channel
FPP Fission Power Peak
FSAR Final Safety Analysis Report
FW Feed-water
GRNSPG San Piero a Grado Nuclear Research Group (of DIMNP)
HL Hot Leg
HWR Heavy Water Reactor
IAEA International Atomic Energy Agency
IFPE International Fuel Performance Experiments
INEEL Idaho National Engineering and Environment Laboratory (now INL) JRC Joint Research Centre
KWU Kraftwerk Union AG
LB-LOCA Large Break LOCA
LHGR Linear Heat Generation Rate
LOCA Loss Of Coolant Accident
LP Lower Plenum
LPIS Low Pressure Injection System LWR Light Water Reactor
MCP Main Coolant Pumps
M- Matlab
MT Moderator Tank
MT- Material Test
NA-SA Nucleoélectrica Argentina S.A. NDE Non Destructive Examination
NEA Nuclear Energy Agency
NEM Nodal Expansion Method
NF Non-Failed
NK Neutron Kinetic
NPP Nuclear Power Plant
NRC Nuclear Regulatory Commission NRU National Research Universal NSC Nuclear Science Committee
OECD Organization for Economic Cooperation and Development Ph.W Phenomenological Window
PCI Pellet-Clad l Interaction PCT Peak Cladding Temperature PHWR Pressurized Heavy Water Reactor PIE Post Irradiation Examination
PRZ Pressurizer
PS Primary System
PWR Pressurized Water Reactor
RBMK Reactor Bolshoy Moshchnosty Kipyashiy
RG Regulatory Guide
RIA Reactivity Initiated Accident RPV Reactor Pressure Vessel S Statistic calculation
SBDBA Selected Beyond Design Basis Accident SCC Stress Corrosion Cracking
SG Steam Generator
SIP Safety Injection Pump SoT Start of Transient
SYS TH System Thermal-Hydraulics
T Temperature
TH Thermal-hydraulics
TMI Three Mile Island
TU TRANSURANUS
TPCF Two-Phase Critical Flow Model UNIPI University of Pisa
U Uranium
UO2 Uranium Oxide
UP Upper Plenum
U.S. NRC United Stated Nuclear Regulatory Commission VVER Water Cooled Water Moderated Energy Reactor
XSEC Macroscopic Cross Sections
LIST OF FIGURES
Fig. 1 – Parameters influencing the gap conductance according to G.R. Horn, quoted by Beyer et al. (Horn 1973). __________________________________________________ 26 Fig. 2 – Scheme of the activity. ______________________________________________ 27 Fig. 3 – CNA-2 NPP: Reactor Pressure Vessel (RPV). ___________________________ 32 Fig. 4 – CNA-2 NPP: fuel assembly. _________________________________________ 32 Fig. 5 – CNA-2 NPP: reactor coolant piping and pressurizing systems. ______________ 33 Fig. 6 – CNA-2 NPP: Reactor coolant system logical layout. ______________________ 34 Fig. 7 – CNA-2 NPP: moderator system layout. ________________________________ 36 Fig. 8 – CNA-2 NPP primary system in normal operation. ________________________ 36 Fig. 9 – CNA-2 NPP: primary system in RHR configuration. ______________________ 37 Fig. 10 – CNA-2 NPP: ECC configuration. ____________________________________ 37 Fig. 11 – CNA-2 NPP: layout of one line of the fast boron injection system. __________ 38 Fig. 12 – CNA-2 NPP: simplified overview of secondary side and thermal balance. ____ 42 Fig. 13 – CNA-2 NPP: simplified overview of the feedwater line in UJE and UJA
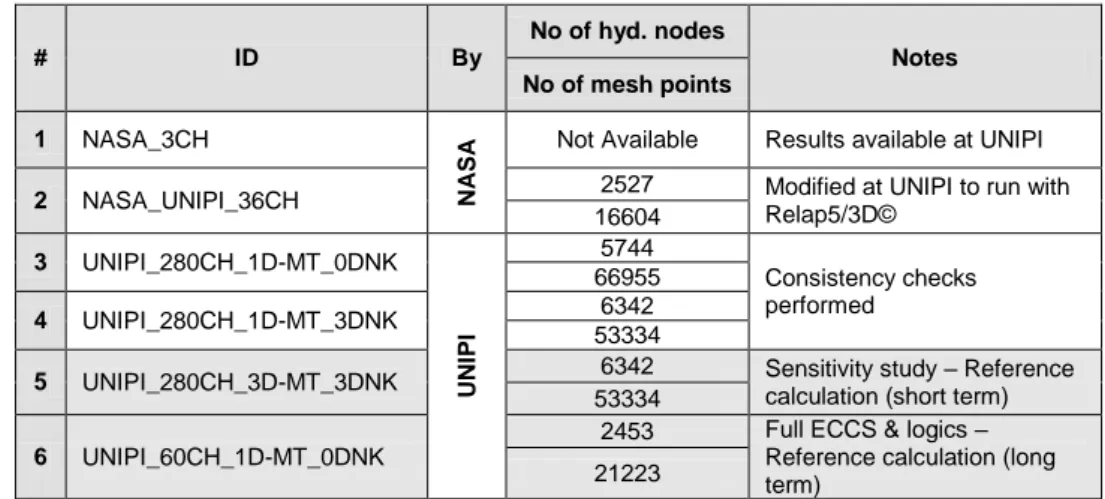
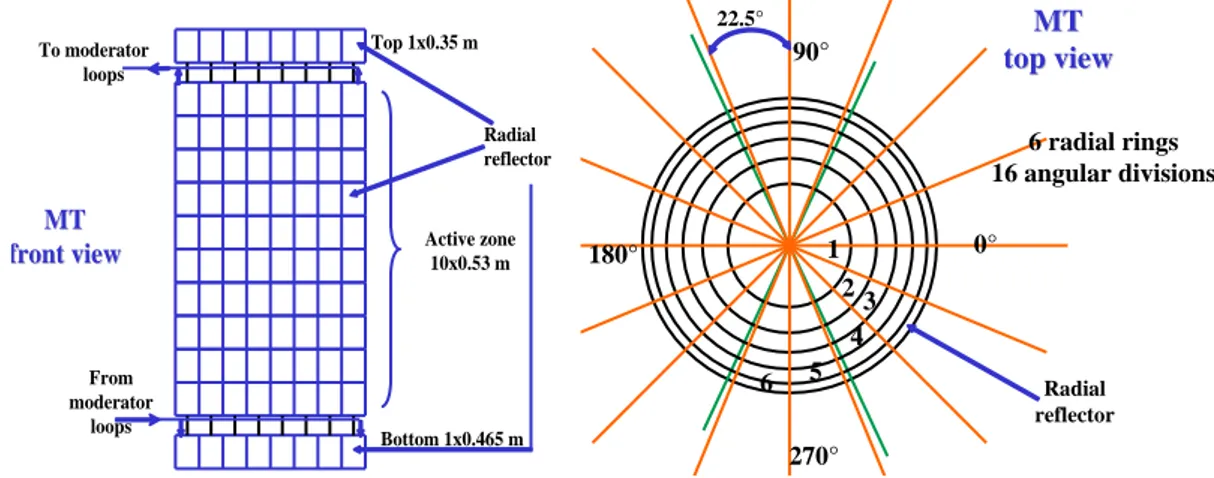
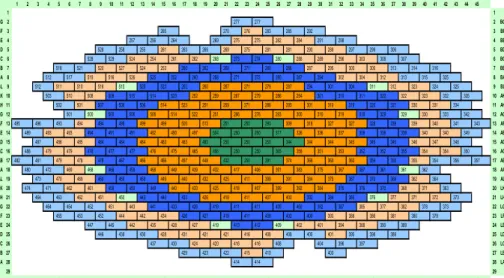
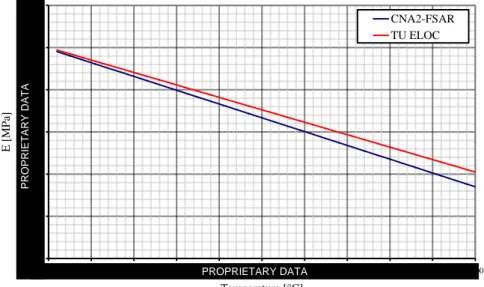
compartments. __________________________________________________________ 43 Fig. 14 – CNA-2 core: correspondence map between FC and thermal-hydraulic zones. _ 45 Fig. 15 – Fuel burnup zones. _______________________________________________ 45 Fig. 16 – FC layout. ______________________________________________________ 47 Fig. 17 – Fuel rods arrangement in a FC. _____________________________________ 47 Fig. 18 – Fuel assembly and fuel rod at different scales. __________________________ 48 Fig. 19 – Fuel rod. _______________________________________________________ 49 Fig. 20 – Schematic representation of the upper part of the CNA-2 fuel rod, including design modification introduced. _____________________________________________ 49 Fig. 21 – UO2 pellet. _____________________________________________________ 50 Fig. 22 – Definition of the LBLOCA phenomenological windows. __________________ 52 Fig. 23 – Description of the interaction between the codes. ________________________ 56 Fig. 24 – Interaction between the Codes. ______________________________________ 56 Fig. 25 – Simplified flowchart for the BEPU approach for Atucha II accident analysis from section 15.0-1 of (NASA FSAR 2011). ________________________________________ 57 Fig. 26 – UNIPI_280CH_3D-MT nodalization: core channel and connected geometrical relevant positions. ________________________________________________________ 77 Fig. 27 – UNIPI_280CH_3D-MT nodalization: global RPV sketch including LP, DC, core channels (not all) and UP. _________________________________________________ 78 Fig. 28 – UNIPI_280CH_3D-MT nodalization: the moderator tank 3D model, front and top view. __________________________________________________________________ 78 Fig. 29 – RELAP5-3D© TH-NK coupling map for the fuel channels. ________________ 80 Fig. 30 – Schematic representation of the axial discretization. _____________________ 81 Fig. 31 – Radial discretization of a slice. ______________________________________ 81 Fig. 32 – Young’s modulus of elasticity of Zircaloy as available from (NASA 2007) and as implemented in TU code (Lassmann 2009). ____________________________________ 83 Fig. 33 – Burst stress of Zircaloy as available from (NASA 2007) and as implemented in TU code (Lassmann 2009). _________________________________________________ 84 Fig. 34 – Melting temperature of UO2 as available from (NASA 2007) and as implemented in TU code (Lassmann 2009). _______________________________________________ 85 Fig. 35 – Local power ramps during on power refueling of CNA-1 (PSAR 1980). _____ 90 Fig. 36 – PCI limit during on power refueling of CNA-1 (Dusch 1980). _____________ 90
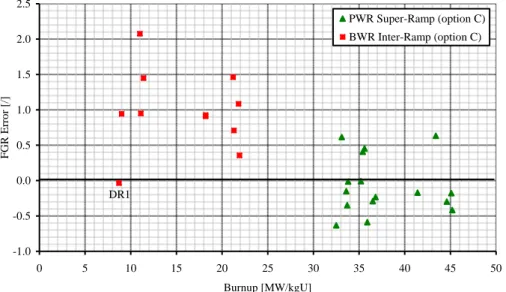
Fig. 37 – Procedure for performing the analysis. _______________________________ 91 Fig. 38 – Power ramp failure map for CNA-2 fuel together with the global and burnup dependent limits of CNA-1, case of burnup = 3._________________________________ 92 Fig. 39 – Power ramp failure map for CNA-2 fuel together with the global and burnup dependent limits of CNA-1, case of burnup = 8._________________________________ 92 Fig. 40 – Power ramp failure map for CNA-2 fuel together with the global and burnup dependent limits of CNA-1, case of equilibrium burnup of the reference core. _________ 98 Fig. 41 – Schematic BWR Inter-Ramp irradiation history. ________________________ 99 Fig. 42 – Schematic PWR Super-Ramp irradiation history. ________________________ 99 Fig. 43 – Summary of measured and calculated Fission Gas Released vs Ramp Terminal Level: BWR Inter-Ramp and PWR Super-Ramp Projects. ________________________ 100 Fig. 44 – Summary Fission Gas Released errors vs Burnup: BWR Inter-Ramp and PWR Super-Ramp Projects. ____________________________________________________ 100 Fig. 45 – Summary Calculated peak fuel temperature vs Burnup: BWR Inter-Ramp and PWR Super-Ramp Projects and Vitanza threshold. _____________________________ 101 Fig. 46 – Schematic illustration of failure modes during LOCA transients (Vitanza 2008). _____________________________________________________________________ 101 Fig. 47 – Schematic illustration of two types failure modes in early and late phases of RIA transients (Nakamura 2004). ______________________________________________ 103 Fig. 48 – Possible mechanisms for fuel and cladding damage under a RIA (Fuketa 2005). _____________________________________________________________________ 104 Fig. 49 – Scheme of application of restart option from (Nordström 2003). ___________ 110 Fig. 50 – Available experiments at NSRR (Nakamura 1999). _____________________ 111 Fig. 51 – Example of Japanese fuel failure threshold for PCMI (Vitanza 2008). ______ 111 Fig. 52 – Roadmap of code connections for the application of TRANSURANUS code. __ 116 Fig. 53 – Example of evolution of power profiles in channel No 375. _______________ 118 Fig. 54 – Example of evolution of power profiles in channel No 272. _______________ 118 Fig. 55 – Power, pressure and maximum cladding temperature, “280ch” 3D-NK. ____ 119 Fig. 56 – Power, pressure and maximum cladding temperature, all the transient, “60ch” 0D-NK. _______________________________________________________________ 119 Fig. 57 – Average linear heat rate distribution, steady state conditions. _____________ 120 Fig. 58 – Average burnup distribution, BEQ conditions. _________________________ 121 Fig. 59 – Temperature (slice 3) distribution, steady state conditions. _______________ 121 Fig. 60 – Average linear heat rate distribution at time of power peak. ______________ 122 Fig. 61 – Temperature (slice 3) distribution at time of power peak. ________________ 123 Fig. 62 – Average linear heat rate distribution at time of PCT. ____________________ 123 Fig. 63 – Temperature (slice 3) distribution at time of power peak. ________________ 124 Fig. 64 – Identification of the correpondence between TH and 3D-NK core channels. __ 127 Fig. 65 – Burnup zones and values (in MWd/tU) of the equilibrium reference core. ____ 128 Fig. 66 - Burnup vs time at different linear heat rate, example. ____________________ 128 Fig. 67 - Scheme of the irradiation, burnup zones 2, 3 and 6. _____________________ 129 Fig. 68 – Scheme of the irradiation, burnup zone 1, 4 and 5 (refueling is simulated). __ 129 Fig. 69 - Schematic view of fuel rod extraction and insertion. _____________________ 130 Fig. 70 - Relative axial power history during refueling as function of time for different axial position: fuel rod extraction. ______________________________________________ 130 Fig. 71 - Relative axial power history during refueling as function of time for different axial position: fuel rod insertion. _______________________________________________ 131 Fig. 72 – Fuel channel radial peaking factors considered for the application of
Fig. 73 – Simplified scheme of the calculation procedure for the reference case. ______ 133 Fig. 74 – Simplified scheme of the calculation procedure for the case of use of radial peaking factors. ________________________________________________________ 133 Fig. 75 – Sample of the table used to document the input deck (Adorni FU-04 2008). __ 136 Fig. 76 – Outline of code interactions. _______________________________________ 137 Fig. 77 – Outline of program blocks. ________________________________________ 137 Fig. 78 – Sample scheme of M-Programs. ____________________________________ 140 Fig. 79 – Enthalpy released to the fuel. ______________________________________ 142 Fig. 80 – Fuel pellet temperature at hot spot. _________________________________ 143 Fig. 81 – Equivalent cladding thickness reacted. _______________________________ 143 Fig. 82 – Map of failed fuel channels. _______________________________________ 144 Fig. 83 – Characterization of the rod failure mechanism: Maximum average equivalent stress versus the maximum cladding temperature for the 451 fuel pins representing the average conditions of the Atucha II FC. ______________________________________ 145 Fig. 84 – Distribution of the failure times. ____________________________________ 145 Fig. 85 – Scheme of failure modes during combined LOCA and RIA. _______________ 146 Fig. 86 – Summary of the minimum safety margins per burnup zone. _______________ 195
Fig. A. 1 – Simplified sketch of the reactor. ___________________________________ 170 Fig. A. 2 – Simplified flow sheet of the reactor system. __________________________ 170 Fig. A. 3 – Typical core map. ______________________________________________ 171 Fig. A. 4 – Typical test rig. ________________________________________________ 171 Fig. A. 5 – Test rig for burnup accumulation layout. ____________________________ 176 Fig. A. 6 – Test rig for power pulse testing layout. _____________________________ 176 Fig. A. 7 – Simplified drawing of the loop, IFA-650.6 test. _______________________ 180 Fig. A. 8 – Linear heat rate. _______________________________________________ 180 Fig. A. 9 – Range of temperatures. __________________________________________ 181 Fig. A. 10 – Pressure. ____________________________________________________ 181 Fig. A. 11 – Example of gamma scanning during LOCA test (Vitanza 2008). _________ 182
Fig. B. 1 – Power ramp shape scheme. ______________________________________ 187 Fig. B. 2 – BIC of the analytical analysis of the power ramps. ____________________ 187 Fig. B. 3 – Scheme of the irradiation, burnup zone 1, 4 and 5 (refueling is simulated). _ 190 Fig. B. 4 – Scheme of the irradiation, burnup zones 2, 3 and 6. ____________________ 190 Fig. B. 5 – Power ramp failure map for CNA-2 fuel together with the global and burnup dependent limits of CNA-1, equilibrium burnup of the reference core. ______________ 191 Fig. B. 6 – Power ramp failure map for CNA-2 fuel together with the global and burnup dependent limits of CNA-1, case of burnup = 0.________________________________ 197 Fig. B. 7 – Power ramp failure map for CNA-2 fuel together with the global and burnup dependent limits of CNA-1, case of burnup = 3.________________________________ 197 Fig. B. 8 – Power ramp failure map for CNA-2 fuel together with the global and burnup dependent limits of CNA-1, case of burnup = 6.________________________________ 198 Fig. B. 9 – Power ramp failure map for CNA-2 fuel together with the global and burnup dependent limits of CNA-1, case of burnup = 8.________________________________ 198 Fig. B. 10 – Power ramp failure map for CNA-2 fuel together with the global and burnup dependent limits of CNA-1, case of burnup = 10._______________________________ 199 Fig. B. 11 – Fuel safety criteria 1: Maximum fuel centerline temperature, calculated data and limit. ______________________________________________________________ 199
Fig. B. 12 – Fuel safety criteria 2: Maximum fuel rod internal pressure, calculated data and limit. ______________________________________________________________ 200 Fig. B. 13 – Fuel safety criteria 4: Maximum cladding strain, calculated data and limit. 200 Fig. B. 14 – Fuel safety criteria 5: Maximum oxide thickness, calculated data and limit. 201 Fig. B. 15 – Fuel safety criteria 7: Maximum pressure difference between the rod internal gas pressure and the external coolant pressure, calculated data and critical elastic
buckling pressure limit. __________________________________________________ 201 Fig. B. 16 – Fuel safety criteria 8: Maximum pressure difference between the rod internal gas pressure and the external coolant pressure, calculated data and plastic instability limit. _____________________________________________________________________ 202 Fig. B. 17 – Fuel safety criteria 9: Maximum average equivalent stress, calculated data and design limit. ________________________________________________________ 202
Fig. C. 1 – Base irradiation: implemented TU LHR history. ______________________ 210 Fig. C. 2 – Power ramp: Implemented TU LHR history. _________________________ 211 Fig. C. 3 – Summary of PIE and calculated values (options A, B, C and D) at the end of the experiments: Fission Gas Released. _________________________________________ 215 Fig. C. 4 – Calculated reference case: Ramp Terminal Level vs Fission Gas Released measured Kr% and calculated. _____________________________________________ 216 Fig. C. 5 – Calculated time trends of Fission Gas Released (options A, B, C and D), experimental data, Linear Heat Rate: zoom on ramp. ___________________________ 217 Fig. C. 6 – Summary of measured and calculated Fission Gas Released: BWR Inter-Ramp and PWR Super-Ramp Project. ____________________________________________ 218 Fig. C. 7 – Summary of measured and calculated Fission Gas Released vs Ramp Terminal Level: BWR Inter-Ramp and PWR Super-Ramp Project _________________________ 218
Fig. D. 1 – MT-4: Fuel internal pressure as function of time: measured and calculated. 230 Fig. D. 2 – MT-4: Effective creep and permanent tangential strains calculated at end of irradiation. ____________________________________________________________ 230 Fig. D. 3 – MT-4: Fuel central temperature as function of time, different axial positions. _____________________________________________________________________ 231 Fig. D. 4 – MT-4: Initial free volume in the fuel UP sensitivities: fuel internal pressure as function of time, measured and calculated. ___________________________________ 231 Fig. D. 5 – MT-4: Fill gas pressure sensitivities: fuel internal pressure as function of time, measured and calculated. _________________________________________________ 232 Fig. D. 6 – MT-4: Model option sensitivities: summary of measured and calculated permanent tangential strains at time of burst. _________________________________ 232 Fig. D. 7 – MT-4:Probability distribution of the time of failure for plastic instability. __ 233 Fig. D. 8 – MT-6A: Fuel internal pressure as function of time: measured and calculated. _____________________________________________________________________ 233 Fig. D. 9 – MT-6A: Effective creep and permanent tangential strains at end of irradiation. _____________________________________________________________________ 234 Fig. D. 10 – MT-6A: Zr beta phase as function of time, all axial elevations. __________ 234 Fig. D. 11 – MT-6A: Initial free volume in the fuel UP sensitivities: fuel internal pressure as function of time, measured and calculated. _________________________________ 235 Fig. D. 12 – MT-6A: Fill gas pressure sensitivities: fuel internal pressure as function of time, measured and calculated. ____________________________________________ 235 Fig. D. 13 – MT-6A: Summary permanent tangential strains at time of burst. ________ 236 Fig. D. 14 – MT-6A:Probability distribution of the time of failure for plastic instability. 236
Fig. E. 1 – Configuration of test sections and their relation to the mother rod. ________ 240 Fig. E. 2 – Base irradiation history for segmented fuel rod used to provide RIA test section. _____________________________________________________________________ 241 Fig. E. 3 – Power histories (Fuketa 1997). ___________________________________ 241 Fig. E. 4 – FK-1: Coolant temperature and linear heat rate, zoom on the power peak. _ 243 Fig. E. 5 – FK-2: Coolant temperature and linear heat rate, all the transient. ________ 244 Fig. E. 6 – FK-2: Coolant temperature and linear heat rate, zoom on the power peak. _ 244 Fig. E. 7 – FK-2: Coolant temperature and linear heat rate, all the transient.________ 245 Fig. E. 8 – FK-3: Coolant temperature and linear heat rate, zoom on the power peak. _ 245 Fig. E. 9 – FK-3: Coolant temperature and linear heat rate, all the transient. ________ 246 Fig. E. 10 – Calculated fuel pin pressure for two different code options. ____________ 248 Fig. E. 11 – Calculated cladding outer radius for different axial positions. __________ 248 Fig. E. 12 – Calculated fuel centre temperature for different axial positions. _________ 248 Fig. E. 13 – Calculated and measured fission gas release. _______________________ 248 Fig. E. 14 – Calculated and measured pellet stack elongation. ____________________ 249 Fig. E. 15 – Calculted and measured cladding elongation. _______________________ 249 Fig. E. 16 – Calculated and measured cladding outer radius, and calculated fuel outer radius and cladding inner radius. __________________________________________ 249 Fig. E. 17 – Calculated and estimate peak fuel enthalphy. _______________________ 249
LIST OF TABLES
Tab. 1 – CNA-2 NPP: main features. _________________________________________ 30 Tab. 2 – Comparison of CNA-2 and other NPP: main features. ____________________ 31 Tab. 3 – CNA-2 NPP: main features of secondary side. ___________________________ 41 Tab. 4 – Fuel assemblies movements for burnup management; 6 zones for depletion and 3 paths for irradiation. _____________________________________________________ 46 Tab. 5 – FC geometrical dimensions. _________________________________________ 47 Tab. 6 – Fuel rods arrangement in a FC. ______________________________________ 47 Tab. 7 – CNA-2 fuel data (the data shown are valid at room temperature). ___________ 50 Tab. 8 – Acceptance criteria. _______________________________________________ 58 Tab. 9 – The use of codes and nodalizations. ___________________________________ 58 Tab. 10 – Fuel melting temperatures as function of burnup. _______________________ 59 Tab. 11 – Design limits for stress analysis. ____________________________________ 63 Tab. 12 – Fuel safety criteria from (OECD 2000). _______________________________ 65 Tab. 13 – Specific Acceptance Criteria for Design Basis Accidents from (UNIPI 2008). _ 66 Tab. 14 – Nodalizations for TH-SYS considered for the LBLOCA analysis of CNA-2. ___ 76 Tab. 15 – UNIPI_280CH_3D-MT nodalization: adopted code resources. ____________ 77 Tab. 16 – UNIPI_60CH_1D-MT nodalization: adopted code resources. _____________ 79 Tab. 17 – List of validation activities. ________________________________________ 88 Tab. 18 – Normal operation: summary of relevant parameters for validation. _________ 88 Tab. 19 – Accident conditions: summary of relevant parameters for validation for the LOCA analysis. __________________________________________________________ 89 Tab. 20 – Accident conditions: summary of relevant parameters for validation for the RIA analysis. _______________________________________________________________ 89 Tab. 21 – CNA-2 Fuel design criteria. ________________________________________ 93 Tab. 22 – Summary table of RIA: NSRR and CNA-2. ____________________________ 109 Tab. 23 – Selected relevant BIC related to fuel, as considered for the LBLOCA analysis.120 Tab. 24 – Characterization of burn-up zones for the application of Transuranus (6 zones for depletion and 3 paths for irradiation). ____________________________________ 125 Tab. 25 – Matlab files for BIC preparation. __________________________________ 138 Tab. 26 – Main MATLAB programs FOR run the calculations. ____________________ 138 Tab. 27 – Main support MATLAB programs. __________________________________ 139 Tab. 28 – Summary of the maximum and minimum safety margins per burnup zone. ___ 195
Tab. A. 1 – IGR reactor characteristics. ______________________________________ 165 Tab. A. 2 – NSRR reactor characteristics. ____________________________________ 166 Tab. A. 3 – CABRI reactor characteristics.Part 1 of 2. __________________________ 167 Tab. A. 4 – Nominal reactor operating data. __________________________________ 170 Tab. A. 5 – HBWR reactor characteristics.Prt 1 of 2. ___________________________ 171 Tab. A. 6 – Proposed test matrix. __________________________________________ 176 Tab. A. 7 – Required ∆LHR for fuel centerline melting (650 kJ/kg). ________________ 182 Tab. A. 8 – Heat rates for different fuel enrichments. ___________________________ 182 Tab. A. 9 – Time schedule of the project. _____________________________________ 184
Tab. B. 1 – Main MATLAB programs for the analytical investigations of the power ramps. _____________________________________________________________________ 188 Tab. B. 2 – Main MATLAB programs for the analyses of the normal operation. _______ 191
Tab. C. 1 – FGR at grain boundary options. __________________________________ 207 Tab. C. 2 – BWR-Inter-Ramp experiments, maximum ramp rate and linear heat rate. __ 208 Tab. C. 3 – PWR-Super-Ramp experiments, maximum ramp rate and linear heat rate. _ 209
Tab. D. 1 – Validation domain. ... 229
Tab. E. 1 – Pulse irradiation conditions. _____________________________________ 242 Tab. E. 2 – M-Programs developed to run the calculations and prepare the figures. ___ 246
Tab. F. 1 – CNEA MOX Experiments. _______________________________________ 251 Tab. F. 2 – BWR Inter-Ramp. ______________________________________________ 252 Tab. F. 3 – PWR Super-Ramp. _____________________________________________ 253 Tab. F. 4 – BWR Super-Ramp. ____________________________________________ 254 Tab. F. 5 – MT-4 and MT-6A. _____________________________________________ 255
1. INTRODUCTION
Loss of coolant accidents (LOCA) mean those postulated accidents that result from the loss of reactor coolant at a rate in excess of the capability of the reactor coolant makeup system from breaks in the reactor coolant pressure boundary, up to and including a break equivalent in size to the double-ended rupture of the largest pipe of the reactor coolant system (DEGB LB-LOCA).
A peculiarity of the Atucha-2 design is the positive void reactivity coefficient. This is a characteristic in common to other heavy water moderated reactors that utilize natural uranium as fuel. This implies that after a LB-LOCA event, the fission power peak at the very beginning of the transient is controlled by the void formation in the core channels, and then it is determined by the pressure wave propagation from the break. Indeed, the moderator is still liquid and flashes delayed with respect to the coolant, thus the LOCA event is also a RIA (reactivity insertion accident) event. Licensing requirements vary by country in terms of their scope, range of applicability and numerical values and in general imply the use of complex system thermal hydraulic computer.
Depending on the specific event scenario and on the purpose of the analysis, it might be required the availability of calculation methods that are not implemented in the standard system thermal hydraulic codes, as for burst temperature, burst strain and flow blockage calculations. This may imply the use of a dedicated fuel rod thermo-mechanical computer code such as TRANSURANUS.
1.1
Objectives of the research
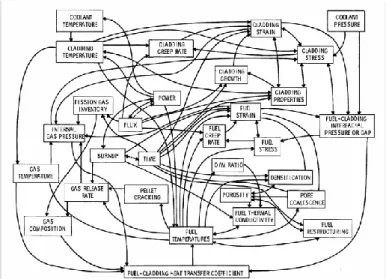
The fuel rod constitutes the first barrier against the release of fission products. The accurate description of the fuel rod‟s performance is an interdisciplinary field. The fuel rod is operated under varying conditions, and it changes the physical and thermodynamic properties during irradiation, e.g. see Fig. 1. The capability of predicting its behavior and life-time, for a wide range of normal, off-normal and accident conditions (including limiting conditions, such as LOCA and RIA) constitutes an achievement in ensuring the safe and economic operation of nuclear power plants. The prediction of the fuel performance in safety analysis requires the use of “ad hoc” codes, well defined boundary and initial conditions (connections with thermal hydraulics, three dimensional neutron kinetics, and depletion codes) as well as appropriated and validated models, belonging to different physics‟ fields. Investigations of fuel behavior are carried out in close connection with experimental research, operation feedback and computational analyses. In the last decades, a considerable world wide effort has been expended in experimental and numerical modeling of fuel rods behavior in accident conditions, which has led to a broader and deeper understanding of LOCA and RIA related phenomena. In this regard, a complementary, but not less important, activity is the validation of the fuel pin mechanics codes (i.e. TRANSURANUS) against experimental data available, to demonstrate the reliability of their predictions.
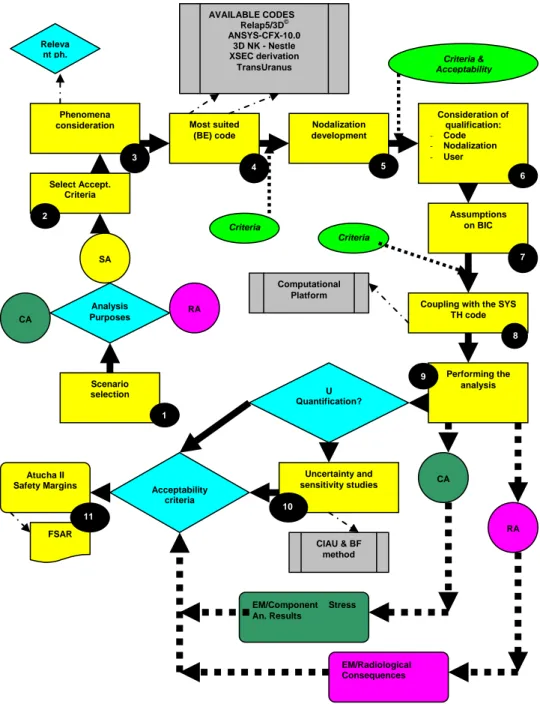
The aim of the current PhD program is the development and the application of a methodology for the analysis of the fuel behavior during accident conditions, such as LOCA and RIA in nuclear power plants and the demonstration of the reliability of their prediction , Fig. 2. TRANSURANUS is the fuel performance code, selected for the research activity. The methodology implies the application of best estimate thermal-hydraulic, neutron physics and fuel pin performance computer codes, with the objective to verify the compliance with the specific acceptance criteria. The fuel pin performance code is applied with the main objective to evaluate the extent of cladding failures during the transient.
The procedure consists of a deterministic calculation by the fuel performance code of each individual fuel rod during its lifetime and in the subsequent LB-LOCA transient calculations. The boundary and initial conditions (BIC) (e.g. pin power axial profiles) are provided by core physics and three dimensional neutron kinetic coupled thermal-hydraulic system codes calculations. The procedure is completed by the sensitivity calculations and the application of the probabilistic method. Validation activities are performed to enhance the TRANSURANUS code capabilities and to improve the reliability of the code results. Verification relies on the two main sources of data, namely, specific data on Atucha-1 and/or 2, experiments or independent calculations and other data which are representative of the Atucha-2 fuel, in particular for the analysis of the normal operation and power ramp during normal operation and severe transients like LOCA and RIA.
1.2
Description of the preformed activity
The activity performed for fulfilling the objectives of the research is outlined in Fig. 2. The steps below are executed to fulfill the objectives:
- acquisition of expertise in the nuclear fuel field, taking advantage from the participation in international activities;
- investigation of issues related to the use of the fuel pin mechanics codes; - development of a methodology/procedure for predicting the fuel
performance in safety analysis (including the connection with the FSAR) by means of fuel pin mechanics code;
- application of the methodology/procedure in case of combined LOCA and RIA transient (selected BDBA in the Chapter 15 of the FSAR of Atucha-2 NPP) for evaluating the number of failed rods and the release of the fission products;
- validation activities to support the reliability of the analyses. - completion of the activity considering the environmental release.
Finally, the Candidate is also taking part in international activities related to the PhD program.
- Membership to the OECD-NEA “Working Group on Fuel Safety” (WGFS) with the mission to advance the current understanding and address safety issues related to fuel safety.
- Participation to the IAEA Coordinated Research Project on Fuel Modeling at Extended Burnup (CRP FUMEX-III) “Improvement of Computer Codes
used for Fuel Behavior Simulation” (2008-2012), in cooperation to the code developers.
- Participation to ATUCHA-2 Project, commissioned by the Argentinean NA-SA, for the analyses of the fuel behavior in the framework of the preparation of the FSAR (Chapters 4 and 15).
- Participation to the EC Project “Support to VATESI in Assessment Safety of Ignalina NPP” in cooperation with the “Lithuanian Energy Institute” (LEI): tasks related to fuel.
- Participation to the OECD Sandia Fuel Project “Thermal-Hydraulic and Ignition Phenomena Characterization of Prototypic Pressurized Water Reactor Assemblies”.
1.3
Structure of the document
The thesis is divided in eight sections and six appendixes.
The Introduction contains the background information and the objective of the activity.
Section 2 describes the Atucha-II NPP, highlighting the peculiarities of the plant with focus on the fuel and refueling strategy.
Section 3 reports the peculiarities of the LB-LOCA: i.e. combined LOCA and RIA. From this section it results clear that there is the need for the analysis of the availability of calculation methods that are not implemented in the standard system thermal hydraulic codes. In the same section, an outline of the specificity of the licensing is reported. Due to the peculiarities of the plant, even setup licensing criteria for normal operation and transient had been challenging (reference to the need of creation of a special category for the LB-LOCA).
Section 4 contains the description of the codes and models, with emphasis given to the interfaces between the different codes. The work of the thesis needed an effort in reviewing the work performed in the framework of the licensing of Atucha-II. The detailed motivation of the selection of the model used for the analysis is highlighted as well.
A strong effort had been performed in order to enhance the TRANSURANUS code capabilities and to improve the reliability of the code results. Section 5 is focused on the applicability of the TRANSURANUS code and of the methodology to CNA-2, and does not want to be related to the general applicability of TRANSURANUS code, whether it results useful for the application of the code itself.
Section 6 contains the description of the developed methodology for the application of the fuel performance code to the safety analysis of Atucha-II NPP.
Finally, the results of the application of the developed methodology are reported in Section 7.
Conclusions are drawn in Section 8, focusing on innovations together with hints for future developments.
1.4
Innovations
The application of the methodology helps to assess the number of the fuel element that can fail in case of the selected accident, identification of the failed fuel rods for the subsequent evaluation of the radiological release. Analysis were performed to support the study of normal operation for the simulation of irradiation fuel rods during normal operation as it defines the status of fuel at the beginning of transient; In addition to this, the activities performed to support the reliability of the code results and constitute an enlargement of the TU validation domain (an example of non standard application is analyzed as well).
Within the overall objective of the research, the following relevant results may be highlighted:
1. Application of the methodology developed, to the FSAR Chapter 15 of Atucha NPP in construction in Argentina.
2. Demonstration that the application of the proposed methodology allows evaluating the performance of the fuel and to the required level of safety (including the review and selection of these criteria, for normal operation (design review) and for the selected accident conditions (LOCA and RIA combined)).
3. Identification and extension of the “validation domain” of the TRANSURANUS code. to enhance the code capabilities and to improve the reliability of the code results.
4. Feasibility study of an experiment to be conducted in a research reactor, including the preparation of the technical specifications and cost analysis, extremely challenging from the scientific point of view.
Fig. 1 – Parameters influencing the gap conductance according to G.R. Horn, quoted by Beyer et al. (Horn 1973).
2. ATUCHA-II NPP
2.1
Layout
Atucha II (CNA-2) NPP is a 745 MW(e) reactor constructed by ENACE S.A., Nuclear Argentine Company for Electrical Power Generation and SIEMENS AG KWU, Erlangen, Germany. It belongs to a second generation reactor type PHWR. All the nuclear area is based on the prototype reactor MZFR 56 MW (e) which was placed in operation at the Nuclear Research Center in Karlsruhe (West Germany) in 1966. Also it was designed on the bases of Atucha I NPP with 354 MW (e) (1969). The secondary and auxiliary systems were designed in a similar way as Konvoi PWR plants, from Germany (around 1989). In Tab. 1 the main features of the nuclear island of the plant are showed. Atucha-II reactor employs heavy water (D2O) as moderator and as coolant. Nevertheless moderator and coolant are kept separated, so that the Reactor Coolant System does not handle the large amount of moderator necessary in this kind of reactor, owing to the relatively low moderating power (ξΣs) of D2O. Moreover, maintaining coolant and moderator separated allows keeping them at different temperatures (Mayers 1985). In Tab. 2 the comparison of CNA-2 and other type of NPP is reported.
2.2
Primary system
2.2.1 Reactor system (JA)
The reactor system consists of the reactor pressure vessel (JAA), its internals and the control shutdown equipment. Its function is to generate thermal power. In Fig. 3, a schematic view of the RPV is given, the figure shows also coolant and moderator inlet / outlet points and inlet points designed for core safety injection. The reactor core of Atucha-II NPP is built up of 451 fuel assemblies. Each fuel assembly is placed in a shroud type tube which serves as coolant channel. The tubes are arranged in a vertical triangular lattice within the moderator tank. The lattice pitch is 27.24 cm. The fuel assemblies are bundles of 37 closely packed fuel rods, which are arranged in 3 concentric circles with 6, 12 and 18 fuel rods around a central fuel rod. This arrangement is shown in Fig. 4.
At normal moderator temperature the coolant absorbs approx. 90% of the generated power; the moderator absorbs the remaining part. Therefore it is necessary to cool down both of them: the thermal power removed by the coolant is exploited in two steam generators to produce steam destined to the turbines, whereas the remainder is transferred from the moderator to the feed-water (secondary side) in 4 “moderator coolers” upstream the inlet of the steam generators.
A thermal power of approx. 2160 MW is generated in the core, while a thermal power of 15 MW is generated inside the reactor coolant pumps. Therefore the total thermal power transferred to the secondary fluid both in the steam generators and in the moderator coolers is about 2175 MW.
CNA-2 PRIMARY SIDE
Reactor type Thermal PHWR
Generated power 2175 [MWth] Control rods Materials/n°: hafnium / 9 rods, steel / 9 rods
Cladding Material: Zr-4 Fuel
Type: 451 fuel assemblies with 37 fuel rods Material / core position: natural UO2 / vertical
Equilibrium burnup at fuel discharge [MWd/tonU]: 7800 Refueling: online with one refueling machine
Coolant data at full load
Material: D2O
RPV inlet / outlet temperatures [°C]: 277.9 (278.1)* / 312.5 (313.5)
D2O volume (without pressurizer and surgeline) [m 3
]: 211 Total core mass flow [kg/s]: 10344
N° of loop: 2
Moderator data at full load
Material: D2O
Normal / Max average temperatures [°C]: Tav.normal=170 /
Tav.max=220
RPV inlet / outlet temperatures [°C]: 141.4 (197) / 201
(243.3)
D2O volume [m 3
]: 234.5
Total core mass flow [kg/s]: 891.6 (835.6) N° of loop: 4
Primary side pressures
Pressure at reactor outlet [MPa]: 11.4
Overall pressure loss in reactor coolant system [MPa]:
1.07
Overall pressure loss in moderator system [MPa]: 0.65 Pressurizer
Pressurizer pressure[MPa]:11.35 Pressurizer temperature [°C]:320 Pressurizer total volume [m3]: Steam
Generator primary side
N°/Type: 2 / U-tube heat exchanger
Heat transferred by each SG at full load [MW]: 1000 D2O volume [m
3
]: 35.3
SG inlet / drop temperatures [°C]: 312 (313.5) / 34.9 (35.7) N° of tubes per each SG: 6524
Moderator coolers Primary side
Inlet temperature [°C]: 201.5 Outlet temperature [°C]: 141.4
Heat transfer per moderator cooler [MW]: 55.7
Mass flow rate per Moderator Cooler [kg/s]: 220.9 (207.1)
*
: Data stated in brackets refer to the average max. moderator temperature under full load
conditions
Item CNA-2 CNA-1 BWR PWR CANDU RBMK
Fuel Assembly -- -- 8 x 8 17 x 17 -- 18 x 2
Fuel Rod per
Assembly 37 36 63 264 37 36 No of Assemblies 451 253 592 193 456 1661 Core Active Length [m] 5.3 5.3 3.6 3.6 6.06 6.92 Bundle Length [m] 5.3 5.3 3.6 3.6 0.5 3.46 Fuel Weight [kgU] 89,400 61,000 126,700 118,00 87,500 192,000 Maximum T Clad [°C] 325 324 293 335 326 325 Maximum T Centerline [°C] 2250 2250 2100 2260 1900 1400 Discharge Burnup [MWd/tU] 7,500 6,000 >25,000 >35,000 7,000 22,200 Refueling
(Reactor State) On power On power Shut down Shut down On power On power Cladding Diameter [mm] 12.9 11.9 12.3 9.5 13.08 13.6 Cladding Thickness [mm] 0.57 0.55 0.81 0.57 0.38 0.9 Fuel Pellet Diameter [mm] 11.57 10.62 10.4 8.19 12.15 11.50 Fuel Pellet Height [mm] 14 12.0 10.4 8.30 16.04 15.00 Enrichment [%] Natural Uranium Natural Uranium ~3% ~3 % Natural Uranium ~ 2.4%
Fill Gas Helium Helium Helium Helium -- Helium
Fill Gas Press.
(absolute) [bar] 22.5 22.5 3 – 7 20-30 -- 5
Fuel Material UO2 UO2 UO2 UO2 UO2 UO2
Cladding
Material Zr-4 Zr-4 Zr-2 Zr-4 Zr-4 ZrNb
Fig. 3 – CNA-2 NPP: Reactor Pressure Vessel (RPV).
(a) Fuel assembly cross sections
(b) Views of fuel assembly Fig. 4 – CNA-2 NPP: fuel assembly.
2.2.2 Reactor coolant system (JF)
It consists of two identical loops each comprising one steam generator, one reactor coolant pump and the interconnecting reactor coolant piping together with the pressurizing and pressurizer relief system.
Atucha-II Reactor Coolant System is very similar to the traditional primary system of a PWR with two coolant loops. For each loop, the coolant from the RPV outlet is send toward a U-tube steam generator, where it transfers its thermal energy to the secondary fluid to produce steam. Thereafter, a reactor coolant pump receives the fluid from the SG outlet, increases its pressure and pumps it toward the reactor. After entering the reactor pressure vessel, the coolant, with exception of 1%
bypassed to the RPV closure head, flows downward through the downcomer (between inner vessel wall and moderator tank outer wall), reaches the lower plenum and splits up into the 451 coolant channels (a minor part flows also in the gap between the FCs). The coolant cools down the fuel rods during its flowing upward and then it reaches the upper plenum above the moderator tank. Here the total coolant flow rate gathers again and reaches the reactor vessel outlet (Fig. 3, Fig. 5 and Fig. 6).
In order to impose coolant and moderator pressure and to damp pressure oscillations, a pressurizer is connected to one of the two coolant loops by mean of the surge line that connects hot leg to the pressurizer.
In Fig. 6, the pressurizer relief system (JEG) and pressurizer spray line (JEF) are also shown: JEG consists in essence of the pressurizer valves and the relief tank it and is connected to the pressurizing system by the safety valves flanged on to the relief tank dome. JEF connects the two cold lines (after MCP) to the pressurizer sprays. The pressurizer relief system serves to condense and remove the steam blown down via the pressurizer safety valves while the spray system serves to condense steam and to reduce primary pressure by mean of cold water, each spray line split into two lines connected to the pressurizer dome.
Fig. 6 – CNA-2 NPP: Reactor coolant system logical layout.
2.2.3 Reactor moderator system
The particular aspect of Atucha-II is the Moderator System. This system (Fig. 7) consists of four identical loops each comprising one moderator cooler, one moderator pump, the interconnecting piping and the valves necessary for isolation and changeover. Considering one of the 4 loops, the moderator from the RPV outlet is send toward an horizontal countercurrent U-tube heat exchanger, the so-called “moderator cooler”, where it transfers its thermal energy to the main feedwater, in order to preheat this before entering the steam generator. The moderator at the outlet of the moderator cooler is then pumped toward the reactor pressure vessel by means of a “moderator pump”. The moderator enters into the reactor pressure vessel by means of 4 vertical tubes, which penetrate into the vessel closure head and reach the bottom of the moderator tank. At the end of the 4 tubes, a ring header receives the moderator and distributes it to the tank. The moderator is then collected in the upper part of the tank and flows out of the vessel by means of 2 outlet tubes at the same level of the coolant nozzles. Out of the vessel, the moderator flow rate from these 2 tubes is split up to the 4 moderator loops. By this way there is no direct contact between moderator and coolant in the “active region”.
Although the moderator is maintained at a lower temperature than the coolant, they are maintained at the same pressure of nearly 11.5 MPa during normal operations. This task is achieved with the pressurizer so coolant and moderator are not completely separate, since a small and controlled mass exchange takes place in special equalization ports inside the reactor pressure vessel but far from the active part (in the moderator tank closure head).
In addition to maintaining the average moderator temperature during power operation irrespective of the coolant temperature, the moderator has the following tasks:
- Removal of residual heat from the shutdown reactor and of the heat stored in the primary system during cooldown and when the plant is in the cold condition.
- Use of the moderator loops for emergency core cooling (ECC) and residual heat removal (RHR) by cooling and injection of moderator into the coolant, and cooling of the water injected by the safety injection pumps from the containment sump.
2.2.4 Steam generators and main pumps
The two steam generators are natural circulation, U-tubes bundle heat exchangers. The reactor coolant enters the hot leg U-tubes to transfer the power it has absorbed to the secondary side. After releasing his heat, the reactor coolant passes through the cold out-let plenum to the cold leg reactor coolant line.
The feedwater (secondary side) is preheated in the moderator coolers, and then enters the SG by mean of a nozzle located in the steam plenum. A ring header below the nozzle distributes the feedwater in the down comer where it is mixed with the water separated out in the SG cyclones and driers. In the riser it evaporates on the U-tubes and leaves the SG via the cyclones and driers as saturated steam (dryness: 99.75%).
2.2.5 Residual Heat Removal (KAG) and Safety injection system
(JND)
The most important conditions of the plant are three: normal operation depicted in Fig. 8, residual heat removal configuration (Fig. 9), emergency core cooling configuration (Fig. 10). The tasks involved in JND and RHR are performed by changing over the moderator system to the RHR configuration: the isolating gate valves in the RHR suction lines are opened and the normal configuration valves are closed.
In RHR configuration (Fig. 9) the moderator system is of four-train redundancy, as required. The RHR injection lines by mean of the bypass valves inject can inject: in hot and cold leg (circuits 1 and 4), in upper and lower plenum of RPV (circuits 2 and 3 respectively). Two out of the four loops are capable of removing the power generated.
The safety injection system (or ECC system) serves to mitigate consequences of loss of coolant accidents. It is subdivided in two subsystems each of four redundant train configuration (Fig. 10):
- Accumulator injection system consists of pneumatic accumulators (20 m3, 6.6 MPa) and water (H2O) tanks (60 m3). The system is connected to the RHR injection lines by means of rupture discs which open at a differential pressure of more than 0.5 MPa. It is required for core reflooding in the event of large and medium breaks.
- The sump injection system is connected to the moderator coolers by mean of rupture discs that open at differential pressure of over 1 MPa. It is capable of injecting at 7.8 MPa. The system is constituted by H2O flooding tanks (70 m3). It serves core reflooding and for long term emergency RHR system.
Fig. 7 – CNA-2 NPP: moderator system layout.
Fig. 9 – CNA-2 NPP: primary system in RHR configuration.
2.2.6 Boron injection system (JDJ)
The Fast Boron Injection system is the back shutdown system. It is based on four injection lances which penetrate the RPV and reach the moderator tank interior, and through which a highly borated solution is injected, driven by pressurized air upstream of the tanks containing the boron solution. Each line contains:
A: Pressurized air tank; B: 2 boron tanks; C: Injection lance; D: Valve on piping between A and B; E: Rupture device on piping between B and C.
In detail the primary system places the following requirements on this system: - Shutdown and maintenance of subcriticality of the reactor on loss of CR
function. Should a given number of CR not reached their end position three seconds after reactor shutdown signal, boron injection is started by the reactor protection system.
- This function is actuated when limits such as primary pressure too high or reactor power too high are reached. The JDJ has been designed with the strict regard to safety aspect.
- Shutdown and maintenance of sub-criticality of the reactor in the event of a LOCA. (Boric acid is injected immediately into the moderator system). - Maintenance of reactor sub-criticality by slow metered boric acid injection
by the JDJ via throttling valves after Xenon reduction and unavailability of the control volume system (the KBA system in the German documentation).
Two out of four trains must be available to satisfy the requirements.
Fast Valve Air Tank Rupture Disk Boron Tank Boron Tank Moderator tank Boron Lance Boron Volume Air Volume Air Pressure inlet
Boron Exit Piston Fast Valve Air Tank Rupture Disk Boron Tank Boron Tank Moderator tank Boron Lance Boron Volume Air Volume Air Pressure inlet
Boron Exit
Piston
2.2.7 Pressurizing spray systems
Pressurizer spray systems are constituted by the pressurizer normal spray system and the auxiliary sprays. The normal sprays comprise the main spray lines that consist of two lines each splitting in two spray lines that connect each cold leg after cooling pumps to the sprays boxes. The connection is achieved by mean of four valves that are closed in normal operation and open when the pressures in the primary side increase.
The auxiliary spray of the volume control system connects via a separate spray line and separate spray box to the pressurizer. They serve to reduce the system pressure in case of loss of normal sprays function. This system differently from the previous can acts also if cooling pumps are not available.
2.2.8 Volume control system (KBA)
It is split in three subsystems capable to fulfilling individual functions:
1. Operational volume control system is connected to the reactor coolant piping via two charge lines (connected to each cold leg) and one letdown line. This system is also connected to the moderator system by mean of two charge lines and four letdown lines. In normal operation the letdown line connected to the coolant piping and the charge line connected to the moderator piping are kept open. This system fulfills:
- Filling and pressurizing the reactor, reactor coolant and moderator systems prior to start up.
- Compensation of volume changes in the primary side. - D2O chemical treatment.
- Boron injection for reactivity control. - Coolant supply for the refuelling machine
- Coolant reserve during leakage in primary circuit.
- Injection of the secured coolant reserve during a leakage in the primary system.
- Injection of a continuous leak-off flow to the high pressure seal of the reactor coolant pumps.
2. Leakage compensating system as to be seen as a redundancy of the normal volume control system. It can acts in case of LOCA and inject independently of the normal control volume system into the moderator system. It is constituted of two suction lines and two compensating pumps each of them branch into two other injection lines.
3. Finally the system is connected also with pressurizer via auxiliary spray line. The subsystem pressurizer relief tank cooling via the D2O circulating pumps fulfills:
- Cooling of the fluid blow-down by the pressurizer safety valves. - Level regulation and purification of the liquid in the pressurizer