ALMA MATER STUDIORUM - UNIVERSITÀ DI BOLOGNA
SCUOLA DI INGEGNERIA E ARCHITETTURA DIPARTIMENTO di
INGEGNERIA DELL’ENERGIA ELETTRICA E DELL’INFORMAZIONE “Guglielmo Marconi”
DEI
CORSO DI LAUREA IN INGEGNERIA ELETTRONICA
CURRICULUM BIOINGEGNERIA
TESI DI LAUREA in
Elaborazione di Dati e Segnali Biomedici M
Cortical Correlates of Closed-Loop Cueing for Turning in
Parkinson’s Disease
CANDIDATO Riccardo Donati RELATORE Chiar.mo Prof. Lorenzo Chiari CORRELATORE Martina Mancini, Ph.D Anno Accademico 2017/2018 Sessione IIITable of Contents
Abstract ... 1
Abstract in lingua italiana ... 2
Introduction ... 4
Methods ... 7
Participants ... 7
Procedures ... 8
Clinical Assessment ... 8
Turning task protocol ... 10
Conditions & Equipment ... 10
Data Analysis & Features Extraction ... 18
Statistical analysis ... 31
Results ... 33
Discussion ... 49
Conclusions ... 52
1 Abstract
The ability to turn is essential for daily living activities. Nearly every task performed during the day requires some amount of turning. Difficulty in turning during gait is a major contributor to mobility limitations, falls and reduced quality of life in older people and people with Parkinson’s disease (PD). Turning gradually becomes more difficult as we age due to increasing sensorimotor impairments or with neurological diseases. The ability to modify our locomotor trajectory by turning safely is important for functional independence but, surprisingly, much more difficult for the nervous system to control than straight-ahead walking. In addition, turning is slower and requires more steps in people with PD, and it is known to elicit Freezing of Gait (FoG).
Cueing, in the form of external visual, auditory, or tactile stimuli, is the most common treatment in neurological rehabilitation for PD, however, effects of cueing on turning are less explored than straight-ahead gait. Auditory, visual or tactile cues are predominantly used in clinical practice in an open-loop (continuous rhythmic stimuli) rather than a closed-loop (intermittent stimuli based on individual movement) modality, likely due to limited availability (i.e. the majority of closed-loop systems are not marketed yet) and ease of application. Only recently have devices been engineered using wearable technologies to monitor mobility and provide real-time feedback to improve performance. In addition, the mechanisms underlying cue response are not clear but previous associative evidence supports the hypothesys that with cueing there is a shift from automatic to more voluntary control of movement. We therefore hypothesized that also closed-loop cueing will lead to a greater activation of the brain circuits involved in the voluntary control of turning such as those of the prefrontal cortex (PFC), a brain region implicated in executive function.
The main aims of this study were (i) to assess whether the cueing intervention can alleviate turning deficits, and (ii) to assess the role of the PFC during turning with and without cues.
The study was conducted at the Oregon Health & Science University (OHSU) in Portland, Oregon, USA, where I had the opportunity to spend three months working on this project in the Balance Disorders Laboratory, at the Department of Neurology.
Twenty-four subjects with idiopathic PD, of which 14 without FoG (FoG-) and 10 with FoG (FoG+), and 8 healthy controls (CTR) were recruited for this study. Subjects were instructed to turn in place for one minute alternating 360° turns to the right and left under single-task (ST) and dual-task (DT) for 2 randomized conditions: (i) Baseline; (ii) Turning with closed-loop tactile biofeedback. In order to measure changes in oxyhemoglobin, a proxy for PFC activity, a functional Near Infrared Spectroscopy (fNIRS) system was used and eight inertial sensors quantified turning performance. In addition, an auditory version of the Continuous Performance Test-AX (AX-CPT) was used as a cognitive test for the DT condition.
The results showed no difference in PFC activity between baseline and closed-loop cueing turning, while turning performance significantly improved with closed-loop cueing compared to baseline. In addition, we found that the reaction time (of the AX-CPT) improves in the DT condition.
Subjects with FoG had a worse overall turning performance with respect to those without FoG in the ST condition, but there was no difference in behavioral outcomes between the groups in the DT condition.
In conclusion, turning performance improved with closed-loop cueing compared to baseline but PFC activity was similar across the two conditions. This evidence may not support our initial hypothesis suggesting that a shift with cueing from automatic to more voluntary control of movement might be unlikely. The activation of other brain circuits or cortical areas could be responsible for the improvements in the turning performance with closed-loop cueing, but further investigations, in a larger group of people, are required.
2 Abstract in lingua italiana
La capacità di girarsi (turning) è essenziale per le attività quotidiane. Molti compiti motori che vengono eseguiti giornalmente richiedono anche solo in minima parte di girarsi.
Le difficoltà nell’eseguire questo compito motorio durante il cammino sono per gli anziani e le persone con la malattia di Parkinson (PD) causa di limiti alla mobilità, di cadute e di una ridotta qualità di vita.
Girarsi diventa gradualmente più difficile quando invecchiamo per via di un peggioramento della percezione sensoriale e della capacità motoria oppure per via della comparsa di malattie neurodegenerative. L’abilità di modificare la nostra direzione di movimento girandoci in maniera corretta è importante per l’indipendenza funzionale ma, sorprendentemente, molto più difficile da controllare per il sistema nervoso rispetto alla semplice camminata in linea retta.
Inoltre, girarsi richiede più tempo ed un maggior numero di passi per le persone con PD ed è stato dimostrato essere causa di episodi di Freezing of Gait (FoG).
La tecnica del cueing, nella forma di stimolazione visiva, uditiva o tattile, è il trattamento più utilizzato nella riabilitazione neurologica per il Parkinson, tuttavia gli effetti di questa tecnica sul turning sono meno esplorati rispetto a quelli sulla camminata rettilinea.
Nella pratica clinica gli stimoli (cues) visivi, uditivi o tattili sono usati principalmente nella modalità open-loop (stimoli ritmici e continui) e solo secondariamente nella modalità closed-loop (stimoli la cui intermittenza è basata sul movimento individuale), a causa della limitata disponibilità di questi ultimi (la maggior parte dei sistemi closed-loop non sono ancora in commercio) e la facilità d’uso dei primi. Solo recentemente sono stati sviluppati dispositivi usando tecnologie indossabili che monitorano la mobilità e possono dare un feedback in tempo reale per migliorare la performance motoria.
Inoltre, i meccanismi che governano la risposta agli stimoli sono ancora poco conosciuti ma c’è evidenza a supporto dell’ipotesi che grazie al cueing ci sia un passaggio da un controllo del movimento automatico ad uno più volontario.
Noi abbiamo di conseguenza ipotizzato che l’utilizzo del closed-loop cueing porterà ad una maggiore attivazione della corteccia prefrontale, un’area del cervello che svolge un ruolo fondamentale nelle funzioni esecutive.
Gli obbiettivi di questo studio sono stati (i) valutare se l’utilizzo di cues possa alleviare i deficits nel turning, (ii) valutare il ruolo della corteccia prefrontale durante il turning con e senza cues.
Lo studio è stato condotto presso l’Oregon Health & Science University (OHSU) a Portland, Oregon, USA dove ho avuto l’opportunità di lavorare per tre mesi a questo progetto all’interno del Balance Disorders Laboratory, nel dipartimento di Neurologia dell’Università.
Per questo studio sono state selezionate ventiquattro persone con malattia di Parkinson idiopatica, 14 senza FoG (FoG-) e 10 con FoG (FoG+), e 8 persone sane.
Ai partecipanti è stato poi spiegato il task da eseguire: girarsi sul posto alternando svolte di 360° a destra e a sinistra nelle situazioni di single-task (ST) e dual-task (DT) e in due condizioni randomizzate: (i) Baseline; (ii) Turning con cue vibro-tattile fornito in closed-loop.
La tecnica della functional Near Infrared Spectroscopy (fNIRS) ha permesso di misurare i cambiamenti nella concentrazione di ossiemoglobina, un indicatore dell’attività della corteccia prefrontale. Otto sensori inerziali hanno invece quantificato la performance motoria durante le svolte. Inoltre, è stata usata una versione uditiva del Continuous Performance Test-AX (AX-CPT) per la situazione di DT.
3 I risultati hano dimostrato che non c’è differenza nell’attività della corteccia prefrontale tra la condizione basale e quella con closed-loop cueing, nonostante la performance del turning migliori significativamente nella seconda condizione. Inoltre, abbiamo trovato che il tempo di reazione (dell’AX-CPT) migliora nella situazione di DT.
E’ stato trovato poi che i soggetti con FoG hanno complessivamente una peggiore performance nel turning rispetto a quelli senza FoG, nella situazione di ST, ma non ci sono differenze significative tra i due gruppi nella situazione di DT.
In conclusione, la performance del turning è migliorata nella condizione di closed-loop cueing rispetto alla baseline, ma l’attività della corteccia è rimasta la stessa.
Questo risultato potrebbe non supportare la nostra ipotesi iniziale che suggeriva un passaggio da un controllo del movimento automatico ad uno più volontario. I miglioramenti nell’esecuzione del turning potrebbero derivare dall’attivazione di altri circuiti cerebrali o altre aree della corteccia, ma a supporto di questa ipotesi sono necessarie indagini più approfondite con un maggior numero di partecipanti.
4 Introduction
Parkinson’s disease (PD) is a neuro-degenerative disorder that mainly affects the motor system, attacking the cells in the brain responsible for the synthesis and release of the neurotrasmitter dopamine1.
It is the second most common age-related degenerative disorder of the central nervous system, after Alzheimer’s disease. It has been estimated that it affects 1-2 per 1000 of the world population. In addition, its prevalence is increasing with age, affecting 1% of the population above 60 years 2.
In PD, the depletion of the neurotrasmitter dopamine is thought to be the main neurochemical abnormality. In the brain, almost 80% dopamine is found in the the dorsal striatum and the substantia nigra pars compacta (SNc), this being the principal sources of dopaminergic neurons.
These midbrain areas are part of the basal ganglia, a group of subcortical nuclei that include both dorsal striatum and ventral striatum, globus pallidus, ventral pallidum, substantia nigra and subthalamic nucleus. In PD, the death of the dopaminergic neurons interferes with the correct functioning of the basal ganglia circuits. The reason for this cell death is poorly understood, but it might involve the build-up of abnormal aggregate of proteins in the neurons called Lewy bodies3.
The basal ganglia are of major importance for normal brain functioning and behaviour, and their dysfunction results in a wide range of neurological conditions including disorders of behaviour control and movement.
The cardinal motor motor symptoms of PD are: tremor, rigidity, and bradikinesia (slowness of movement). In addition, postural instability and gait disturbances are particularly common in PD. Gait disturbances are continuous4, like slow gait, short and shuffling steps. High variability and intermittent movements are also symptoms, such as festination, characterized by rapid shuffling steps and a forward-flexed posture, and Freezing of gait (FoG), an intermittent failure to initiate or maintain walking5. These motor impairments alterate the normal locomotor activities of subjects with PD. Among these activities, turning in everyday life’s environments is one of the most fundamental and most complex motor task6. The ability to modify the locomotor trajectory requires the central nervous system to coordinate body and gaze re-orientation towards the new direction of intended travel, while continuing with the on-going step cycle, and maintaining postural stability by controlling body center of mass in the medial-lateral plane7. In patients with PD, falls due to motor impairments are frequent and it has been estimated that the prevalence is of approximately 13% falling weekly and 70% annually8. Falls during turning are particularly dangerous because they often result in a lateral fall, which leads to an eight-fold increase in hip fractures compared with falls during straight-ahead walking9, 10.
Turning related neural-systems are more likely vulnerable to functional impairments than those associated with straight-ahead gait since turning involves more inter-limb coordination, more coupling between posture and gait, and modification of locomotor patterns requiring frontal lobe cognitive and executive function that play a role in postural transitions11. Turning is therefore more
complex than straight-ahead walking in PD and a large number of studies give evidence of reduced speed6, increased turning duration, increased number of steps12, 13, a narrower base of support14, and impaired segmental coordination of rotation15, 16 . It has been suggested that the slower turning speeds
in people with PD might reflect a compensatory strategy to prevent dynamic postural instability given their narrow base of support6. Furthermore, there is evidence that even subjects with mild PD have
5 slower turns compared to control subjects, despite the fact that their gait is of normal speed and their clinical balance scores fall within normal limits17.
In this scenario, it is important to develop strategies that could improve turning and gait deficits of patients with PD. While there is no definitive cure for PD, treatments are directed at improving the symptoms. The most common is the treatment with levodopa (L-DOPA), a drug which benefit the patients tipically at the early stage of the disease.
L-DOPA is an amino acid naturally produced in the body of humans, precursor of three different neurotrasmitters in the group of catecholamines. One of them is dopamine, the neurotrasmitter largely missing in PD due to the loss of dopaminergic neurons of the SNc. Since dopamine is a molecule too polar it does not cross the blood-brain barrier and a treatment with this molecule would be uneffective. L-DOPA, on the contrary, is able to cross the barrier and for this reason it is used to increase dopamine concentrations in the treatment of PD.
Once L-DOPA has entered the central nervous system, it is converted into dopamine by the enzyme aromatic L-amino acid decarboxylase, also known as DOPA decarboxylase. The treatment with levodopa reduces the symptoms of slowness, stiffness, and tremor and these benefits could last tipically for 3-5 hours (ON period), after which the patient returns in the OFF period characterized by the symptoms described.
In addition, levodopa has been shown18 to improve gait speed and step length but only recently19, 20 the effect of dopamine replacement therapy was in more details assessed on other aspects of gait, such as balance, gait initiation and turning. One study19 suggested that L-DOPA is a double-edged sword for treating mobility dysfunction in people with PD. During the ON period, subjects with PD walk and turn more quickly but became less stable during quiet standing and perhaps turning6. Another side effect of the treatment with L-DOPA is that it become less effective with the progression of PD and its administration could cause the arising of other motor complications, such as dyskinesia21.
In neurological rehabiliation for PD the most common treatment is cueing, the use of external cues or stimuli in order to improve movement initiation and continuation22.
Many reviews suggested that cueing can have an immediate and powerful effect on gait performance in people with PD, indicating improvements in walking speed, step length and step frequency23, 24. Depending on the form of utilized cues, cueing could be visual, auditory or tactile. In addition, the delivery of cues could be in two different modalities: open-loop and closed-loop. In the open-loop modality the stimuli delivered to the subject are independent of the individual motor performance and follow a continuous rhythmic pattern chosen a priori. An example of this modality for each form of cueing (visual, auditory and tactile) could be the use of colored stripes on the floor, the use of auditory stimuli equally spaced in time or the delivery of vibrations to specific locations of the subject’s body. In the closed-loop modality the cues delivery is based on the individual motor performance, providing the biofeedback a posteriori. Examples for this modality could be the use of different light stimuli projected on the floor or different sound heard from headphones as the patient walks at different speeds of gait. In this study a tactile closed-loop cueing device was used in order to deliver vibrations to the right or left wrist whenever the correspondent foot touches the ground. In clinical pratice open-loop is often preferred to closed-open-loop cueing, likely due to limited availability of closed-open-loop systems in the biomedical market or their minor ease of application. Only recently have devices been engineered using wearable technologies to monitor mobility and provide real-time feedback to improve performances. In addition, less is known in literature about the effects of cueing on turning with respect of straight-ahead gait.
6 Here, we hypothesize that closed-loop tactile cueing will improve the turning performance of patients with PD, this hypothesis being consistent with previous studies on cueing and in particular with the recent findings from the Balance Disorders Laboratory (Mancini M. et al.25) where the same cueing device of this study was used both in open- and closed-loop modality. This study showed in fact that cueing has an immediate positive effect on the turning performance of patients with PD.
Despite being a popular treatment for neurological rehabilitation, the underlying mechanisms of cue response are not well understood. Some studies suggest that external cues may shift gait control from automatic to more voluntary conscious control26. If this assumption is correct, as we hypothesize here,
cues may activate attentional goal-directed pathways in the prefrontal cortex (PFC) in order to by-pass sub-cortical deficits and overcome impairments. Hence, further activation would be required in this area of the brain in order to help with internal planning, updating and executing appropriate scaling and timing of gait characteristics for navigation through complex environments 27.
Here, we hypothesized that the improvement in turning performance with cueing would be due to an increase in PFC activity. Therefore, to investigate the role of the PFC in turning with and without cues a functional Near Infrared Spectroscopy (fNIRS) system was used to measure the concentration of oxyhemoglobin (HbO2), a proxy for the activity of the PFC.
7 Methods
Participants
In this study twenty-four participants with idiopathic Parkinson’s Disease (PD) were recruited through the Parkinson’s Center of Oregon Clinic at OHSU. In addition, eight healthy control subjects (CTR) of about the same age as the PD subjects were recruited from the community.
The inclusion criteria for these subjects were: age between 50-90 years and diagnosed with idiopathic PD according to the Brain Bank Criteria and according to the diagnosis of a neurologist. Their scores in the Hoehn & Yahr scale were III or IV. Some of the subjects were freezers (presenting FoG), some of them not. The FoG status was self-reported, based on the results of the New Freezing of Gait Questionnaire (NFoG-Q)28, described in more details in the procedures section.
The main exclusion criteria for the selection of both the PD and CTR subjects were: inability to follow instructions, such as those given by the examiner, presence of factors affecting gait such as hip replacement, musculoskeletal disorders, uncorrected vision or vestibular problems and inability to stand or walk for at least 2 consecutive minutes.
All PD participants were tested in the Balance Disorders Laboratory, at the Department of Neurology of OHSU and all participants gave their written informed consent to a protocol approved by the Institutional Review Board of OHSU. The tests were performed during their “OFF” medication state and after at least 12 hours since the last administration of their usual anti-parkinsonian medications. The length of time for medication washout varies for each individual but 12 hours are considered sufficient to reach the desired state29.
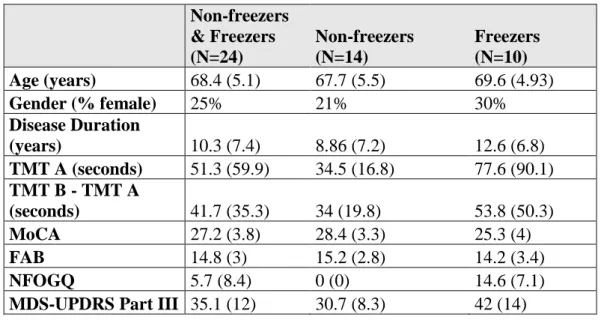
Table 1 shows the results of the clinical tests (mean and standard deviation).
Non-freezers & Freezers (N=24) Non-freezers (N=14) Freezers (N=10) Age (years) 68.4 (5.1) 67.7 (5.5) 69.6 (4.93) Gender (% female) 25% 21% 30% Disease Duration (years) 10.3 (7.4) 8.86 (7.2) 12.6 (6.8) TMT A (seconds) 51.3 (59.9) 34.5 (16.8) 77.6 (90.1) TMT B - TMT A (seconds) 41.7 (35.3) 34 (19.8) 53.8 (50.3) MoCA 27.2 (3.8) 28.4 (3.3) 25.3 (4) FAB 14.8 (3) 15.2 (2.8) 14.2 (3.4) NFOGQ 5.7 (8.4) 0 (0) 14.6 (7.1)
MDS-UPDRS Part III 35.1 (12) 30.7 (8.3) 42 (14)
8 Procedures
Clinical Assessment
In order to assess the disease stage of PD participants the Movement Disorders Society’s Unified Parkinson's Disease Rating Scale (MDS-UPDRS) Part 3 was used30.This is one of the most commonly used scale to evaluate the course of the disease and is composed of four subscales: Part I. Nonmotor experiences of daily living (13 items)
Part II. Motor experiences of daily living (13 items)
Part III. Motor examination (18 items) - Only this subscale has been used here Part IV. Motor complications (6 items)
Each subscale has 0-4 ratings, where 0 = normal, 1 = slight, 2 = mild, 3 = moderate, and 4 = severe. The Part III of this scale evaluates motor features such as fluency of speech, rigidity of body joints, bradykinesia, tremor and balance. As shown in figure, also an assessment of Freezing of Gait (FoG) during gait is performed as part of the motor examination.
In addition to this FoG assessment, FoG status was also evaluated with the New Freezing of Gait Questionnaire (NFoG-Q), a reliable tool to detect and evaluate the impact and severity of FOG28. As Shine and colleagues31 have pointed out “NFoG-Q is a clinician-administered tool that aims to assess
both the clinical aspects of FOG as well as its subsequent impairments on quality of life”.
In order to give an example of what the questionnaire is like, in the third question the participants were asked: “Do you feel that your feet get glued to the floor while walking, making a turn or when
trying to initiate walking?”.
The results of this clinical scale cathegorized the PD participants in two subgroups: 1. Freezers, PD+FoG, if they obtained a score > 0
2. Non-freezers, PD-FoG, based on a score = 0
A series of cognitive tests were then performed, such as the Frontal Assessment Battery (FAB), the Montreal Cognitive Assessment test (MoCA) and the Trail Making Test (TMT).
The Frontal Assessment Battery (FAB) is usually administered in order to assess frontal lobe dysfunction32. It is composed of a total of six subtests exploring different features:
1. Conceptualization – 3 points 2. Mental flexibility– 3 points 3. Motor programming– 3 points 4. Sensitivity to interference– 3 points 5. Inhibitory control– 3 points
6. Environmental autonomy– 3 points
For example, in the first subtest assessing the conceptualization the subject is asked in what they are alike two different objects such as:
• A banana and a orange – 1 point • A table and a chair – 1 point
9 Total score is from a maximum of 18, when 3 points are assigned to all the 6 subtests. Higher scores indicate a better performance and correlate with a better frontal lobe functioning.
The Montreal Cognitive Assessment test (MoCA) is widely used for the detection of mild cognitive impairment (MCI), a clinical state that often progresses to dementia33.
The subtests of the MoCA test assess several cognitive domains: 1. The short-term memory - 5 points
2. Visuospatial abilities – 4 points
3. Executive functions – 4 points
4. Attention, concentration, and working memory – 5 points
5. Language – 5 points
6. Orientation with respect of time and place – 6 points
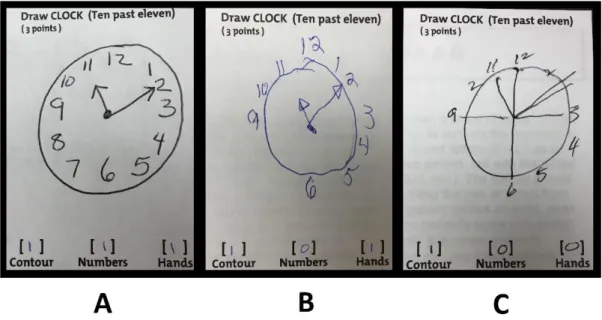
For example, in second part of the test assessing the visuospatial abilities the subject is first asked to perform a clock-drawing task (3 points) in which a rounded clock with two hands showing the time 2.30 has to be drawn. Then the subject is asked to copy a three-dimensional cube (1 point).
In Figure 1 is shown an example of the first part of this subtest (clock-drawing task) performed by a control subject (A - 3 points), a PD subject with mild cognitive impairment (B - 2 points) and a PD subject with dementia (C - 1 point).
Figure 1 – An example of the Clock-Drawing Task, a subtest of the Trail Making Test, performed by v a CTR subject (A - 3 points), a PD subject with mild cognitive impairment (B – 2 points)
. and a PD subject with dementia (C - 1 point).
10 The Trail Making Test (TMT) is a neuropsychological test used to assess impairments in the brain34. The nature of the test gives insights about abilities such as visual attention and task switching. The TMT is subdivided in trail A and trail B:
A. 25 circles with numbers (1-25) are distributed over a sheet of paper and the subject has to draw lines to connect the numbers in ascending order
B. 25 circles with numbers and letters (A-L , 1-13) are distributed over a sheet of paper and the subject has to draw lines to connect them in ascending order, paying attention to alternate between number and letters (1-A-2-B-3-C…).
The score of the test is calculated as the number of seconds required to perform the test. Higher scores correlate with greater impairments in the brain. It has to be considered impaired a subject with scores greater than 78 seconds in the trail A and greater than 273 seconds in trail B.
Turning task protocol
Participants were instructed by the examiner to perform a 2-minute turning-in-place task at self-selected pace. The task was subdivided in different subtasks as follows:
1. 20 seconds of quiet standing before turning
2. 80 seconds of turning in place alternating a turn of 360° on the right and a turn of 360° on the left
3. 20 seconds of quiet standing after turning
The examiner, with loud voice, inform the subject when to start or to stop turning.
Though it will be explained in more detail in the data analysis section, it is nonetheless important to briefly explain why 20 seconds before and after the test are included in the protocol. The main reason for this choice is that the level of HbO2 in the investigated area of the brain during turning is chosen
to be reported as a relative measure. This choice is frequently done is previous fNIRS studies35. In particular, during turning, HbO2 changes with respect to the standing still condition are calculated.
This allows to assess changes related directly to the turning in place.
Another reason for standing still a certain amount of time before turning is that this eliminates changes in HbO2 level related to other tasks previously performed.
Conditions & Equipment
The 360° turning task performed by PD subjects was assessed in three different, randomized, conditions:
1. Baseline (no cues)
2. Turning with Closed-Loop cueing (tactile cues synchronized with each step) 3. Turning with Open-Loop cueing (metronome-like vibration)
The assessment order of the conditions of turning with Biofeedback was randomized across subject, whilst the Baseline Turning condition was always assessed first.
However, since the main objective of this study is to investigate the effects of closed-loop cueing, only the baseline and Closed-Loop conditions are considered from now on.
In addition, for each condition both Single Task (ST) and Dual Task (DT) have been assessed in the two groups (PD and CTR).
11
Single Task
Condition 1: Baseline Turning (No Cues)
In this condition the subjects were equipped with two different systems during the assessment of the 360° turning task:
1. Functional Near Infrared Spectroscopy (fNIRS) system 2. Inertial Measurement Unit (IMU) system
Condition 2: Turning with Closed-Loop Biofeedback (Vibrotactile Cues)
In this condition the subjects were equipped with three different systems during the assessment of the 360° turning task:
1. Functional Near Infrared Spectroscopy (fNIRS) system 2. Inertial Measurement Unit (IMU) system
3. Biofeedback system in closed-loop mode (Vibrotactile Cues)
fNIRS system
A wireless continuous wave fNIRS system (OctaMon, Artinis Medical Systems, Elst, The Netherlands) was used to assess the activity of the prefrontal cortex (PFC) of subjects with and without PD.
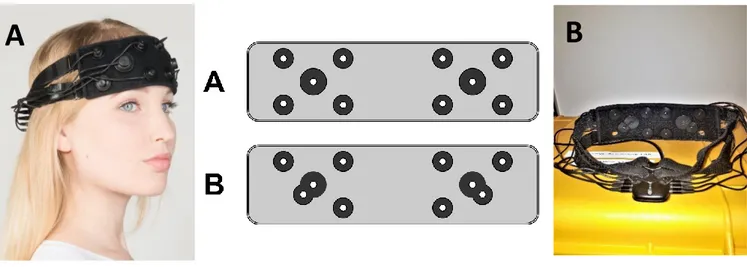
The OctaMon is a device composed by a headband with two light detectors and eight light emitters (wavelengths 760 and 850nm) positioned over the forehead of the participants. In order to measure PFC activity the headband was placed in the standard 10-20 EEG placement (i.e. a height of 15% of the distance from nasion to inion and at 7% of the head circumference from left and right)36.
The system is equipped with a Bluetooth device that enables the communication with a PC where the Oxysoft software (Artinis proprietary NIRS recording and analysis software) preprocesses the NIRS signal by converting the changes in optical densities in changes in cerebral Oxygenated (HbO2) and
Deoxygenated (HHb) hemoglobin37 .
Distance from transmitter to detector was 3.5cm38 and data was collected and processed in line with
previous studies39, 40. Additionally, two short-separation reference channels (1.5cm; left and right PFC) were used to remove peripheral interference (i.e. blood flow in extra-cerebral layers) in other channels.
Figure 2 schematically shows the placement of the emitter-detector pairs on the headband.
With regard of the long-separation channels a distance of 3.5 cm is considered to allow the infrared light to penetrate 1.75 cm into the skull. This depth is enough to reach the prefrontal cortex in order to give information about the neuronal activity in this area35.
In fact, the scalp and skull have a thickness of around 1.5cm in human adults, so a distance of 3 cm would be sufficient to reach the brain.
However, as Cagnon and colleagues have pointed out fNIRS signals can be significantly contaminated with global interference arising from superficial layers of the scalp, as the back-reflection measurement of fNIRS makes it more sensitive to the superficial layers41. This interference can be due to artifact caused by breathing, cardiac cycle, vasomotor or other error related to movement42.
Short emitter–detector separation channels is most sensitive to the superficial layers, and reflects less the neuronal activity-related signals43, 44.
12 Signals recorded from short emitter-detector separation channels can therefore be used in order to eliminate or reduce this superficial interference, as it will be described in more details in the part regarding the data analysis.
In order to further eliminate any possible source of the interference, the brightness of the light from the illumination system in the Laboratory was attenuated.
The sampling frequency of the fNIRS system was set to 50 Hz.
In addition, the fNIRS system provides the possibility of recording a digital signal which is resulting from the press of a button (from an external device) and is synchronized with the acquisition from the probes on the headband.
This signal is used in order to have an indication of when the different stages of the task begin. The protocol for the assessment of the turning task is composed, as described earlier, of three different stages: standing (20s), 360° turning (80s) and standing (20s).
In this protocol three button presses should be performed by the examiner: the first one at the beginning of the task (BEGINNING), the second one at the start of the turning (START) and the last one at the end of the turning (END). This part of the protocol will be useful, as will be later described in more details, in the analysis of the data.
In order to perform a more accurate off-line analysis of the collected data, videos of the tasks in each condition are recorded with an Apple IPad.
In addition, a 3-dimensional digitizer (PATRIOT, Polhemus, VT, USA) provided locations for PFC regions relative to fNIRS channel scalp position. Digitized data was entered into NIRS-statistical package metric mapping (NIRS-SPM, http://www.nitrc.org/projects/nirs_spm)45, which was implemented within MATLAB 2017a (Mathworks, MA, USA). NIRS-SPM allowed registration of fNIRS channel data onto the Montreal Neurological Institute (MNI) standard brain space46, described in detail elsewhere47. HbO2 changes were recorded bilaterally (left and right) within the PFC.
Brodmann areas (BA) that corresponded to the PFC consisted of BA9 and BA10 for all participants.
Figure 2 – Design of the head band before the short-channel modification (A) and after the modification (B)
13
Wearable sensors system
We used eight OPAL (APDM, Inc, Portland, USA), inertial measurement units (IMU) to record turning with triaxial accelerometers, gyroscopes and magnetometers, wirelessly synchronized and the MobilityLab software was used to collect data while custom-made algorithms were used to process the data in Matlab. The fNIRS system and the IMUs were synchronized through the Artinis PortaSync.
The tecnical specifications of the sensors are described in Figure 3.
Figure 3 – Technical specifications of OPAL sensors
The eight OPAL sensors were located respectively on the sternum and pelvis and on both the wrists, shanks and feet of the participants. Figure 4 is showing the experimental set-up in one of the participants.
14
Biofeedback system
A prototype system, described in Harrington and colleagues48 was used in order to deliver closed-loop cues to the subjects.
This system, denominated VibroGait, acts as a metronome in the open-loop mode, sending regular vibrations (one every 750 ms) to the top of the left and right wrist.
Viceversa, in the closed-loop mode it acts as a phase-dependent vibrotactile-biofeedback system, sending vibrations to the left or right wrist whenever the foot on the same side is on the ground. Two of these systems were used, one for the left and one for the right foot and wrist.
The system is composed of a Controller Unit (CU) and a Tactor Unit (TU).
Figure 5 shows a subject wearing a VibroGait system and the locations of the CU and TU.
The CU is enclosed in a small box that can be worn comfortably either on the foot or on the leg just above the ankle. There are two main components: an Arduino compatible microcontroller (ATMega32u4, Atmel) and its own Lithium polymer battery pack. The microcontroller receives data from a 3-axis gyroscope. The controller unit can operate in one of two modes: closed-loop (vibrotactile cues) and open-loop (metronome). In the closed-loop mode, it uses readings from the gyroscope to detect when the user is in the stance phase of gait and vibrates the tactor on the wrist. In open-loop mode, it ignores the readings from the gyroscope and simply vibrates the tactor on the wrist every 750ms.
All firmware for the unit is written in C/C++ and utilizes several Arduino open-source libraries. The firmware allows for the customization of vibration amplitude, vibration frequency, angular velocity threshold, and start/stop delays.
The TU is basically the C-2 tactor sold by EAI (Engineering Acustics Inc., Casselberry, Florida). The tactor is a miniature vibrotactile transducer that has been optimized to give a strong localized vibration in any preferred area of the body. The vibration intensity is similar to that of a cell phone operating in vibration mode. This tactor device has been used in a variety of applications in the past, and has similar characteristics to the ones used for similar studies49. For this application, the tactor unit was applied to both the wrists and the control unit to both the feet of the subject.
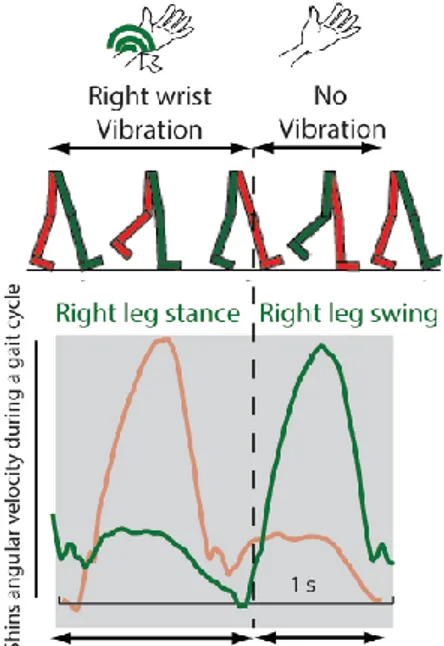
Figure 6 shows a scheme of the device functioning in open- and closed-loop mode and Figure 7 shows the signal of angular velocity of the right (green) and left (red) shins: whenever there is a swing of the right foot, the left foot is in the stance phase of gait and a vibration is send to the left wrist, and viceversa.
15
Figure 5 – Location of Tactor Unit . (TU) and Control Unit (CU)
Figure 6 – Diagram explaining the functioning of the VibroGait system in the open- and closed-loop mode
Figure 7 – Angular velocity of the right (green) and left (red) shins
16
Dual-Task
Every turning condition described in the previous sections was assessed for each subject two times, once with a concurrent cognitive task (DT) and once without it (ST).
In addition, a Seated Condition was assessed where the participants were asked to remain seated on a chair while performing the concurrent cognitive task.
Since seating is not to be considered as an highly cognitive demanding task per se, comparing to standing and turning, this last condition in practice requires to perform only a single cognitive task and can be considered a condition of ST. This hypothetically allows to quantify the cortical activation only related to this cognitive task. The Seated Condition was assessed in both PD and CTR groups. For this study, the chosen secondary task performed by subjects while turning was an auditory version of the Continuous Performance Test-AX (AX-CPT).
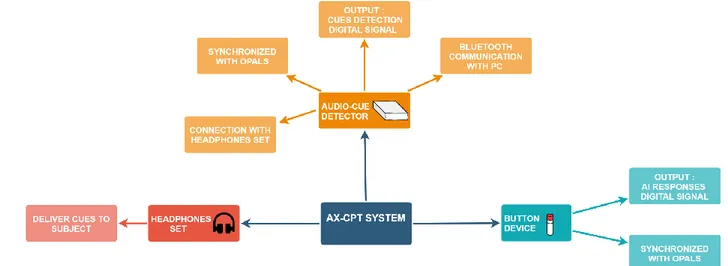
This test is commonly used in order to evaluate the cognitive control abilities of individuals, features thought to be stemming from the prefrontal cortex. As it will be discussed later in more details, the use of this test could lead to a better understanding of the implications of cortical circuits on the execution of the turning task. With respect to other tests used in recent studies25, such as the serial subtractions, this one has the advantage that participants don't have to talk. Talking and contracting facial muscles requires infact extra blood and this could influence the signal recorded from the PFC. In the AX-CPT used in this study the subject can hear from a headphones set an audio file where a series of auditory stimuli or cues (letters) are recorded. At regular intervals of 1.5 seconds a letter is read to the subject by the recorded voice. In addition to the headphones set, a device with a button (Button Device) is given to the participant to be hold in his dominant hand. He is instructed before the beginning of the task to press the button as fast as possible if he hears the sequence of letters A-I . For any other sequence of letters, such as A-Y or B-I, the subject is instructed to do nothing. How the scores of this test are calculated is explained in more detail in the Data Analysis section.
AX-CPT system
The system for this task is composed of an Audio-Cue Detector device, an headphones set and a Button Device. In Figure 8 is shown a scheme of the system.
17 The Button Device held in the dominant hand is connected with a cable to the closest OPAL sensor on the wrist. This sensor, in addition to the wirst’s movements, samples at a frequency of 128 Hz the output analog signal from the Button Device: the resulting output is a digital signal with an HIGH (1) level if the button is pressed (should happen whenever an A-I sequence of letters in presented), a LOW (0) level otherwise.
It is important to say that this digital signal (button_signal) is synchronized with the signals from the IMUs, since it is recorded by the OPAL sensor.
The Audio-Cue Detector is a portable device positioned at the lumbar level on the bottom of the back of the subjects, so that they can turn without any sort of problem. It is connected with Bluetooth to a computer for communication and with a cable to the OPAL sensor also positioned at the lumbar level of the subject. This device is where the audio file containing the AX-CPT recording is stored and an AUX connector allows the connection of the headphones set. As the name suggests, this device also detects cues from the audio file. The analog output is at an HIGH level when a letter is detected, LOW level otherwise. In order to do so a threshold-algorithm is implemented in the hardware, detecting when the signal of the recorded audio is over a certain voltage level and setting the output to HIGH if so. This analog signal is then sampled by the OPAL sensor at a frequency of 128 Hz. As before, the resulting output is a digital signal with an HIGH (1) level if a letter is detected, a LOW (0) level otherwise. This will be useful for the calculation of the test scores as it will be described, so it is stored in the computer.
As before, this digital signal (detected_cues_signal) is synchronized with the signals from the IMUs sensors, since it is recorded by the OPAL sensor.
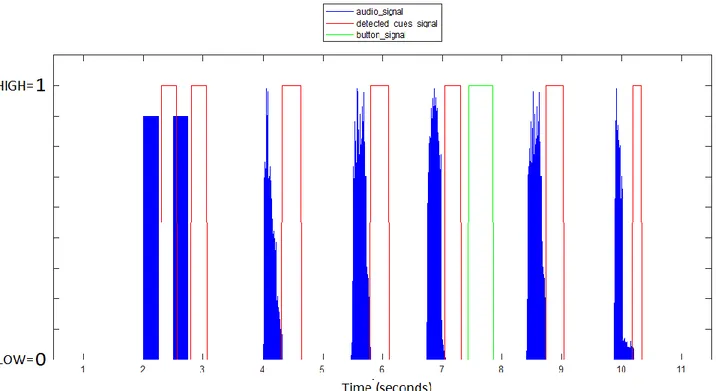
In addition to the AX-CPT audio cues (letters), at the beginning and at the end of the audio file there are two beeps separated by intervals of approximately 500 milliseconds. These are correctly detected by the Audio-Cue Detector and are useful in order to realign the signal from the audio (audio_signal) file with the digital signal of the detected cues. These two are infact not aligned because of a latency introduced by the electronic circuits of the AudioCue Detector that elaborate the signal. The advantage of the realignment is that afterward it is possible to see if all the cues are correctly detected. Figure 9 shows the signals described before the process of realignment.
18
Data Analysis & Features Extraction
After the data collection, an analysis of the acquired data was performed in order to extract the most important features for the assessment of the 360° turning task in each condition.
All the algorithms and procedures are written in Matlab (R2018b, version 9.5.0).
The data analysis can be subdived in three parts, a different one for each system involved in the study: fNIRS, Wearable sensors and AX-CPT analysis.
fNIRS analysis
The relevant data for this analysis were collected using the fNIRS system previously described. The short-separation channel techinque described previously is here used in order to remove the artifacts. The Oxysoft software (Artinis) was used for data collection and for preprocessing the signals acquired with the fNIRS system. The preprocessing consisted in the calculation of the concentration changes of oxygenated hemoglobin HbO2 and deoxygenated hemoglobin HHb in the targeted prefrontal cortex
(PFC). This is done by calculating the changes in detected light intensity (wavelength of 760 nm for HHb and 850 nm for HbO2 ) using the modified Lambert-Beer Law50.
The primary outcome measure was the change in HbO2 while turning relative to standing, a good
proxy for PFC activation due to its sensitivity to walking-related changes in cortical activity51. The resulting data, converted from .oxy3 (Oxysoft Data File) to .mat (Matlab Data File), are :
1. Six signals of oxygenated hemoglobin (RIGHT probe : 1-3 , LEFT probe : 4-6) stemming from the long-separation channels (PFC activity)
name – oxy_long_1 – oxy_long_6
Source – long-separation channels Sample Frequency - 50 Hz
Format type - Matlab Data File Extension - .mat
2. Six signals of deoxygenated hemoglobin (RIGHT probe : 1-3 , LEFT probe : 4-6) stemming from the long-separation channels (PFC activity)
name – deoxy_long_1 – deoxy_long_6
Source – long-separation channels Sample Frequency - 50 Hz
Format type - Matlab Data File Extension - .mat
3. Two signals of oxygenated hemoglobin (RIGHT probe, LEFT probe) stemming from the short-separation channels (PFC activity)
name – oxy_short_right , oxy_short_left
Source – short-separation channels Sample Frequency - 50 Hz
Format type - Matlab Data File Extension - .mat
19 4. Two signals of deoxygenated hemoglobin (RIGHT probe, LEFT probe) stemming from the
short-separation channels (PFC activity)
name – deoxy_short_right , deoxy_short_left
Source – short-separation channels Sample Frequency - 50 Hz
Format type - Matlab Data File Extension - .mat
5. Button signal with the information about different parts of the task name – button_fnirs
Source – Button Device of the fNIRS system Sample Frequency - 50 Hz
Format type - Matlab Data File Extension - .mat
In order to better understand the methods used, from now on the signals from the right probe oxy_long_1 – oxy_long_3 , deoxy_long_1 – deoxy_long_3 and oxy_short_right, deoxy_short_right will be considered. The same analysis applies to those stemming from the left probe.
The algorithm developed in order to process the fNIRS data is based on the following steps:
1. Baseline correction: Calculate signals of HbO2 and HHb changes relative to 360° turning with respect of standing task
• Find time intervals of the different subtasks.
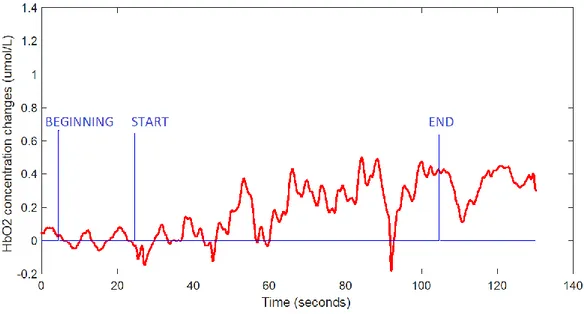
The 360° turning task is subdivided in three subtasks (standing – 20s , 360° turning – 80s , standing – 20s) and this information is provided by the button_fnirs signal. Three presses are performed (BEGINNING, START, END) so two intervals are defined. The first interval (Baseline) represents the first 20s of standing from the beginning of the acquisition (BEGINNING) to the start of the turning (START), the second (Turning) represent the 80s of the turning task and goes from the START point to the end of turning (END). In Figure 10 are shown these intervals.
• For every fNIRS signal, calculate the mean in the BEGINNING-START interval (Baseline) and subtract it from the signal (obtaining the signals zeroed_oxy_long1 - zeroed_oxy_long3 and zeroed_deoxy_long1 - zeroed_deoxy_long3 and
zeroed_oxy_short_right) . This step may be useful to determine the changes in HbO2
and HHb relative to the 360° turning with respect to standing. In figure is shown the result of one of those signals. The calculated mean is in fact considered as a proxy for avarage activation of the PFC in the investigated area during the standing condition.
20 This subraction is reasonable if an underling hypothesis is assumed too: that the
activation of the PFC during the turning is approximately the same of that during standing, with an increment in activation due to the 360° turning itself.
2. Noise reduction: calculate the Scaling Factor (SF) and rescale the signals.
As pointed out before, the signal stemming from the short separation channel provides information about the superficial components that interfere with the signal from the prefrontal cortex. In order to reduce these interferences from the signal, simply subtracting the short separation channel signal from the long separation one is probably not the good way to correct. The reason is that the superficial component is smaller in the latter than in the former channel. If you simply subtract, you introduce a negative superficial component. The correct way to proceed is to scale the signal from the short separation channel before the subtraction. Different techinques have been proposed in literature in order to calculate the Scaling Factor43, 44. Here, a modified version of the technique used by Valeria Belluscio et al. to analyze the
data has been used:
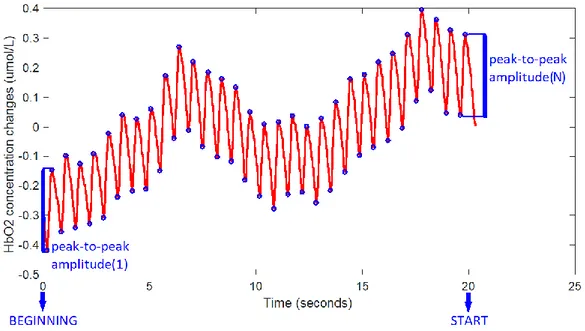
• Calculate the mean peak-to-peak amplitude of the signal zeroed_oxy_long1 in the interval from BEGINNING to START with the formula (see also Figure 11) :
meanHB_long = mean( peak-to-peak amplitude(1), ..., peak-to-peak amplitude(N) )
Any other signal stemming from a long-separation channel of right probe could have been used. The main source of interference for this signal is the hearth-beat, which can be recognized visually from a plot of the signal.
Figure 10 – HbO2 concentration changes and button_fnirs signal, where the BEGININNG,
21 For this reason, the hearth-beat has been chosen in order to find the Scaling Factor and the peak detection algorithm is implemented in order to calculate the peak-to-peak amplitude of the heart-beat.
As mentioned before, other source of interference can affect the signals such as breathing or movement artifacts, but these have minor effects.
• Calculate the mean peak-to-peak amplitude (meanHB_long, calculated with the same formula as before) of the signal zeroed_oxy_short_right in the interval from
BEGINNING to START.
Considerations similar to those made for the previous signal are valid for this one.
• Calculate the Scaling Factor.
The SF has been considered to be the same for both oxy and deoxy signals. It has been calculated with the formula:
𝐒𝐅 = 𝐦𝐞𝐚𝐧𝐇𝐁_𝐥𝐨𝐧𝐠 𝐦𝐞𝐚𝐧𝐇𝐁_𝐬𝐡𝐨𝐫𝐭
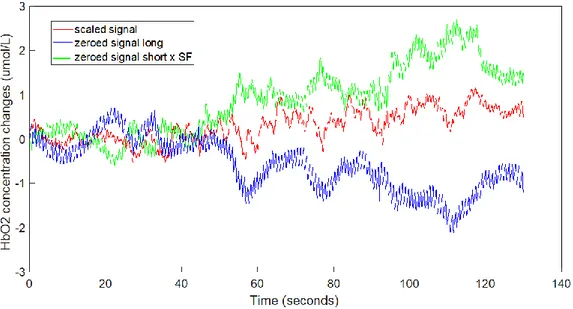
• Rescale the signals.
With the aim of removing part of the interferences, every signal from the long-separation channels of the right probe (oxy and deoxy) has been rescaled with the formula (see also Figure 12) :
scaled signal = zeroed signal long – (zeroed signal short x SF)
22 3. Data filtering, visual signal inspection and feature extraction
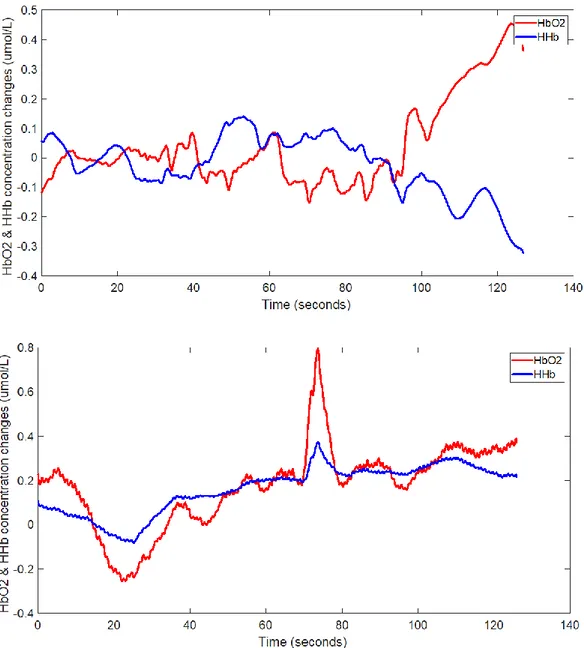
• A low-pass filter with a cut-off frequency of 0.14 Hz has been used to remove high-frequency noise from the scaled signals52. The hemodynamic response function is infact a slowly changing signal with most of its components at frequencies under 0.14 Hz. • A plot of the mean signal of all the long-separation channel signals scaled and filtered was
performed in order to visually examine them. If the fNIRS signal are correctly collected the mean signal shows a divergence between the HbO2 and HHb trends. If this doesn’t
happen, it means that the signals are too noisy. Therefore, it has been excluded from the study every condition with a resulting fNIRS mean signal which shows lack of divergence. In the figures below are shown the trends of the HbO2 and HHb changes in two cases: one
where there is divergence and one where the signal is too noisy and therefore it has to be excluded from the study. In Figure 13 are shown two signals: in the first one there is divergence between the HbO2 and HHb, whereas in the second one the signal is too noisy
and therefore it has to be excluded from the study.
23 • The main features extracted are:
1. Mean HbO2 signal: the mean signal is found from all the long-separation channel signals. The mean of this new signal is then calculated in two intervals: mean in the baseline interval (BEGINNING – START) and mean in the turning interval (START – END). The former is then subtracted from the latter.
Figure 13 – In the first plot there is divergence between the HbO2 and HHb, whereas in
the second plot the signal is too noisy and therefore it has to be excluded from the study.
24 2. Median HbO2 signal: the median signal is found from all the long-separation channel signals. The median of this new signal is then calculated in two intervals: median in the Baseline interval (BEGINNING – START) and median in the turning interval (START – END). The former is then subtracted from the latter.
3. Median HbO2 signal early: calculated as before but referring to the early part of the turning with the second interval defined as (START – END/2).
4. Median HbO2 signal late: calculated as before but referring to the late part of the turning with the second interval defined as (START+END/2 – END).
Wearable sensors analysis
This analysis involved some of the signals from the triaxial accelerometers, gyroscopes and magnetometers from the eight OPAL sensors in the Wearable sensors system. These sensors were located respectively on the sternum and pelvis and on both the wrists, shanks and feet of the participants.
The relevant data for this analysis are:
name – acceleration along the X,Y,Z-axis
angular velocity around the X,Y,Z-axis
intensity of magnetic field along the X,Y,Z-axis
Source - OPAL sensors on on the sternum, pelvis, right and left wrists, right and left shanks and right and left feet
Sample Frequency - 128 Hz
Format type - Hierarchical Data Format (HDF) Extension - .h5
The signals were processed so that the 3D acceleration was measured in 𝑚/𝑠2, the angular velocity in degree/s, and intensity of the magnetic field in Gauss.
Considering the gyroscope positioned on the lower back, this sensor is placed in order that the X axis is facing the floor (see Figure 14). The signal of angular velocity has therefore positive values if there is a counter clock wise rotation (turning to the right) and negative values if there is a counter clockwise (turning to the left). This signal is the medio-lateral angular velocity sensed at the lower back (see Figure 15). Similar consideration can be done for the other OPAL sensors used in the study.
25 The main features and the algorithms developed in order to exctract them are:
1. Total turns: Total number of turns. : Using the data from the magnetometer positioned on the lower back two arrays with the events of beginning and end of each turn are calculated (start_turns and end_turns). The length of these array is the same and corresponds to the total number of turns (see Figure 15).
Figure 14 – OPAL sensor with reference axis and its location on the back of participants at the pelvis level
Figure 15 – Signal of medio-lateral angular velocity sensed at the lower backl of a CTR subject in the
26 2. Average duration of turn: For every turn, the elements of the start_turns are subtracted from the corrisponding elements of end_turns obtaining an array with the duration of every turn. Then the mean is calculated in order to obtain the average duration of turn.
3. Average peak speed: For every turn, the signal of medio-lateral angular velocity sensed at the pelvis-level is considered in the interval between the start and the end of the turn. The absolute value is then calculated and finally the maximum value (peak speed) is found for each turn. Then the mean of the peak speeds is calculated.
4. Average jerk: For every turn, the signal of medio-lateral acceleration sensed sensed at the lower back is considered in the interval between the start and the end of the turn. The jerkiness, which is the derivative of the acceleration signal, is then calculated for each turn with numerical methods. Then the mean of all the jerkiness values is calculated.
5. Mean FoG ratio: The signals of antero-posterior acceleration sensed on the right and left shanks are resampled with frequency 50 Hz. The the algorithm performs the following operation on each signal:
• Calculate Power Spectral Density (PSD) estimate via Welch's method using the Matlab bult-in function pwelch.
This divides each column of into sections of 100 samples (2 seconds of acquisition), and uses a Hamming window of the same length. The overlap of each window is 50%. The number of Fast Fourier Transform (FFT) points used to calculate the PSD estimate is set to 500. The signals PSD_right and PSD_left are obtained.
• These signals are then normalized with respect of the total power of the signal, calculated as the sum of samples of the signal itself:
𝑛𝑜𝑟𝑚𝑎𝑙𝑖𝑧𝑒𝑑 𝑃𝑆𝐷 = 𝑃𝑆𝐷 𝑠𝑢𝑚(𝑃𝑆𝐷)
• Three different frequencies are defined: Ultra Low Frequency (ULF – 0.5 Hz), Low Frequency (LF – 3 Hz) and High Frequency ( HF – 8 Hz).
The normalized PSD are then subdivided in two bands (Moore ST et al., 2008): one with frequencies going from the ULF to the LF (locomotor band - norm_PSD_locomotor) and one with frequencies going from LF to HF (freeze band - norm_PSD_freeze).
Then the ratio is calculated from the second power of the total power of the two signals:
𝐹𝑜𝐺 𝑟𝑎𝑡𝑖𝑜 = [𝑠𝑢𝑚(𝑛𝑜𝑟𝑚_𝑃𝑆𝐷_𝑓𝑟𝑒𝑒𝑧𝑒)]
2
[𝑠𝑢𝑚(𝑛𝑜𝑟𝑚_𝑃𝑆𝐷_𝑙𝑜𝑐𝑜𝑚𝑜𝑡𝑜𝑟)]2
Since two different PSD were calculated for the right and left shank, PSD_right and PSD_left, the mean of the FoGratio_left and FoGratio_right is calculated in order to have just one parameter of FoG ratio.
This ratio, first proposed by Mancini and colleagues53, is significantly larger in freezers than in non-freezers or control subjects. As their work demonstrated, it better differentiates gait disorders between PD subjects with and without FoG than traditional gait measures such as stride length, stride velocity and double support time.
27
AX-CPT analysis
The relevant data for this analysis were collected using the AX-CPT system previously described and are:
1. The signal of the button presses.
2. The .mat file obtained from the .wav audio file with the Matlab built-in function audioread() 3. The cues detected by the AudioCue Detector from the audio file for the AX-CPT.
The algorithm developed in order to process the AX-CPT data is based on the following steps: 1. Find cues and button presses
• Find cues in audio_signal .
A threshold algorithm was implemented to find the starting time of every cue present in the audio file signal. These are stored in the audio_cues_start array. The starting times of the two beeps at the beginning and at the end are also in this array, toghether with the starting times of the letter cues.
• Find cues in the detected_cues_signal .
Whenever this digital signal goes from 0 to 1, the starting time of a cue is detected. These are stored in the detected_cues_start array (see Figure 17). Sometimes the AudioCue Detector doesn’t work propely and one or more 0s (no cue) are present instead of 1s. This problem has been easy to solve because the wrong sequences have a few 0s surrounded by many 1s. For example: 1111111111111100111111111111111111111
So if the algorithm detects only a few 0s (<13, corresponding to 100 ms) , it will consider them not as 0s but as 1s.
• Find button presses in the button_signal .
Whenever this digital signal goes from 0 to 1, the starting time of a button press is detected. These are stored in the button_start array.
The same solution as before has been adopted when the Button Device doesn’t work properly.
2. Realignment of audio_signal and detected_cue_signal
• Find starting times of beeps in the audio_cues_startarray.
This is simpy done by looking at the first and last two cues detected, which correspond to the beeps. The starting times of these are stored in the beep_audio_start array.
• Find starting times of beeps in the detected_cues_signal.
Unfortunately, now always the first two cues detected correspond to the first two beeps, so another techinque has been used. The beeps are separated by a time interval of 500 ms, while the interval is of 1500 ms for letter cues. The algorithm searches for all the sequence of 1s corresponding to 500 ms with a tolerance of ms (500 ± 8 ms).
The starting times of every beep are stored in the beep_detected_start array. • Calculate latency between audio_signal and detected_cues_signal.
As said before, a latency is introduced from the AudioCue Detector.
The detected_cues_signal is therefore delayed with respect to the audio_signal. In order to calculate this delay (mean_latency) the starting times of the first two beeps have been considered.
28 The formula is:
latency_beep1= beep_detected_start(1) – beep_audio_start (1)
latency_beep2= beep_detected_start(2) – beep_audio_start (2)
mean_latency= mean(latency_beep1, latency_beep2)
If the difference between latency_beep1 and latency_beep2 is above a certain threshold (8 ms), an error message is shown.
• Shift the audio_signal of an amount of time equal to mean_latency in order to visually see if the cues in the detected_cues_signal are correctly detected. In Figure 18 are shown the signals before and after the realignment.
29
Figure 18 – Signals from the AX-CPT system before and after the realigment
30 3. Calculate Reaction Times (RT)
• For every cue, find RT_interval.
When the subject hears a cue he has limited time to press the button. Remembering that he has to respond to the ‘A-I’ sequence, if for example the sequence ‘A-I-E’ is presented, he has to press the button after hearing the ‘I’. In addition, he has to do that before hearing the ‘E’. This way an interval is defined (RT_interval) in which the press has to be made. For the current letter cue, one might think that this interval could be calculated as the difference between the start of the next cue and the start of the current one (both contained in the array detected_cues_start ). However, in pratice the subject cannot press the button right after the start of the cue.
Infact it is reasonable to say that the letter cue cannot be heard by the subject until almost the whole letter is read by the recorded voice (reading a letter on average takes 200 ms, so 200ms after the start of the cue or in other words at the end of the cue).
So he cannot respond to the current cue before hearing the whole cue, but also he has time to respond to it before the whole next cue is heard.
Because of these reasons, for each cue the RT_interval begins 200 ms after the start of the cue and end 200 ms after the start of the next cue (see Figure 19).
• Calculate RT and other features.
If, in the RT_interval, there is a button press (button_signal goes HIGH) calculate the RT as the time intercurring between the press and the start of the interval.
Three different RTs arrays are calculated, based on the sequence corresponding to the button press.
1. Reaction time AI: Reaction Time for a correct press after ‘A-I’ sequence. 2. Mean reaction time AI : mean of RT_AI
3. Reaction time AY : Reaction Time for an uncorrect press after a ‘A-Y’ sequence, where ‘Y’ stands for any letter which is not an ‘I’
4. Mean reaction time AY : mean of RT_AY
5. Reaction time BI: Reaction Time for an uncorrect press after a ‘B-I’ sequence, where ‘B’ stands for any letter which is not an ‘A’
6. Mean reaction time BI : mean of RT_BI
In addition, the accuracy of the correct presses is calculated.
7. Accuracy AI : The Accuracy of correct presses (after ‘A-I’ sequences) is calculated as:
𝑨𝑪𝑪_𝑨𝑰 = 𝒏𝒖𝒎𝒃𝒆𝒓 𝒐𝒇 𝒄𝒐𝒓𝒓𝒆𝒄𝒕 𝒑𝒓𝒆𝒔𝒔𝒆𝒔 𝒏𝒖𝒎𝒃𝒆𝒓 𝒐𝒇 𝒕𝒐𝒕𝒂𝒍 𝒑𝒓𝒆𝒔𝒔𝒆𝒔
31
Statistical analysis
Since the number of participants in the CTR group was limited to eight, the choice has been made not to consider them in the statistical analysis. However, as it will be shown in the results section, a more qualitative comparison between the data of the CTR and PD group has been made.
The only conditions assessed for the CTR group were the Turning condition (no cues) and the Seated Cognitive.
Therefore, the statistical analysis that is here described is referred only to the PD group.
Of all the calculated variables that have been described in the data analysis section, only those considered most significant for this study have been selected for the statistical analysis. Our primary outcome measure was the Median HbO2, for what concern the fNIRS data. Of all the variables extracted with the IMU system those have been chosen: Total turns, Average duration of turn, Average peak speed, Average jerk, Mean FoG ratio. For what concerns the AX-CPT, the variables are Mean reaction time AI, Accuracy AI.
All these variables were examined for normality (Shapiro-Wilk Normality Test) before performing the tests and the resulting not normally distributed parameters were log10-transformed when the values
were all greater than zero in order to normalize them. When the variables assumed both positive and negative values, a power transformation was used (10value). Also, the extreme outliers identified with boxplots were excluded from the statistic.
The different conditions assessed in this analysis are the Baseline (No Cues) and the Turning with Closed-Loop Biofeedback (Vibrotactile Cues). Both were assessed with single-task (ST) and dual-task (DT). In addition to these, the Seated condition was assessed
32
Linear mixed effects model
A linear mixed model was used to investigate the differences between the two conditions (Baseline and Closed-Loop Biofeedback), the differences among the two tasks (ST and DT) and the interaction between conditions and tasks.
A Linear mixed effects model is a statistical model often preferred over more traditional approaches such as repeated measures ANOVA because it has many advantages. First of all it can deal with missing values and, in addition, it can model nonlinear, individual characteristics54.
The particular model used in this analysis was a Residual Maximum Likelihood (REML) and the significance level α was set to 0.05.
In addition to this analysis, another test was performed accounting for the Freezing status (i.e patient with or without FoG). The reason for this distinction is that, if there are differences between freezers and non-freezers, considering the patients all toghether could lead to misinterpretations of the results of the statistical analyis. It can be in fact that some effects of the cueing device could be seen in fact only in freezers and not in non-freezers, or viceversa. For example, it could be that the cueing improves turning velocity only in freezers. Doing an analysis where all the PD participants are considered as a whole could therefore hide this beneficial effect and this has to be avoided.
Analysis of variance (ANOVA)
To investigate the differences in the AX-CPT variables (accuracy and reaction time) across 3 different conditions (Seated, Baseline, Closed-Loop Biofeedback), a one-way repeated measures ANOVA was used. When a condition difference was found, post-hoc analyses were used to investigate which conditions differed from which.
A p<0.0167 was considere here (respecting a Bonferroni correction for 3 comparisons).
Pearson's correlation
The Pearson’s correlation coefficient is a measure of linear correlation between two variables. It can have values between -1 and +1, where -1 means total negative correlation and +1 means total positive correlation. A value of 0 means that there is no linear association between the variables.
Here, we investigated associations between the Median HbO2 levels during turning and the behavioral measures of turning/clinical scores, and between the MoCA or Disease Duration and the behavioral measures of turning/other clinical scores.
The significance level α was set to 0.05 for the correlations.