SCUOLA DI INGEGNERIA E ARCHITETTURA
DIPARTIMENTO DI INGEGNERIA INDUSTRIALE
CORSO DI LAUREA MAGISTRALE IN INGEGNERIA EDILE-ARCHITETTURA
TESI DI LAUREA in
Fisica Tecnica Ambientale
LIFE CYCLE ASSESSMENT OF PHOTOVOLTAIC TECHNOLOGIES:
A CASE STUDY OF A SOLAR FARM IN NEW ORLEANS
CANDIDATO: RELATORE: Carla D’Alessandro Chiar.mo Prof. Massimo Garai CORRELATORE: Ing. Federica Morandi
Anno Accademico 2016/17 Sessione II
Abstract
. . . .9Introduction
. . . .11Chapter 1 - Energy policy: an international overview
. . . 151.1 The need of energy policies . . . 15
1.2 The Paris Agreement . . . 16
1.3 Present market and future trend . . . 18
1.3.1 New capacity additions . . . 18
1.4 Environmental labels . . . 22
1.4.1 Ecolabel . . . 22
1.4.2 EPD . . . 23
1.5 Energy Policy in Europe . . . .24
1.5.1 2020 Energy Strategy . . . .24
1.5.2 2030 Energy Strategy . . . .28
1.5.3 2050 Energy Roadmap . . . .31
1.6 Energy policy in United States . . . .37
1.6.1 Financial incentives . . . .41
1.7 Policy development in the rest of the world . . . .46
Chapter 2 - Life Cycle Assessment method . . . .49
2.1 Origin and development of the LCA . . . . . . .49
2.3 Framework . . . .56
2.3.1 Goal and scope definition . . . .57
2.3.2 Inventory Analysis . . . .60
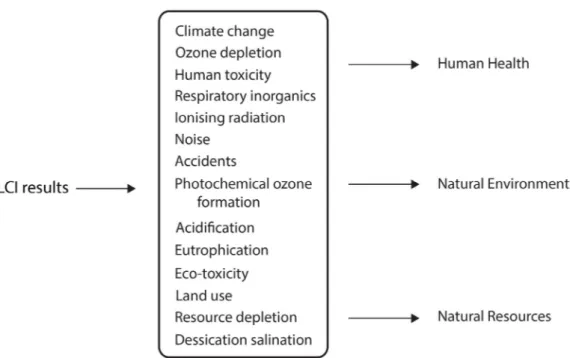
2.3.3 Life Cycle Impact Assessment . . . 66
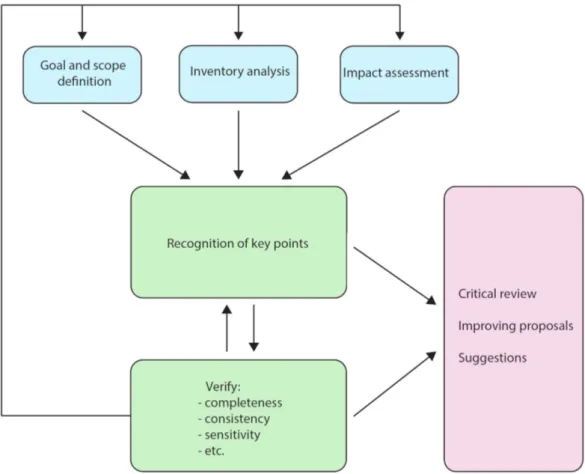
2.3.4 Critical review and interpretation . . . 76
2.4 Calculation methods . . . .78
2.4.1 IPCC 2007 GWP 100a . . . .79
2.4.2 Cumulative Energy Demand (CED) . . . 79
2.4.3 CML 2002 . . . .80
2.4.4 Eco-indicator 99 . . . 82
2.4.5 IMPACT 2002+ . . . .83
2.4.6 ReCiPe . . . 84
Chapter 3 - Technical review of existing solar technologies . . . 87
3.1 Photovoltaic systems . . . 87
3.1.1 First generation . . . 88
3.1.2 Second generation . . . 90
3.1.3 Third generation . . . 92
3.2 Types of photovoltaic systems . . . 94
3.2.1 Grid-connected systems . . . .94
3.2.2 Stand-alone systems . . . .97
3.2.3 Building-Integrated photovoltaic systems (BIPV) . . . 99
3.3 Solar thermal systems . . . .103
Chapter 4 - Case study: LCA of a solar farm in New Orleans . . . 111
4.1 Description of the solar farm . . . 112
4.2 The software used for the LCA: SimaPro 7.3.3 . . . .114
4.3 Goal definition . . . 119
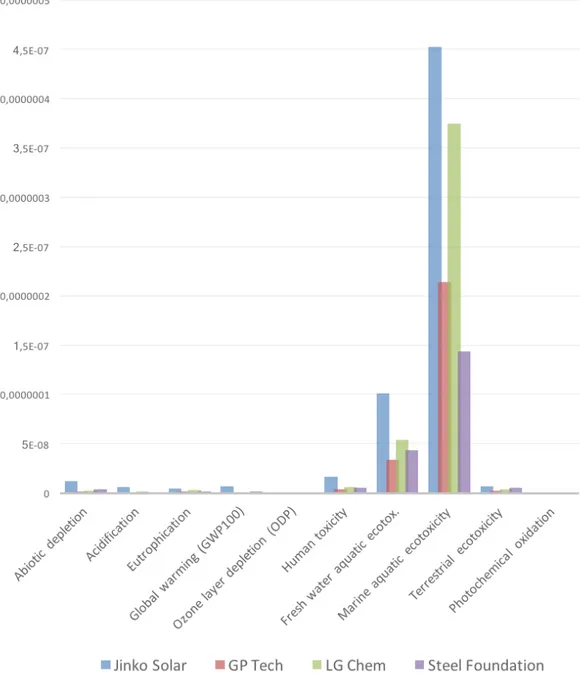
4.6 Inventory analysis . . . .120 4.7 Results . . . 121 4.7.1 CML 2 baseline 2000 analysis . . . 122 4.7.2 Ecoindicator 99 analysis . . . .124 4.7.3 IMPACT 2002+ analysis . . . 126 4.7.4 EPD analysis . . . .128
Chapter 5 - Interpretation of the results . . . .131
5.1 CML results . . . 131 5.2 Ecoindicator results . . . 132 5.3 IMPACT results . . . 133 5.4 EPD results . . . .134 Conclusions . . . 139 Appendix A . . . 141 Appendix B . . . 143 Appendix C . . . 151 Appendix D . . . 153 References . . . 159 Acknowledgements . . . 169 Ringraziamenti . . . 171
Il presente lavoro di tesi è stato svolto in parte negli Stati Uniti, per la precisi-one a New Orleans, ove si è studiata una Solar Farm di proprietà della Enter-gy Inc. e si è svolto uno studio Life Cycle Assessment di tipo cradle-to-gate. Lo scopo è quello di analizzare in dettaglio ogni forma di inquinamento gen-erato dalla produzione di tutti gli elementi che costituiscono la Solar Farm, per capire se realmente si tratta di un tipo di energia “green” e sostenibile dal punto di vista ambientale.
Nel primo capitolo si raggruppano e si confrontano le attuali politiche ener-getiche internazionali, europee e americane, e si evidenziano gli obiettivi che si intendono raggiungere entro determinate scadenze in termini di emissioni di gas serra, utilizzo delle energie rinnovabili, efficienza energetica, etc. Nel secondo capitolo segue uno studio approfondito sul metodo del Life Cy-cle Assessment, con una breve introduzione storica per poi passare nel detta-glio alle fasi di studio, metodi e normativa di riferimento.
Nel terzo capitolo si analizzano le tecnologie fotovoltaiche attualmente pre-senti sul mercato, la loro storia e le possibili evoluzioni, con le caratteristiche dettagliate di ciascun tipo di tecnologia.
Nel quarto capitolo viene presentata la Solar Farm in analisi, spiegato il suo funzionamento, e si introduce il software utilizzato per lo studio, SimaPro 7.3.3. Infine si illustrano i risultati ottenuti dallo studio LCA.
Infine, nel quinto capitolo si discutono criticamente i risultati ottenuti e si confronta un kWh prodotto dalla Solar Farm oggetto di studio con un kWh prodotto da fonti di energia non rinnovabili, quali il carbone, il petrolio, il gas e il nucleare, per capire quanto è conveniente in termini ambientali il passag-gio da fonti di energia fossili a fonti rinnovabili.
Introduction
Most of the world’s current energy is produced from fossil fuels such as coal, oil and natural gas, now the disadvantages related to the dependence on imports from a limited number of countries, rising prices and especially the considerable impact on climate change have reached the public opinion. Consequently, governments, businesses and consumers are progressively supporting the development of renewable energy sources, which are basical-ly unlimited in availability, although they have a few drawbacks. A way to ensure the efficient development of these sources is to create and implement energy policies, and work together to establish a sustainable and responsible future for our planet.
Solar power generation has come up as one of the most rapidly growing al-ternative sources of electricity, and as a result there is a fierce competition on the market, which expands at very high rates because of technology cost reduction and market development, reflecting the increasing recognition of the versatility, reliability, and economy of photovoltaic (PV) supply systems. Major market segments served by this industry involve consumer applica-tions, remote industrial systems, developing countries, and grid-connected systems. Over the years this technology has changed a lot and it is supposed to evolve even more.
IntroductIon
12
In the present thesis, an accurate study was conducted on the photovoltaic technologies and the damages that their manufacturing process produces to the environment.
Part of the present thesis has been written at the University of New Orleans, with the collaboration of Entergy Inc., that kindly provided data of their solar farm pilot project, known as Entergy Solar Power Plant.
In the first chapter it is analyzed the present status of the renewable market, the main trends and the policies fostered by some countries.
One of the major support to the PV market is the incentive, financial or non-financial, which in some cases comes from the local government, or else from the regional or country government, as it is analyzed in Chapter 1 of the present thesis. The most important boost that drives the incentives, are the guidelines from the major bodies, such as European Union or United States government, and also international non-governmental organizations, such as IEA and REN21.
Chapter 2 describes in detail how to make a LCA, which ones are the stan-dards to follow and the software and the databases used for the study.
As previously mentioned, it is important to avoid as much as possible the pollution, and photovoltaic technologies help a lot with this issue, but even they have some environmental costs, especially in terms of emissions and waste. Therefore, it is necessary to compile a Life Cycle Assessment (LCA), to evaluate the damage to the environment caused by the manufacturing pro-cess of PV panels.
synthetic summary of the existing solar technologies, and it is illustrated the principles of operation, as well as the history of photovoltaic technologies, from their very beginning until present days.
Chapter 4 briefly presents the solar farm subject of the study, Entergy Solar Power Plant, and the methodologies used for this analysis. Therefore, the LCA is described in detail.
In Chapter 5 the results previously exposed are discussed and critically ana-lyzed, then a comparison is provided between 1 kWh of electricity produced by the solar farm subject of the study and 1 kWh produced with other sources of energy, to better understand how convenient is, in terms of environmental damages avoided, the transition from traditional energy sources to renewable ones, such as photovoltaic.
Finally, the conclusions summarize the main achievements of this work, il-lustrates the lacks that have been encountered and discuss future develop-ment on the topic.
C
hapter1
Energy policy:
an international overview
1.1 The need of energy policies
In the past few years, the rise of the global temperature, the ozone layer de-pletion and the air pollution have driven a world-wide awareness that it is no longer possible to procrastinate a concrete and resolute act to curb the climate change and to build climate resilience.
The awareness mentioned above resulted in several energy efficiency policies from different parts of the world, led by a few international organizations. One of these is REN21 (Renewable Energy Policy Network for the 21st Century), a multi-stakeholder policy network provided by United Nations Environment Programme, in which governments, nongovernmental orga-nizations, research and academic institutions, work together to encourage the development of renewable energy. To support policy decision making, REN21 produces every year the Renewables Global Status Report (GSR), which is a thorough overview of worldwide renewable energy market, indus-try, investment and policy development.
es-Chapter 1 - energypoliCy: aninternationaloverview
16
tablished in the framework of the Organization for Economic Co-operation and Development (OECD). As opposed to REN21, IEA reviews all forms of venergy, and deals with its related issues, such as oil, gas and coal stock and demand, renewable energy technologies, energy efficiency, access to energy, etc.
1.2 The Paris Agreement
From November 30th to December 12th 2015, the 21st annual session of
Con-ference of Parties was held in Paris, arranged by United Nation Framework Convention of Climate Change. The conference, known as COP21, negoti-ated the Paris Agreement, an important milestone in the effort of containing the global warming. As for 2017, 148 countries have ratified this agreement, on a total of 197 signatories.
The main objective of the Paris Agreement, is to “Holding the increase in the global average temperature to contain the global temperature rise well below 2 °C above pre-industrial levels and pursuing efforts to limit the tem-perature increase to 1.5 °C above pre-industrial levels.”, as specified in par. 1a of the art. 2.
In order to achieve this goal, the parties aim to reach global peaking of green-house gas (GHG) emissions as soon as possible, although clearly this will take longer for developing countries, and immediately afterwards the parties will put into effect rapid reductions in accordance with the best available science.
To supervise the short-term results and assess the collective progress towards the goal, COP21 plans to undertake a stock-take every five years, the first of which will be in 2023, as specified in par. 2 of art. 14 of mentioned
agree-ment, and to publish the results, in accordance with the transparency and consistency general guidelines of the accord.
Another key point of the Paris Agreement is the international cooperation among countries, in order to enhance understanding, action and support in many different areas, such as: early warning systems, emergency prepared-ness, slow onset events and risk insurance facilities, as indicated in Par. 4 of art. 8.
To reach the ambitious objective to contain the global temperature rise, it is important that every country, including the developing ones, put efforts in the reducing of anthropogenic emissions. The convention recognized that some countries, such as those that are particularly vulnerable to the effects of cli-mate change and have significant capacity limitations, might need support in order not to threaten their economic growth in the pursuing of the objective. Therefore, the developed countries will provide financial resources to men-tioned developing countries, as stated in par. 1 of art. 9.
A new feature introduced in par. 13 of art. 4, is the Nationally Determined
Contribution (NDC), in which countries determine their contributions based
on of their national priorities, circumstances and capabilities, in the context of a global framework under the Paris Agreement. NDCs reflect each coun-try’s effort for reducing emissions, and how they will build resilience to cli-mate change impacts.
Most of the NDCs resulted to be GHG goals, different for each country. They include absolute GHG emissions targets, emissions intensity targets (i.e. GHG emissions per unit of economic output), or reductions or limitations in per-capita emissions. In some cases, the target was conditional on other factors, e.g. the economic availability in developing countries.
Chapter 1 - energypoliCy: aninternationaloverview
18
reducing energy-related GHG emissions in the short term, such as cut down the use of inefficient coal-fired power plants, decrease methane emissions from oil and gas production, fossil-fuel subsidy reform and carbon pricing. Table 1.1 shows as an example the NDCs of some countries (adapted from IEA, 2016).
1.3 Present market and future trend
Although the scale of capacity additions oscillates from year to year, REN21 and IEA agree that renewable energies are experiencing a very high growth, in fact the trend of deployment of wind, solar PV and hydro over the last few years is rapidly incrementing and perhaps one of the clearest signs of an en-ergy transition taking place.
According to IEA (2016), the renewables industry passed an important mile-stone in 2015, with capacity additions exceeding those of fossil fuels and nuclear for the first time. In 2015, in fact, Europe used renewable energy for the most of its production of power, such as 28.8%, followed by nuclear for 26.8%, 15.6% of hard coal, and 10.4% of lignite, 15.1% of gas, and 3.2% of oil and other conventional sources, according to Agora Energiewende (2016). In USA, the main sources of new power capacity in 2015 were wind (8.6 GW) and solar (7.4 GW, solar PV and CSP), surpassing natural gas capaci-ty additions (about 6 GW), according to FERC, Federal Energy Regulatory Commission (2015).
1.3.1 New capacity additions
For what concerns the power generation, the coal-based generation capac-ity of 1950 GW was overtaken by the one of renewable energies, around 1985, although the latter provides around 40% less electricity than from coal. Hence, new renewables-based capacity additions in 2015, accounting for 147.2 GW, established a new record, nearly quadruple the level achieved a decade earlier (REN21, 2016).
Of these 147.2 GW, 50 GW of capacity addition in 2015 were only solar PV-based. In United States, solar PV additions rose significantly (up to 7.3 GW)
Chapter 1 - energypoliCy: aninternationaloverview
20
which, for the first time, was more than total natural gas capacity additions, a notable achievement given the low natural gas prices and that gas has been a leader in US capacity additions (IEA, 2016).
Japan’s government target led to the addition of 11 GW of solar PV capacity; In EU, United Kingdom in 2015 saw the highest growth of solar PV capacity additions (3.7 GW), while Germany had a downtrend and was overtaken by China as the country with the largest installed solar PV capacity.
The 50 GW of new solar PV-based capacity additions installed in 2015, made the total share in the world rise to 227 GW.
Of these 227 GW, 95 GW are generated in EU (of which 40 GW are produced in Germany, while 18.9 GW in Italy and 5.4 GW in Spain) and 50 GW are from BRICS countries (Brazil, Russia, India, China and South Africa), of which almost the totality is shared between China, indisputable leader with its 44 GW, of which 15 GW of new capacity, and India with 5.2 GW (IEA, 2016), as displayed in Fig. 1.1.
Renewables-based power capacity additions in 2015 were led by wind, which were nearly 35% higher than the previous year and established another re-cord high (65 GW). China (half of all additions), the European Union (led by
Germany) and the United States together accounted for more than 80% of the global total for wind power capacity additions.
Renewables contributed 23% of global electricity supply in 2014, of which more than 70% was from hydropower and 17% from variable renewables. China and the European Union are the leaders today in terms of total renew-ables-based electricity generation, while Iceland, Norway, Brazil, Canada, Austria and Sweden are in a league of their own when it comes to the share of electricity generated from renewable sources. The European Union (EU) has the highest share of variable renewables, meeting 11% of overall electricity demand from projects harnessing wind or solar resources, but there is consid-erable variation across individual EU member states (IEA, 2016).
For what concerns the heating and cooling sector, in REN21’s GSR 2016, renewable energy accounted for an estimated 18% of the Europe’s total heat-ing and coolheat-ing consumption; therefore, EU has experienced the strongest growth in renewable energy use for heat of any region, with average annual increases of almost 5% since 2008.
Meanwhile, in United States the renewable energies used for heat and cool-ing are growcool-ing relatively slower (0,6%), partly due to the downsize of in-dustrial output. 2015 also saw the decrease of residential heating with wood pellets, and the drop-in oil prices caused the reduction of the competitiveness of renewable heat in US (REN21, 2016).
Chapter 1 - energypoliCy: aninternationaloverview
22
1.4 Environmental labels
The first step is to balance all the many different regulations in all the coun-tries across the world, in order to make effort together in the same direction and with the same strategy. ISO (International Organization for Standardiza-tion) made several codes and labels that are transposed in each country. In particular, there are three environmental labels:
• Type I (ISO 14024): e.g. Ecolabel, they are issued only to products that meet certain minimum requirements (established environmental criteria) and are certified by an independent body;
• Type II (ISO 14021): or environmental self-declarations, for which there is no certification of an independent body or a minimum ac-ceptable level, the manufacturer merely declares the environmental aspects of his product, which he considers useful to highlight;
• Type III (ISO 14025): EPD, (Environmental Product Declaration) which provide quantitative data on the environmental profile of a product calculated according to LCA procedures established in ISO 14040.
1.4.1 Ecolabel
In 1993, the European Union, in the context of the activities of the Fifth Action Program, in order to harmonize spontaneous procedures within the various countries and to build a single market reference system, introduced the Ecolabel Europe as a European environmental label of European Recog-nition; thus, this did not actually erase the national trademarks.
The Ecolabel’s purpose is, on the one hand, to encourage companies to follow environmentally sustainable production processes and, on the other hand, to
offer consumers the opportunity to make informed choices in their purchases, because products labeled with this brand are goods that have passed strict selection criteria and reward environmental and performance excellence. The requirements for the award of the Ecolabel (by the European Commis-sion and an appropriate body called the European Union Ecolabel Board, EUEB) clearly follow the approach “from cradle to grave”, pursuing the re-duction of impacts on natural habitats and Resources, reducing emissions of polluting and dangerous substances, consumer information, etc.
1.4.2 EPD
The EPD (Environmental Product Declaration) is a technical document arose by the manufacturer’s will and, after a process of verification of content by a certification body, it accompanies the marketing of the product. The as-sessment method is the Life Cycle Asas-sessment, but the EPD differs from the latter because the system guarantees an objective, verifiable, comparable procedure as it is based on data provided directly by the manufacturer and not from databases.
In order to make the data contained in the statement comparable, the com-mon parameters for each product category must be defined: the PSR (Product Specific Requirements) recently renamed as PCR, (Product Category Rules), describe in a harmonized manner, by product category or service, what data are to be collected for the realization of the Life Cycle Assessment, methods, calculations and results to be presented. These criteria are defined in a shared way and help to make EPDs comparable.
All products can access to the product environmental statement: there are no thresholds as for type I labels, but it is simply a declaration of impacts that the product generates over the life cycle; this system gains the advantage of
Chapter 1 - energypoliCy: aninternationaloverview
24
starting a fierce environmental competition among manufacturers.
The purpose of these product declarations may be to send information from the manufacturer to the consumer (business to consumer, B2C) or to the pro-fessional broker (business to business, B2B). Anyway, the target is to encour-age the demand for the supply of those goods that cause less environmental impact during their life cycle.
1.5 Energy Policy in Europe
The European Commission established different targets to achieve before 2050, in order to lead the Member States towards a more sustainable future. The first milestone will be 2020, on which all the short-term policies are fo-cusing. The second is 2030, which presupposes the achievement of all 2020 targets, and the last is 2050, still far away from our time, and for this reason is important to take important decisions since now, to increase the chances to achieve those targets.
1.5.1 2020 Energy Strategy
In 2010 European Commission drew up the energy objectives to accomplish before 2020, in the paper “Energy 2020: A strategy for competitive, sustain-able and secure energy”.
The most important target to be achieved before 2020 is to reduce
green-house gas emissions by 20% (relative to data from 1990), to increase the share of renewable energy to 20% in gross final energy consumption, and
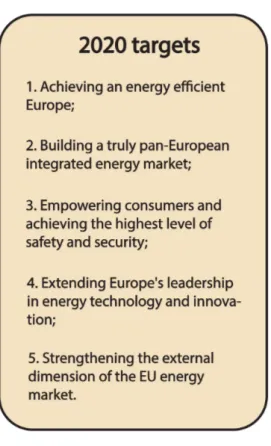
to make a 20% improvement in energy efficiency, compared to 2005 peak. The main priorities are summarized in Fig. 1.2.
1. Achieving an energy efficient Europe: is to encourage the transi-tion to renewable by giving more financial incentives at European, national and local levels. Energy efficiency is one of the central ob-jectives for 2020 as well as a key factor in achieving our long-term energy and climate goals. Also, the public authorities should lead by example, support clean urban mobility and energy efficiency-stan-dards for all vehicles, and make energy efficiency a mandatory con-dition for allocating financial support. Another important key point is to boost industrial competitiveness by making industry more effi-cient and spread energy labelling in order to provide more compre-hensive comparison between products.
2. Building a truly pan-European integrated energy market: the second Fig. 1.2: Targets expected by 2020, as
Chapter 1 - energypoliCy: aninternationaloverview
26
priority is to integrate and implement about time the internal mar-ket legislation, and about this, also important is to enforce strategic infrastructure priorities in the next two decades, because Europe is still lacking the grid infrastructure which will enable renewables to develop and compete on an equal footing with traditional sources, to provide environmental sustainability and access to renewables as well as security of supply. The present grid is most likely unable to sustain the volumes of renewable power required by 2020 targets (33% of gross electricity generation). The legal framework must be properly enforced to give investors the confidence to invest in new production, transport and storage options for renewable sources. 3. Empowering consumers and achieving the highest level of safety
and security: citizens appear to be unaware of their rights under EU legislation, or reluctant to exercise them, and this lead to a lack of savings in utility bills. More efforts are needed to inform consum-ers about their rights and involve them in the internal market. The international market for oil supplies could become very tight before 2020, which means that it is important for EU consumers to reduce oil demand, which at the moment of the paper was not happening, so the strategy is to provide affordable but cost-reflective and re-liable alternative supplies. Energy, in particular electricity, consti-tutes a substantial part of the total production costs of key European industries, including from small to medium and large enterprises. 4. Extending Europe’s leadership in energy technology and
innova-tion: it is important for EU to make a technology shift, otherwise it will not be able to achieve all the targets for 2050 to decarbonize the electricity and transport sectors. 2050 can appear far away from our time, but it is the right moment to bring in the European
mar-ket new high performance low-carbon technologies. Europe-wide coordination and collaboration should include the pooling of differ-ent funding sources, with the cooperation of all stakeholders. The Commission will seek to leverage the EU budget to raise further the overall level of funding. The competition in international tech-nology markets among Europe and countries such as China, Japan, South Korea and the USA is very intense, because its competitors are pursuing an ambitious industrial strategy in solar, wind and nu-clear markets. EU research laboratories need to increase their efforts to remain at the forefront of the booming international market for energy technology.
5. Strengthening the external dimension of the European energy mar-ket: with its more than 500 million consumers, EU energy market is the world’s largest regional market and largest energy importer, but Europe is facing global warming like the rest of the world, and so the solution to this challenge relies on the international collabo-ration, and this lead push Europe’s efforts for decarbonization and energy efficiency with our main partners and in international nego-tiations and frameworks. As a frontrunner in policy development, the EU has more scope to influence standard-setting environmental issues and to promote respect for transparent and competitive mar-kets. Another key point is the presence of synergies between energy objectives and other policies and instruments including trade, bilat-eral agreements and development cooperation instruments.
In 2014, the European Commission made an overview on the progress to-wards these objectives, in the paper “A policy framework for climate and energy in the period from 2020 to 2030”.
Chapter 1 - energypoliCy: aninternationaloverview
28
They noted that in 2012 greenhouse gas emissions decreased by 18% relative to emissions in 1990, and are expected to reduce further to levels 24% and 32% by 2020 and 2030 respectively based on current policies.
The share of renewable energy sources has increased to 13% in 2012 as a proportion of final energy consumed, and is expected to rise further to 21% in 2020 and 24% in 2030.
The carbon intensity of the EU economy fell by 28% between 1995 and 2010.
1.5.2 2030 Energy Strategy
As mentioned in the previous paragraph, it can be stated that the 2020 targets are on the good track to be achieved, so the policies carried out in order to accomplish this objective are effectively working.
While renewable energy technologies have matured and costs have fallen substantially, the rapid development of renewable energy sources now brings new challenges for the whole energy system. Many energy using products are more efficient at the moment, and consumers are benefitting from real energy and financial savings.
The 2030 is a decisive step in achieving the goals of 2050. It is therefore time to reflect on these developments and the policy framework Europe needs for 2030. It is necessary to continue towards the transition to a low-carbon economy that provides consumers with competitive and reasonably priced energy, creates new opportunities for growth and employment, assures great-er security of engreat-ergy supply and reduces dependence on imports for the EU as a whole.
An important key factor is to strengthen regional cooperation between Mem-ber States in order to help them tackle common energy and climate challeng-es more cost-effectively and at the same time continue to integrate markets.
The Commission proposes to set the target, by 2030, to reduce in EU green-house gas emissions by 40% compared to 1990. The policies and measures implemented and envisaged by the Member States regarding their respective current GHG reduction obligations, will continue to apply after 2020. The mentioned measures should allow emissions to be reduced by 32% compared to 1990.
The pursuit of this objective will require a constant effort, but the reduction percentage will show that the proposed target for 2030 is feasible. However, it is important to carry out continuous assessment to take account of the in-ternational dimension and to ensure that Europe continues to follow the least cost path to move to a low-carbon economy.
Therefore, in the implementation of a framework for 2030, the Commission believes indispensable to set the target for greenhouse gas reduction in each Member State, continuing to take account of these distribution factors but at the same time guaranteeing the integrity of the internal market.
The transition to a sustainable, secure and competitive energy system will not be possible without a significant increase in the share of renewable energy, which will therefore have to continue to play a key role in this step. In addi-tion, the Union may reduce its trade deficit on energy products and be less exposed to supply disruption and volatility of fossil fuel prices.
Renewable energies can also be a driving force for growth in the field of in-novative technologies, create jobs in emerging sectors and help reducing air pollution. Their rapid diffusion brings challenges, especially for the power system, which has to adapt to more and more decentralized and diversified production, especially from wind and solar power. Besides, the development of most renewable energy in the EU depends on national support schemes
Chapter 1 - energypoliCy: aninternationaloverview
30
which, while taking into account national and regional specificities, may hin-der market integration and reduce cost efficiency.
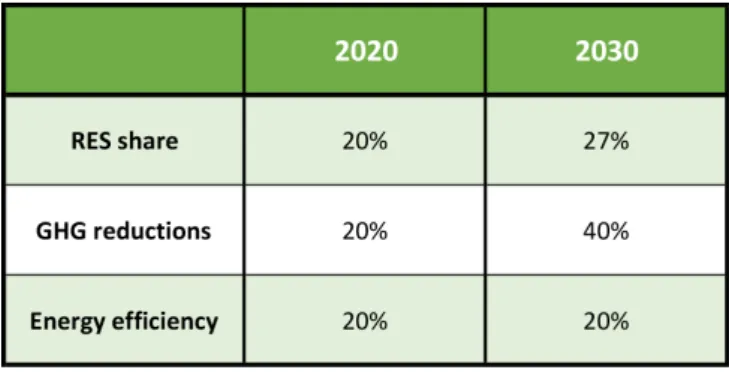
In the next future, exploitation of the benefits of renewable energy will have to be as market-oriented as possible. The aim of decreasing greenhouse gas emissions by 40% should help by itself to increase the share of renewable energy in the EU, bringing it to at least 27%, as proposed by the Commission. The EU-level target will encourage more investment in renewable energy, which will, for example, increase its share in the electricity sector, moving from the current 21% to at least 45% in 2030.
A greater energy efficiency can contribute substantially to achieving all the main objectives of EU climate and energy policies: greater competitiveness, security of supply, sustainability and also transition to an economy low car-bon emissions.
Energy saving should complement the use of renewable energy by Mem-ber States within their respective greenhouse gas emission reduction plans, which should also advise national measures to be taken to improve energy efficiency. The Commission’s analysis shows that a target of 40% reduction in greenhouse gas emissions would require greater energy savings (around 25%) in 2030.
In some sectors, such as industry and passenger transport vehicles, Europe will have to continue on the path of improvements observed in recent years, while in other areas, such as the housing sector, other modes of transport and electrical equipment, it is necessary to significantly intensify current ef-forts, in order to exploit the strong potential that is still unused. To this end, investment in construction (which would have a positive impact on manage-ment costs), general conditions and availability of information to encourage consumers to switch to innovative products and services as well as adequate
financial instruments to ensure that the benefits of change consequently come to all consumers of energy.
The European Union’s energy efficiency goal is not binding and the prog-ress made in this area depends on specific policy measures taken at EU and national level, which include, inter alia, domestic and industrial equipment, vehicles and building. At present, it is predicted that the target of 20% will not be fully achieved. At the end of the review process, the Commission will evaluate any need to propose amendments to the Energy Efficiency Directive. 2020 and 2030 targets are summarized in Table 1.2.
1.5.3 2050 Energy Roadmap
Although it is not possible to predict the long-term future, the scenarios illus-trated in the Energy Roadmap for 2050 examine some of the ways towards decarbonization of the energy system, which involve all major changes, such as carbon prices, technology, and networks.
Several scenarios aimed at achieving an 80% reduction in greenhouse gas emissions, involving 85% of energy-related CO2 emissions, including those in the transport sector, have been examined. The Commission also observed the scenarios foreseen by Member States and interested parties and their comments. Because of the long-term horizon, these results present a certain degree of uncertainty, mainly because uncertain are the hypotheses on which
Chapter 1 - energypoliCy: aninternationaloverview
32
they are based on.
Scenario analysis is illustrative and looks at the effects, challenges and op-portunities of possible ways to modernize the energy system. They are not mutually exclusive options, but focus on common elements and aim to sup-port long-term investment approaches.
One of the main obstacles to investment is uncertainty. The analysis of the projections carried out by the Commission, the Member States and interested parties shows a series of clear trends, challenges, opportunities and structural changes that must be taken into account in drawing up the strategic measures needed to define an appropriate framework for investors.
Based on this analysis, this Energy Roadmap identifies key conclusions on “no regrets” options in the European energy system. This makes it also im-portant to achieve a European approach, where all Member States share com-mon understanding of the key features for a transition to a low-carbon energy system, and which provides the certainty and stability which are needed. The 2050 Roadmap made by the European Commission is not supposed to replace national, regional and local initiatives aimed at modernizing energy supply, but it is proposed to develop a long-term and neutral European frame-work in the technological field where these policies are more effective. The decarbonization scenarios examined in the 2050 Roadmap are the fol-lowing:
High Energy Efficiency: focuses on political commitment to achieve high
energy savings; it includes, among others, stricter minimum requirements for appliances and new buildings; high renovation rates of existing buildings; establishment of energy savings obligations on energy utilities. This leads to a decrease in energy demand of 41% by 2050, as compared to the peaks in 2005-2006.
Diversified supply technologies: all energy sources can race in the market
without specific support measures. Decarbonization is triggered by a carbon price fixing that requires public acceptance of both nuclear and Carbon Cap-ture and Storage (CCS).
High Renewable Energy Sources: robust support measures for RES in
or-der to achieve a very high share of RES in gross final energy consumption (75% in 2050) and a share of RES in electricity consumption reaching 97%.
Delayed CCS: like the previous scenario but it assumes that CCS is delayed,
leading to higher shares for nuclear energy with decarbonization driven in the first place by carbon prices rather than technology push.
Low nuclear: Similar to Diversified supply technologies scenario, but it
as-sumes that no new nuclear (other than reactors currently under construction) is being built resulting in a higher penetration of CCS (around 32% in power generation).
By combining the different scenarios, it is possible to extract some conclu-sions which can help to shape decarbonization strategies today, which will deliver their full effects by 2020, 2030 and beyond. They are:
1. Decarbonization is possible, and in the long run may be less expensive than current policies. The costs of transforming the energy system do not differ substantially from the Current Policy Initiatives (CPI) sce-nario. In the latter case, the total cost of the energy system (including fuels, electricity and capital costs, investment in equipment, energy efficient products, etc.) could represent slightly less than 14.6% of European GDP in 2050, compared to the level of 10.5% in 2005. 2. Higher capital expenditure and lower fuel costs. In all the
decarbon-ization scenarios, the EU bill for fossil fuel imports in 2050 would significantly drop, if compared with the one of today. The analysis
Chapter 1 - energypoliCy: aninternationaloverview
34
also indicates that between 2011 and 2050 the only cumulative in-vestment costs in the network could range from 1.5 to 2.2 trillion eu-ros, where the higher amount reflects a larger investment in support of renewable energy. The average capital costs of the energy system will increase significantly, thus bringing a widespread impact on the European economy and jobs in manufacturing, services, construction, transport and agricultural sectors.
3. Electricity plays an increasing role. In all scenarios, it can be noted that electricity will play a much greater role than the current situation - almost doubling its share in final energy demand and it will probably reach 36-39% in 2050 - and it will contribute to the decarbonization of transport and heating and cooling. In the 2050 Roadmap, it is estimat-ed that electricity could provide approximately 65% of the transport energy demand. In order to achieve this goal, the energy production system should be subject to structural change and to reach a signifi-cant level of decarbonization (57-65% in 2030 and 96-99% in 2050) by 2030.
4. Electricity prices will rise until 2030 and then decline. Most of these increases is already happening in the reference scenario, and is linked to the replacement of obsolete production facilities that have already been fully depreciated over the next 20 years. In the High Renewables scenario, which implies a 97% share for renewable sources in electric-ity consumption, the modelled electricelectric-ity prices continue to rise but at a decelerated rate because of high capital costs and hypothesis about high needs for balancing capacity, storage and grid investments in this “near 100% RES power” scenario.
5. Household expenditure will increase. In all scenarios, including the one based on current trends, energy expenditure and related products
(including transport) will probably have a greater impact on household spending, rising to about 16% in 2030 and drop off to more than 15% in 2050. However, if regulation, standards or innovative mechanisms are used to accelerate the introduction of energy efficient products and services, this would reduce costs.
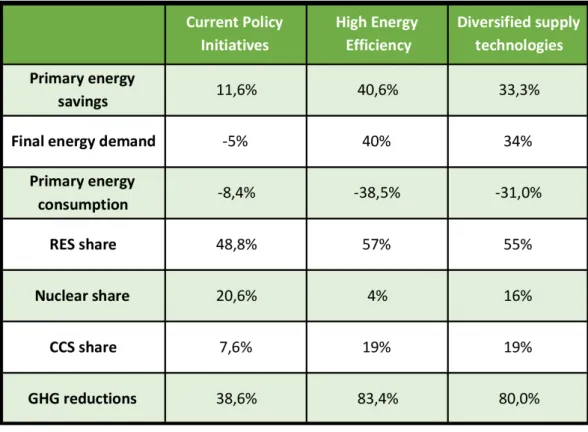
6. Energy savings throughout the system are crucial. Compared to the peaks in 2005-2006, primary energy demand will fall between 16% and 20% by 2030 and between 32% and 41% by 2050. In order to achieve significant energy savings, it will be necessary to free up the economic growth from the energy consumption, and strengthen the relevant measures in all Member States and in all economic sectors. 7. Renewables rise substantially. RES will achieve at least 55% in gross
final energy consumption in 2050, which is very high compared to the current level of 10%. The share of renewables in electricity consump-tion reaches 64% in the High Energy Efficiency scenario and 97% in the High Renewables Scenario, which includes significant electricity storage to accommodate varying RES supply even at times of low demand.
8. CCS has to play a critical role in system transformation. If commer-cialized, Carbon Capture and Storage will have to contribute remark-ably in most scenarios, guaranteeing up to 32% of energy production, in the case of limited nuclear production, and a share of 19 to 24% in other scenarios, with the exception of the High RES scenario.
9. Nuclear energy provides an important contribution. Nuclear is still a key source of low carbon electricity generation, and thus it will pro-vide a major contribution in the energy transformation process in those Member States where it is pursued. The highest penetration of nuclear comes in Delayed CCS scenario, in which will be 18% in primary
Chapter 1 - energypoliCy: aninternationaloverview
36
energy, and Diversified supply technologies scenario (15% in primary energy), which show the lowest total energy costs.
10. Decentralization and centralized systems increasingly interact. Large-scale centralized systems, such as nuclear and gas stations and decen-tralized systems, will progressively need to work in synergy. The new energy system will have to promote and boost a new configuration of decentralized and centralized large-scale plants, which will depend on each other, for example, if local resources would not be sufficient or varied over time.
It’s hard to compare 2050 targets to the 2020 and 2030 ones, since the Road-map shows different scenarios and the projections may significantly vary from one to another. In Table 1.3 and 1.4 the analyzed scenarios are summa-rized in a general overview.
1.6 Energy policy in United States
NREL (National Renewable Energy Laboratory), authority of the U.S. De-partment of Energy, made a technical report in 2009 in which it studies by sector (buildings, transportation, industrial, and power) energy consumption and thus the energy efficiency policies at the federal, state, and local levels. The report found out that buildings consume 40% of U.S. primary energy, including 72% of U.S. electricity consumption and 36% of natural gas con-sumption. The building sector drives the growth for new power plants; 87% of the growth in electricity sales between 1985 and 2006 is attributable to building sector demand (EERE, Office of Energy Efficiency and Renewable Energies, 2008).
In order to decrease such demand, the authors suggest to undertake a focused legislation that aims at building efficiency performance.
Chapter 1 - energypoliCy: aninternationaloverview
38
NREL highlighted that the policy types most frequently employed to increase the use of energy-efficient technologies in buildings, are the following:
1. Building codes, which affect long-term energy demands;
2. Appliance standards, which establish minimum levels of
efficien-cy of appliances;
3. Labels and consumer information, which provide information on
long-term energy consumption of appliances and buildings;
4. Incentives, both financial and non-financial, which include
pro-grams such as tax credits and expedited permitting for efficient buildings;
5. Research and development, e.g., on technologies needed to achieve
cost-competitive zero-energy buildings.
At the federal level, the Energy Policy Act of 2005, expanded under the En-ergy Independence and Security Act of 2007, requires that existing buildings must reduce energy consumption 30% by 2015, compared with 2003 levels, through building upgrades and efficient appliances, as stated in section 431 of Energy Independence and Security Act of 2007.
In section 433 of the same paper, it is affirmed that the buildings shall be designed in order to reduce the fossil fuel-generated energy consumption of 80% by 2020, compared with 2003 levels (measured by Energy Information Agency, EIA).
In 2015, the US government released Executive Order 13693, in which were established the sustainable objectives for the next decade.
In section 3 it is stated that the total share of electric energy must come from renewable or alternative sources in a raising amount from fiscal year 2016 to fiscal year 2025, as showed in Table 1.5.
Table 1.5: Target share of renewable and alternative energy.
For what concerns the GHG emissions, the objective is to reduce them pro-gressively compared to 2014 data, as shown in Table 1.6.
American and European objectives are not directly comparable, because of the different time reference and the fragmented American legislation, but we can still have a glance of the medium-term targets:
Europe, as we saw in the previous paragraph, has set the objective of
renew-able energy sources share at 20% by 2020 and 30% by 2030, while America
has established the same target at 16% by 2020 and 25% by 2025. Table 1.6: GHG reduction target.
Chapter 1 - energypoliCy: aninternationaloverview
40
In Europe, the GHG emission reduction is meant to be decreased at 20% by 2020 and 40% by 2030, and in United States is 15% by 2021 and 30% by 2030.
To achieve this target, U.S. government relies on Building Codes, an essen-tial part of government efforts to transform the long-term market for energy efficiency. They contribute to save energy and money over a building’s life-time by regulating aspects of the building envelope, lighting, and heating, ventilation, and air conditioning (HVAC) system.
Building codes fall primarily within state and local jurisdiction, and since United States are a very wide country with many different climate areas, codes vary extensively across the nation, in order to meet the different needs. At the state level, most of them have adopted codes based on model codes developed by the International Energy Conservation Code (IECC) and the American Society of Heating, Refrigerating and Air Conditioning Engineers (ASHRAE). The strictness of the codes adopted depends on the states’ cli-mate and interests of local stakeholders.
Some states that do have statewide mandates adopt harsh codes to drastically reduce energy demand; e.g. in California, per capita building-related energy demand has remained distinctively constant over the last three decades, after passage in the 1970s of both a statewide building code and appliance stan-dards.
At the local level, in order to promote high energy efficiency of both pub-lic and private buildings, the U.S. Green Building Council’s introduced the Leadership in Energy and Environmental Design (LEED), a certification sys-tem for every kind of building.
LEED is a voluntary system for buildings at a high level of performance; it concerns the entire lifecycle of the building itself, from the design to the construction and management.
This certification promotes a sustainable approach, recognizing the perfor-mance of buildings in key areas such as energy and water saving, CO2 emis-sion reduction, improved ecological quality of the interior, materials and re-sources used, the project and the choice of site.
130 jurisdictions require that buildings owned or supported by government must be LEED certified, and a few even mandate LEED certification for new private buildings, but since local jurisdictions have little regulatory power over the private sector, a widely accepted option is to make available finan-cial and non-finanfinan-cial incentives, in order to encourage certification.
Sometimes, in states without mandatory building codes, local governments can provide their own codes. For example, Illinois has a statewide commer-cial building code, but most localities institute their own residential codes; some have adopted IECC 2003, others have implemented IECC 2006 and still others have codes that date back to IECC 2000 and 1998.
One of the most critical activities in ensuring energy savings resulting from building codes is local enforcement. Each jurisdiction varies in its procedures for enforcing compliance, including training and resources available to code officials.
1.6.1 Financial incentives
One of the biggest hindrance to the sustainable develop is the economic is-sue, since energy efficient technologies, especially in the initial investment, can have high up-front capital costs compared to traditional alternatives. To help reduce this cost gap and stimulate environmental-friendly
develop-Chapter 1 - energypoliCy: aninternationaloverview
42
ment, some policies offer financial incentives, such as grants, loans, rebates, subsidies, and tax incentives.
Said incentives aim to reduce both the investment capital and installation costs, but they also have different goals depending on the sector.
In the industrial and manufacturing sectors, the objective is to target ef-ficiency improvements early in the commercialization process, in order to reduce program implementation costs.
In the commercial, residential, and end-user sectors, the goal is to use the financial incentives to educate the public on benefits of energy efficiency and increase market penetration of existing efficient technologies.
At the federal level, the government set two important key-points: the Busi-ness Energy Investment Tax Credit (ITC), which mainly supports solar PV, and the Renewable Energy Production Tax Credit (PTC), which mainly sup-ports wind power (see Table 2.1 below).
Relative to standards and labeling, federal financial incentives for efficiency are rather new. The most recent economic support for energy efficiency are the grants and loans offered to small agricultural residents and businesses through the Rural Energy for America Program (REAP), which U.S. Depart-ment of Agriculture enacted in the Farm Security and Rural InvestDepart-ment Act of 2002.
United States Department of Agriculture (USDA) provided $23 million each fiscal year in grants, loans, and loan guarantees, to help small agricultural producers to make energy efficient improvements and install renewable en-ergy technologies.
REAP aims to enhance the energy independence in United States, by boost-ing the private sector allocation of renewable energy, and also reducboost-ing the demand for power through energy efficiency improvements. In the long term,
these investments are supposed to help lower the energy costs for small busi-nesses and agricultural producers. REAP was included in Agricultural Act of 2014, in which funds of $20 million were renewed until 2018 (Agricultural Act of 2014, Section 9007).
According to the report by NREL, in the period 2002-2005, energy efficiency projects represented 38% of total REAP awards, and resulted in approximate energy savings of 75,000 MWh.
Based on program popularity and impact, as well as the increasing focus on energy and rural development issues more broadly in the United States, USDA announced that REAP was included in Agricultural Act of 2014, in which funds of $20 million were renewed until 2018 (Agricultural Act of 2014, Section 9007). Subsequently, the Food, Conservation and Energy Act of 2008 (HR 2419) allocated $60-$70 million annually from 2009-2012 for the program’s continuation.
The most recent federal efforts to establish financial tax incentives target upstream efforts for the purposes of optimizing intervention costs (i.e., ap-proaching a small number of appliance manufacturers instead of many con-sumers). There is, however, one end-user investment tax credit for primary residences and high-efficiency home equipment, including windows, doors, insulation, heat pumps and heat pump water heaters, central air conditioners. A lot of states have also been provided financial incentives to subsidize en-ergy efficiency.
Oregon, as for example, has offered a Business Energy Tax Credit (BETC) since 1979, which involves a tax credit of 35% for the purchase of conser-vation technologies, and also incorporates a Pass-through Option, which al-lows entities that do not pay a sufficient amount in taxes to obtain a one-off payment. The main feature of this program is that instead of being based on
Chapter 1 - energypoliCy: aninternationaloverview
44
costs, as is common for tax credits, this financial incentive is based on per-formance as measured by square footage and level of achieved sustainability, which involves at least reductions in energy use of 10% for building retrofits or new home construction and 25% reductions for lighting upgrades. In the same state, a tax credit is also available to developers of sustainable buildings with LEED-certifications of at least Silver.
Other examples include, but are not limited to, the California Energy Com-mission, which offers loans at a fixed rate of 3% to schools, hospitals, and local governments for energy audits and the implementation of efficiency measures.
New York provides financial incentives and technical assistance to owners of multifamily buildings to improve building energy performance. Utilities across most states offer rebates toward the purchase of energy-efficient ap-pliances (DSIRE 2009).
Several states have established to fund energy efficiency programs, including financial incentives, by adding a utility charge to each customer bill, called system benefits charge (SBC). SBCs are meant to fund incentives, education programs, and demonstration projects; usually they are raised as a $/kWh charge on consumer utility bills, and thus they do not affect the general state budget. This is the reason why such funds have remained stable despite se-vere cuts in public spending across most states.
Local governments provide both financial and non-financial incentives. A popular new trend is a tax-credit policy meant to finance residential energy efficiency improvements, through municipal bonds that are repaid through property taxes. The financing is provided in exchange for a lien on the prop-erty.
The mentioned program has been successful because residents are not re-quested to have necessarily a good credit to get a loan, because the loan is secured against their property, and since the property serves as collateral, it is also ensured that the lender’s risk is eliminated, because energy efficiency retrofits cannot be removed in the case of non-payment, unlike solar panels. Another important benefit of this program is that homeowners do not have to regain their investment through home sale price if home ownership changes hands, since the loan lies in the property owner and not in the purchaser. This is a very valuable feature, because energy efficiency improvements, such as insulation, are usually invisible to prospective home buyers.
Another kind of local financing is through the Weatherization Assistance Pro-gram (WAP), which benefited from an expansion in funding by the federal American Recovery and Reinvestment Act of 2009.
The main target of WAP is to permanently reduce the utility bills of low-in-come residents by helping them pay for one-time energy efficiency improve-ments to their residence, rather than simply contributing to their bills, solu-tion that can only work in the short term.
The main target of WAP is simple: instead of contribute month-to-month to the utility bills, this program is meant to be a long-lasting help to the low-in-come residents, by supporting the payment for one-time energy efficiency upgrades to their houses.
A secondary goal is to extend the number of jobs related with the renewable energies, known as “green jobs”, by basically expanding the market for ener-gy audits and efficiency retrofits.
Local governments can also influence building efficiency through non-fi-nancial incentives. In states with building codes that do not authorize local alterations, localities can encourage energy efficiency in the private sector
Chapter 1 - energypoliCy: aninternationaloverview
46
by providing both financial disbursements and, more frequently, zero-cost incentives, such as expedited permitting.
For example one locality, Arlington (Virginia), grants density and/or height bonuses to buildings that achieve LEED-certification. The effectiveness of this small group of geographically dispersed incentives has not been evaluat-ed in the NREL report.
Louisiana provides many incentives in several sectors to help people and corporations moving to renewable, most of them are aimed at supporting the purchase of efficient household appliances and also at contributing to the payment of the utility bills.
New Orleans City Council established in 2010 a rebate program called “En-ergy Smart Program”, in cooperation with Ent“En-ergy Inc., which provides en-ergy audits and cash rebates to who invest in qualifying enen-ergy efficiency improvements, through energy assessments and valuable cash rebates on a variety of energy efficiency improvements.
In Appendix A are listed some of the financial incentives that are available in New Orleans, from the federal to the state to the local level.
1.7 Policy development in the rest of the world
Over 150 countries have adopted specific policies for renewables-based pow-er, 75 have policies for renewables-based heat and 72 for renewables in trans-port (IEA, 2016).
Power sector policies are evolving, as the status of renewables matures: ini-tial policies were targeted at bridging a large cost gap, but recent initiatives have moved towards reducing the risks of capital-intensive investments. In May 2016, Japan amended the terms of its feed-in tariff to require
au-thorized projects to have connection contracts with power companies by no later than end-March 2017 or they will be cancelled. Over 100 GW of solar PV projects have been approved to date, with around 30 GW having been installed by the end of 2015, so the remaining 70 GW are subject to the new deadline (IEA, 2016).
In February 2016, India released state-specific targets consistent with its na-tional aim of a 17% Renewable Purchase Obligation (RPO) level by 2022. The government has also accelerated the approval of large-scale solar PV projects through its Solar Park initiative, which aims to support the creation of the necessary infrastructure to enable the establishment of concentrated zones of development of solar power generation projects (around 20 GW of new capacity has been approved so far) (SECI, 2016).
C
hapter2
Life Cycle Assessment method
2.1 Origin and development of the LCA
Life Cycle Assessment (LCA) have had different names before assuming this title. This methodology was in fact known with other words, such as life cycle analysis, cradle to grave analysis, resource and environmental profile analysis, eco balance, energy and environmental analysis, etc.
When this approach was created, it represented an absolute newness, since until then to reach the efficiency improvements, the researchers had been focused on the single components of the manufacturing process, and they did not consider that often the improvements obtained analyzing separately the single processes could be only apparent.
For instance, a single industrial operation can be made more efficient or cleaner at the expenses of others, simply moving the pollution in the space or time, overlooking the fact that the benefits obtained locally can offset the is-sues that therefore are generated elsewhere (or later in the timeline), with the final result to obtain no real improvement or even worsen the total balance. Moreover, the LCA approach distance itself from the model typically pre-ferred by economists, which used to consider the partition of the industry in
Chapter 2 - Life CyCLe assessmentmethod
50
sectors (mining, building, machinery, etc.); the new approach, instead, was based on the analysis of the compliance of specific purposes for each manu-facturing and services sector; for example, in the case of milk distribution are included: food industry, packaging industry, paper industry, and so on.
Since 70’s there are the first examples of application of the Life Cycle Think-ing theory, used as backThink-ing by big American companies, such as EPA (En-vironmental Protection Agency); the purpose was to compare different ma-terials for the same uses, and this was the opportunity which increased the number of LCA analysis applied to the manufacturing processes: compare corresponding performances with different solutions and materials, from an environmental point of view.
This method, more than introducing the idea of valuate the environmental consequences during the whole life cycle of the process, presented the eval-uation of the energy consumption, intended as belonging to the category of natural resources, and thus stimulate the attention to the concept of the short-age of natural supplies.
Some studies of global models were published in the book “The Limits to Growth” (Meadows et al., 1972), in which the authors tried to foresee in what way the population growth could influence the raw materials and ener-gy demand. The outlook of a quick depletion of fossil fuels and eventual cli-mate change, due to the excess of heat released in the air by the combustion processes, pushed towards calculation of energy consumption and towards industrial waste. In that period the oil crisis had not exploded yet, but despite, the awareness that they were exploiting limited energetic resources, was al-ready sufficiently developed that induced researchers from the academic and industrial world to face those issues.
Afterwards, the increasing levels of pollution, the pressure from the environ-mental movement, the issues due to the end use of waist, contributed to push
the common effort to the tuning of new methodologies and tools which could modify the typical approach of the classic economic theory to this kind of phenomenon.
In the late ‘80s, this brought to the achievement and diffusion of the concept of “sustainable development”, defined for the first time in the document “Our Common Future”, by the World Commission on Environment and Develop-ment (1987), as the “developDevelop-ment that meets the needs of the present without compromising the ability of future generations to meet their own needs”. Given that there are no cost-effective production processes at an energy and environmental point of view, the approach to be taken is to understand the dynamics of operation of the different processes in order to be able to pro-pose corrective improvement actions.
In the same period, in Europe, Boustead and Hancock published the Hand-book of industrial energy analysis (1979), which, from the experience of some bottle manufacturer, could offer for the first time an operating descrip-tion of the analytical process that is a fundamental part of the present LCA. This handbook is still considered as a milestone in the history of the method, in which we can find the first signals of the need of an integrated approach to the life cycle.
The word LCA was created only during the SETAC congress (Society of Environmental Toxicology and Chemistry) in Smuggler Notch (Vermont) in 1990, to better characterize the target of the analysis until then made with other names.
Moreover, in this occasion was proposed a framework divided in 3 main phases supposed to be executed cyclically (see Fig. 2.1), which represented the first structure of the LCA, and it still form the essential configuration of the method, except for an additional first step introduced afterward.
Chapter 2 - Life CyCLe assessmentmethod
52
The first one is an inventory phase, in which the information and data collect-ed are organizcollect-ed and convertcollect-ed into a standard form in order to describe in detail the physical characteristics of the system studied (that is the analogical model of the system); the next phase involves the interpretation of inventory data, which are related and linked to environmental issues; in the end there’s the improving phase, in which the manufacturing system is subject to analy-sis and simulations in order to try and improve the overall efficiency.
In early ‘90s many proposals were actualized, in order to find a standard-ization of the LCA method through the publication of handbooks and spe-cific papers, computing tools and database for a practical use; these tools nowadays are widespread and used by most researchers and operators in the industry.
To the present day, the LCA is increasingly acclaimed and it is becoming an essential tool for calculating the environmental load of production systems, enabling, thanks to the many applications and experiences, to increase the degree of diffusion of the topics dealt with.
The European Commission considers this approach as the only one able to provide a scientific and reliable basis to evaluate the environmental impacts Fig. 2.1: The three main phases of an LCA, as proposed during the SETAC congress (1990).
of products and processes in a global perspective.
The maturity and unification of the methodology are evidenced by the release, by ISO and its Technical Committee 207 (TC207), of the technical regula-tion of the ISO 14040 “Environmental management - Life cycle assessment - Principles and framework”, which concerns several issues related to many aspects of business environment management, meeting the needs expressed by companies, governments, non-governmental organization (NGO), manu-facturers, who started drafting voluntary certification for their products, and by consumers themselves.
ISO published more standards and technical reports concerning the environ-mental labels and the Life Cycle Analysis method, as illustrated in Table 2.1.
ISO 14041, ISO 14042 and ISO 14043 were updated in 2006 and merged into ISO 14044.
At the manufacturing level, the most important industry associations in Eu-rope and the world have already made public or are developing databases to provide lifecycle data and information about the materials and processes they represent.
In United States, The U.S. Department of Energy and NREL (National Re-Table 2.1: ISO publications on Life Cycle Analysis.
Chapter 2 - Life CyCLe assessmentmethod
54
newable Energy Laboratory) developed the U.S. Life Cycle Inventory (LCI) Database in 2003 with input from a variety of partners, to help LCA manu-facturers, building designers, and developers to answer questions about en-vironmental impact and select energy-efficient and enen-vironmentally friendly materials, products, and processes for their projects.
This LCI Database Project was initiated on May 1, 2001, and gained national prominence at a meeting of interests hosted by the Ford Motor Company. Funding agencies and representatives of industrial, academic, and consulting communities voiced strong support for the project. As a result, an advisory group with 45 representatives from manufacturing, government, and non-government organizations, as well as LCA experts, worked together to create the U.S. LCI Database Project Development Guidelines. NREL maintains and updates the database with support from the Building Technologies Of-fice, which funds ongoing research in life cycle assessments to expand the available data (NREL, 2012).
In Italy, after Anpa’s experience (Agenzia nazionale per la protezione dell’ambiente, then Apat, now Ispra) the Italian I-LCA database was pub-lished in 2000, an indicator of intense activity both at the company level and in research projects funded largely by the European Commission, although currently it is no longer compatible since its structure and content does not conform anymore to the standards of publicly available databases and would need to be up-to-date.
The availability of a national LCA database, up-to-date, publicly available and usable, can be a major asset for the application of sustainability policies in Italy. For these reasons, in February 2014, the Ministry of the Environ-ment, with the technical and scientific support of ENEA, created a demon-stration of an Italian database, which is currently the agri-food sector, which
is the first national nucleus of Life Cycle Data Network, a system that aims to network European and non-European databases using similar quality criteria and methodological coherence.
2.2 Definition
It is suitable, before describing in detail the framework of a LCA, to report a few definitions in order to better contextualize the topic.
ISO 14040 describes the LCA as “compilation and evaluation of the inputs, outputs and the potential environmental impacts of a product system through-out its life cycle”
A LCA applied to an industrial system therefore addresses the efficiency study of the system in question to the protection of the environment and human beings, as well as to the saving of resources. The essential point of the theory is the definition of this “industrial system” that the ISO standard identifies with a “product system”; furthermore, it is necessary to specify that the life cycle analysis does not coincide with a product life cycle analysis. A LCA describes the system that generates these products or, in other words, the function of the system itself: ISO norms regard a product system to in-dicate precisely “collection of unit processes with elementary and product flows, performing one or more defined functions, and which models the life cycle of a product”.
Ultimately, it should be highlighted that an LCA is always a simplification of real processes because, as a model, it does not include a complete representa-tion of all interacrepresenta-tions and exchanges with the environment but only of those considered to be more significant by those conducting the study, in order to make comparisons between different choices.