POLITECNICO
DI
MILANO
Scuola di Ingegneria Civile e Ambientale
Corso di Laurea in Ingegneria
per l’Ambiente e il territorio
Autotrophic Process for Nitrogen Removal from Biowaste
Digestate
Relatore: Ing. Elena FICARA
Co-relatori: Ing. Davide SCAGLIONE
Ing. Tommaso LOTTI
Prof. Juliàn CARRERA MUYO
Tesi di Laurea di:
Ottavia BURZI
Matricola 820023
Ringraziamenti
Ringrazio in primo luogo la Prof.ssa Ficara, che mi ha aiutato da remoto e da vicino, con la sua competenza e la sua pazienza.
Debo agradecer el profesor Juliàn Carrera y el Doctor Carlos Ramos por el ayudo y todas las cosas que me ensenaron. “Sin miedo”.
Ringrazio mia mamma e mio papà, i miei modelli di lavoratori. Sono tutto il sostegno e la cieca fiducia che mi hanno sempre dato che mi hanno permesso di arrivare fin qui. Ringrazio mia zia Silvia e mio zio Walter, le loro risposte e i loro consigli sono sempre arrivati nel momento giusto.
Ringrazio Tommaso e Davide, correlatori e amici di anammox. Delirio. E poi vorrei ringraziare i miei amici.
I poliamici, Federica, Anna, Giulia, Marco, Roberto, Davide, Simone. Quelli di sempre, Paolo, Enrico, Cecilia, Silvia, Giulia e Andrea Giulia. Quelle dell’Olanda, Adele, Isabella e Veronica.
Quelle del martedì, Gaia, Carol e Marta. Quelli di Civitanova, Luca, Carlo, Fede e Bea.
Mis amigos de Barcelona, Alba, Pedro, Jose y Victor.
My innovative friends from the Asp, Eleonora, Silvia, Nicoletta e Francesco. Se questi anni sono stati bellissimi, è grazie a voi.
Infine, ringrazio la mia persona preferita. Sarà la cosa che mi mancherà di più. Anche perché so che oggi sarebbe stata la più felice di tutti.
Index
1 Abstract ... 8
2 SOMMARIO ... 10
3 Nitrogen ... 13
3.1 The nitrogen cycle and its alteration ... 13
3.2 Traditional nitrogen removal processes: Nitrification/ Denitrification ... 13
3.2.1 Nitrification ... 14
3.2.2 Denitrification ... 14
3.3 Alternative processes ... 14
3.3.1 Nitritation/Denitritation ... 15
3.3.1.1 Achievement of nitritation process ... 15
3.3.2 The PN / anammox process ... 17
3.3.3 Achievement of a stable partial nitritation process ... 18
3.3.4 Stoichiometry and comparison with conventional nitrification/denitrification ... 19
Main inhibitors to the anammox process ... 21
3.3.5 Different process configurations: one stage and two stages ... 22
3.3.5.1 Single stage configuration ... 23
3.3.5.2 Two stages configuration ... 23
3.3.6 Main advantages of granular systems ... 25
3.3.7 Experiences of high salinity wastewaters with PN and anammox, a review ... 25
3.3.8 Full scale implementations ... 26
4 Literature Review ... 29
4.1 OFMSW: production collection and treatment ... 29
4.2 Italian situation: organic waste generation ... 29
4.3 Anaerobic digestion to treat OFMSW ... 30
4.3.1 Anaerobic digestion in Italy ... 30
4.3.2 Treatment schemes ... 31
4.4 The Italian case study ... 31
5 Materials and Methods - Working Package I ... 33
5.1 2.1 Experimental setup and reactor ... 33
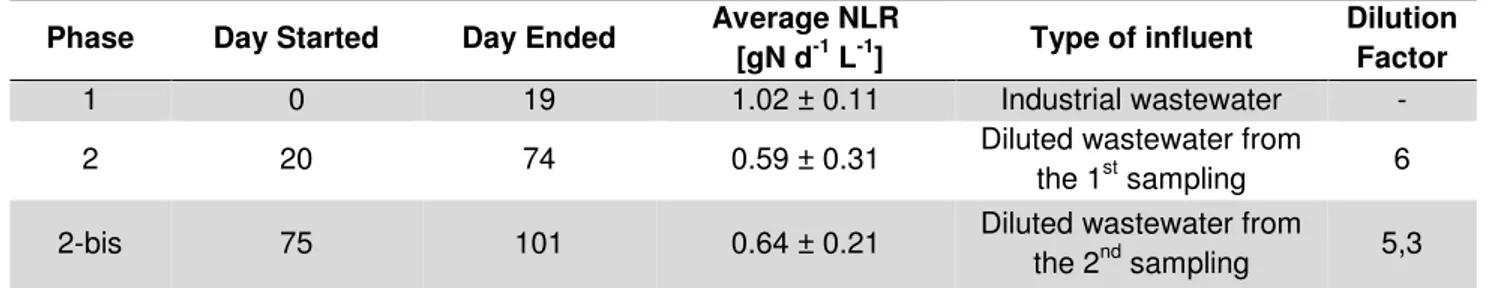
5.2 The tested influents ... 34
5.2.1 First phase: the industrial wastewater ... 34
5.2.2 Second phase: origin of the wastewater ... 34
5.2.3 Sampling, characterization ... 35
5.3 Operational plan ... 36
5.3.1 Inoculum and operation before experimentation ... 36
5.3.2 Experimental Phases ... 36 5.3.3 Operating conditions ... 37 5.3.4 Control strategies ... 37 5.3.5 Monitoring plan ... 38 5.4 Analytical methods ... 38 5.4.1 VS and TS ... 38 5.4.2 Ammonium ... 38
5.4.3 Nitrite and nitrate ... 39
5.4.4 TOC ... 39
5.4.5 FISH ... 39
5.4.6 Granules diameter distribution ... 40
5.4.7 Sludge Volumetric Index (SVI) and settling velocity ... 40
5.4.8 Specific Anammox Activities (SAA): manometric test ... 41
5.4.9 2.4.11 N2O measurement ... 43
6 Material and Methods – Working Package II ... 43
6.1.1 The Sequencing batch reactor ... 43
6.2 The tested influent ... 45
6.2.1 Origin ... 45 6.2.2 Sampling, characterization ... 46 6.3 Operational Plan ... 46 6.3.1 Inoculum ... 46 6.3.2 Experimental phases ... 47 6.3.3 Operating conditions ... 47 6.3.4 Monitoring plan ... 48
6.3.5 Activity determination – batch test in the reactor ... 48
6.4 Anammox inhibition tests ... 49
6.4.1 Inoculum ... 49
6.4.2 Tested influents ... 50
6.4.3 Method ... 50
6.4.4 Data processing ... 51
6.5 Analytical methods ... 53
6.5.1 Nitrite, nitrate, ammonium and COD ... 53
6.5.2 VSS and TSS ... 53
7 Results and Discussion - Working Package I ... 54
7.1.1 Comparison between the characteristics of the Italian and Spanish digestate ... 54
7.2 The partial nitritation process ... 55
7.2.1 Control strategies and issues ... 55
7.2.2 Results of the operation of the gas-lift reactor ... 56
7.2.2.1 Protein hydrolysis ... 59
7.2.3 Analysis of the stability of the reactor: maintenance of granulation ... 60
7.2.3.1 Biomass concentration in the reactor ... 61
7.2.3.2 SVI and settling velocity ... 61
7.2.3.3 Diameter of the granules inside and in the outflow ... 62
7.2.4 N2O determination ... 63
7.2.5 Specific Anammox Activity ... 64
7.2.6 Identification of microbial species in the granules ... 65
7.3 Comparison with literature values ... 65
7.3.1 Successful PN through DO/TAN ratio control systems ... 65
7.3.2 Experiences of similar influents ... 66
7.3.3 Future perspective for the stability of the process ... 69
8 Results and discussion - Working Package II ... 69
8.1 Phases and reactor: influent and effluent concentrations of main parameters... 69
8.2 Batch activity tests... 75
8.2.1 Activity in the manometric batch tests ... 75
8.2.2 Comparison between the obtained values ... 78
8.2.3 Literature review, a comparison ... 79
8.3 Analysis of the biomass in the reactor ... 82
8.3.1 Biomass concentration ... 82 8.3.2 Granules diameter... 82 8.3.3 Settling velocity ... 83 9 Conclusions ... 83 10 References ... 86 11 Appendix ... 91 11.1 Solutions employed ... 91
11.2 Regression for the conversion of salinity to conductivity ... 91
11.3 Granulometric distribution in the PN reactor ... 92
11.4 N2O emission rate determination ... 95
Index of Tables
Table 1 Examples of PN lab scale studies ... 17
Table 2 Comparison between different nitrogen removal processes (Adapted from Van Hulle et al., 2010) ... 20
Table 3 Full-scale applications of the anammox process, both in single and two stage. The table was adacted from Lackner et al. (2014) ... 27
Table 4 Characterization of the effluent of the anaerobic digester of the Ecopark used as wastewater in these study ... 34
Table 5 A summary of the experimental phases ... 35
Table 6 Probes used for targeting the specific microorganisms ... 39
Table 7 Characterization of the average effluent from the AD digestion plant in the north of Italy .. 45
Table 8 A summary of the experimental phases ... 46
Table 9 A synthesis of the manometeric tests carried out. Tests performed using the same biomass sampled from the storage tank are merged together ... 50
Table 10 Comparison between the raw wastewaters used in the two WP ... 53
Table 11 A comparison between the Italian and Spanish digestate in terms of metals ... 53
Table 12 Parameters of the regression model ... 59
Table 13 Biomass concentration in the reactor during the whole operational period ... 60
Table 14 Biomass characterization in terms of SVI and settling velocity ... 60
Table 15 Literature values for SVI and settling velocity ... 61
Table 16 Biomass diameter determination ... 62
Table 17 Summary of the obtained Specific Anammox Activities ... 64
Table 18 Literature examples of application of PN process to similar influents ... 67
Table 19 Summary of the average observed stoichiometric removal ratios ... 73
Table 20 Calculation of the stoichiometry and estimation of the heterotrophic activity ... 74
Table 21 Results of the manometric tests carried out ... 74
Table 22 Experiences in literature of similar influents treated with the anammox process in different configurations. Stoichiometric removal ratios are reported along with nitrogen loads. Conductivity is reported when available. When not reported in the study, it was calculated through the following relation: cond [mS cm-1] =[NaCl] conc*1.58 + 0.39 ... 79
Table 23 Biomass concentration at different operational time ... 81
Table 24 A typical correlation between salt concentration and conductivity at 25°C ... 90
Index of Graphs
Graph 1 The operational NLR in time with the moving average over three days ... 37Graph 2 Nitrogen production in time, it is also reported the line of the maximum slope of the graph ... 42
Graph 3 The value of the NLR and of the conductivity in time with the moving average over three days ... 48
Graph 4 The determination of the maximum nitrogen consumption in the reactor ... 49
Graph 5 The typical trend for overpressure measurement from the OxiTop system data in time. The residual pressure increase after all the substrate has been consumed is due to heterotrophic activity. In order to determine the specific anammox activity, this contribute is to be subtracted to the total pressure increase measure. ... 52
Graph 6 Example of processed data: the rate of nitrogen gas production and of nitrite consumption during the test. After the injection of the substrates there is a small interval in which the biomass adaptation, consequentially the plateau of the curve represents the maximum activity of the anammox biomass (SAA). ... 53
Graph 7 Ammonium concentration in the influent and the trend of N forms' concentrations in the effluent throughout the whole experimental period are reported. The observed nitrite concentration higher than the ammonium load will be explained in 5.2.2.1 ... 57
Graph 8 The ratio between nitrite and ammonium and the DO/TAN against time... 58 Graph 9 Nitrite, nitrate and ammonium concentration in the effluent and in the influent during the
course of the experimentation. ... 70 Graph 10 observed NRR in time and with different conductivity values on the secondary axis ... 72 Graph 11 The maximum nitrogen removal rate throughout the whole experimental period.
Conductivity is also reported on the secondary axis. ... 71 Graph 12 Observed stoichiometric ratio throughout the whole experimental period. Along with
punctual values, theoretical stoichiometric values are also provided ... 73 Graph 13 The observed inhibition values as function of the conductivity. An increases in
conductivity immediately reduces the activity of the biomass. For a value higher than 16 mS cm-1 almost no nitrogen production was detected. ... 76
Graph 14 The fitting of the data with a non-competitive inhibition model. The value of IC50 I, for
which the activity of the biomass is halved, is also reported in the graph. The interpolation was achieved a no-linear regression on the experimental data. ... 77 Graph 15 The distribution of the particle size. The unimodal distribution is a clear index that the
granular system was not affected from the wastewater ... 83 Graph 16 Relative class abundances for the two experimental phases ... 97
1
Abstract
The organic fraction of municipal wastes represent the 35% of total wastes production in Europe. Composting and anaerobic digestion of those wastes are the most sustainable alternatives for dealing with those wastes. Anaerobic digestion allows both the recovery of energy and material through biogas production and digestate generation (that can be used as fertilizer once stabilized) respectively.
However, the treatment of the liquid fraction of the digestate is highly expensive thus limiting the exploitation of the whole process.
The main objective of this study is to evaluate the feasibility of the application of an innovative treatment such as the biological autotrophic nitrogen removal to the liquid fraction of the digestate with the final purpose of promoting the energetic valorization of the organic fraction of urban wastes through its anaerobic digestion.
The biologic process, completely autotrophic, is made up of two stages: in the firs one (Partial Nitration PN) anout half the amount of ammonium is oxidated to nitrate in an aerated tank by ammonium oxidinzing bacteria (AOB); the effluent from the process is then fed to second stage (anammox process): here, forced anaerobic bacteria use the left ammonium and nitrite from the first stage for their growth thus producing molecular nitrogen that is discharged in the atmosphere, thus completing the removal of the nitrogen part of the waste.
The work is split in two work packages (WP): the first one was carried out at the Universitat Autònoma de Barcelona and the second one at the Politecnico di Milano.
Working package I: Partial Nitritation
The activity consisted in the operation and monitoring of an air-lift reactor with granular biomass where the partial nitration process takes place. The PN reactor was fed on the liquid fraction of the digestate from anaerobic digestion of organic wastes.
The monitoring activity included the determination of the main input and output parameters (nitrogen compounds concentration, organic matter and suspended solids): Moreover, specific tests were performed to determine the main kinetics of the process in/ex reactor. The obtained data provided information on the stability of the process and on the possibility of the suppression of the NOB, catalizing the (unwanted) nitratation process. Finally, the inhibiting effect on the bacteria that catalyze the partial nitration process in the medium and long term was evaluated.
At the end of the 101 days of operation, the effluent from the partial nitritation reactor with an applied nitrogen loading rate of 0.61 mg N L-1d-1 was showing a stoichiometric ratio of 1.49, with an average TOC removal efficiency of the 44% and TOC/ammonium ratio in the effluent of 0.57 gTOC gN-1 , achieving a suitable influent for an anammox reacotr.
Moreover, the mentioned effluent was tested in a specific anammox activity test achieving an inhibition value of the 20%.
Similarly to what was done in the first phase, the activity in Milano, concerned the management and monitoring of an anoxic SBR reactor with anammox granular biomass, fed on the supernatant from a fill scale anaerobic digestion treating biowastes to which nitrite and ammonium were supplemented in order to achieve a desired concentration and nitrite to ammonium ratio so to mimic the chemical composition that would be obtained by PN process. The aim was to evaluate the process kinetics and the potential inhibition on the anammox biomass in the medium and long term.
The treatment of the real wastewater was performed at different dilution factors, with decreased removal efficiencies with higher concentrated influent. Particularly, in the most successful phase (1:2 dilution) the average nitrogen removal rate was 370± 95 mg N – NO2- L-1d-1 with a removal efficiency of the 98%.
Adaptation phenomena of the biomass were observed and a further confirmation of the feasibility of the treatment was achieved through specific anammox activity tests.
2
Sommario
Obiettivi generali
La frazione organica dei rifiuti urbani (FORSU) è costituita dalla frazione umida (scarti di cucina domestici, ristoranti, mense etc.) e verde (sfalci d’erba, potature etc.). Questa frazione rappresenta circa il 35% della produzione complessiva di rifiuti urbani in Europa. Tra le tecniche di smaltimento della FORSU a basso impatto ambientale si annoverano la digestione anaerobica e il compostaggio. Tra le due la digestione anaerobica é considerata più efficiente dal punto di vista ambientale per le sue caratteristiche di processo: le reazioni sono di tipo anaerobico e producono sia compost, che può essere riutilizzato come fertilizzante previa stabilizzazione aerobica, sia biogas composto prevalentemente da metano, che è utilizzato per produrre elettricità e calore nei motori a cogenerazione (CHP). La digestione anaerobica consente quindi di produrre un gas ad alto potere calorifico a partire dall’energia chimica associata ai composti organici presenti nella FORSU, al contrario del processo di compostaggio che richiede energia per essere completato, ed è il motivo per il quale la sua applicazione sulla frazione organica dei rifiuti risulta interessante. Il trattamento della componente azotata della frazione liquida del digestato, principale prodotto di scarto della digestione anaerobica, risulta tuttavia molto oneroso limitando di fatto lo sviluppo di tutta la filiera di recupero energetico dalla FORSU. L’obiettivo generale di questo studio é pertanto quello di valutare l’applicabilitá di un processo innovativo altamente efficiente come il processo biologico completamente autotrofo di nitritazione parziale/anammox al trattamento della frazione liquida del digestato da FORSU con lo scopo ultimo di promuovere la valorizzazione energetica della FORSU tramite sua digestione anaerobica.
Obiettivi specifici
Il processo biologico completamente autotrofo si compone di due stadi distinti posti in cascata: nel primo stadio (nitritazione parziale, PN), circa la metá della componente ammoniacale del refluo viene ossidata a nitrito in ambiente aerato ad opera di batteri ammonio ossidanti (AOB); l’effluente del processo di nitritazione parziale viene quindi alimentato al secondo stadio (processo anammox) dove batteri anaerobici obbligati usano l’ammoniaca restante ed il nitrito prodotto nello stadio precedente per il proprio sostentamento risultando nella produzione di azoto molecolare che viene liberato in atmosfera, chiudendo cosi il processo di rimozione della componente azotata dal refluo trattato. Lo studio in oggetto si divide in due work package (WP) svolti rispettivamente nei laboratori dell’Università Autonoma di Barcellona e del Politecnico di Milano, i cui rispettivi obbiettivi specifici sono qui di seguito riportati:
WP1. Processo PN: analizzare le cinetiche batteriche e le potenzialitá di processo, la qualitá dell’effluente prodotto da un reattore di PN alla scala laboratorio in termini del rapporto finale di concentrazione nitrito/ammonio in vista del suo accoppiamento col processo anammox, monitorare la presenza/attività di batteri nitrito ossidanti (NOB) catalizzanti il processo (indesiderato) di nitratazione; analizzare e quantificare eventuali fenomeni di inibizione dovuti a sostanze presenti nel refluo e/o a suoi ossidati prodotti di ossidazione;
WP2. Processo anammox: analizzare le cinetiche di processo e la sua stabilità, la qualità dell’effluente prodotto da un reattore anammox alla scala laboratorio in termini di concentrazione di azoto; analizzare e identificare eventuali fenomeni di inibizione dovuti a sostanze presenti nel refluo e/o a suoi prodotti di degradazione prodotti nel precedente processo di PN.
Contenuto Scientifico
Valutando la tipologia di refluo oggetto dello studio (con alto contenuto salino e di solidi colloidali) e sulla base di quanto pubblicato nella letteratura tecnico-scientifica (Fernández et al., 2008; Vyrides and Stuckey, 2009; Lotti et al., 2012; Hu et al., 2013; Lackner et al., 2014), si ritiene che delle alternative tecnologiche ad oggi disponibili (impianti a biomassa anammox granulare, sospesa o adesa) la soluzione granulare possa assicurare maggiore efficacia e garanzie di continuità di funzionamento. Ciò per i seguenti motivi: a) l’aggregazione della biomassa in granuli ha un effetto protettivo nei confronti dei batteri presenti al suo interno, che, in caso di reflui con elevate concentrazioni di Sali o di potenziali sostanze inibenti, costituisce un vantaggio non trascurabile rispetto alle altre forme di aggregazione; b) i granuli hanno una conformazione compatta e presentano una elevatissima velocità di sedimentazione (da 15 fino a 90 m/h) e ciò consente un facile disaccoppiamento del tempo di ritenzione idraulico dal tempo di ritenzione dei granuli e comporta la possibilità di operare con una concentrazione di microrganismi elevata e quindi con reattori molto compatti.
Inoltre il processo biologico completamente autotrofo che sfrutta la conformazione granulare della biomassa viene per la prima volta applicato a digestati derivanti dal trattamento anaerobico della FORSU.
Obiettivi della sperimentazione
Obiettivo 1: Verificare la fattibilità dell’applicazione del processo innovativo di rimozione autotrofa dell’azoto al trattamento della frazione liquida del digestato da FORSU, investigando distintimente i due processi in cascata che lo compongono: nitritazione parziale e anammox.
Obiettivo 2: Ottenere dati di interesse pratico/operativo quali la valutazione dei carichi di azoto applicabili ai reattori granulari studiati e le corrispondenti rese di rimozione dell’azoto.
Descrittivo delle attività svolte
Attività svolte presso l’Università Autonoma di Barcelona
L’attività ha riguardato principalmente la gestione e il monitoraggio di un reattore air-lift a biomassa granulare nel quale si è realizzato il processo di nitritazione parziale alimentato da digestato derivante dalla digestione anaerobica della FORSU. A questo scopo si è sfruttata la disponibilità del reattore di nitritazione parziale a biomassa granulare già presenti ed operativi presso il laboratorio di GENCOV di cui il Prof. Juliàn Carrera è a capo nonché l’esperienza del suo gruppo di ricerca nella gestione di questi reattori.
Il monitoraggio ha riguardato la determinazione dei principali parametri di interesse (concentrazione delle specie azotate, della sostanza organica e dei solidi sospesi) in
ingresso ed in uscita dal reattore. I dati raccolti consentono di ottenere informazioni sulla stabilità del processo di nitritazione parziale ed in particolare sulla possibilità di garantire una efficiente soppressione dei batteri nitrito ossidanti (NOB) catalizzanti il processo di nitratazione nonché di valutare i potenziali effetti inibitori sui batteri che catalizzano il processo di nitritazione parziale a medio e lungo termine.
Al termine dei 101 giorni di operazione, l’effluente del reattore di nitritazione parziale a cui era applicato un carico di 0.61 mg N L-1d-1 mostrava un rapporto ammonio/nitrito pari a 1.49, con una rimozione del TOC del 44% e un rapporto di TOC/ammonio effluente di 0.57 gTOC gN-1 , raggiungendo un influente idoneo per un processo anammox.
Inoltre, si è testato il suddetto effluente in una prova specifica di attiità anammox ottenendo valori di inibizione pari al 20%.
Attività svolte presso il Politecnico di Milano
Similmente a quanto svolto nella prima fase, l’attività presso il Politecnico di Milano, a completamento del progetto ha riguardato la gestione e monitoraggio di un reattore anossico SBR a biomassa granulare alimentato da un refluo reale con aggiunta di nitrito (refluo semisintetico) per la valutazione delle cinetiche di processo e degli effetti inibitori sulla biomassa anammox a medio e lungo termine.
Anche in questo caso si sono utilizzati reattori già operativi presso il laboratorio di ingegneria sanitaria del DICA sfruttando l’esperienza pregressa del gruppo di ricerca nella gestione di reattori anammox granulari.
Il trattamento del refluo reale è stato effettuato a diversi fattori di diluizione, con efficienze di rimozione tanto più basse quanto più il refluo era concentrato. In particolare nella fase più performante (influente diluito 1:2) il carico di azoto rimosso medio era 370± 95 mg N – NO2- L-1d-1con un’efficienza pari al 98%.
Fenomeni di adattamento della biomassa sono stati osservati e una conferma ulteriore della trattabilità si è ottenuta attraverso prove di attività specifica anammox.
3
Nitrogen
3.1 The nitrogen cycle and its alteration
Nitrogen forms the 78% of Earth’s atmosphere and is the most abundant uncombined element. However, due to the extremely strong triple bond in the elemental nitrogen, atmospheric nitrogen cannot be used as such and has to be converted to reactive Nitrogen (Nr).
Currently, mankind has almost doubled the amount of Nr (reactive nitrogen) converted
from N2. The superfluous nitrogen accumulates in soils, water, atmosphere and biomass.
Once lost to the environment, this nitrogen migrates through the Earth's atmosphere, forests, grasslands and waters, causing a cascade of environmental changes that negatively impact both people and ecosystems. These changes include smog, acid rain, forest dieback, coastal 'dead zones', biodiversity loss, stratospheric ozone depletion, and an enhanced greenhouse effect (Galloway et al. 2003). According to Sutton et al. (2011) the excess nitrogen in the environment can cost between 70 and 320 billion euro per year for the European Union.
The global population growth trend will increase this issue in the following years.
Nitrogen is present in different oxidation states and the inter-conversion from one form to the other is performed through biologic reactions carried on by specific microorganisms that need nitrogen as election accepter or donor.
Those processes can be engineerized and implemented in wastewater treatment in order to promote the removal of ammonium or organic nitrogen, that are the most common form of nitrogen in municipal wastewaters.
The most consolidate process for nitrogen removal are:
Nitrification/Denitrification. Ammonium is oxidized to nitrate and nitrate is consequentially reduced to nitrogen gas
Nitritation/Denitritation. Ammonium is oxidized to nitrite and nitrite is consequentially reduced to nitrogen gas
Partial Nitritation /Anammox. Partial oxidation of ammonium to nitrite and utilization of both nitrite and ammonium in the anammox metabolism to produce denitrogen gas.
3.2 Traditional nitrogen removal processes: Nitrification/ Denitrification
This is a mature technology and it is also the most widespread process in municipal wastewater treatment. In the first step ammonium is oxidized to nitrate (nitrification) that is then reduced to nitrogen gas with the need for an organic substrate as electron donor. Results of this process are the mineralization of organic carbon to CO2 as well as the
3.2.1 Nitrification
In the nitrification process ammonium is firstly converted to nitrite (nitritation) by AOB (ammonium oxidizing bacteria) and then to nitrate (nitratation) by NOB (nitrite oxidizing bacteria). Those bacteria are autotrophic – thus meaning that there is the need of an external inorganic carbon source.
Those reactions are respectively:
++ → −+ ++ −+ → −+ ++
The overall reaction, comprehensive of the required alkalinity is:
++ + − → −+ +
It can be noticed that there is alkalinity, oxygen and inorganic carbon consumption.
3.2.2 Denitrification
In this process nitrite and nitrate are converted to gaseous N2 by facultative anoxic
heterotrophic bacteria. The anoxic environment allows nitrates to be the electron acceptor of the process with the contemporary biologic degradation of the organic substrates.
Hence the availability of ready degradable organic carbon is an important parameter to implement the process. One of the main operational costs of those processes is indeed the addition of an external carbon source (c-source), mainly methanol. The metabolic reaction is strictly dependent on the c-source, for example in the case of methanol is:
−+ → + + + −
Main advantages of the process are the long term and consolidated knowledge that results in a reliable and stable process management and easy process control (Tchobanoglous and Burton, 2003).
3.3 Alternative processes
3.3.1 Nitritation/Denitritation
Usually municipal wastewaters have an ammonium concentration lower than 100 mg N – NH4+ L-1 and nitrogen is eliminated through traditional nitrification/denitrification. However,
digestion effluents, landfill leachate and wastewaters from the food industry or particular industrial wastewater.
For a specific application, alternatives should be evaluated on the basis of economic, operational experiences, energy and chemicals requirements and environmental impact. Actually, the main driver in the choice of an alternative above another is the cost-effectiveness. For this reason, a nitritation/denitritation process is a valid alternative to conventional nitrification/denitrification because of its less oxygen and carbon demand (Mulder et al., 2011).
Another name for the process is DENO2 (Scaglione, 2012) or short-cut denitrification. The ratio behind this process is the role of nitrite as intermediate of both nitrification and denitrification. Hence, there is a first phase of nitritation in which ammonium is oxidized to nitrite and a second reaction of denitration with the reduction of nitrite to nitrogen gas. The name of this process comes from the fact that both nitratation and denitrification are avoided, allowing a “short-cut” in the biologic reaction.
++ . + − → − + + −+ + + → −+
The above reactions immediately suggest that lower amounts of oxygen and carbon are required to remove ammonium nitrogen if compared to those presented in 1.2.2 and 10. From the economic point of view, this results in savings in the amount of air blown in the reactor and in the external carbon source, respectively of the 25% and of the 40% (Turk and Mavinic, 1986).
3.3.1.1 Achievement of nitritation process
The bottleneck for the implementation of nitritation/denitritation is the out-competition of NOB bacteria whose kinetics are favored by the usual operating wastewater plant conditions process temperature, pH, and concentrations of the nitrogen forms.
In order to achieve this goal, the main parameters to be controlled are:
Temperature. It is complex to state the exact influence of temperature because it affects mass transfers, growth rates and chemical equilibria. However, the SRT in a reactor is function of the temperature as well. It was demonstrated that above 25°C the AOB bacteria maximum growth rate is higher than that of NOB (Hellinga et al., 1998), as it can be seen from Figure 1 where the minimum residence time (inversely proportional to the SRT) is represented against temperature. Therefore, above this temperature, the minimum SRT value for keeping NOB in the system is higher than the one for AOB that are thus the only population maintained in the reactor with NOB selectively washed out.
Figure 1Effect of temperature on the minimal required residence time for AOB and NOB. Above 25°C it is possible to wash out NOB (-) while manteining AOB (--). The picture was adapted from Hellinga et al. (1998)
Dissolved Oxygen (DO). There is accordance on the fact that NOB have a higher ks
(semi-saturation constant) than AOB thus meaning a lower affinity for DO. However, in literature different values have been calculated for this constant, ranging from 0.16-0.74 mg O2 L-1 to 0.54-2.5 mg O2 L-1 for AOB and NOB respectively (Guisasola
2005, Hunik 1994, Barnes 1983, Ciudad 2005). Such a variety of values can be explained with the differences in oxygen mass transfer efficiency for the different experimental setup. Indeed, the apparent O2 affinity is strictly dependent on the
experimental setup and therefore on biomass density, floc size, mixing intensity and the rate of oxygen in the floc. (Manser et al. 2005). As a general consequence it can be concluded that nitritation is favored at low DO (Pollice et al 2002, Ruiz et al 2003)
Free ammonia (NH3) and free nitrous acid (HNO2) concentration. These unionized
forms for a pH>8 and <7.5 are the actual substrates/inhibitor for ammonium and nitrite oxidation (Van Hulle et al., ). Indeed ammonium concentrations between 1-5 mg NH3-N L-1 inhibit nitratation but not nitritation (Abeling and Seyfried, 1992).
Knowing total ammonium nitrogen (TAN) and total nitrite (TNO2), free form
concentration can be calculated taking into account pH and temperature (acid-base equilibrium).
NH3 increases with increasing pH while HNO shows the opposite tendency, which
promotes AOB and suppress NOB. Hence a weak alkaline environment allows the outcompetion of nitrite oxidizers. In literature different threshold for inhibition have been calculated (Anthonisen et al. 1976), however they are once again function of the experimental setup that determines bacteria acclimation and response.
Relying on this strategy alone might not lead to a sufficient stability as NOB bacteria were found to be able to adapt to FA inhibition (Turk and Mavinic 1989), however it can still be coupled with others strategies (Peng and Zhu, 2006; Bartrolì et al., 2010).
pH. Despite the effect of pH being controversial, it is universally recognized that the optimum pH for both NOB and AOB lies between 7 and 8. In the first place, pH has
an effect on the equilibria between ionized and no ionized forms (NH4+-NH3 and
NO2—HNO2). AOB growth rate is higher in a slight alkaline environment, probably
because they use NH3 as substrate. Moreover, at pH 7 it was observed a eight fold
decrease in NOB bacteria growth rate, while AOB were not effected (Hellinga et al., 1998).
Those parameters are usually exploited to give stability to the process and they are usually combined. There are examples in literature of implementations where the process is successfully stopped at the nitritation stage (Canziani et al., 2006, Castro Daniel et al., 2008) even with complex influents (Peng et al., 2007).
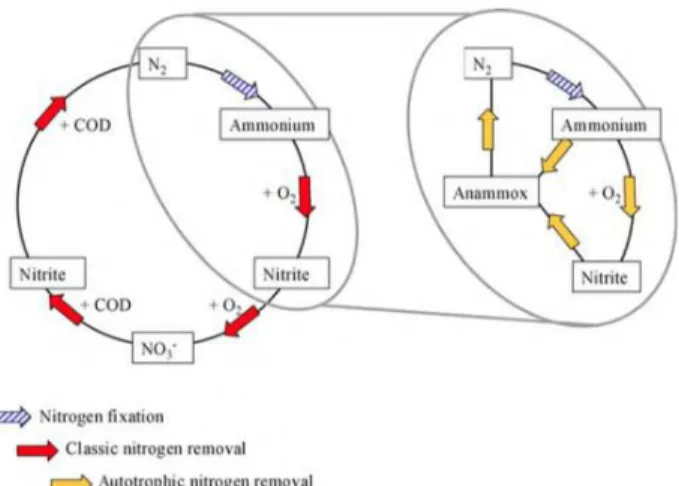
3.3.2 The PN / anammox process
Anaerobic ammonium oxidation (anammox) is the biological oxidation of ammonium with NO2- as electron acceptor producing N2 and NO3-. A more correct name for the process
would be “anoxic ammonium oxidation” (Van Hulle et al., 2010) since the electron acceptor of the process is nitrite. NO2- is not just oxidizing NH4+ but it is also oxidized to NO3 thus
providing the necessary reducing capacity to fix carbon to new biomass.
Anammox microorganisms are autotrophic, accordingly there is in no need for an organic C– source.
The simplified (and not balanced) reaction is as follows (Van Dongen, 2001):
++ − → +
A partial nitritation stage should be performed before the anammox process in order to achieve a suitable ratio between the two substrates.
The challenge of this step is the oxidation of just half the ammonium to nitrite and the prevention of its further oxidation to nitrate.
In order to prevent NO2- conversion to NO3 growth the strategies presented before in
1.3.1.1. The counter-ion of ammonium in the wastewater is one of the main factors to determine the conversion of just half of the ammonium present to nitrite. Particularly, nitritation is limited by pH when bicarbonate is present. Indeed, only half of the produced protons can be buffered by bicarbonate. Therefore, the ratio bicarbonate/ammonium in the wastewater determines the equilibrium pH that allows a conversion of ammonium between the 50 – 60% (Van Dongen et al., 2001)
The anammox process is particularly convenient for the treatment of high strength ammonium wastewaters with a ratio COD/N lower than 0.5 g COD g N-1 (Josse et al., 2009; van der Star et al., 2007). Examples are anaerobic digestion effluents, landfill leachate or digestate from food industry. However, Jenni et al. (2014) achieved the treatment of a wastewater with a C/N ratio of 1.4 gCOD gN-1 in a mixed culture (very close to typical stored urine ratio of 1.5 gCOD gN-1).
Figure 2 Representation of nitrogen cycle with the contribution of anammox bacteria (Van Hulle 2010)
3.3.3 Achievement of a stable partial nitritation process
In the following Table 1 some control strategies implemented at lab scale are presented, along with the setup and the NLR treated.
Table 1 Examples of PN lab scale studies
Reference NLR
[g N L-1 d-1]
Experimental
Set Up Control Method
Liang et al. 2010 0.26 Fixed bed biofilm reactor HRT, pH, low DO
Jin et al., 2013 1.19 Airlift RSM
1 to find the optimal combination of DO, Alk and influent ammonium
Shinohara 2009 3 Gel Carriers NOB inhibition by FA
Garrido et al, 1997 5 Airlift DO concentration
van Dongen et al.,
2001 0.36 CSTR alkalinity, temperature, DO
Fux et al., 2002 0.352 CSTR pH, DO
Wyffels et al., 2004 0.55 MBR Microfiltration (SRT), DO
Padin et al., 0.083 SBR ratio fresh/air recirculation (DO)
Ganigue et al (2010) 1.2 MBR alkalinity, step feed in order to reduce total N
A stable PN process is particularly important for the following anammox biomass because of its vulnerability from substrates’ high concentration as explained in 1.3.5.
The main configurations that have been used to achieve PN are: CSTR (completely stirred tank, also implemented by applying an air-lift mixing), MBR (membrane bioreactor) and SBR (sequencing batch reactor).
SBR. It was successfully implemented for the treatment of anaerobic sludge reject water and leachate (Galì et al. 2007, Vàzquez-Padin et al. 2009, Ganiguè et al.
1 Response surface metholodogy
2 experiments were carried out at temperature as low as 24° 3at temperature as low as 24°
2006). They all controlled the process with the available alkalinity and oxygen limitation, Galì set manually the proper SRT as well. There have been also experiences of controlling the process with the aeration pattern alone (Pollice et al., 2002) thus resulting in energy savings along with simpler operating conditions. MBR. Due to the high difficulties in setting the SRT, it is difficult to suppress NOB
growth (Xue et al. 2009).
SHARON (Single high-activity removal over nitrite). Is the most famous implementation (van Dongen et al. 2001) and it consists in a CSTR operated as a chemostat with a HRT (equal to the SRT) lower than 1 d at 35°C. Nowadays the SHARON is implemented at full-scale in the WWTP of Sluisjesdijk (Rotterdam, The Netherlands). In this application, the alkalinity present in the reject water (dewatered anaerobic sludge) is already adequate to oxidize just half of the ammonium present. Main drawbacks of this system are the impossibility of biomass retention as well as the difficulties in coping with fluctuating influents or loads since pH and DO must be strictly controlled to obtain the oxidation of just half of the ammonium present to nitrite. Therefore the maximum volumetric loading rate of the reactor is the bottleneck to the increase of the treatment capacity in the WWTP of Sluisjesdijk. A recent strategy to control the process explained above can be the implementation of advanced control loops on the inflow flow rate (Torà et al. 2014, Jemaat et al., 2013) at a fixed DO. With this configuration, ammonium is measured on-line and actions to limit the full conversion of NO2- to NO3 are taken on the basis of the difference between the
measured value and the fixed set-point thus resulting in an high process flexibility
3.3.4 Stoichiometry and comparison with conventional nitrification/denitrification
The stoichiometry of the anammox process was obtained by Strous et al. (1998) by means of mass balances over different microbial culture:
++ . −+ . −+ . +
= . + . −+ .
. . + .
Figure 3 A simplified scheme for Anammox catabolism. Diamond represent substrates, squares are the intermediates
and circles the products. The scheme is taken from Lotti et al. (2015)
Nitrate production is the result of the CO2 fixation process (Van de Graaf et al., 1996).
Being nitrate a byproduct of the anabolism, it can thus be used as an indicator of anammox growth.
According to the anammox reaction, the ratio between the stoichiometric conversion rates of nitrite to ammonium and of nitrate to ammonium should be 1.32 and 0.26, although they can vary in the range from 1.1-1.3 and 0.1-0.3. Observations of lower and higher ratios respectively are an index of the contemporary presence of other processes such as the heterotrophic bacteria performing denitrification.
In literature, different maximum specific growth rate are reported: 0.02 d-1 (Fux et al., 2004), 0.05 d-1 (Strous et al., 1999) up to 0.21 d-1 (Lotti et al., 2014). They correspond to a
doubling time of 30, 14 and 3.4 d respectively, the lower value ever reported in literature. Such differences may due to different analytical methods or differences at microbial level in the bacteria population. Indeed, different Anammox species seldom occur in the same WWTP and they occupy their own niche in the environment.
Because of the slow growth rate of the anammox biomass, the start up of the process and the recovery from inhibition episodes are particularly difficult and time-consuming. Start up processes may require up to two and a half years (Wett, 2007). Particular care should be taken in not washing out the active biomass, therefore systems should guarantee an high biomass retention. Particularly suitable for this purpose are systems that promote the aggregation of the biomass in flocks, granules or biofilms.
Actually, for the precedent reason, the start up of anammox systems is often performed through the inoculation of biomass already acclimated from plants or processes in operation.
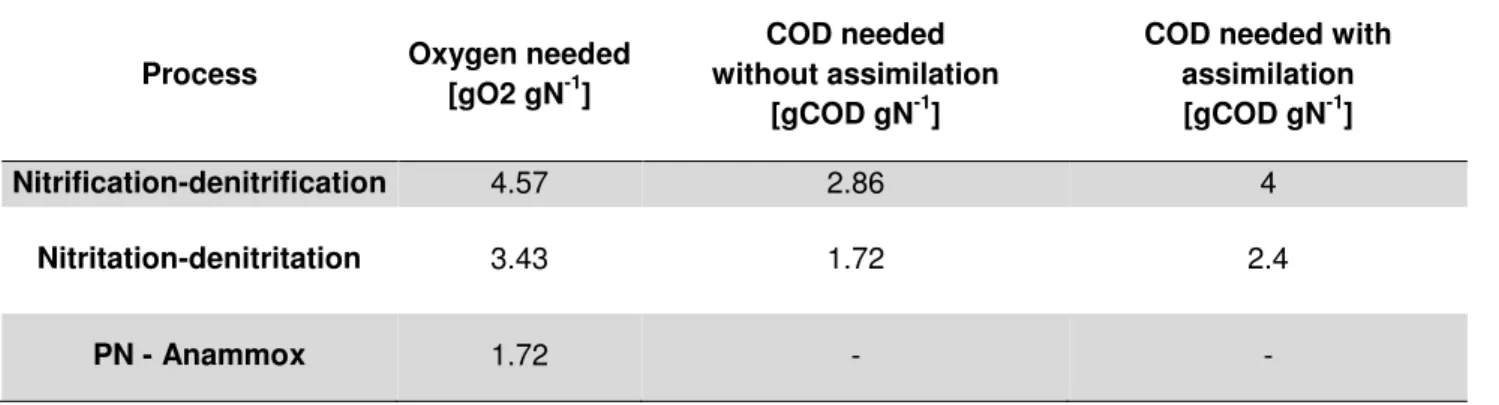
Table 2 Comparison between different nitrogen removal processes (Adapted from Van Hulle et al., 2010)
Process Oxygen needed
[gO2 gN-1]
COD needed without assimilation
[gCOD gN-1]
COD needed with assimilation [gCOD gN-1]
Nitrification-denitrification 4.57 2.86 4
Nitritation-denitritation 3.43 1.72 2.4
From the stoichiometry and from Table 2 it can immediately be concluded that the PN/A process requires 60% less oxygen and lower (or not at all) carbon consumption if compared to nitrifying/denitrifying systems.
Moreover, Mulder calculated that due to the autotroph metabolism of anammox biomass, the overall sludge production in PN/A and DENO2 is 90 % less if compared with traditional processes (0.1 g dry weight gN-1 against 1 g dry weight gN-1) and this results in substantial savings
in sludge treatment and disposal.
A WWTP that implements nitrification/denitrification has investment costs that are comparable with PN/anammox but it shows an overall 85% savings with comparison to traditional nitrification/denitrification (Vlaemink et al., 2009). Moreover, nitrogen removal efficiency is higher (Nielsen et al., 2005).
Finally, overall N2O emissions are globally lower (Jetten et al, 1997), although this last
point will need further investigations.
Nitrate produced from the anammox process requires organic carbon as well, however the amount of COD that is usually found in traditional wastewater is enough to oxidize the small amount of NO3-in the effluent.
Main inhibitors to the anammox process
Due to the low growth rate of anammox biomass, inhibition phenomena are particularly critical because of the long recovering time of the biomass. The main inhibitors to the process are:
Nitrite. The inhibiting concentration is once again difficult to determine and it is function of the type of process. In literature there are experiences of irreversible loss of the activity with NO2- concentrations of 100 (Strous et al., 1999) and 40 mg
N - NO2- L-1 (Fux et al., 2012). From recent studies, the IC504 was found to be 350
mg N - NO2- L-1 - 400 mg L-1 (Dapena-Mora et al. 2010, Lotti et al., 2012) but
inhibition was also found to be reversible up to 1000 mg N - NO2- L-1 (Lotti et al.,
2012).
Ammonium. It was found an IC50 for ammonium of 700 mg N – NH4+ with the actual
inhibitor being the FA (Dapena-Mora et al., 2010). However, in the short term a FA concentration of 38 mg N – NH4+ L-1 (Dapena-mora et al. 2007) determines a 50%
reduction in the anammox activity, while in the long term a concentration of 25 mg N – NH4+ L-1 was detrimental to the biomass (Fernandez et al., 2012). Once again,
differences between the obtained values can be due to different setup along with different microbial characteristics.
Hence, those values are strictly dependent on the type of process. Since FA concentration depends on total nitrogen and pH, the latter is the parameter that is usually controlled
Oxygen. A concentration of oxygen 0.25 - 2% of air saturation was found to be already reversibly inhibiting (Egli et al., 2011). This reversibility allows the implementation of systems performing simultaneously PN/A in one reactor (Strous et al., 1997). The topic will be deepened in the following paragraph 1.3.6.
Organic carbon. High ammonium strength wastewaters usually contain elevated amount of organic matter as well. As anammox bacteria have a lower growth rate than the one of denitrifiers, they are outcompeted if a certain amount of organic carbon is present. Although the overall effect is a decrease in the nitrogen removal, this is not a proper inhibition phenomenon.
However, organic matter can also by toxic for the anammox. For example, methanol and ethanol irreversibly inhibit the process.
Salts. The general effect of an increase in the conductivity medium is an increase in the osmotic pressure across the membrane thus impacting on transport phenomenon and leading to a decrease in the microbial activity. However, annammox bacteria were found active in marine ecosystems (Arrigo et al., 2005; Dalsgaard et al., 2005) and they showed capacity of adaption to salinity in several literature studies. A deeper insight into the topic will be given in chapter 1.3.8.
3.3.5 Different process configurations: one stage and two stages
Conversion of ammonium to nitrogen gas through the anammox process requires a first partial nitritation of the influent. The two stages of the process can be implemented in the same reactor (single stage) or in two separated reactors (two stages).
3.3.5.1 Single stage configuration
In this configuration PN and anammox processes take place in the same reactor. The contemporary presence of both the organisms make the management of the process difficult since their optimal and inhibiting characteristics are different. For example, oxygen is inhibitory for the anammox while it is a substrate for the AOB. Moreover, AOB minimum doubling time is 7-8 hours (Bock et al., 1986), certainly smaller than that of the anammox, thus resulting in the need for a high SRT for the whole system.
In order to guarantee aerobic and anoxic conditions for the growth of both microbial populations different system configuration have been implemented at a full scale:
Sequencing batch reactor (SBR). It is the most applied (50% of the installations). The DEMON (DEaMONification) configuration is the most popular. It implements a pH-based feed control. Another SBR system is the NH4+ controlled PA/A
implemented in Zurich. Also Degremont (Cleargreen) and Aqualia (ELAN) are developing their own patented SBR technologies.
Moving bed biofilms reactors (MBBR). Aerated MBBRs are equipped with 50% carriers in the DeAmmon (Rosenwinkel and Cornelius 2005) process. Another
implementation is the one from Veolia, named ANITAMox (Christensson et al., 2011)
Rotating biological contactor (RBC). In the OLAND process (Vlaeminck et al., 2009) the control parameter are rotating velocity (and thus the DO) and the pH
Granular sludge process. The CANON (complete autotrophic nitrogen removal over nitrite) process foresees the elimination of nitrogen in one single oxygen limited step (Third et al., 2010). There is also an experience at full scale at Olburgen (Albma et al., 2010)
In this system, AOB bacteria oxidize ammonium taking up all the available O2 in the
outer layer of the granule thus limiting its diffusion in the biofilm and allowing an anoxic environment in the core of the granule where the anammox process takes place.
In the single stage reactor there will be competition for NO2- between anammox/NOB, for
O2 between AOB/NOB and for NH4+ between anammox and AOB. The challenge of this
configuration is to put NOB bacteria in the condition of not competing for the substrates and being completely inhibited.
In order to do that, biomass retention and mixing are key factors in order to allow the growing of biomass and making all the substrates available for the metabolism.
3.3.5.2 Two stages configuration
In a two stages configuration, two different tanks are implemented and independently controlled thus allowing their separate optimization. The first tank is aerated in continuous while the second is anoxic with no aeration.
As for the first stage, there are different strategies to guarantee a partial nitrification and to fix the effluent nitrite to ammonium ratio to the optimal value For the following anammox reactor while preventing nitrate formation, as previously explained in paragraph 1.3.1.1. In the second tank the anammox process takes place. The key parameters are the mixing of the reactor and biomass retention. The importance of the mixing relies in the dilution of the influent thus preventing the annamox to be locally inhibited by nitrite. Biomass retention is also of fundamental importance because of the slow growth rate of microorganisms. Typical SRT of the system should be about 30d.
The most common full-scale implementation of the two stage configurations are:
Traditional flocculent activated sludge. They can be used to retrofit an existing plant. Examples are PANDA (partial augmented nitritation/denitritation with alkalinity recovery) and NAS (new activated sludge), respectively a two stage suspended sludge process (aerated reactor, mixing reactor and settlers) and a combination of PN/A and N/DN (Desloover et al., 2011).
Suspended growth system usually implements ditch aeration and operates at very low O2 concentration.
Granular. The most widespread implementation is the SHARON/ANAMMOX from Paques (The Netherlands) whose configuration will be further explained in the following paragraph. The challenge of granular systems is the capacity to retain biomass that is able to form granules. The main criterion to select for this kind of biomass is the settling velocity (de Kreuk et al., 2005).
Here the SHARON reactor is loaded with 750 kgN d-1 in a 40 m3 reactor, thus
making a NLR of 18.8 kgN d-1 m3. Mixing is provided by the influent, the downcomer
flow and gas recirculation. The following anammox reactor has a bigger volume of 70 m3, coherently with the longer doubling time of the Anammox bacteria compared with the AOB, and the NLR is 10.7 kgN d-1 m3. The reactor was scaled up directly
from laboratory to full scale (van der Star et al., 2007), this experience clearly asses the possibility of implementation of such a process to a full scale.
Hybrid systems. TERRANA foresees the injection of bentonitic material in an activated sludge plant in order to let the biomass grown attached and retained in the system (John et al., 2010)
SBR. There are no full scale implementations yet of PN/SBR but there are some interesting studies at lab scale (Ganiguè et al., 2009)
A two stages system allows coping with variable influents in terms of suspended solids and fluctuating organic matter loading rate. Therefore, if there are peaks of COD – that are likely in a process that is not constant in time as anaerobic digestion, its removal can be separately optimized in the first tank in order not to favor heterotrophic denitrification in the sequent anammox tank: this result in a higher stability of the process.
The kinetics in the anoxic phase is quicker: up to ten folds if compared with a single tank (van der Star et al. 2007) – thus allowing for treating higher ammonium loads in this stage. Moreover, a two stages system is particularly interesting when toxic compounds are to be treated: the anammox process is more sensitive than nitritation and inhibition can be avoided with the preventive degradation of potentially inhibiting compounds (Jemaat et al., 2013 and Ramos et al., 2015).
On the other hand, a two stages system also requires more space and higher capital costs. Indeed single stage systems are often preferred because of the simplified setup and the lower occurrency of nitrite accumulation. Of all the known full-scale applications of the process, about 100 installations worldwide, the 88% are operated as a single-stage system (Lackner et al., 2014).
3.3.6 Main advantages of granular systems
Granules are to be understood as aggregates of microbial origin, which do not coagulate under reduced hydrodynamic shear, and which subsequently settle significantly faster than activated sludge flocks. (de Kreuk et al., First Aerobic Granule Workshop 2004, Munich, Germany).
Granular systems have a high biomass retention capacity that results in an high biomass concentration and therefore a capacity to treat relatively high volumetric loading rates. The main features of granular systems are (de Kreuk et al., 2004):
Good settling properties that determine high biomass settling velocity but no coagulation if the shear is reduced so that they settle as separate units
The possibility of high SRT in the reactor that is of extreme importance with slow growing bacteria as anammox and AOB
Granular sludge can cope with various wastewater and loadings, thus guaranteeing flexibility in the process
Less surfaces needed, a more straightforward process that results in lower costs and energy consumption
3.3.7 Experiences of high salinity wastewaters with PN and anammox, a review
Influents with high ammonium strength usually show high salinity as well, and there are many literature studies upon the feasibility of their treatment with PN/A.
Therefore, literature comparison can only be partial and should focus on some characteristic of the wastewater treated, that is to say, the salinity. Similar influents are leachate, synthetic high conductivity wastewater and wastewaters from the food industry. Moreover, because of differences in the experimental setup and in the influents nature, results might differ significantly also for similar salinity.
From literature studies, it emerges that there is a value of salinity that actually enhance the anammox activity. This value was not univocally determined, for example it is 15 mg NaCl L-1 for Dapena-Mora. High concentrations of NaCl could enhance biomass aggregation and consequentially its retention in the system. Moreover, salinity can also be used as a strategy to enhance granulation. In fact, saline precipitate can act as aggregators for granules thus helping biomass retention in an SBR reactor (Fernandez et al., 2008).
However, it is common opinion that a concentration of 45 mg NaCl L-1 irreversibly ceases
annamox activity (Liu et al., 2009, Kartal et al., 2006, Dapena-Mora et al., 2006). However, Windey et al (2005) could assess anammox activity at 45 mg NaCl L-1.
Adaption phenomena were also assessed in literature in order to understand whether there could be activity recovery after an acclimation phase (Kartal et al. 2006, Liu et al., 2009). In those studies the biomass was tested both with no adaption and after a stepwise increase of salts concentration, showing that anammox biomass is not intrinsically resistant to salinity, but it can be adapted.
It has also been assessed in literature the feasibility of the treatment of real wastewaters, such as leachate (Ruscalleda et al., 2010), manure (Karakashew et al., 2008) or swine slurry (Zhang et al, 2012) that due to their high conductivity can be assimilated to the influent used in this study.
Anammox biomass appears to be highly resistant to salinity. This is not surprising since it might be responsible to the 70% of N2 production form sediments in marine environment
(Dalsgaard et al., 2002). However, anammox behavior under salinity stress is also strictly dependent on the microbial active population, on the reactor setup and on to the biomass story.
Also PN was tested with saline influents, although there are less experiences. Adaption phenomena were observed in this case as well and they will be presented in 5.3.2.
3.3.8 Full scale implementations
The cumulative development of PN/A installation has been exponentially growing worldwide in the last ten year, above all in Europe. In the following Table 3 some of the most famous implementation are presented.
Despite some technical problems that are deeply site-specific, PN/A is now a well-established technology for nitrogen removal, allowing energy and chemical savings
26
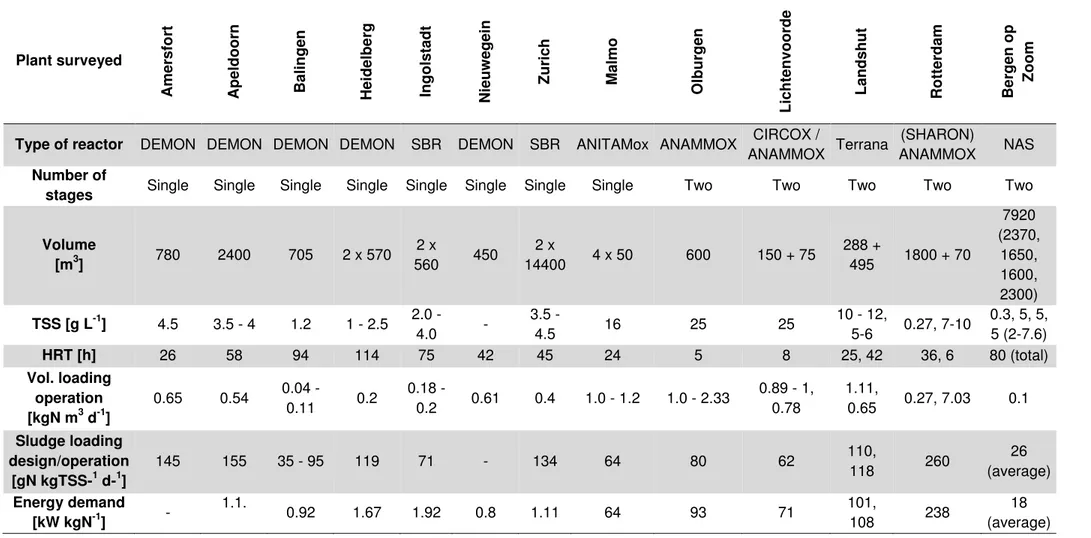
Table 3 Full-scale applications of the anammox process, both in single and two stage. The table was adacted from Lackner et al. (2014)
Plant surveyed Am er sfo rt Ap eldo o rn Baling en Heidelbe rg Ing o lstad t Nieuw egein Z u rich Ma lmo O lbu rg en L icht envo o rd e L and shu t Ro tt er d am Ber g en o p Zoom
Type of reactor DEMON DEMON DEMON DEMON SBR DEMON SBR ANITAMox ANAMMOX CIRCOX /
ANAMMOX Terrana
(SHARON)
ANAMMOX NAS Number of
stages Single Single Single Single Single Single Single Single Two Two Two Two Two
Volume [m3] 780 2400 705 2 x 570 2 x 560 450 2 x 14400 4 x 50 600 150 + 75 288 + 495 1800 + 70 7920 (2370, 1650, 1600, 2300) TSS [g L-1] 4.5 3.5 - 4 1.2 1 - 2.5 2.0 - 4.0 - 3.5 - 4.5 16 25 25 10 - 12, 5-6 0.27, 7-10 0.3, 5, 5, 5 (2-7.6) HRT [h] 26 58 94 114 75 42 45 24 5 8 25, 42 36, 6 80 (total) Vol. loading operation [kgN m3 d-1] 0.65 0.54 0.04 - 0.11 0.2 0.18 - 0.2 0.61 0.4 1.0 - 1.2 1.0 - 2.33 0.89 - 1, 0.78 1.11, 0.65 0.27, 7.03 0.1 Sludge loading design/operation [gN kgTSS-1 d-1] 145 155 35 - 95 119 71 - 134 64 80 62 110, 118 260 26 (average) Energy demand [kW kgN-1] - 1.1. 0.92 1.67 1.92 0.8 1.11 64 93 71 101, 108 238 18 (average)
27
4
Literature Review
4.1 OFMSW: production collection and treatment
Generation of wastes from household activities, according to the last Eurostate update (2012), was 242 ton/year. It traduces in a pro capita production of about 481 kg/pro capite /year. Italy and Spain place themselves respectively below and above the Europe average: 449 and 491 kg/pro capite /year. Although the trend for waste production is slightly decreasing (basically because of the economic crisis), those numbers are still impressive.
The lack of a unique method to compute biodegradable municipal wastes (BMW) makes it difficult to give an average value of their production in Europe, however they are estimated to account for the 35% of total wastes production in Europe. The Italian production of the organic fraction of municipal solid wastes (OFMSW) was 11.3 megatonnes per year (Mt/y) in 2010.
According to Eurostat there are four possible treatment possibilities: landfill, incineration, recycling and composting. Statistics provided by the European Union do not differentiate between composting and anaerobic digestion, merging everything in the general category “compost”. Composting allows the recovery of organic material and its annual rate shows a growth on average of the 5.3% on average from 1995 to 2013. (Eurostat Data). Indeed, in the famous inverted pyramid of wastes introduced in the Directive 2008/98/CE, which lists all the possibilities for solid waste management, material recovery is to be preferred to incineration (that is to say, energy recovery).
Member States stipulated the Directive31/ 1999 that forced them to reduce the amount of organic (BMW) wastes headed to landfills to 75% by 2006, to 50% by 2009 and to 35% by 2016 (compared with 1995 values). It was up to the different states to decide how to reach this goal– either with composting (including fermentation and anaerobic digestion), incineration or pre-treatment.
4.2 Italian situation: organic waste generation
The percentage of organic waste over the total recycled urban waste is estimated to be the 38% in 2013 by ISPRA (Isituto Superiore per la Protezione e la Ricerca Ambientale). Actually, this value is derived from the input to the treatment facilities for composting and anaerobic digestion. Hence all the losses in weight during the collection or the treatment steps are not taken into account and the real percentage must be higher that the reported value.
Moreover, it is estimated that the overall organic waste that is now recovered is the 40-45% of the amount produced (with a value of 30-35 % in the Centre and 20-25% in the South).
When considering data about waste production, one should be aware that the computation and processing of this type of data is challenging because there are consistent shift of
28
wastes from one region to the other (taking the specific Italian name of “Rifiuti Speciali”) making it difficult to follow properly waste streams.
The amount of organic wastes that is being differentiated and treated pro capita is on average 71 kg / inhabitant /year, with very different values for the North, the Centre and the South of Italy: respectively 105, 60 and 33 kg / inhabitant / year.
Those data indeed do not match the real situation of the collection of organic wastes since the lack of proper facilities for the treatment in the South and Center involves the transportation of all those materials towards the North.
4.3 Anaerobic digestion to treat OFMSW
Anaerobic digestion is the name given to the set of processes by which microorganisms in the absence of oxygen (anaerobic) break down biodegradable matter in order to produce methane, hydrogen and carbon dioxide – that is to say, energy in the from of biogas. The digestate is rich in nutrients and can be used as fertilizer. Consequentially, anaerobic digestion can be considered both as energy and material recover. There have been many improvements in the last twenty years and the technology can be considered as mature. Due to a continuous growth in the efficiency of the collection process, the amount of organic waste treated in composting and anaerobic digestion facilities has been increasing constantly. The number of operative plants in Europe is now 244 with a treatment capacity of almost 8 million tons of organics per year, thus accounting for the 25% of the biological treatment in Europe (De Baere, 2014). Spain has one of the largest installed capacity, 1.6 million tons; it is second only to Germany and Italy that pass the 2 million tons. Of course data should be corrected for the inhabitants, thus making the Netherlands and Switzerland the leading countries as for the capacity per million people (respectively 52400 and 49000 tons/million people).
4.3.1 Anaerobic digestion in Italy
The growing interest in the anaerobic digestion process is demonstrtaed by the constant increase of the number of existing operating plant. In 2013 the classified plants were 50 (of which 43 in operation), 45 in 2012 and 35 in 2011. They are located for the 86% in the North, 2.3% in the Centre and 11.3 in the South. This classification does not include the plants that are a preliminary phase for the production of compost. About 1Mt/y of OFMSW is treated in those plants.
Both the amount of total wastes in input and its urban waste (UW) fraction are increasing: in 2013 more than a billion tons were treated and of those about 527 (50.5% of the total) come from UW; with the rest being sludge, green fraction and agro industrial wastes. It is important to notice that the amount of organic wastes collected separately are slightly decreasing (7,9%), thus meaning that relative importance of anaerobic digestion has increased. The amount of treated waste was almost the same in 2012 that instead shows a great increase if compared to the previous year (27.7% more).
29
Another important thing that can be noticed is that the installed (and authorized) capacity is far higher than the actual amount treated: in fact the potential treatment is almost two billion tons: plants work on average at the 52 % of their capacity (ISPRA data).
4.3.2 Treatment schemes
Anaerobic digestion can be “dry” or “wet”. The former is designed to process solid wastes without the addition of water, while the latter is performed with the addition of water thus improving the mixing of material and making substrates more available for bacteria and increasing the global production of biogas but requiring on the other hand higher volumes. 40% of the digesters currently operated are “wet”. The effluent from the digester needs to be further separated into a solid and liquid fraction (many alternatives are currently in use for this step).
The solid fraction is aerobically composted after a maturation stage or it is used as such as organic amendment achieving material recovery. As far as the liquid fraction is concern, it is usually treated in dedicated wastewater treatment plants before being headed to the sewage or to receiving water bodies.
The criticality of the disposal of the liquid fraction is currently one of the major limiting factors to the widespread of anaerobic digestion.
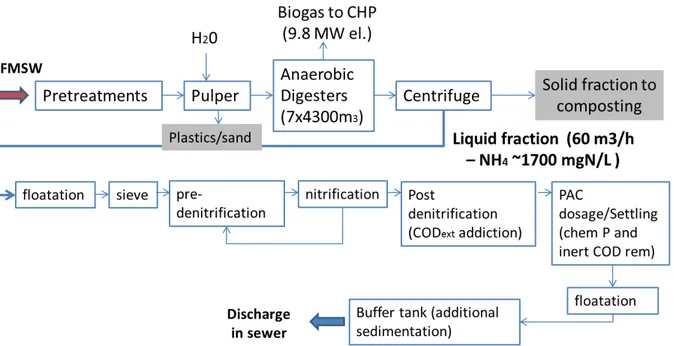
4.4 The Italian case study
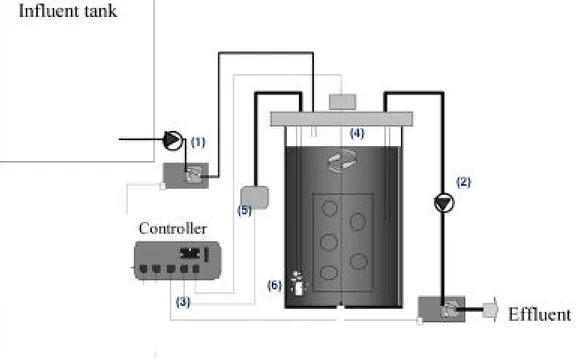
The wastewater employed for the WP II was provided by an anaerobic digestion plant located in the north of Italy that performs wet AD in a CSTR with no digestate recirculation The general scheme of the plant is shown in figure 1. The first step of the process is a pretreatment in order to remove extraneous fractions such as metals, plastic; then the waste is headed to the digester where electricity and heat are produced in cogeneration. The residue from the digestion has to be dewatered thus generating a solid and a liquid fraction that are separated by a centrifuge. The solid fraction is aerobically composted in order to produce a high grade fertilizer; through this step material recovery is accomplished as prescribed by the WasteFramework (2008/98/EC).
The liquid fraction is currently treated on site in a dedicated wastewater treatment plant (WWTP). Phosphorus removal is performed together with recalcitrant COD removal by adsorption with PAC, while nitrogen is removed by conventional nitrification/denitrification including both pre-denitrification and post-denitrification with external COD dosage. The average daily discharge is about 60 m3/d, corresponding to an average nitrogen load of 2500 kg-N d-1. The effluent of the WWTP is discharged into the sewer (sewer discharge
limits: 50 mgN-NH4+ L-1, 50 mgN-NO3 L-1, 2 mgN- NO2-L-1, 500 mgCOD L-1, 2500 mgCl L -1). Currently, in order to meet standard effluent limits, operational costs are very high
30 Figure 4 General layout of the AD plant used in the WP II