UNIVERSITÀ DEGLI STUDI DI ROMA
TOR VERGATA
Facoltà di Ingegneria
Dottorato di Ricerca in Sistemi e Tecnologie per lo Spazio (XXI ciclo)
Tesi di Dottorato
IMPLEMENTATION OF ITERATIVE
MULTIUSER JOINT DETECTION
TECHNIQUES IN A DVB-RCS
SATELLITE SCENARIO
Coordinatore/Tutor Dottorando
Prof. Giancarlo Cardarilli Bernardo Tacca
CONTENTS
ACKNOWLEDGEMENTS...iv
LIST OF ACRONYMS ...v
1. INTRODUCTION ... 1
1.1. MULTIUSER JOINT DETECTION OVERVIEW ... 2
1.2. PHD RESEARCH ACTIVITY... 3
2. DVB-RCS...6
2.1. INTRODUCTION ... 6
2.2. SYSTEM MODEL... 7
3. THE AMPIST PROJECT... 10
3.1. SPECIFICATIONS ...10
3.1.1. Adaptive Coding and Modulation ...12
3.1.2. Frame Structure...13
3.1.3. The Turbo-Φ Code ...14
3.2. CCI INTERFERENCE ...16
3.3. HARDWARE IMPLEMENTATION ...17
3.4. PHD DEVELOPED ACTIVITIES ...19
4. SINGLE USER DECODING... 20
4.1. RECOVERY ALGORITHMS ANALYSIS ...21
4.1.1. Timing Recovery...21
4.1.2. Frequency Recovery ...23
4.1.3. Phase Recovery...25
4.2. BURST FORMATS AND ALGORITHMS ASSESSMENT...26
4.2.1. Burst Formats...27
4.2.2. Timing Recovery Assessment ...29
4.2.3. Frequency Recovery Assessment...30
4.3.1. Scenario 1...34 4.3.2. Scenario 2...35 4.3.3. Scenario 3...37 4.4. CONCLUSIONS...38 5. TURBO CODES ... 41 5.1. TURBO ENCODING ...41 5.2. TURBO DECODING ...42
5.2.1. The Log Likelihood Ratio...43
5.2.2. The BCJR Algorithm...45
5.2.3. Simplified Decoding Algorithms for Turbo Decoding ...48
6. MULTIUSER DETECTION ... 49
6.1. THE MMSE ALGORITHM...49
6.2. ESTIMATION ISSUES...52
6.2.1. Channel and MMSE Matrixes Estimation...52
6.2.2. Channel Matrix Estimation Error...54
6.3. SERIAL INTERFERENCE CANCELLATION ...58
6.4. ITERATIVE MUD ALGORITHMS ...61
6.4.1. Optimum Decoder and Belief Propagation...61
6.4.2. CMMSE-IC and UMMSE-IC ...66
6.4.3. MMSE SUMF-IC...69
6.4.4. MMSE Soft-SIC...69
6.4.5. Performance Comparison...70
6.4.6. Power Allocation...72
6.5. CONCLUSIONS...74
7. MULTIUSER DECODING RESULTS... 76
7.1. SIMULATED SCENARIOS...77
7.2. MAX* TURBO DECODING...79
7.2.1. Scenario 1...79
7.2.2. Scenario 2...86
7.2.3. Scenario 3...87
7.2.4. Carrier to Interference Distribution...89
7.3. MAX TURBO DECODING...92
7.3.2. Reference Case for Asynchronous Users ...94
7.3.3. Time and Frequency Recovery ...95
7.3.4. Channel Estimation ...98
7.4. CONCLUSIONS...99
8. CONCLUSIONS...101
ACKNOWLEDGEMENTS
Ringrazio tutti gli ex colleghi della Space Engineering S.p.A. di Roma che mi hanno affiancato ed aiutato nello svolgimento di questa attività di ricerca, in particolare Gennaro Gallinaro e Filippo Di Cecca. Doverosa riconoscenza anche a Pierpaolo Francia per la revisione della forma inglese ed al prof. Giancarlo Cardarilli, che mi ha sempre consigliato saggiamente.
LIST OF ACRONYMS
ACM Adaptive Code and Modulation
AMPIST Advanced Modem Prototype for Interactive Satellite Terminals APP A Posteriori Probability
APSK Amplitude Phase Shifting Keying ATM Asynchronous Transfer Mode AWGN Additive White Gaussian Noise BCJR Bahl, Cocke, Jelinek and Raviv
BER Bit Error Rate
BP Belief Propagation
BPSK Binary Phase Shift Keying CCI Co-Channel Interference CDMA Code Division Multiple Access
CMMSE-IC Conditional Minimum Mean Squared Error-Interference Cancellation COTS Commercial Off The Shelf
CRDSA Contention Resolution Diversity Slotted Aloha C/I Carrier to Interference Ratio
DFT Discrete Fourier Transform DRA Dynamic Rate Adaptation
DVB-RCS Digital Video Broadcasting-Return Channel Satellite DVB-S Digital Video Broadcasting-Satellite
e.g. Exempli Gratia
ESA European Space Agency EXT Extrinsic information FEC Forward Error Correction
FER Frame Error Rate
FIFO First In First Out
FL Forward Link
GSE Generic Stream Encapsulation
IC-MUD Interference Cancellation-Multiuser Detection
i.e. Id Est
IF Intermediate Frequency
ISDN Integrated Services Digital Network LLR Log Likelihood Ratio
MAC Media Access Control MAP Maximum a Posteriori
ML Maximum Likelihood
MMSE Minimum Mean Squared Error
MMSE-IC Minimum Mean Squared Error-Interference Cancellation MMSE-SIC Minimum Mean Squared Error-Serial Interference Cancellation MPEG Moving Picture Experts Group
MUD Multiuser Joint Detection M&M Mengali & Morelli
n/a Not Applicable
NCC Network Control Centre O&M Oerder & Myer
pdf Probability Density Function PhD Doctor of Philosophy PHY Physical layer
PIC Parallel Interference Cancellation pmf Probability Mass Function PSK Phase Shifting Keying
PSTN Public Switched Telephone Network QPSK Quadrature Phase Shift Keying RCST Return Channel Satellite Terminal
RF Radio Frequency
RL Reverse Link
SIC Serial Interference Cancellation SISO Soft-Input Soft-Output
SNIR Signal to Interference plus Noise Ratio SNR Signal to Noise Ratio
SOVA Soft-Output Viterbi Algorithm SUMF Single User Matched Filter
SUMF-IC Single User Matched Filter-Interference Cancellation TDMA Time Division Multiple Access
UMMSE-IC Unconditional Minimum Mean Squared Error-Interference Cancellation
UW Unique Word
VoIP Voice over IP
VSAT Very Small Aperture Terminal
1. INTRODUCTION
With the explosive growth of telecommunications, the efficient use of available spectrum is becoming increasingly important: tightened frequency reuse planning is a pressing need in satellite networks, as the frequency spectrum has become an extremely precious resource. The main purpose of this work is to develop a novel methodology for improving the bandwidth utilization of a multibeam satellite, depicted in Figure 1.1, i.e. a satellite that generates a network of spot beam coverage areas on the earth instead of the usual single beam. The advantages of a multibeam satellite over a single beam include fuller utilization of the Radio Frequency (RF) spectrum, expanded satellite communication capacity combined with smaller or even mobile ground terminals, improved beam-pointing accuracy, and very narrow beams carrying large blocks of data delivered to specific points on the earth. The drawback, obviously, is the increase of complexity and cost for the satellite system.
Figure 1.1: Multibeam satellite communication.
One method of achieving the efficient utilization of the available bandwidth is by permitting the frequency reuse for adjacent beams (usually adjacent beams employ different
modulation bands so as not to interfere at the satellite antennas). The resulting Co-Channel
Interference (CCI) can lead the interference to a Carrier to Interference ratio (C/I) as low as
0 dB if both the user and the interference are at the edge of the user beam. As a consequence, severe degradation in performance is experienced unless efficient interference cancellation schemes are implemented. The usual approach to consider single user demodulation can no longer be used because of the unacceptable performance degradations and Multiuser Joint
Detection (MUD) algorithms must be considered, where all the channels are demodulated
together in order to suppress the CCI interference.
1.1. MULTIUSER JOINT DETECTION OVERVIEW
In the last decade an impressive amount of theoretical investigations have been developed in the field of MUD algorithms; in particular efforts have been focused on Code Division Multiple Access (CDMA) systems for mobile applications, while our case of spatial diversity systems for fixed applications has been considered to a lesser extent. The first studies on MUD techniques were made to maximize the efficiency of CDMA based networks, that have enjoyed success as a strategy for terrestrial cellular systems, partly due to its potential to reuse the same spectrum in each cell. However, these systems are still far from Shannon’s theoretical capacity of multiuser systems and to further increase the CDMA capacity there has been much research into multiuser decoding. It is demonstrated in [1] that the optimum multiuser decoder for an asynchronous CDMA system employing Forward Error Correction (FEC) coding combines the trellises of both the asynchronous detector and the FEC code. This decoder is a variation of the Viterbi detector and has a complexity of approximately
(2 )k K
O operations per bit where k is the code constraint length and K is the number of users. This exponential complexity makes the system impractical for most CDMA systems. Consequently, there has been considerable research into simpler, suboptimum decoding strategies.
The pioneering work on multiuser detection in [2] was focused on simple uncoded CDMA systems, because they are the “natural scenarios” for the CCI interference, but most of the successive work in this area has addressed multiuser detection for the more realistic coded CDMA systems. Among the several multiuser detection schemes proposed, analyzed in the following Chapters, the so called Serial and Parallel Interference Cancellation MUD schemes (SIC and PIC) are particularly attractive because they process directly the output of a bank of
Single User Matched Filters (SUMF). The receiver front-end is identical to that of a typical detector, therefore these methods can be seen as an “add-on” post-processing to enhance the performance of a conventional receiver when particularly high channel load is needed. It will be shown how the main performance limitation of SIC/PIC schemes is the error propagation caused by feeding back erroneous symbol decisions and the imperfect interference cancellation due to a non ideal estimation of the channel parameters. SIC is both simpler and more robust than PIC with respect to the errors propagation, since users can be ranked according to their Signal to Interference plus Noise Ratio (SNIR) and decoded in sequence [3]-[6]. In early works [3] and [4], SIC is applied to uncoded transmission and hard decisions are used at each stage to remove the already detected users from the received signals. In order to prevent errors propagation, the use of soft (or partial) interference cancellation and iterative SIC schemes has been proposed in different forms and by different authors [6]-[8]. Iterative SIC/PIC schemes can be naturally coupled with iterative parameter estimation in order to improve the estimates with the iterations, as long as the signal is “cleaned-up” from interference.
1.2. PHD RESEARCH ACTIVITY
The PhD activity is part of a larger research program, promoted by the European Space Agency (ESA), named "Advanced Modem Prototype for Interactive Satellite Terminals (AMPIST)", that consists of developing a complete system laboratory hardware prototype with some innovative techniques suitable to enhance the performance of broadband interactive satellite terminals implementing the Digital Video Broadcasting-Return Channel Satellite (DVB-RCS) standard.
The growing interest for multimedia applications is encouraging the deployment of fixed telecommunications satellite systems capable of offering high-speed point-to-point links at competitive service fees. Therefore the next generation of broadband satellite systems must be designed to offer higher throughput than the one provided by current systems. That will be possible by exploiting the higher frequency bands allocated to fixed satellite systems (e.g. the Ka-band), generating a great number of narrow aperture high-gain beams, and reusing the frequency bands as much as possible. But in this way, system throughput will become more and more affected by the CCI interference occurring among signals that share common band portion. A great aid is given by the use of highly efficient coding schemes, such as those
utilized in the Reverse Link (RL) of current DVB-RCS satellite systems and those standardized for the Forward Link (FL) by the Digital Video Broadcasting-Satellite (DVB-S2) working group. These countermeasures can be accompanied by interference and fading mitigation techniques like adaptive coding and modulation, which are being studied and optimized with the aim of providing a higher flexibility and improving the overall system efficiency. It should however be noted that the introduction of those techniques becomes more challenging in the presence of very efficient coded modulations, that is low operating Signal to Noise Ratios (SNR). In such a hostile scenario, new interference mitigation techniques, requiring the receiver to process simultaneously more channels and thus generally identified as MUD techniques, have been proposed as a promising solution to further increase system capacity in an interference-limited system operating under heavy traffic load.
The AMPIST reference scenario will be a satellite system where the gateway station supports a two-way communication with several interactive user terminals equipped with a relatively small aperture antenna and transmitting low RF power. The RL access scheme is assumed to be low-rate TDMA, with data rates from around one hundred kbit/s to few Mbit/s. With this choice, the proposed MUD techniques become applicable to the RL of most current Very Small Aperture Terminals (VSAT), with usual aperture less than 1.5 m, based on the DVB-RCS access scheme as well as on similar proprietary schemes. In particular, iterative MUD algorithms will be evaluated for mitigating the CCI, and this approach will be combined with a spatial Minimum Mean Squared Error (MMSE) linear processing taking place before the MUD receiver, for improved performance.
The MUD concepts have often been analyzed in literature for hardly realistic scenario, proving that only limited effort was devoted to further developing the theoretical background to make it readily applicable to practical systems. Instead, in this work, the algorithms for implementing the selected interference mitigation scheme are evaluated and their performance detailed through physical layer simulations in reference conditions representative of real applications.
The thesis is organized as follows. In Chapter 2 an overview of the DVB-RCS is presented. Chapter 3 outlines the whole AMPIST project, defining the sub activities developed in the PhD, that can be basically divided in two parts: single user scenario analysis and simulations (for a single enhanced DVB-RCS channel) and multiuser scenario analysis and simulations (where different enhanced DVB-RCS channels interfere with each other and
MUD interference mitigation is adopted). Chapter 4 deals with the single DVB-RCS channel decoding. Chapter 5 is an introduction to the turbo decoding, that is necessary for understanding the iterative MUD algorithms presented in the successive Chapter 6. Chapter 7 reports the results obtained for the MUD techniques and finally the conclusions are discussed in Chapter 8.
2. DVB-RCS
2.1. INTRODUCTION
With their tremendous success in broadcasting entertainment services, interactive broadband satellite systems are now also being viewed as viable service delivery vehicles. Many network operators seriously consider satellite-based networks to offer broadband and multimedia services to supplement and enhance their existing terrestrial networks. High speed user terminal interactivity via satellite requires the presence of a satellite return link with broadband capability. Such connectivity is typically offered nowadays via different solutions, some of which proprietary. DVB-RCS [9] is a standard concerning the air interface of the return link of interactive satellite terminals and it defines the end-to-end connectivity link between the satellite operator hub and the user terminal. For this purpose, it embraces the DVB-S and the newly defined DVB-S2 [10] standards as the forward link specifications, while it describes in more details the Physical (PHY) and Media Access Control (MAC) layer aspects of the return channel.
Although there is certainly a market for two-way satellite-based interactive systems, a number of issues will influence the rate of uptake, financing of systems, and ultimately, the number of subscribers. Among these, the cost of the terminal and service (cost per bit delivered to the end user) has to be effective in order to support the financial case for the satellite and ground segments. Therefore the system spectral and energy efficiency has to be improved by using state-of-the-art techniques and solutions. The DVB-S2 standard implements a number of innovative techniques to dramatically improve the forward link system throughput for interactive systems. These techniques comprise an enhanced FEC code, the use of satellite-optimized high order modulations with Adaptive Coding and Modulation (ACM), an efficient framing scheme, transmit signal pre-distortion techniques and direct mapping of variable length packets into the DVB-S2 PHY.
2.2. SYSTEM MODEL
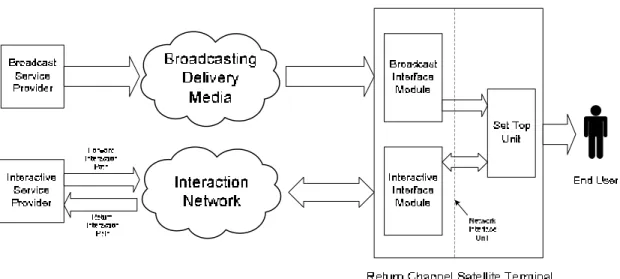
Figure 2.1 shows the system model which is to be used within DVB for interactive services. In the system model, two channels are established between the service provider and the user:
• The Broadcast Channel: an unidirectional broadband broadcast channel including video, audio and data is established from the service provider to the users.
• The Interaction Channel: a bi-directional interaction channel is established between the service provider and the user for interaction purposes. It is formed by:
o Return Interaction Path: from the user to the service provider. It is used to make requests to the service provider, to answer questions or to transfer data.
o Forward Interaction Path: from the service provider to the user. It is used to provide
information from the service provider to the user(s) and any other required communication for the interactive service provision. It may be embedded into the Broadcast Channel. It is possible that this channel is not required in some simple implementations which make use of the Broadcast Channel for the carriage of data to the user.
The Return Channel Satellite Terminal (RCST) is formed by the Network Interface Unit (consisting of the Broadcast Interface Module and the Interactive Interface Module) and the Set Top Unit. The RCST provides interface for both Broadcast and Interaction Channels. The interface between the RCST and the interaction network is via the Interactive Interface Module.
Figure 2.1: Generic system model for interactive systems.
An overall Satellite Interactive Network, within which a large number of RCSTs will operate, comprises the following functional blocks, as shown in Figure 2.2:
• Network Control Centre (NCC): a Network Control Centre provides control and monitoring functions. It generates control and timing signals for the operation of the Satellite Interactive Network to be transmitted by one or several Feeder Stations. • Gateway Station: a Gateway Station receives the RCST return signals, provides
accounting functions, interactive services and/or connections to external public, proprietary and private service providers (data bases, pay-per-view TV or video sources, software download, tele-shopping, tele-banking, financial services, stock market access, interactive games, etc.) and networks (Internet, ISDN, PSTN, etc.). • Feeder Station: a Feeder Station transmits the forward link signal, which is a standard
satellite DVB-S uplink, onto which are multiplexed the user data and/or the control and timing signals needed for the operation of the Satellite Interactive Network.
SAT FW DVB-S2 SAT RT DVB-RCS RCST 1 RCST 2 RCST 3 RCST N Feeder Station Gateway Station Network Control Centre Service Provider Return Interaction Path Forward Interaction Path Broadcast Channel
Video, Audio, Data
Control, Monitoring, Timing, Compensation
Accounting, Interactive Services
Forward Link Signaling Return Link Signaling
Figure 2.2: Reference model for the Satellite Interactive Network.
The forward link carries user traffic and signalling from the NCC to RCSTs, that is necessary to operate the return link system. Both the user traffic and forward link signalling can be carried over different forward link signals. Several RCST configurations are possible; for this PhD activity the RCSTs operate in a multibeam scenario: TDMA mode in the same beam and different frequencies, in principle, for different beams. In order to simplify the gateway resource scheduling, the additional constraint of constant TDMA slot duration is imposed for the AMPIST project.
3. THE AMPIST PROJECT
3.1. SPECIFICATIONS
The AMPIST hardware simulator will be designed so as to allow full validation of the physical layer and upper layers in a controlled laboratory environment for an interactive satellite scenario that implements modified DVB-RCS PHY and MAC layers on the return link together with a DVB-S2 based forward link (see Figure 2.2). The developed real-time modem demonstrator will be composed of the following parts for the return link:
• Traffic simulator (useful link and other users) including related channel quality reports. • Reconfigurable advanced coded digital modulator (including framing, coding and
channel modulator).
• Reconfigurable advanced digital demodulator and decoder, with Intermediate Frequency (IF) input, including channel estimation.
• Physical layer algorithms. • Scheduler and MAC layer.
• Ancillary monitoring and control device (system configuration monitoring and control, traffic statistics, modem performance).
In the forward link the advanced modem demonstrator will include:
• User and background traffic simulator including related channel quality reports. • DVB-S2 Commercial Off the Shelf (COTS) encoder and modulator.
• Satellite channel simulator.
• DVB-S2 COTS decoder and demodulator. • Ancillary monitoring and control device.
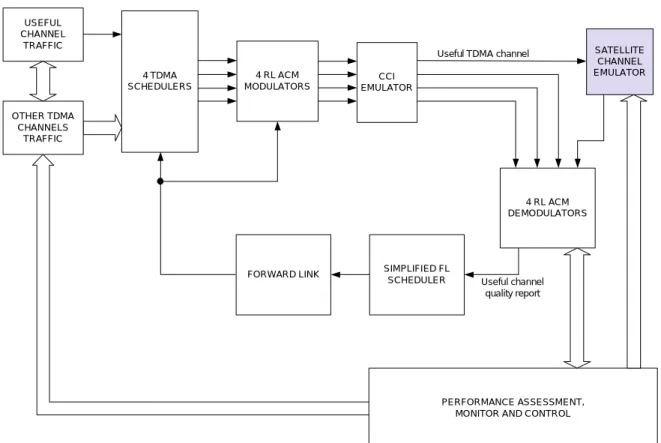
The satellite channel simulator, including as a minimum high power amplifier nonlinearity, local oscillator phase noise, Additive White Gaussian Noise (AWGN), propagation fading and delay, will be provided by ESA. Figure 3.1 clarifies the functions supported by the demonstrator:
USEFUL CHANNEL TRAFFIC 4 TDMA SCHEDULERS 4 RL ACM MODULATORS SATELLITE CHANNEL EMULATOR 4 RL ACM DEMODULATORS SIMPLIFIED FL SCHEDULER FORWARD LINK CCI EMULATOR PERFORMANCE ASSESSMENT, MONITOR AND CONTROL Useful TDMA channel
Useful channel quality report OTHER TDMA
CHANNELS TRAFFIC
Figure 3.1: AMPIST functional block diagram.
The AMPIST activity has the purpose to implement some innovative PHY and MAC layer algorithms/techniques suitable to enhance the performance of broadband interactive satellite terminals implementing the DVB-RCS standard with the objective to reduce the overall terminal-plus-service cost. In particular, the following algorithms will be studied:
• An enhanced FEC scheme with improved performance with respect to the current DVB-RCS turbo code.
• A novel framing and layer 2 encapsulation scheme optimized for adaptive PHY layer and matching traffic characteristics.
• High order modulation schemes (i.e. 8PSK) with ACM.
• Optimized contention-based access, with a solution based on the Contention Resolution Diversity Slotted Aloha (CRDSA) access scheme.
3.1.1. Adaptive Coding and Modulation
The ACM is a sophisticated form of data rate control, where the information bit-rate is adapted by changing modulation and coding rate while maintaining a constant symbol rate over the channel. Preference to QPSK or BPSK has been always given in the system for the higher power efficiency of such modulation formats, however this typically implies a waste of throughput since for most of the time propagation conditions are good and a better usage of the transmitted power is possible. In particular, more bandwidth efficient modulation and coding modes can be used without practical Bit Error Rate (BER) impairment: instead of changing the transmitted power, the gateway control feedback signal (SNIR based) adapts the transmitted modulation and coding to the channel conditions.
The ACM technique strategy naturally tends to optimize the overall system throughput. Some rate adaptation may be performed by changing the code rate only while keeping the same modulation format (e.g. QPSK). However, the total SNIR range that this technique can cover is limited to about 5.5÷6 dB within the current DVB-RCS standard, corresponding to the difference between the decoder thresholds of code rates 1/3 and 6/7. Such a limited range would force one to jointly use Dynamic Rate Adaptation (DRA, i.e. adaptation of the carrier symbol rate) in order to cover the higher SNIR ranges imposed by the typical Ka-band fading. Higher order modulations are thus required, in particular 8PSK and 16APSK constellations. The adopted solution supports high order modulations with a total SNIR range of about 16 dB (11 dB with just QPSK and 8PSK). The ACM functionalities support the following features:
• QPSK, 8PSK, 16APSK and a variety of coding rates with approximately 1 dB step in the code thresholds.
• On-the-fly reconfigurable (from burst to burst) coding scheme (coder and decoder). • Framing structure which allows to select among different burst types from frame to
frame.
The ACM control loop strategy is studied in detail in [11] and [12] where techniques to minimize the residual link margin are investigated and simulation results are shown to prove their efficiency. The support of ACM with high order modulations may complicate the DVB-RCS framing strategy (see [12] for example) but leads to a typical throughput increase between 50% and 100%, depending on system parameters.
3.1.2. Frame Structure
The current DVB-RCS supports two possible packets profiles: ATM or MPEG. In both cases the TDMA burst length has to cope with few possible block lengths as they have to be a multiple of the elementary packet (i.e., for traffic burst, 53 bytes for ATM cells or 188 bytes for MPEG packets plus the FEC code redundancy). Unfortunately this approach makes difficult any extension of the DVB-RCS aimed at the exploitation of ACM, because changing the ACM operating mode would also require to change the terminal burst time duration in order to fulfil the need of having burst sizes (expressed in bits) of constant length (or multiple of the elementary info packet size). For constant baud rate operation, in fact, a constant length (expressed in bits) burst size implies that the burst time duration has to change according to the selected ACM mode. This is quite impractical as the whole carrier time plan should change as a consequence of one terminal changing its ACM mode. Given the impracticality of changing the burst duration, the DRA is typically proposed to achieve some of the ACM advantages while maintaining (almost) backward compatibility with current DVB-RCS specifications.
The DRA requires a static (or slowly varying) partition of the satellite resources in different classes. Partitioning of the resources may be done, for simplicity reason, at the carrier level. Hence, carrier belonging to different classes will be characterized by different code rates and/or different carrier baud rates. A terminal is then dynamically assigned to a carrier class according to its current link quality. This partitioning may greatly reduce the effectiveness of DRA as compared to full ACM (or even adaptive coding only) given the required resource partitioning. To cope with this problem a new DVB-RCS profile, different from the ATM or the MPEG one, is required. This new profile can be based on the Generic Stream Encapsulation (GSE) already being standardized for the DVB-S2 based forward link, but in order to exploit the GSE flexibility, a FEC code allowing much more granularity in the selection of the information bits in each codeword is required. An enhanced FEC with respect to the currently specified DVB-RCS turbo code is a novel turbo code scheme further described in the next paragraph 3.1.3, which shows, in addition to higher flexibility in the selection of the block length, also greater power efficiency as well as suitability for high order modulations.
3.1.3. The Turbo-Φ Code
DVB-RCS FEC specifications currently use either a concatenated code (i.e. a Reed Solomon code cascaded with a convolutional one) or a duobinary, 8-state turbo code. As a matter of fact, the turbo code option is now the one mostly used given its higher power efficiency. Seven possible code rates were defined (1/3, 2/5, 1/2, 2/3, 3/4, 4/5, 6/7) for this turbo code.
A problem with the currently specified turbo code is that it is only compatible with few block lengths comprised between a minimum length of 12 bytes and a maximum one of 216 bytes. This was justified, at the time specifications were drafted, by the fact that the system was conceived to operate with fixed size elementary packets (the 53 bytes ATM cells or 188 bytes MPEG packets). The use of such fixed length elementary packets requires that the turbo encoder must be fed with a reduced set of possible information block lengths and, as already discussed in previous paragraphs, this is a significant limitation when exploitation of ACM is wished. Therefore a new turbo code, nicknamed “Turbo-Φ”, was specifically designed for an ACM enhanced DVB-RCS in [13]. This new code presents both a higher power efficiency (obtained thanks to the doubling of number of states from 8 of the original DVB-RCS code to 16 and to further optimization of the interleaver) and a higher flexibility in the allowed block lengths which fully cover the present ACM requirements (information block lengths variable from 40 to 376 bytes with one byte granularity). This code is intended to offer near-Shannon performance on Gaussian channel, in most situations of block size, coding rate up to 8/9 and associated modulation. It supports QPSK, 8PSK and 16APSK modulations. In addition, the Turbo-Φ gives the natural possibility of using a high level of parallelism in the associated decoder.
Regarding the implementation issues, minimizing the turbo decoder complexity is of paramount importance especially when iterative interference cancellation techniques are employed, since such techniques may require a higher number of iterations with respect to the conventional FEC decoding. In order to reduce the turbo decoder complexity a simplified Max Log MAP algorithm can be used instead of the Log MAP algorithm [14]. In addition to hardware simplifications, the Max Log MAP algorithm has also the advantage of being SNR independent (while the Log MAP is very sensitive to errors in the estimated SNR). The performance penalization of the Max Log MAP algorithm is usually about 0.3 dB and can be reduced as low as 0.1 dB by suitable scaling the extrinsic probabilities computed by the decoder before reusing them for another decoding iteration [15]. Optimal scaling factors are
typically computed by extensive simulations. However, for the Turbo-Φ code an indication of the optimal scaling factors is already contained in the specification document [13]. No optimization of these scaling factors is thus needed. The Max Log MAP algorithm will be further discussed in paragraph 5.2.3.
All the possible AMPIST operative modes are summarized in Table 3.1: the generated I/Q symbols will be then padded with a variable length overhead (necessary for the time, frequency and phase recovery) so as to obtain only one possible fixed length burst for the already mentioned fixed TDMA bursts duration constraint.
Mode Payload information bits Rate Coded bits Modulation Waterfall Es/No [dB] I/Q symbols S1 312 1/3 936 QPSK 0 468 S2 488 1/2 976 QPSK 2 488 S3 656 2/3 984 QPSK 3.1 492 S4 736 3/4 982 QPSK 4.3 491 S5 848 5/6 1018 QPSK 4.9 509 S6 880 6/7 1028 QPSK 5.9 514 S7 928 2/3 1392 8PSK 6.8 464 S8 1040 3/4 1389 8PSK 8 463 S9 1152 5/6 1386 8PSK 9.9 462 S10 1192 6/7 1392 8PSK 10.8 464
3.2. CCI INTERFERENCE
As already discussed in Chapter 1, the CCI scenario envisages a multibeam system. In this scenario it is possible to increase the return link overall bandwidth by reusing the same frequency for every beam (or for a subset of beams jointly decoded by the same gateway, as depicted in Figure 3.2, where the same number beams have the same frequency).
Figure 3.2: Frequency reuse example for the CCI scenario.
In the AMPIST implementation, it will be supposed a cluster of four beams with the same frequency for the CCI case, as shown in Figure 3.3, where all the users Ui from different
beams interfere with each other at the transponder antennas:
3.3. HARDWARE IMPLEMENTATION
The AMPIST modulator hardware implementation, including the CCI generation, is shown in Figure 3.4. The demodulator block diagram will be introduced in Chapter 6.
TDMA Scheduler
GSE and PHY formatting Modulator 1 ACM Activity FIFO Normal FIFO Useful traffic TDMA Scheduler
GSE and PHY formatting
Modulator 2 ACM
TDMA Scheduler
GSE and PHY formatting
Modulator 3 ACM
TDMA Scheduler
GSE and PHY formatting Modulator 4 ACM 50 FIFOs 50 FIFOs 50 FIFOs 50 FIFOs WWW, FTP or VoIP applications G(t) Upconverter f0 Upconverter f0 Upconverter f0 Upconverter f0 Random binary
sequence Symbol shaping
g5(t)
Random binary
sequence Symbol shaping
g6(t) Upconverter f1 Upconverter f2 f0 f1 f2 Adjacent channels interference
Figure 3.4: AMPIST modulator block diagram.
The useful user and a maximum of 200 interference users are simulated: the number of interference users can be set as well as their characteristic (WWW, FTP or VoIP). These 201 data streams are generated by means of an application running on a PC that fills 201 different First In First Out memories (FIFO). Only the useful traffic FIFO memorizes the data packets, the other FIFOs (called “activity” FIFOs in the figure) just count the packet to be served for the interference users and these packets are then generated as random binary sequences. The TDMA scheduler is in charge of serving the appropriate FIFO with the information from the
forward link. Afterwards the four modulated signals are combined with the ( )G t matrix in order to simulate the CCI interference and the four obtained signals are upconverted on different outputs. The ( )G t matrix also takes into account four independent fading events for the users. The modulators are asynchronous at the symbol level, with different phases and only the first modulator (the one with the useful traffic) is dynamically ACM modulated, while the other three modulators can be varied manually. Two adjacent interference channels are also added, with independent fading. These channels do not need the complete ACM modulation, but only a band shaping at the symbol rate currently adopted. The AMPIST modulator main features are summarized in Table 3.2:
PARAMETER IMPLEMENTATION COMMENT
Signal roll-off 0.2 and 0.35
Supported baud rates 128 kbaud, 512 kbaud and 2 Mbaud For all the channels
Modulation formats and code rates
Modulations: QPSK, 8PSK Code rates: 1/2, 2/3, 3/4, 6/7
Only the first channel is ACM modulated, for the other three the modulation can be manually changed Turbo code information block
length Variable from 40 to 376 bytes
PHY Layer Access Technique TDMA Layer 2 encapsulation GSE protocol
Traffic simulator characteristics Bit stream for the applications: WWW, FTP, VoIP Maximum 50 users per channel
Co-channel interference Three carriers with independent fading events and asynchronous with respect to the useful bursts
Adjacent channel interference Two carriers with independent fading events Carrier spacing = 1.3 symbol rate
3.4. PHD DEVELOPED ACTIVITIES
Within the AMPIST project, the PhD developed activities can be divided into two consequent parts:
• The first one, that will be called single user, has the purpose to analyze by means of extensive software simulations the behaviour of the ACM methodology with some of the different operating modes reported in Table 3.1 and to propose a burst format compatible with the recovery algorithms for very low SNR signals and the CCI interference matrix estimation, necessary for the MUD algorithms.
• The second part, multiuser, where four single user channels are combined in order to simulate the CCI interference and a novel MUD interference cancellation scheme is adopted. Simulation results will be finally reported.
Therefore in the next Chapters, single user scenario will be presented first and then, exploiting the obtained guidelines, the most complex MUD scenario will be simulated.
4. SINGLE USER DECODING
This Chapter analyzes the ACM bursts decoding (for a single DVB-RCS user), with possible operative modes from S1 to S10 of Table 3.1. Actually, among the ten supported Turbo-Φ modes, only S2, S3, S4, S6, S7 have been implemented for the AMPIST project. This modes selection has been made in order to simplify the demodulator without losing its generality: the result is a 5 dB operative total span for Es/No with steps of about 1 dB, and the
8PSK adoption for the S7 mode.
The burst demodulator is critical because it is necessary to minimize the burst overhead while allowing an acceptable performance at very low SNIR signals. SNIR as low as 2 dB are expected for operation with QPSK 1/2 (the most hostile mode S2). Actually, operation at even lower SNIR is required when CCI interference is enabled, since SNIR below 0 dB may be expected before the interference cancellation is performed. Figure 4.1 shows the sequence of operations typically performed in a burst demodulator:
Figure 4.1: Typical burst demodulator.
The first block of joint coarse timing and frequency correction is implemented by correlation techniques exploiting a known pattern (that will be indicated as Unique Word, UW) in the burst. Correlation operation will recover the coarse burst timing with an accuracy related to the number of samples/symbol used in the analog to digital converter. All the presented simulations (both single user and multiuser) operate with 4 samples/symbol. Hence coarse timing recovery can have a maximum error of ±1/8 symbol (assuming no error in the detection process) and a fine timing correction is typically needed after the burst detection. The timing recovery will be studied in paragraph 4.1.1.
The correlation process used for burst detection can also provide some rough frequency error estimation if parallel frequency search is performed. The actual need for frequency correction will obviously depend on the expected frequency error of the input signal. Experience with DVB-RCS systems suggests that NCC based synchronization mechanisms are able to provide a good frequency reference at the ground terminals. In particular, frequency error at the gateway demodulator input is typically lower than 2 kHz. That means a normalized (to the symbol rate) maximum frequency error of about 1.6% at 128 kbaud and 0.1% at the highest AMPIST baud rate of 2048 kbaud. The analysis of frequency correction possible algorithms is presented in paragraph 4.1.2. Finally phase recovery algorithms are reported in paragraph 4.1.3. Note that it can be demonstrated the equality between the ratio Es/No (where Es is the symbols energy and No the noise spectrum power) and the received
SNR, therefore from now on the two terms will be used indifferently.
4.1. RECOVERY ALGORITHMS ANALYSIS
4.1.1. Timing Recovery
A coarse timing recovery is implicit in the burst detection operation. Coarse timing recovery (and burst detection) can be performed using either UW coherent correlation or UW coherent correlation with non coherent post-integration. This second option is interesting only when the UW is split in a “preamble” (i.e. know symbols sequence at the burst beginning) and a “postamble” (know symbols sequence at the burst end). Non coherent post- integration can then be used to combine the coherent integration on the preamble and the postamble.
Figure 4.2 shows the recovery uncertainty curves with UW coherent integration at Es/No = 0 dB for different preamble lengths, with a threshold detection. A preamble length of
40 symbols can be considered sufficient for the burst acquisition. Actually, given the small uncertainty of the start of burst (less than 16 symbols at the highest baud rate), we will not use a threshold based detection, but a more powerful Maximum Likelihood (ML) method (i.e. searching for the maximum correlation over the uncertainty region) that leads to slightly better results.
10-7 10-6 10-5 10-4 10-3 10-2 10-1 100 10-10 10-9 10-8 10-7 10-6 10-5 10-4 10-3 10-2
False alarm probability
M is s d e te ct io n p ro b a b ili ty UW coherent integration at E s/No = 0 dB UW length = 40 UW length = 30 UW length = 20
Figure 4.2: Miss detection and false alarm probability with UW coherent integration at Es/No = 0 dB.
It has to be noted that with a 40 symbols coherent integration, the expected maximum frequency error equal to 1.6% of the symbol rate would be destructive and therefore parallel frequency coarse recovery must also be performed (see paragraph 4.2.3).
Regarding the fine timing error recovery, the following approaches can be considered: • Dicotomic timing search (linear interpolation). For this algorithm, in addition to the
best correlation, the second best correlation is also considered. The optimal timing should be comprised between these two time indexes. The preamble is then interpolated to recover a sequence sampled midway the two best timing options. The correlation for this new sampling is then computed and the result compared with the previous best correlation. The procedure can be iterated two or three times in order to get a better timing error estimation.
• Spline interpolation. For this option, the correlation values around the optimal timing index are interpolated via a spline interpolation and the timing corresponding to the maximum of the spline is selected.
• Oerder & Meyr (O&M) algorithm. The O&M algorithm [39] can operate on the whole data burst. This algorithm generates a sequence with a clock component by computing the square norm of the burst symbols. The phase of the clock component is then extracted using a Discrete Fourier Transform (DFT) and used to estimate the fine timing error. Errors up to half the symbol duration can be recovered.
Simulation results have shown that the O&M is the best fine timing recovery methodology when only AWGN noise is present. After the fine timing error measurement, the stored burst samples are interpolated via a Farrow interpolator in order to recover the correct timing sequence. Only one sample per symbol needs to be computed.
4.1.2. Frequency Recovery
Frequency estimation error can be lower bounded by the well known Cramer-Rao bound. The Mengali & Morelli algorithm (M&M) [40] is able to achieve the Cramer-Rao bound when operating on known data (also called “pilots”) at the SNR of interest (greater than 0 dB, for reasonable preamble lengths, see Figure 4.3). The M&M algorithm usually operates on known pilot symbols, but it can process also modulated data, although it is not effective at low SNR, as shown in Figure 4.4.
-8 -6 -4 -2 0 2 4 10-4 10-3 10-2 10-1 100 Es/No [dB] N o rm a li z e d F re q u e n c y E rr o r S ta n d a rd D e v ia ti o n
M&M performance (Cramer-Rao bound dotted)
Pilot number = 180 Pilot number = 88 Pilot number = 44 Pilot number = 22 Pilot number = 12
Figure 4.3: M&M algorithm performance with pilot symbols.
2 3 4 5 6 7 8 9 10 10-6 10-5 10-4 10-3 10-2 Es/No [dB] N o rm a li z e d F re q u e n c y E rr o r S ta n d a rd D e v ia ti o n
M&M performance, modulated and unmodulated symbols
44 pilots 1712 QPSK symbols
The frequency error is normalized to the pilot symbols repetition frequency, so that the absolute frequency error can be decreased if the pilot symbols are not continuous. Operating on a continuous preamble is not sufficient to achieve a good frequency accuracy (for reasonable preamble lengths), hence a distributed know pilot sequence is a requirement for our system at least for the QPSK 1/2 mode or when interference mitigation is adopted (as the initial SNIR may be very low).
Using the M&M algorithm on pilot symbols, from Figure 4.3, at least 22 pilot symbols must be used in order to reach the Cramer-Rao bound at Es/No =0 dB. For the typical
AMPIST 490 symbols payload, the overhead which results using a 40 symbols UW plus 20 symbols distributed pilots is about 11%. With this assumption the spacing of pilot symbols would be 20 symbols. Hence, always looking at Figure 4.3, with Es/No =0 dB the resulting
frequency error standard deviation (normalized to the symbol rate) would be approximately
4
0.005 / 20 2.510= − .
4.1.3. Phase Recovery
Two options are available for the carrier phase recovery:
• Feedback phase recovery loop (on all the modulated symbols):
o Single forward loop. This technique employs an usual PLL to perform carrier phase synchronization.
o Iterated forward and backward loops. This technique employs a PLL iterated forward (from the start of the burst to the end) and backward (from the end of the burst to the start). At each iteration the gain of the loop is reduced.
• Feed-forward carrier phase estimation based on the averaging of the UW and pilot symbols over a predefined length sliding window. This technique requires known pilot symbols, distributed as evenly as possible over the whole burst length.
For the feedback approach, the residual frequency error still affecting the signal after the fine frequency correction imposes a lower limit on the loop bandwidth, or, at least, on its initial bandwidth. Therefore such a large bandwidth can be inadequate for a good phase tracking: in particular the cycle slipping probability may be too high. It can be shown that for SNR = 0 dB, the loop bandwidth requested for a QPSK with a modified Costas loop would
be too narrow for achieving an acceptable cycle slipping probability. An alternative is to perform multiple iteration of phase recovery via a PLL (forward and backward) reducing the loop bandwidth at each iteration. At each iteration (before the last), when reprocessing the UW a check is made about possible cycle slip events, so that the phase can be corrected.
A feed-forward phase recovery based on a sliding window for averaging the pilot phasors is more suitable for our applications because no cycle slipping can happen thanks to the use of pilots. The only problem is the estimation bias which results as a consequence of the frequency error. This bias can be a problem for the burst edge symbols because of the asymmetric pilot location with respect to those symbols. Other feed-forward approaches using also modulated symbols (like the Viterbi & Viterbi [38]) may be adequate for higher SNR but fails at low SNR, particularly if the residual frequency error is not insignificant.
4.2. BURST FORMATS AND ALGORITHMS ASSESSMENT
Burst synchronization at low SNR is challenging, especially for short burst. One of the major problem is represented by the frequency recovery that in these conditions can not efficiently compensate the whole frequency error. Therefore also the carrier phase recovery is problematical because it has to cope with a significant residual frequency error. In particular, classical approaches based on PLLs may fail due to the need of a large loop bandwidth (because of the short time available to converge) and to the resulting non negligible cycle-slipping probability. On the other hand, burst detection and fine timing recovery are generally less critical, although burst detection may also become an issue when very small preambles are considered due to the requirement of minimizing the burst overhead.
In this paragraph, different kinds of burst are analyzed, with UW added for the coarse frequency and timing recovery and pilot symbols added for the fine frequency recovery and phase tracking. A preliminary assessment, separating the two cases of fine timing recovery and fine frequency recovery, will be presented, while the phase recovery algorithms will be tested in the complete receiver simulations reported in paragraph 4.3. Finally, in paragraph 4.4, the burst that best fulfils our requirements will be selected for the multiuser scenario of Chapter 7.
4.2.1. Burst Formats
Four different burst formats have been considered for the synchronization performance analysis and will be described.
• Burst A
The simplest burst, called A, is shown in Figure 4.5. It is composed of a preamble UW and a single payload symbols section. Guard symbols are equally inserted before the preamble and after the payload section. The burst A has been used only for preliminary testing purpose, without any frequency and phase errors, and will not be adopted in the real case.
Figure 4.5: Burst format A.
• Burst B
The burst format B is reported in Figure 4.6. It is composed of a preamble and several payload symbols sections divided by pilot symbols blocks. Guard symbols are equally inserted before the preamble and after the last payload symbols section. The pilot symbols blocks are evenly spaced and each one is composed by a fixed number of pilot symbols. All the payload symbols sections have the same length except for the last section that can be shorter than the other ones.
Figure 4.6: Burst format B.
The burst format B has been designed with the aim to exploit the pilot symbols blocks for the fine frequency estimation procedure. Pilots may also be used for carrier phase recovery, if a feed-forward strategy is selected.
• Burst C
The burst format C is depicted in Figure 4.7. It is composed of a preamble, a postamble and several payload symbols sections with pilot symbols blocks inserted among the payload sections. Guard symbols are equally inserted before the preamble and after the postamble. The pilot symbols blocks are evenly spaced and each one is composed by a fixed number of pilot symbols. All the payload symbols sections have the same length except for the last section that can be shorter than the other ones.
Figure 4.7: Burst format C.
The burst format C has been designed with the aim to exploit the pilot symbols blocks for the fine frequency estimation procedure (like the burst format B) and to employ the preamble and postamble for obtaining a good phase tracking performance at the edge of the burst when the feed-forward carrier phase estimation using the sliding window technique is selected.
• Burst D
The burst format D is shown in Figure 4.8. It is composed of a “middleamble” (UW inserted in the burst middle), several payload symbols sections with pilot symbols blocks inserted among the payload sections and two “edge” symbols blocks respectively inserted before the first payload section and after the last payload section. Guard symbols are equally inserted before the first edge symbols block and after the last edge symbols block. The distance, in symbols, between the first pilot symbols block and the others ones is multiple of a fixed value and each pilot symbol block is composed by a fixed number of pilot symbols.
All the payload sections delimited by the pilot blocks have the same length except for the payload sections adjacent to the middleamble or to the edge symbols blocks. The edge symbols blocks are composed by a fixed number of known symbols.
Figure 4.8:Burst format D.
The burst format D has been designed with the aim to:
o Maximize the number of known symbols that can be used for the channel estimation in case of asynchronous bursts (with respect to the burst format C). In fact the use of a compact middleamble, instead of the pair preamble/postamble, increases the number of overlapping known symbols (see paragraph 6.2).
o Exploit the pilot symbols blocks for the fine frequency estimation procedure.
o Employ the edge symbols blocks for obtaining a good phase tracking performance at the burst edges with the sliding window technique.
4.2.2. Timing Recovery Assessment
The coarse timing recovery is performed on burst formats A, B and D using the coherent correlation with the UW. Instead, for burst format C, the coarse timing recovery employs a separate coherent correlation on the preamble and on the postamble with a non-coherent post integration of the two measurements. Note that a ML burst detection strategy is selected instead of a threshold based one, i.e. the maximum of the correlation process over the guard time uncertainty is declared as the coarse start of burst.
A preliminary analysis revealed that O&M algorithm significantly outperforms the other considered techniques and therefore it has been selected for being used in the simulation campaign. The performance of the O&M is shown in Figure 4.9 for burst formats A, B, C and D considering a 41 symbols length UW and SNR = 2 dB. The optimal sampling instant is equal to 8 and the resulting timing error standard deviation is about σT =0.085 samples. Note that 4 samples/symbols are assumed in all our simulations, therefore the standard deviation expressed in symbol is σT =0.021 symbols.
7 7.2 7.4 7.6 7.8 8 8.2 8.4 8.6 8.8 9 10-5 10-4 10-3 10-2 sample p ro b a b ili ty 41 symbols UW
Figure 4.9: O&M fine timing recovery performance, using 41 UW symbols and 488 symbols burst, SNR = 2 dB.
As the O&M timing recovery algorithm uses all the burst symbols, the performance is independent on the burst format and only depends on the number of symbols in the burst. The total number of burst symbols used for O&M timing error estimation was 488 plus UW and pilot symbols. The shown simulation results also consider the effects of the coarse timing estimation done on the UW only. Errors produced by the coarse timing recovery never exceeded half the symbol period (i.e. two samples), hence O&M was able to recover without ambiguity the correct timing.
4.2.3. Frequency Recovery Assessment
Coarse frequency recovery is performed jointly with the coarse timing recovery, employing a bank of correlators tuned on different frequencies. Coarse frequency recovery is performed by selecting the frequency error that results in the highest UW correlation value. For the fine frequency recovery, different techniques have been considered:
• DFT computation on pilot symbols and, optionally, on UW symbols. This technique can be used on all the burst formats.
• M&M algorithm operating on the known symbols. This technique can be used on the burst formats B, C and D exploiting the pilot symbols sequence and the subset of UW symbols that are evenly spaced with the pilot symbol sequence. Also for the minimum
SNIR values of interest this technique can effectively replace the DFT technique that is more complex to implement.
Figure 4.10 illustrates the fine frequency recovery performance using the DFT with SNR = 2 dB for burst format B, burst length of 488 symbols, 41 UW symbols and 41 pilot symbols. The residual coarse frequency error is 2% of the symbol rate (more than the maximum possible for the AMPIST scenario) and the resulting frequency error standard deviation (normalized to the symbol rate) measured after the DFT correction is about
norm 10 4 F σ = − . -6 -4 -2 0 2 4 6 10-7 10-6 10-5 10-4 10-3 10-2 10-1 100
residual frequency error
p ro b a b ili ty
41 symbols UW + 41 pilot symbols
Figure 4.10: Frequency recovery performance with 41 UW symbols and 41 pilot symbols, coarse frequency error
2%, employing the DFT on burst B.
Figure 4.11 shows the frequency recovery performance using the DFT with SNR = 2 dB for burst format C, burst length of 488 symbols, 20 symbols preamble, 20 symbols postamble and 41 pilot symbols. The performance is practically the same as the previous case with burst B.
-6 -4 -2 0 2 4 6 x 10⁻⁴ 10-7 10-6 10-5 10-4 10-3 10-2 10-1 100
residual frequency error
p ro b a b ili ty
20 preamble and postamble + 41 pilot symbols
Figure 4.11: Frequency recovery performance with 20 symbols preamble and postamble, 41 pilot symbols,
coarse frequency error 2%, employing the DFT on burst C.
Figure 4.12 illustrates the performance of the frequency recovery using the M&M algorithm with SNR = 2 dB for burst format D, burst length of 488 symbols, 41 UW symbols preamble, 40 pilot symbols. Also in this case the result is norm 10 4
F σ = − . -8 -6 -4 -2 0 2 4 6 8 x 10⁻⁴ 10-4 10-3 10-2
41 Symbols UW + 40 pilot symbols
residual frequency error
p ro b a b ili ty
Figure 4.12: Frequency recovery performance with 41 UW symbols and 40 pilot symbols, coarse frequency error
For the same overhead, the M&M algorithm achieved basically the same performance as the DFT-based approach. Given its lower complexity, the M&M is the obvious choice for the modem fine frequency recovery with burst format B, C or D.
4.3. SINGLE USER DECODING RESULTS
Extensive software simulations in a C++ environment have been run so as to evaluate the performance of the joint selected timing, frequency and phase synchronization solutions. All the simulations assumptions have been chosen in order to obtain conservative results. The lowest supported symbol rate, i.e. 128 kbaud, has been considered in the simulations because it represents the worst case for the impairment due to the received frequency errors and phase noise. The modulation is the most hostile QPSK 1/2 (S2 mode), with burst payload size equal to 488 symbols. The system operates at SNR = 2 dB, that is the most critical situation expected in a real operational scenario. The following characteristics were implemented:
• Maximum frequency error equal to 2.5 kHz, about 2% of the symbol rate. • Phase noise mask as specified in the DVB-RCS standard, reported in Table 4.1. • Shaping filter roll-off 0.35.
• Channel model linear, i.e. no distortion is introduced on the transmission side.
Table 4.1: DVB-RCS phase noise mask.
Frequency DVB-RCS Phase Noise Mask [dBc/Hz]
10 Hz -16 100 Hz -54 1 kHz -64 10 kHz -74 100 kHz -89 1 MHz -106 10 MHz (floor) -116
Three different scenarios, each one employing a different burst format, will be studied in the next paragraphs and finally the best burst format for our applications will be selected.
4.3.1. Scenario 1
The scenario 1 employs the burst format B with 41 symbols of UW and 40 pilot blocks, composed by only one pilot symbol each. The resulting pilot symbols block period is 12 symbols. The receiver processing chain for this scenario is shown in Figure 4.13.
Figure 4.13: Single user scenario 1, receiving processing chain.
The joint coarse timing and frequency recovery is performed employing a multi-frequency coherent UW correlation. The O&M algorithm is used for the fine timing correction. The fine frequency correction is performed using the DFT method on the pilot sequence only. For the phase correction the iterated forward-backward loop is implemented with 16 iterations for a second order PLL. The performance is summarized with the BER and Frame Error Rate (FER) curves, reported in Figure 4.14 and the implementation loss for FER 10= −6 is chosen
1.E-08 1.E-07 1.E-06 1.E-05 1.E-04 1.E-03 1.E-02 1.E-01 1.E+00 1.30 1.40 1.50 1.60 1.70 1.80 1.90 2.00 2.10 2.20 2.30 2.40 2.50 2.60 2.70 2.80 2.90 3.00 Es/No B E R /F E R
Ref erence BER Ref erence FER Scenario 1 - BER Scenario 1 - FER
Figure 4.14: Single user, scenario 1 results.
The implementation loss at FER 10= −6 is about 0.35 dB. It is worth noting that the BER
and FER curves seem to deviate from the reference curves and to exhibit a floor starting from Es/No = 2.5 dB. This is probably due to the cycle slips introduced by the iterated PLL loop.
However, for the sake of simplicity, simulations were done without the cycle slipping detection feature and, exploiting the UW knowledge, cycle slipping happened during the initial iterations (where cycle slipping is more likely given the larger loop bandwidth) could have been recovered.
4.3.2. Scenario 2
The scenario 2 employs the burst format C with 20 symbols of preamble, 20 symbols of postamble and 40 pilot blocks, composed by only one pilot symbol each. The resulting pilot symbols block period is 12 symbols. The receiver processing chain for this scenario is shown in Figure 4.15:
Figure 4.15: Single user scenario 2, receiving processing chain.
The joint coarse timing and frequency recovery is performed employing a multi-frequency coherent UW correlation plus a non coherent post-integration. The O&M algorithm is used for fine timing correction. The fine frequency correction is performed using the DFT method on the pilot sequence only. For the phase correction, the feed-forward sliding window technique is used. The window size is 229 symbols and then it includes 20 pilot blocks. No weighting of the pilot symbols in the window is done (i.e. a rectangular window shape is used). From the BER/FER curve, reported in Figure 4.16, the implementation loss at FER 10= −6 is
about 0.35 dB. In this case the BER and FER curves do not show any floor.
1.E-08 1.E-07 1.E-06 1.E-05 1.E-04 1.E-03 1.E-02 1.E-01 1.E+00 1.30 1.40 1.50 1.60 1.70 1.80 1.90 2.00 2.10 2.20 2.30 2.40 2.50 2.60 2.70 2.80 2.90 3.00 Es/No B E R /F E R Reference BER Reference FER Scenario 2 - BER Scenario 2 - FER
4.3.3. Scenario 3
The scenario 3 employs the burst format D with 41 symbols of middleamble, 38 pilot blocks, composed by only one pilot symbol each, and 2 edge blocks. The resulting pilot symbols block period is 12 symbols. The receiver processing chain for this scenario is shown in Figure 4.17:
Figure 4.17: Single user scenario 3, receiving processing chain.
The joint coarse timing and frequency recovery is performed employing a multi-frequency coherent UW correlation. The O&M algorithm is used for the fine timing correction. The fine frequency correction is performed using the M&M algorithm on the pilot symbols and on the UW symbols that are evenly spaced with the pilot symbol sequence. For the phase correction the sliding window technique is employed. The window size is 229 symbols, that covers a span of 20 pilot symbol blocks, and the window shape is rectangular.
Figure 4.18 shows the simulation results: it appears that the modem loss at FER 10= −6
can be limited to about 0.5 dB. The label numbers for the various curves represent the number of pilot fields (each one containing one symbol), the number of edge symbols and the phase recovery sliding window size respectively. Note that the sliding window performance is better for burst C with respect to burst D, due to the presence of preamble and postamble that helps the phase recovery at the burst edges. To achieve results comparable with the ones obtained for burst C using the sliding window phase recovery method, a significant number of edge symbols is required.
Figure 4.18:Single user, scenario 3 results.
4.4. CONCLUSIONS
In this Chapter an exhaustive analysis of applicable recovery methodologies has been carried out with simulations of the most hostile AMPIST mode S2 (QPSK 1/2). Acceptable performance is obtained with an 80 symbols overhead for 488 symbols payload (14% overhead). For modes operating at higher SNR, it could be possible to reduce the overhead removing the pilot symbols and employing simpler algorithms, but, since the number of total burst symbols must be the same for all the modes, overhead symbols will be inserted anyway. Therefore the same recovery algorithms are employed for all the modes, with reduced loss with respect to the QPSK 1/2 case. The next Figure 4.19 shows the amount of overhead for the AMPIST operative modes:
1.E-08 1.E-07 1.E-06 1.E-05 1.E-04 1.E-03 1.E-02 1.E-01 1.E+00 1.30 1.40 1.50 1.60 1.70 1.80 1.90 2.00 2.10 2.20 2.30 2.40 2.50 2.60 2.70 2.80 2.90 3.00 Es/No B E R /F E
R Ref erence BER
Ref erence FER 28-14-261 BER 28-14-261 FER 28-14-349 BER 28-14-349 FER 32-10-229 BER 32-10-229 FER 32-10-305 BER 32-10-305 FER 24-18-305 BER 24-18-305 FER
Figure 4.19: Proposed overhead for the AMPIST operative modes.
The burst format C will be adopted, since it has been demonstrated its ability to track the carrier phase on the burst edges. The M&M algorithm will be used for the fine frequency recovery as it has basically the same performance as the more complex DFT-based approach. The sliding window technique is selected for the phase recovery, because the iterative PLL solution would be too complex and would lead to the same performance (although it may allow the reduction of the distributed pilots). Table 4.2 summarizes the obtained guidelines:
ISSUE SELECTION
Burst format Burst C
Joint coarse timing and coarse frequency recovery
UW multi-frequency coherent correlation with non coherent post- integration
Fine frequency recovery M&M algorithm on pilot symbols Fine timing recovery O&M algorithm on all the symbols Phase recovery Sliding window (229 symbols) Preamble length 20 symbols
Postamble length 20 symbols Pilots number 40 symbols
Guard symbols number 2 symbols at the burst beginning 2 symbols at the burst end
5. TURBO CODES
Berrou, Glavieux and Thitimajshima [20] introduced in 1993 a revolutionary error-control coding technique, which they called turbo coding. This coding technique consists essentially of a parallel concatenation of two binary convolutional codes, decoded by an iterative decoding algorithm that makes the resulting BER performance be close to the Shannon limit.
5.1. TURBO ENCODING
In the turbo encoder structure, two recursive convolutional systematic encoders are arranged in parallel concatenation, so that each input element is encoded twice, but the input to the second encoder passes first through a random interleaver, designed to make the encoder output sequences statically independent from each other. Systematic encoders have the property of repeating the first uncoded bit as the first coded bit in output. The systematic encoders adopted in the turbo encoding have usually code rate 1/2. As a result of the systematic form of the coding scheme and the double encoding of each input bit, the resulting code rate should be 1/3. In order to control the rate, the puncturing of the encoder outputs is usually included.
Figure 5.1: Turbo encoder scheme.